Article

Influence of Al Additions on the Microstructure and Mechanical Properties of a C and Si-Free High-Mn Steel

1
Graduate Program in Materials Science and Engineering (PPGCEM), Federal University of Sao Carlos (UFSCar), Rodovia Washington Luís, km 235, São Carlos 13565-905, SP, Brazil
2
Department of Materials Engineering (DEMa), Federal University of Sao Carlos (UFSCar), Rodovia Washington Luís, km 235, São Carlos 13565-905, SP, Brazil
*
Author to whom correspondence should be addressed.
Metals 2020, 10(3), 352; https://doi.org/10.3390/met10030352
Submission received: 28 January 2020 / Revised: 28 February 2020 / Accepted: 6 March 2020 / Published: 8 March 2020

Abstract

:
The lightweight Fe–Mn–Al–C steels have drawn considerable attention from the literature due to their outstanding combination of high ductility and specific strength. Although the mechanical behavior of such steels has been extensively studied, the effect of Al when no C and Si are added has not been investigated in detail. For this reason, the main objective of this work was to study the microstructural evolution and mechanical behavior of carbon and silicon-free high-Mn steels with different aluminum contents. Alloys with 0, 2.5, and 5 wt. % Al were processed by spray forming to ensure high homogeneity and a fully austenitic microstructure. Cold rolling and annealing were performed to obtain a fine grain-sized material. The mechanical properties were similar regardless of the Al content, especially the work hardening rate. Deformation twinning and strain-induced phase transformation were not observed for any of the compositions. Additionally, a dislocation cell-like structure was observed for all of the alloys indicating that the Al additions did not change considerably the dislocation behavior, even though it considerably changed the estimated Stacking Fault Energy (SFE) value for all the alloys studied in this work.

1. Introduction

High-Mn steels can be classified as Advanced High-Strength Steels (AHSS) and their development has been focused on understanding the exceptional mechanical properties, especially the ductility that can be achieved for such alloys [1,2]. The presence of plasticity-induced mechanisms has been described as one of the main contributions; however, the outstanding combination of high ductility and strength also arise because of the high capacity of the material to store dislocations in the microstructure [3]. High-Mn steels are usually fully austenitic due to the Mn and C additions; however, Al can be added to reduce the density, and a duplex microstructure might be present [4]. An important plasticity-induced mechanism for the face-centered cubic (FCC) high-Mn steels is the TWIP (Twinning-Induced Plasticity) effect, which arises from the relatively higher Stacking Fault Energy (SFE) compared to medium- and low-Mn steels [5].
The key factors that influence the occurrence of the TWIP effect and consequently the mechanical properties of high-Mn steels are the grain size, the texture and the Stacking Fault Energy (SFE). Large grains tend to favor the plasticity-induced mechanisms, while the resolved shear stress on the twinning system affects whether twinning will occur at a given applied stress depending on the grain orientation. The overall deformation mechanisms during plastic deformation are governed by the SFE value and it has a direct effect on the plasticity-induced mechanisms. Low SFE values (typically less than 20 mJ/m²) favor the occurrence of the TRIP (Transformation-Induced Plasticity) effect [6]; intermediary SFE values (typically between 20 and 45 mJ/m²) tend to favor the TWIP effect [7] and higher values tend to favor the occurrence of the MBIP (Microband-Induced Plasticity) effect [8]. Due to its simplicity, the method used most often to estimate the SFE is from thermodynamic calculation [9,10,11]. The main idea behind this method is to consider that a stacking fault in an FCC crystal is one hexagonal close packing (HCP) region. Olson and Cohen [12] developed one model which is based on the classical nucleation theory, in which it is possible to estimate the SFE as 2ρ(ΔGγ->ε) + 2σγ->ε. The ρ is the atomic density of the {111} planes and ΔGγ->ε is divided into the chemical and the magnetic contributions of the Gibbs free energy for the face centered cubic (FCC) austenite (γ) to the hexagonal close packed (HCP) martensite (ε). The σγ->ε parameter is the interfacial energy per area between the two phases (HCP and FCC). There are several models available in the literature, which describe equations to obtain the values [8,10,11]. In addition to the SFE predictions, models have also been proposed to determine the critical resolved shear stress (CRSS) for the TRIP and the TWIP effects [13].
The Al addition has been proposed to decrease the density and consequently increase the specific strength of the alloy [14]. It is common to refer to the Fe–Mn–Al–C system as “lightweight steels” due to their lower density compared to conventional steels. However, the aluminum directly affects the stability of the phases presented in the alloy and, when in high amounts, the ferrite becomes present in the microstructure. The Al is also related to the occurrence of short-range ordering (SRO), leading to an additional barrier to the movement of the dislocations [15]. Furthermore, Al addition is known to increase the SFE, which alters the deformation mechanisms, increasing the onset for the TRIP and the TWIP effects.
Typically, this class of alloys presents C as one of the main alloying elements since it is a potent austenite stabilizer. Besides this, it might lead to carbide precipitation, it increases the yield strength due to solid solution hardening, and it also might induce the Portevin–Le Chatelier effect [16]. Even though C is one of the main alloying element for steels, its presence on lightweight steels might induce some misinterpretation regarding its effects on the SFE value and on solid solution hardening [13].
Fe–Mn–Al–C is considered the main lightweight steel system [17] and the effect of each alloying element is vastly described in the literature [5,9,15]. However, there are few studies on the effect of Al additions in alloys with low interstitial contents, mainly C, in fully austenitic base materials. For this reason, the objective of this work is to study the overall effect of Al on the microstructure and mechanical behavior of high-Mn fully austenitic alloys. In order to obtain a highly homogeneous structure, the alloys were processed by spray forming followed by cold rolling and annealing. The absence of C decreases the stability of the austenite and for this reason a high-Mn steel was chosen.

2. Materials and Methods

Three different alloys were produced from commercially pure metals by spray forming and the final chemical composition is presented in Table 1. The processing parameters were kept the same for all the alloys and are presented on Table 2. The spray forming was chosen to obtain a highly homogeneous and texture-free material in the as deposited state [18]. Even though the final microstructure is homogeneous, cold rolling followed by annealing was used to refine and normalize the grain size of all the deposits and to obtain a comparable microstructure for all the systems.
The CALPHAD method (Thermo-Calc® software with the TCFE7 database) (Thermo-Calc Software, Solna, Sweden) was used to calculate the stable phases for the different alloys of this work. The objective was to obtain a fully austenitic microstructure at high temperatures in order to observe the effect of Al in solid solution without precipitation of second phases. Additionally, the phase evolution in equilibrium was obtained, and it was possible to predict the stable phases after the spray forming processing. The SFE was determined by thermodynamic calculation as described in Appendix A. The equations used to predict the SFE in this work were chosen after Pierce et al. [19], in which experimental SFE values were compared to the thermodynamic modeling of steels with up to 28 wt. % of manganese. Additionally, the experimental SFE value of the 0Al alloy was measured in a recrystallized sample with a subsequent small cold rolling step that resulted in a total thickness reduction of less than 1%; this step was performed to induce a small amount of dislocations on the material. The distance between the Shockley partials were obtained for four different dislocations with different characters and the separation was measured in ten points through their length. The weak beam dark field transmission electron microscopy (WBDF–TEM) in a g(4 g) condition was performed in order to obtain the images as described in [19,20]; this condition was used in order to obtain a higher excitation error and, consequently, decrease the observed dislocation thickness. Care was taken to choose only dislocations that were at least 200 nm apart from other dislocations in order to avoid dislocation interactions affecting the partials separation. Equation (1) was used to correlate the SFE value ( γ ) with the Shockley partials distance ( d a c t u a l ). The μ e f f and ν e f f are the effective shear modulus and Poisson’s ratio, respectively, both determined by the torsional resonant frequencies and the iterative method described in [21]; b p is the partial dislocation Burgers vector determined from the lattice parameter, and β is the total dislocation character angle.
γ = μ e f f b p 2 8 π d a c t u a l 2 ν e f f 1 ν e f f ( 1 2 ν e f f cos ( 2 β ) 2 ν e f f )
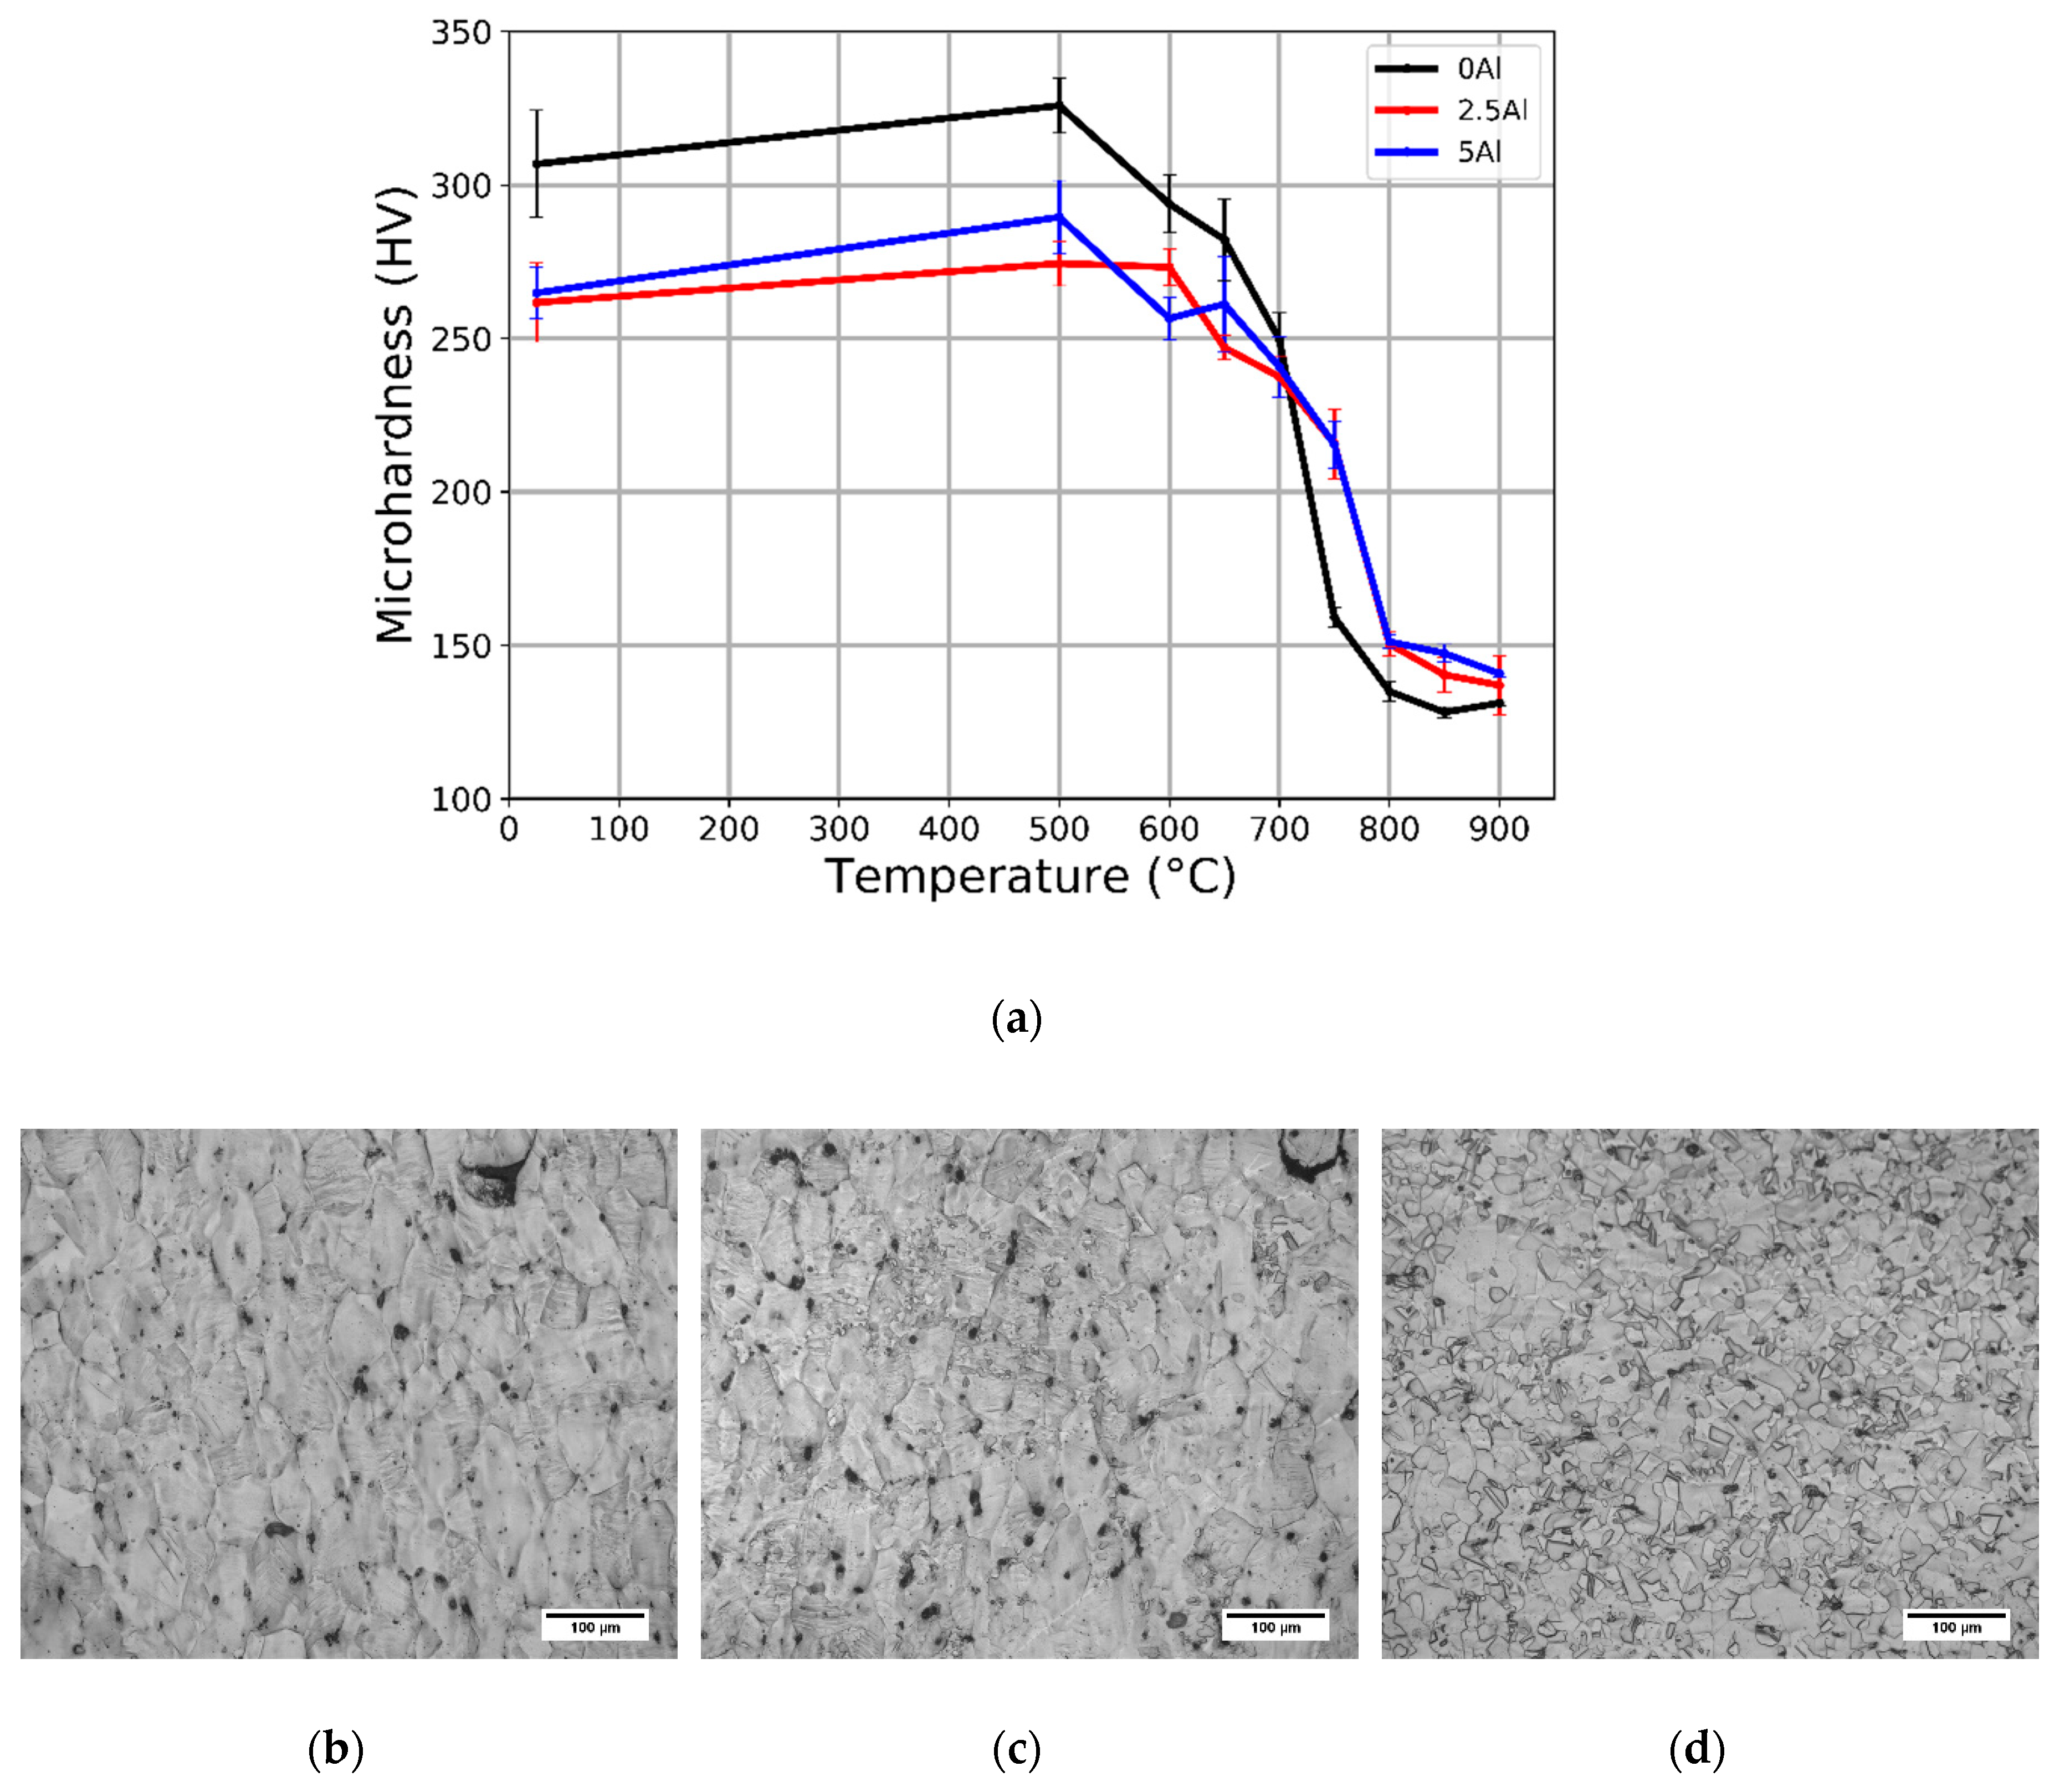
Cold rolling with 50% thickness reduction followed by annealing was performed in order to control the grain size. The annealing temperature and time were chosen through the evaluation of the recrystallization behavior of all the systems. For that, microhardness tests were performed on heat-treated samples from 500 °C to 900 °C (for 50 °C intervals) for 10 min. The heat treatment for the tensile tests was performed at 850 °C as will be detailed in the Results section. The final grain size was measured by the linear intercept method (ASTM E112–13). The tensile tests were performed at room temperature on the heat-treated samples according to ASTM E8/E8M–16 using an Instron Universal testing machine, model 5500R with strain rate of 10−3 s−1.
The microstructures were characterized by Scanning Electron Microscopy (SEM) on a Phillips XL-30 FEG (FEI, Hillsboro, OR, USA) coupled with energy dispersive X-ray spectroscopy (EDX). Electron Backscatter Diffraction (EBSD) analysis was performed on a FEI Inspect S50 SEM microscope (FEI, Hillsboro, OR, USA) equipped with an EDAX system. The SEM samples were prepared using conventional metallographic procedure (mounting, grinding, and polishing) and etched with Nital 2%. EBSD samples were prepared by mounting and grinding, with a final polishing using a vibratory system, Vibromet 2 (Buehler, Lake Bluff, IL, USA). Transmission Electron Microscopy (TEM) was performed in order to observe the Shockley partials separation and the dislocation structure after the fracture of the material using a Tecnai G2 F20 (FEI, Hillsboro, OR, USA) (TEM/STEM) operating at 200 kV and equipped with a field emission gun (FEG). The TEM foils were prepared by grinding the base material to 80 µm-thick pieces and the final thinning was made by a Precision Ion Polishing System (PIPS) operating at 5 keV.

3. Results and Discussion

3.1. Stacking Fault Energy (SFE)

Following the procedure shown in Appendix A, the values for the SFE were calculated varying the Mn and the Al content for Fe–Mn–Al ternary alloys at room temperature. Figure 1 presents the SFE calculations coupled with the calculated phase diagram at 973 K (700 °C). The latter was performed to provide additional information regarding the equilibrium stable phases by varying the Mn and Al content. The analysis of the SFE together with the phase diagram is essential because for low Mn and higher Al content, it is not possible to obtain a fully austenitic microstructure, even with an intercritical heat treatment. For this reason, it is important to observe that the calculated SFE value would not make sense in the region for which it is not possible to obtain a single-phase FCC microstructure. It must be emphasized that the SFE was calculated at Room Temperature (RT) in order to predict the mechanical behavior at this temperature. The phase diagram that is presented, together with the SFE map, was calculated for a different temperature, 973 K (700 °C), since it is possible to obtain a fully austenitic structure (metastable) at room temperature by heat treatment at that temperature, followed by water quenching. The SFE value for this alloy can then be predicted at room temperature from the provided colormap. The final SFE estimated values were 31, 45, and 57 mJ/m² for the 0Al, 2.5Al, and 5Al alloys, respectively (this result is shown in Figure 1 by the white triangles). Despite its low amount, it must be mentioned that the residual C content picked up from the feedstock and during processing was considered in the SFE calculation for the alloys.
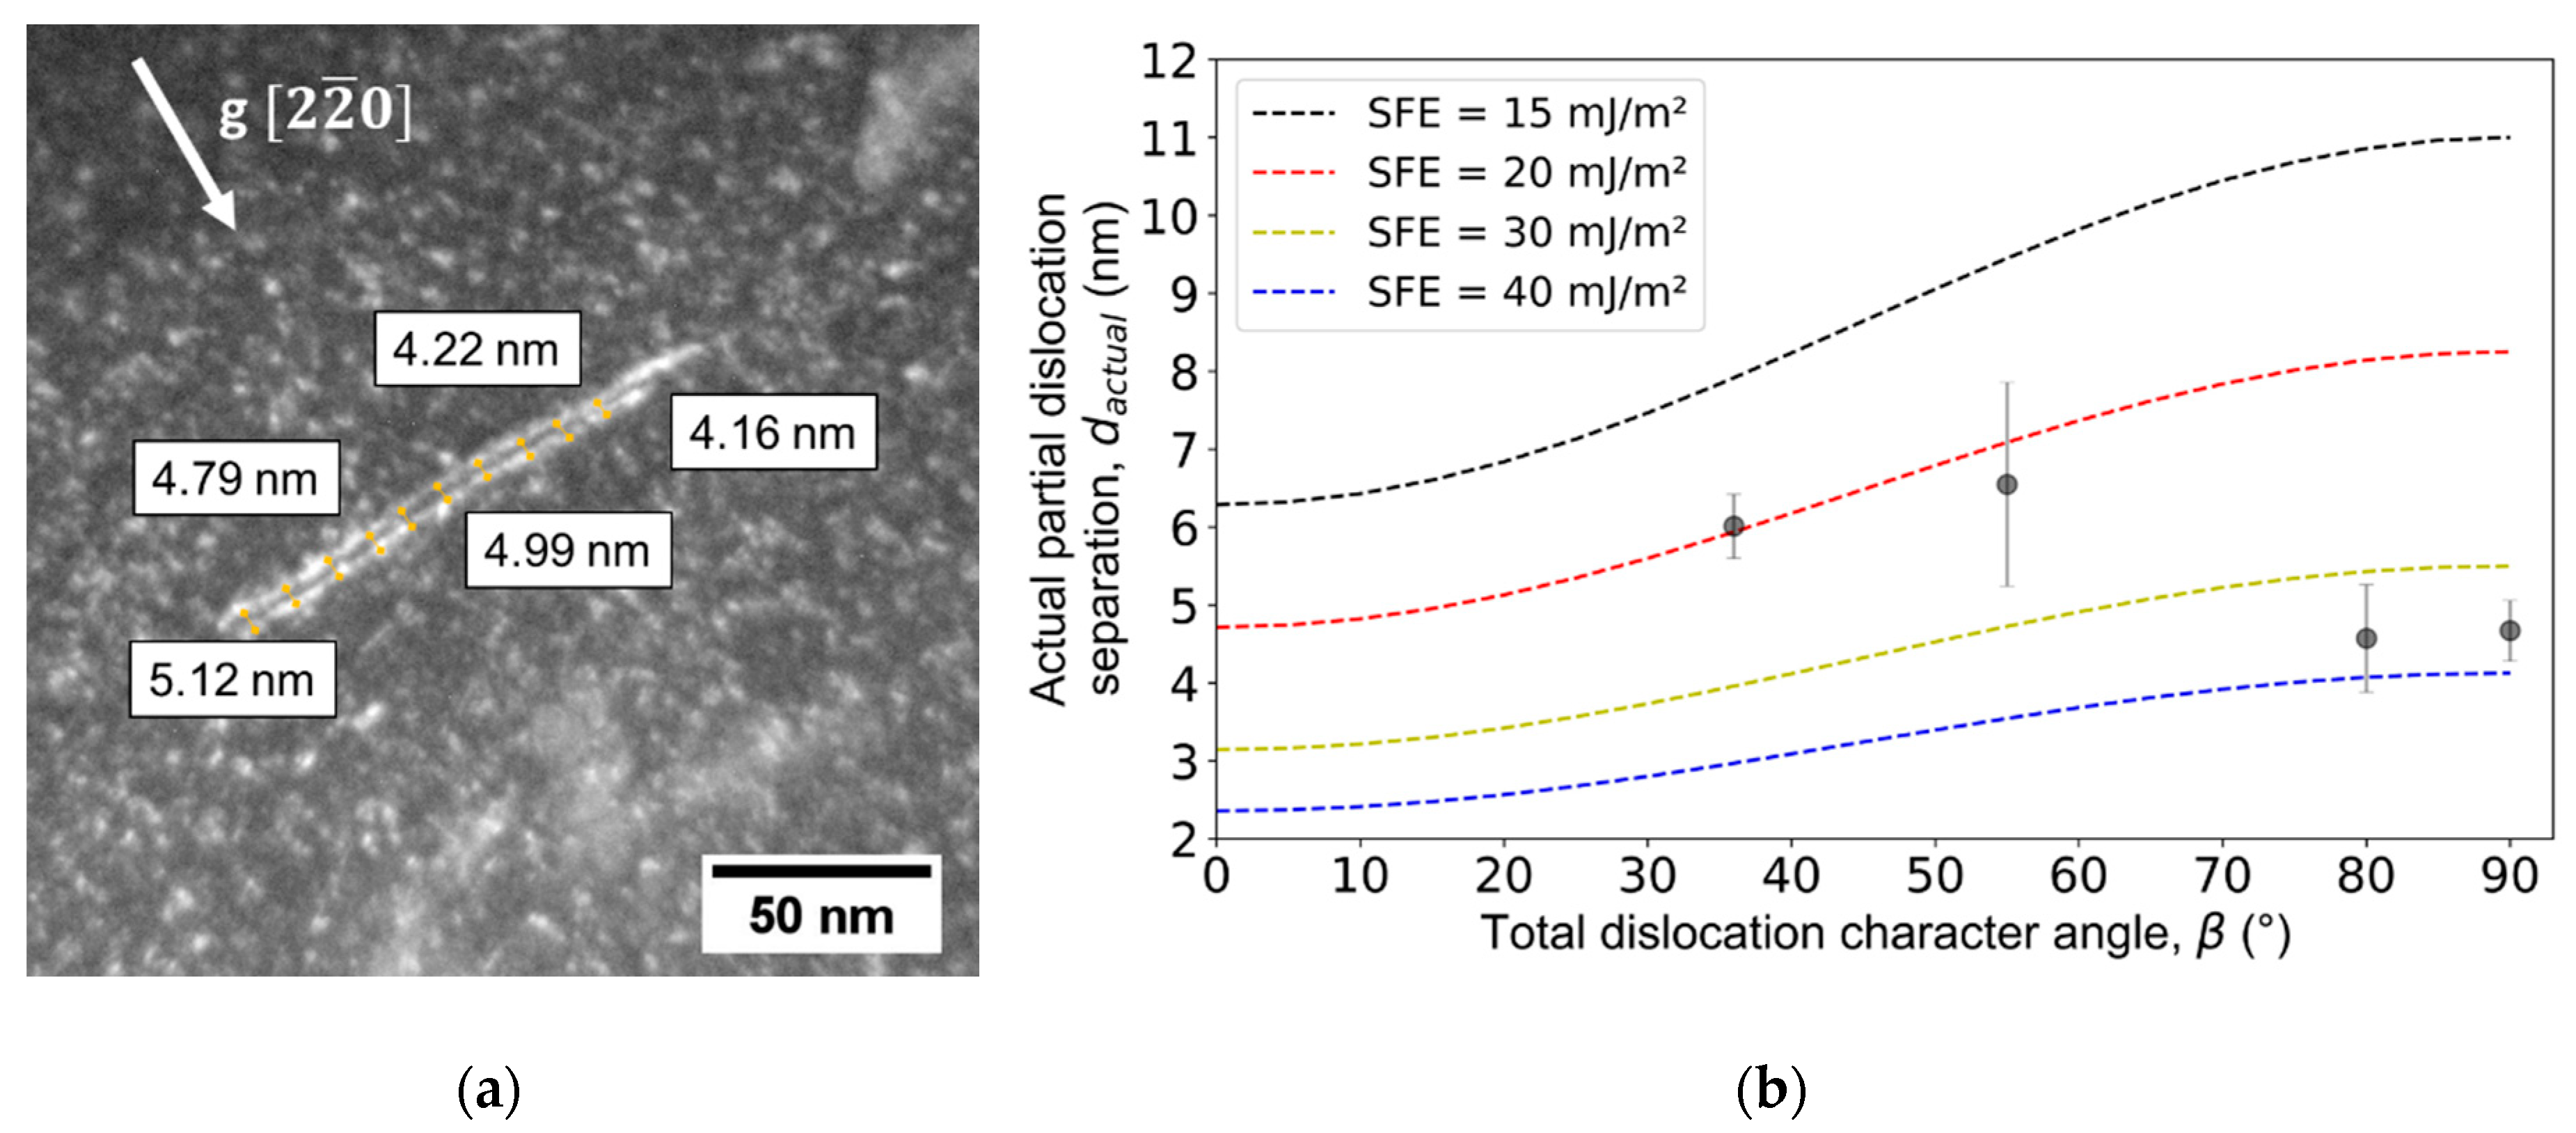
In order to verify the accuracy of the calculated SFE values, the distance between the Shockley partials was determined for the 0Al system (which had a calculated SFE of 31 mJ/m²). Figure 2a illustrates one example of the WBDF image used to determine the distance between the dissociated dislocations in a recrystallized sample with a low level of deformation. The values used in Equation (1) were 64.66 GPa, 0.24, and 0.147 nm, for the effective shear modulus, the effective Poisson’s ratio, and the partial dislocation Burgers vector, respectively. The Shockley partials separation was measured in four different dislocations with distinct characters. Figure 2b illustrates the points with its error bars for the 0Al alloy and the dashed lines represent the best fit for the behavior of different SFE materials regarding its partial dislocation separation and the dislocation character angle. The final SFE obtained value for the 0Al alloy was 28 ± 9 mJ/m², which agrees with the thermodynamic prediction value of 31 mJ/m² for this material. Therefore, it was assumed that the thermodynamic modeling present in this work offers a reliable value for all the alloys.

3.2. Microstructural Evolution

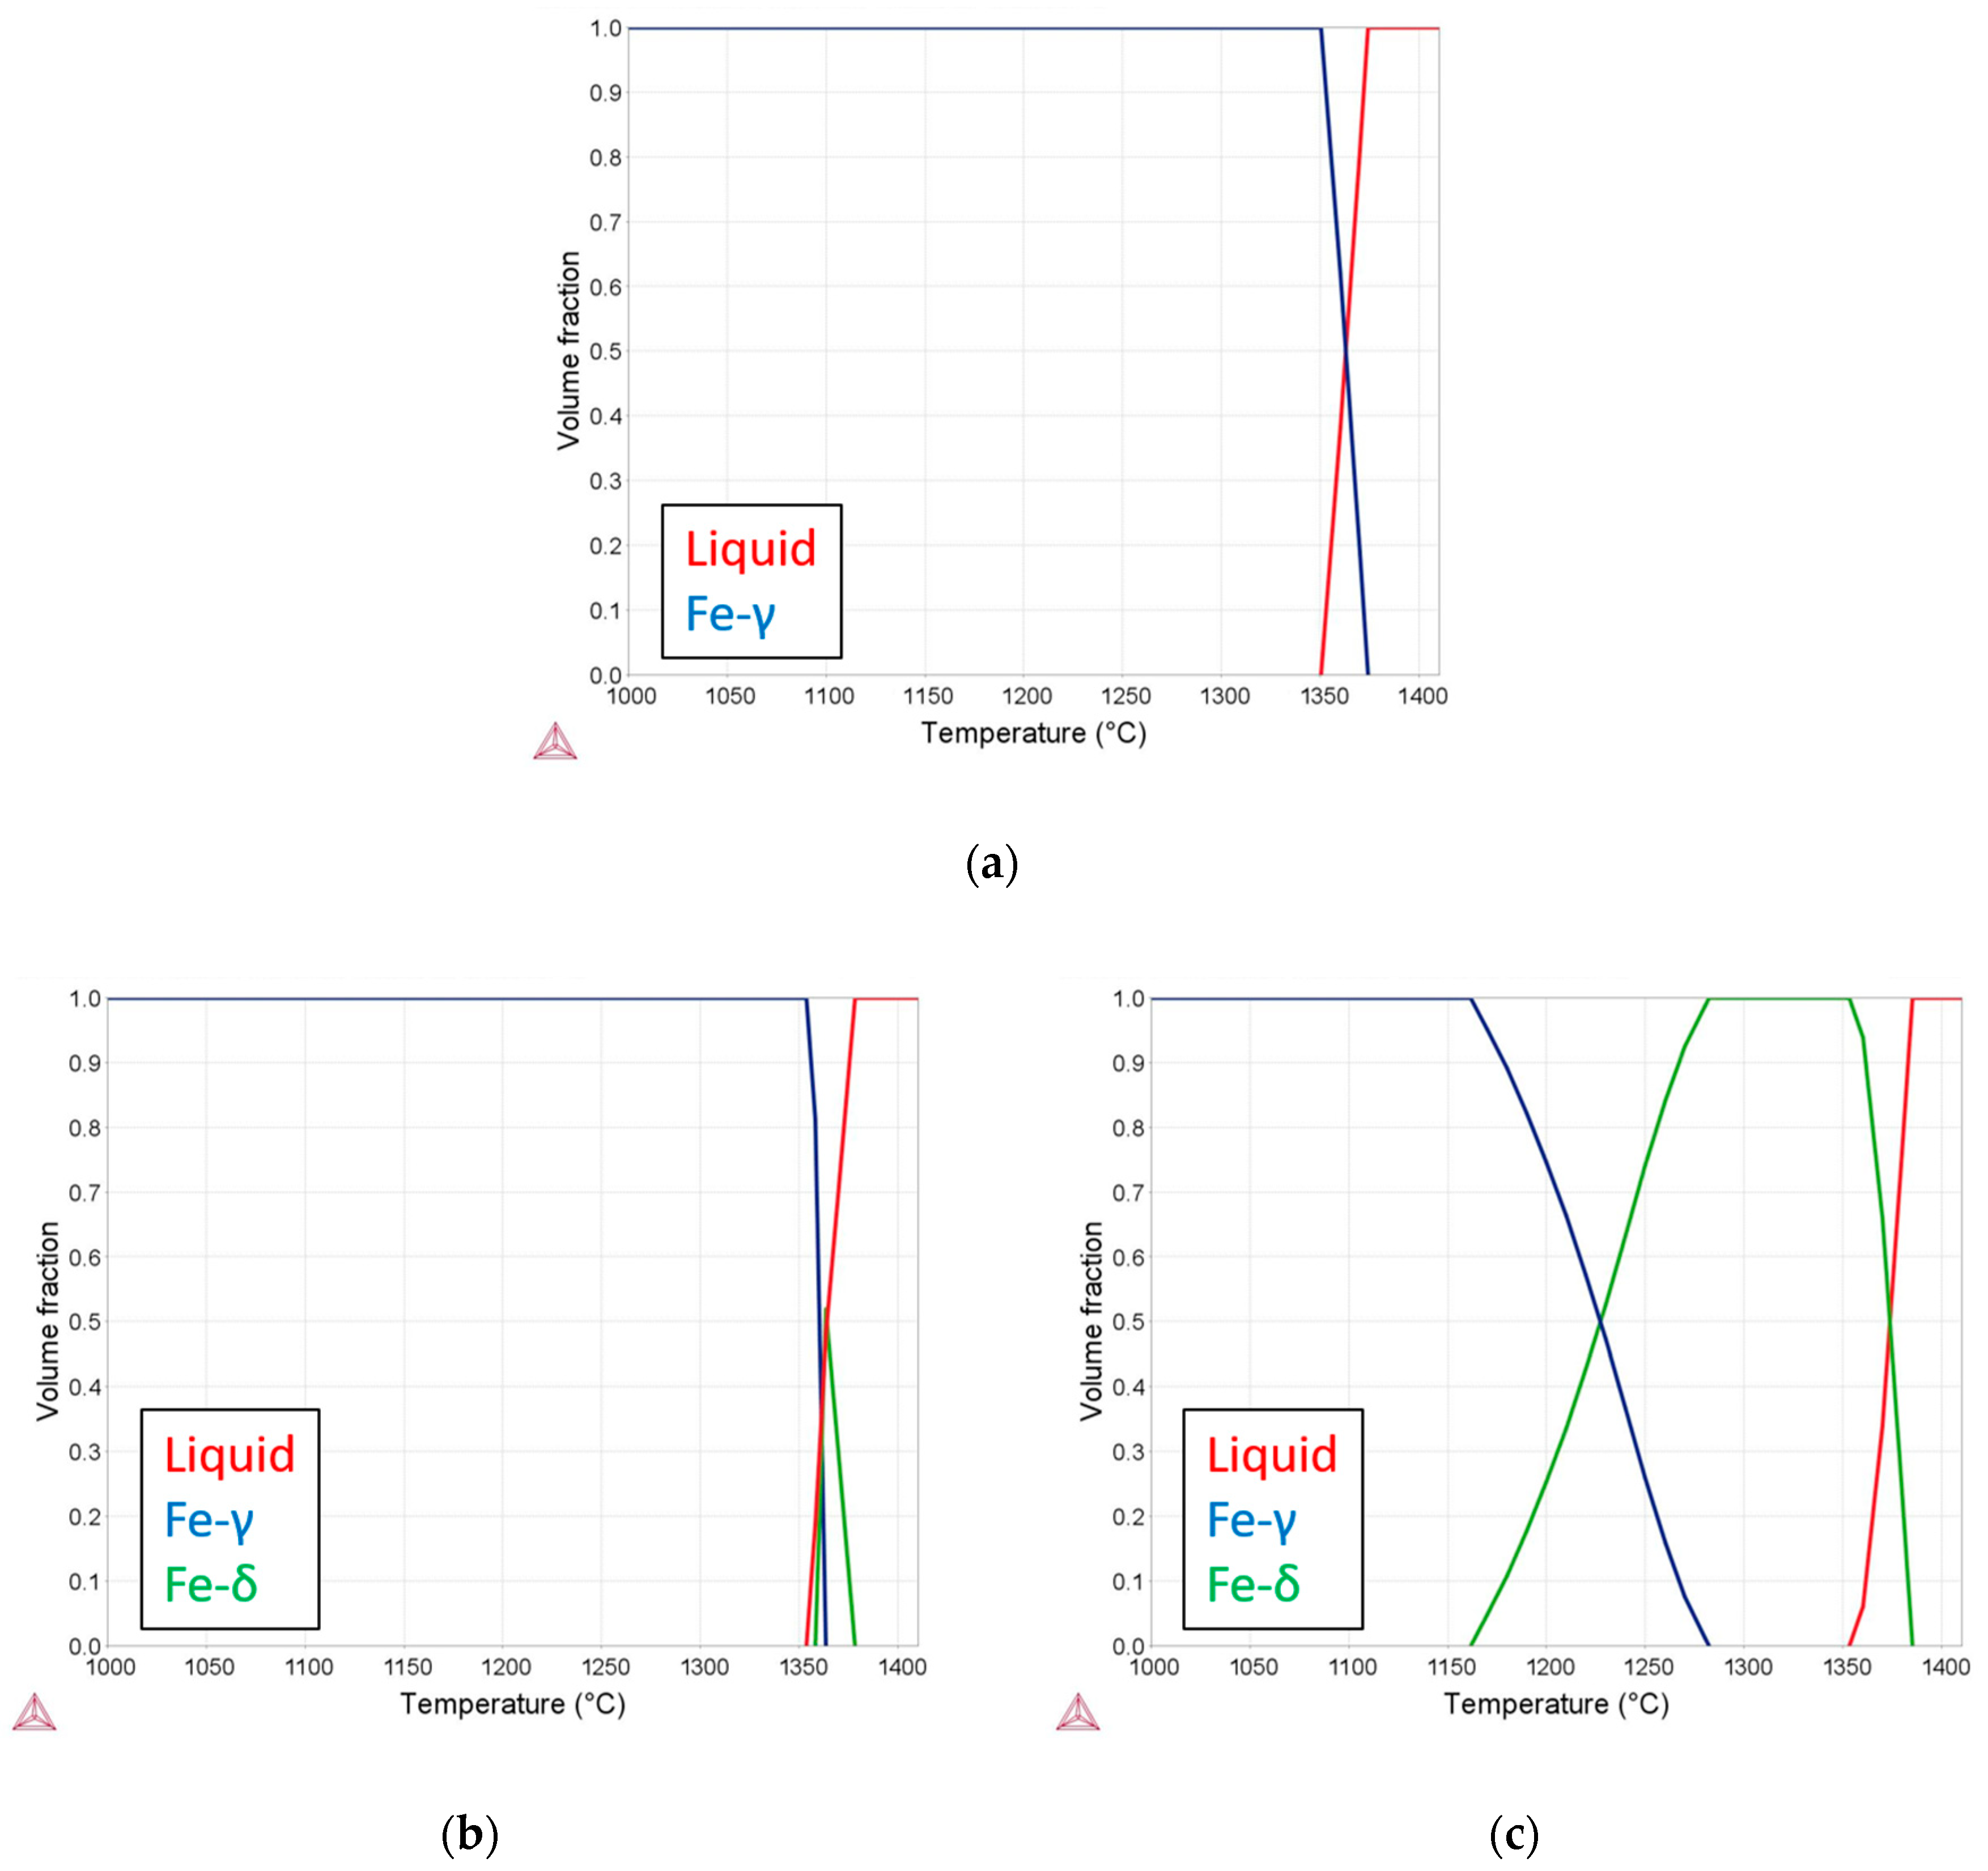
As shown in Figure 3, the equilibrium solidification sequences for all alloys were also obtained by CALPHAD. It was possible to observe that the primary phase depends on the aluminum content: austenitic for 0 wt. % Al, ferritic for 2.5 wt. % Al changing to austenitic in the final stages of solidification, and ferritic for 5 wt. % Al. At a certain temperature range, however, irrespective to the Al-content, all compositions would present a fully austenitic structure. Furthermore, increasing the Al content increases the stability of the primary BCC phase (Fe-δ) and, consequently, the 5Al alloy (Figure 3c) presents a wide, fully ferritic field right below solidus temperature. Decomposition into austenite is followed at lower temperatures. Therefore, the final microstructure after spray forming was expected to be different (mainly the grain size) due to the overall solidification model based on Grant’s results [18]. The different grain sizes and microstructures directly influence the SFE and the overall mechanical behavior [22]. From the nonequilibrium models of conventional solidification processes, it would be possible to predict that the final grain size and the stable phases could be different mainly due to the difference in the solidification range and transformations for all three alloys. However, due to the specific solidification mechanism prevailing during spray forming, the final microstructure of the deposit will be the same, except for the grain size, as will be shown in the sequence [18,23,24].
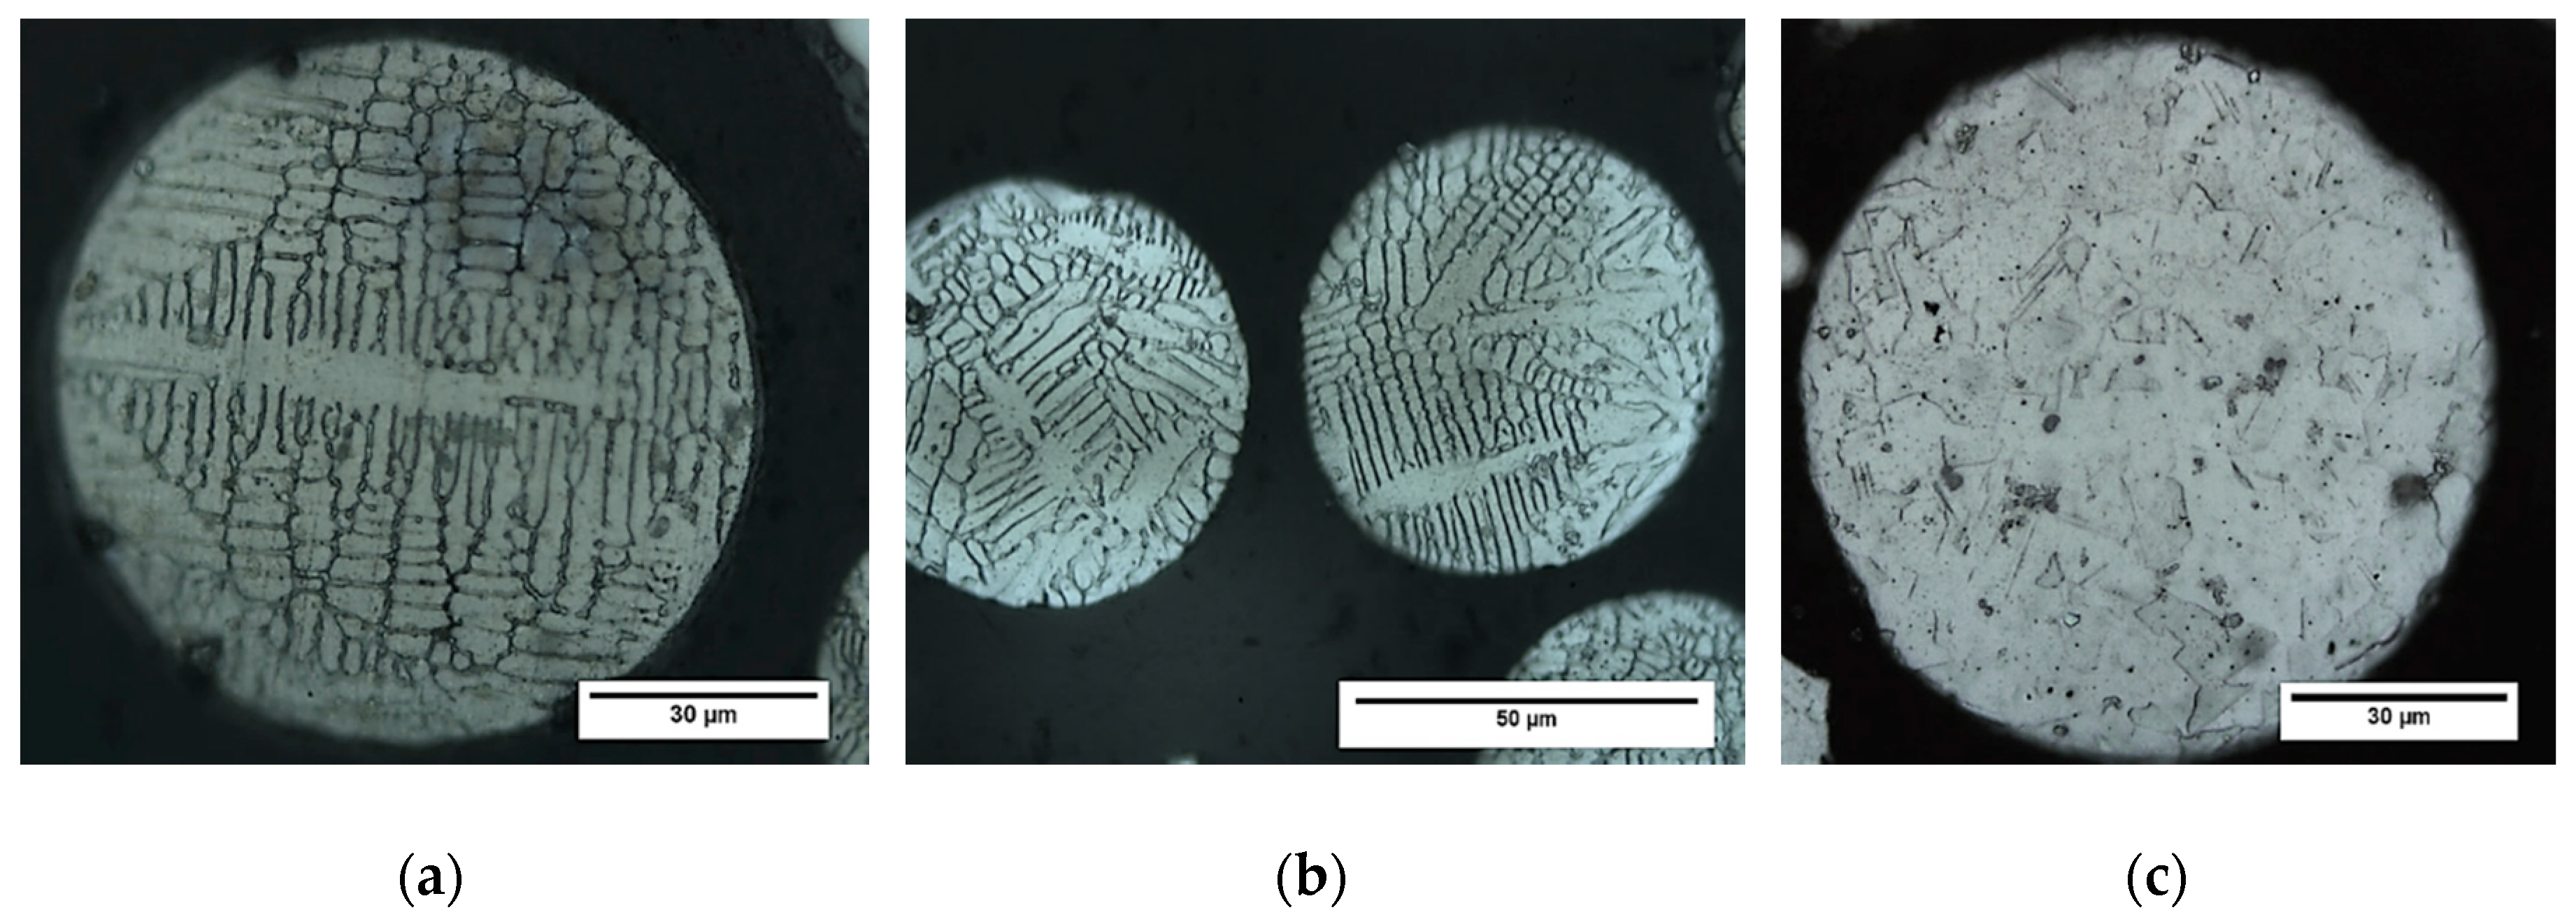
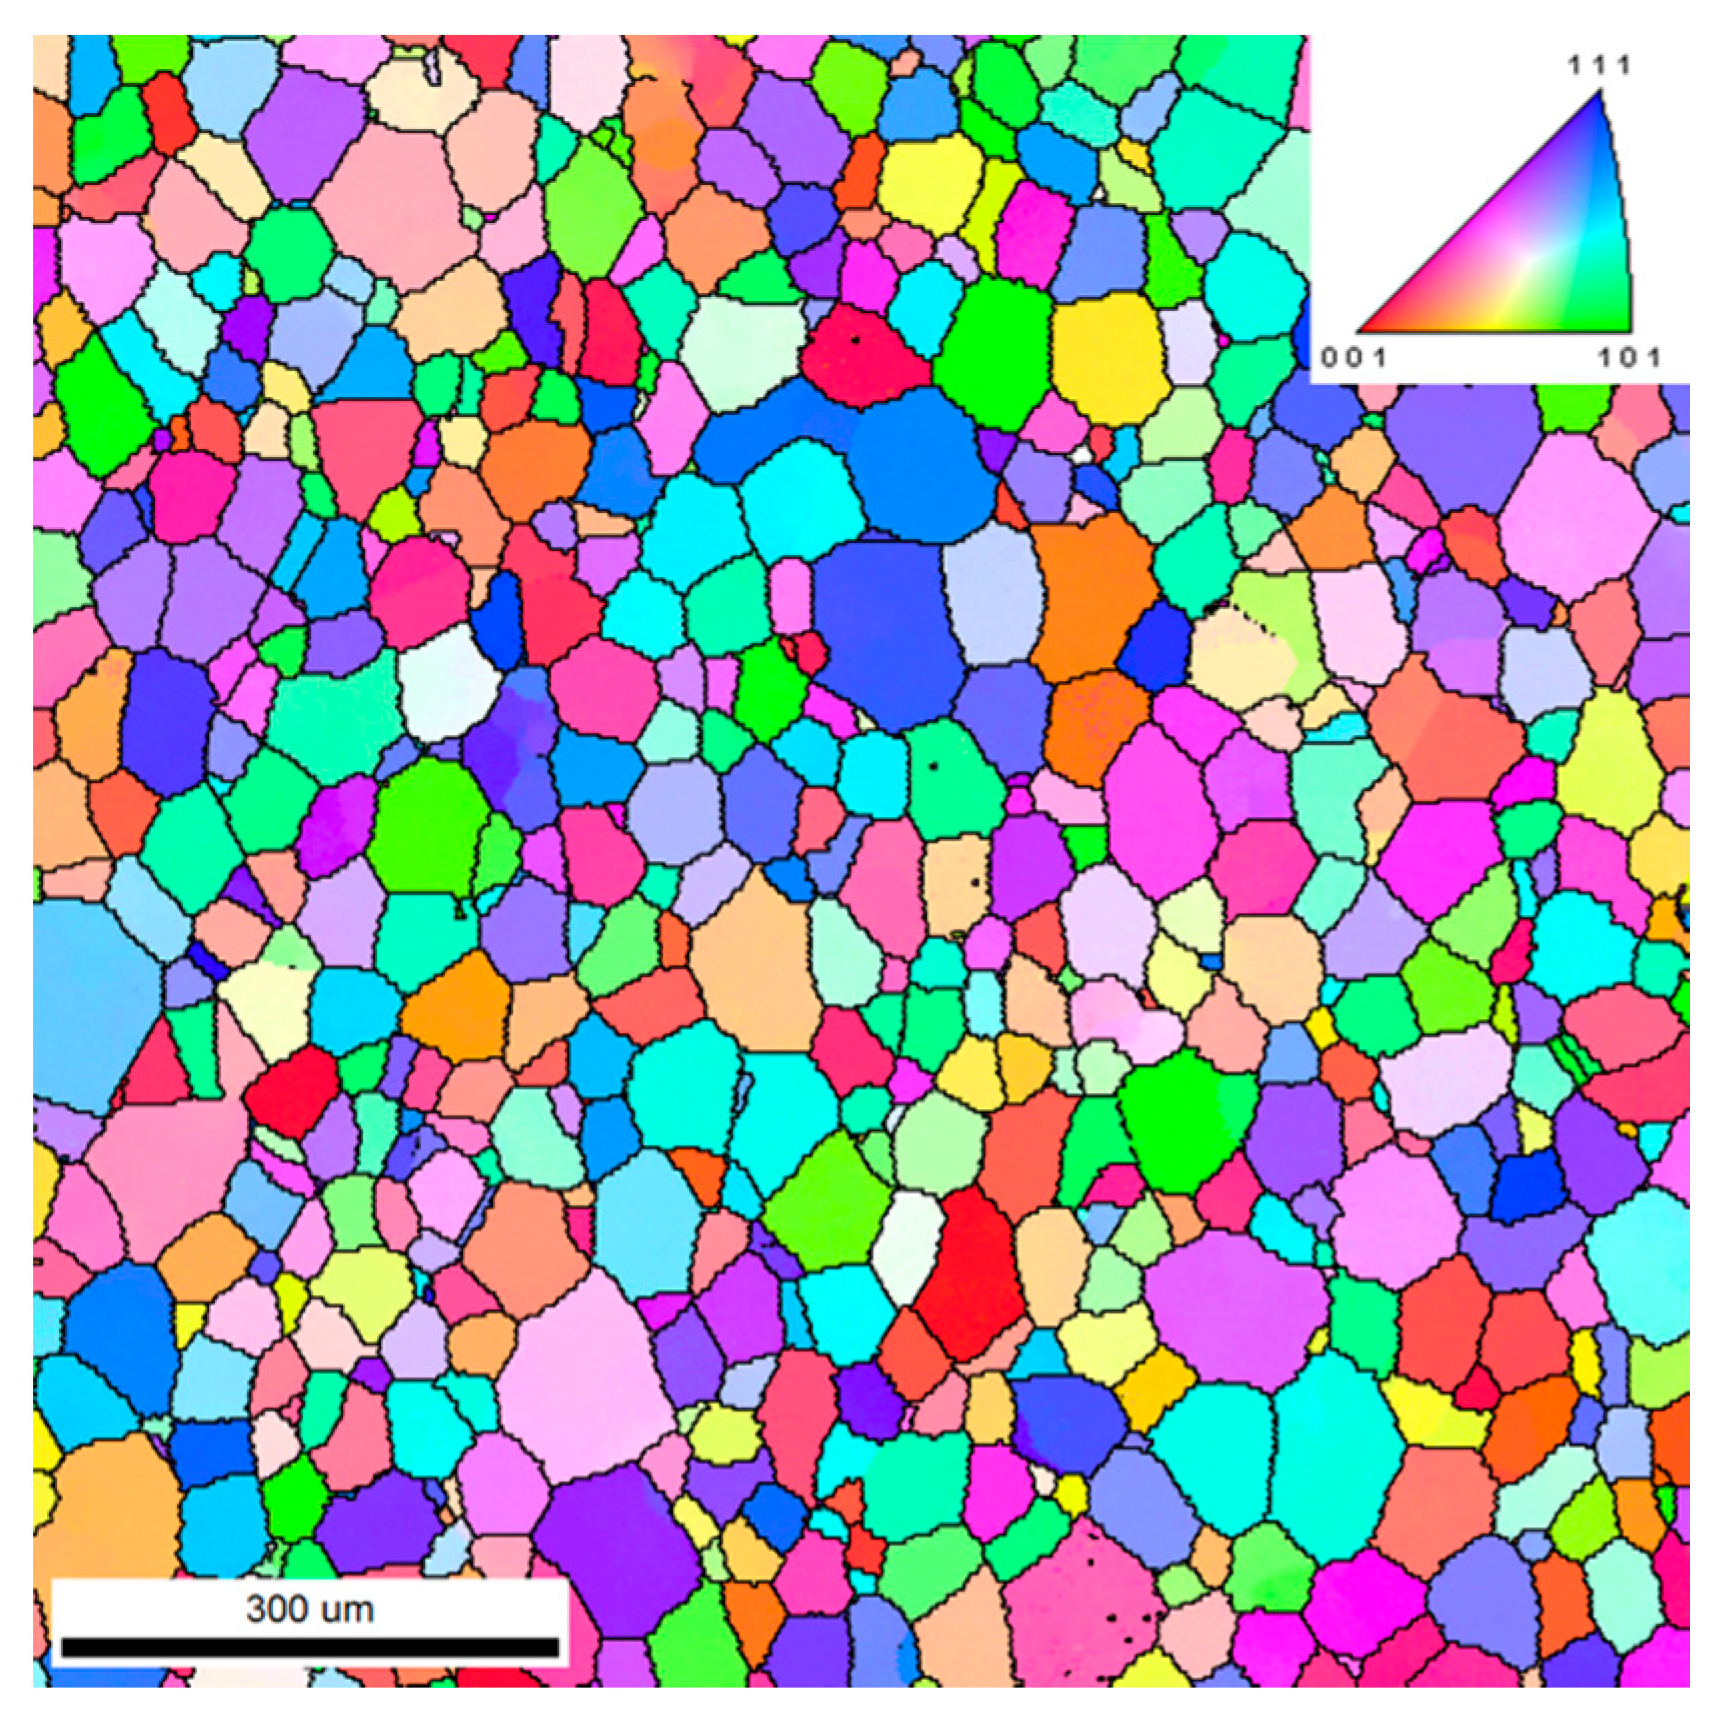
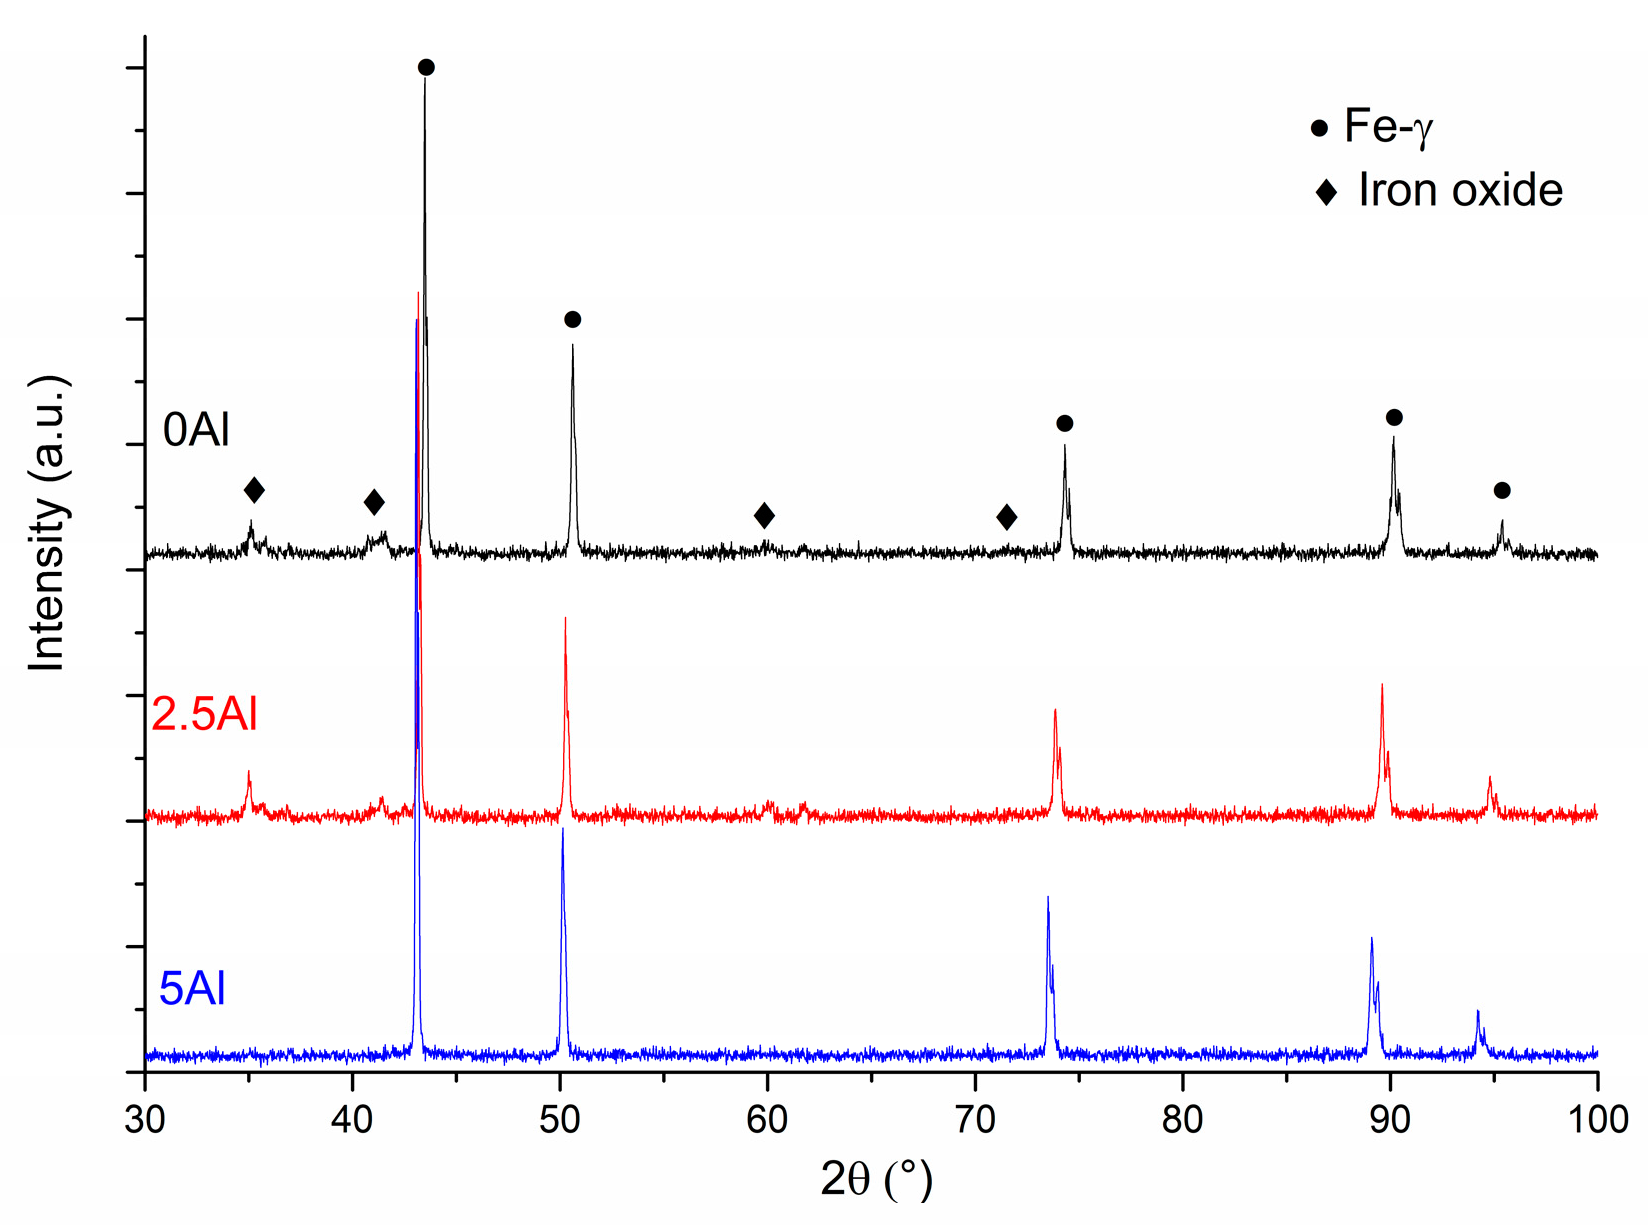
Figure 4 presents the droplet microstructure of the overspray, i.e., the droplets that did not attach to the deposit during the spray forming process; Figure 5 presents the as-spray deposit microstructure. Figure 6 presents the EBSD analysis for the as-sprayed 0Al deposit. The droplets from the 0Al and 2.5Al alloys presented fine austenitic dendrites with segregation in the interdendritic spaces. On the other hand, the 5Al alloy presented no well-defined dendrites and some indication of new grains formed by solid state transformation can be observed. Due to the high cooling rates, in the range of 102 to 104 K/s, the dendritic structure is expected during the solidification of the droplets [18,23]. The high thermal undercooling leads to instability in the solidification growth of the solid interface in face of a negative thermal gradient in the liquid forming the dendritic structure. Therefore, the 0Al and 2.5Al alloys solidify by forming austenitic dendrites with interdendritic segregation. The fact that the austenite was stable at room temperature together with the high cooling rates of the droplets led to the maintenance of the structure formed during the solidification at room temperature. For the 5Al alloy, the dendritic structure should be formed as well, but ferritic. However, during cooling in the solid state, the ferritic structure transformed to austenite and the dendritic structure was no longer clearly observed, as presented in Figure 4c. Therefore, the XRD patterns shown in Figure 7 indicate the presence of the austenitic phase and no presence of ferrite. Some peaks related to oxides are observed in the XRD pattern, which are related to the strong oxidation tendency of these compositions, increased by the high specific surface area of the particles. It is well known from the literature that the dendritic microstructure observed in the droplets leads to a highly homogeneous equiaxed grains in the microstructure of the deposit, as described in [23,24] and as can be observed in Figure 5 and Figure 6.
Therefore, the ingots presented a highly homogeneous microstructure already on the as-deposited state; however, the grain size was not the same for all the alloys. As presented earlier, the solidification path calculated by the CALPHAD method for the 5Al alloys is distinct from the others due to its higher Al content leading to primary ferritic solidification. The earlier discussion about the microstructure of the overspray helps to explain how the microstructure of the final deposit was formed [18]. By spray forming, the processing parameters were set in a way that the droplets impacted the substrate to build up the deposit with the consolidation of solid particles (finer droplets), semisolid particles (medium-sized droplets), and fully liquid particles (bigger droplets) [23]. Because of the heat balance, an equilibrium temperature within the solidification interval of the alloy was attained [23]. Thus, the already solidified droplets may partially remelt and homogenize their chemical composition with the liquid, changing their dendritic morphology to a spherical one. These particles acted as nuclei for the growth of the remained phase, namely the austenite for the 0Al and 2.5Al alloys and the ferrite for the 5Al alloy. As discussed earlier, for both lower Al content the austenite was formed, and the final grains were fully austenitic. In contrast, for the 5Al alloy the nuclei were composed of ferrite, which growths resulted in equiaxed grains as well. However, as can be observed in Figure 3, the ferritic phase transformed to austenite during cooling. In this transformation, new grains were formed and there was a reduction of the grain size. This is the main reason for the finer grain size presented by the deposit of the 5Al alloy.
Despite the fact that a fully austenitic microstructure was obtained for all alloys in the as-sprayed condition, and the spray formed microstructure was homogenous, some porosity was intrinsic to this processing technique, and the processing parameters employed in the experimental setup generated deposits with an average porosity of 2 vol.%, determined by image analysis.

3.3. Cold Rolling and Annealing

The spray forming process presented an alternative potential processing route to fabricate lightweight steels, with their intrinsic highly homogeneous microstructure, directly from the liquid, however with the necessity to improve the processing parameters even more in order to obtain an ingot with lower grain size and porosity. Nevertheless, the main goal of this work was to compare the mechanical behavior of the three alloys in regard to the dislocation structure after the fracture and correlate it with the SFE values estimated from the thermodynamic model. For this reason, the cold rolling followed by annealing heat treatments was necessary to control the grain size of all the compositions. In Figure 8a, it is possible to observe the recrystallization process via microhardness curves. All the alloys presented similar behavior, especially for the two alloys with Al additions. The 0Al alloy presented a higher initial hardness through the same cold work levels. However, in the end, the microhardness values of the 0Al samples heat treated at higher temperatures were slightly lower compared to the other two alloys; this was most likely due to its lower solid solution hardening effect by not having any Al additions. Figure 8b–d presents the evolution of the 2.5Al microstructure through the different annealing temperatures after the cold work (500, 750, and 900 °C). Similar behavior was observed for the other two samples. From Figure 8b it is possible to observe that the sample treated at 500 °C presented essentially the cold rolled microstructure, and no recrystallization evidence could be observed. On the other side, Figure 8d presents a fully recrystallized microstructure with little or no evidence of cold work. The final grain size was lower compared to the as-sprayed samples (Figure 5b). The microstructure shown in Figure 8c presents a partially recrystallized microstructure, in which some small new grains can be seen, formed due to the recrystallization process at the grain boundaries.
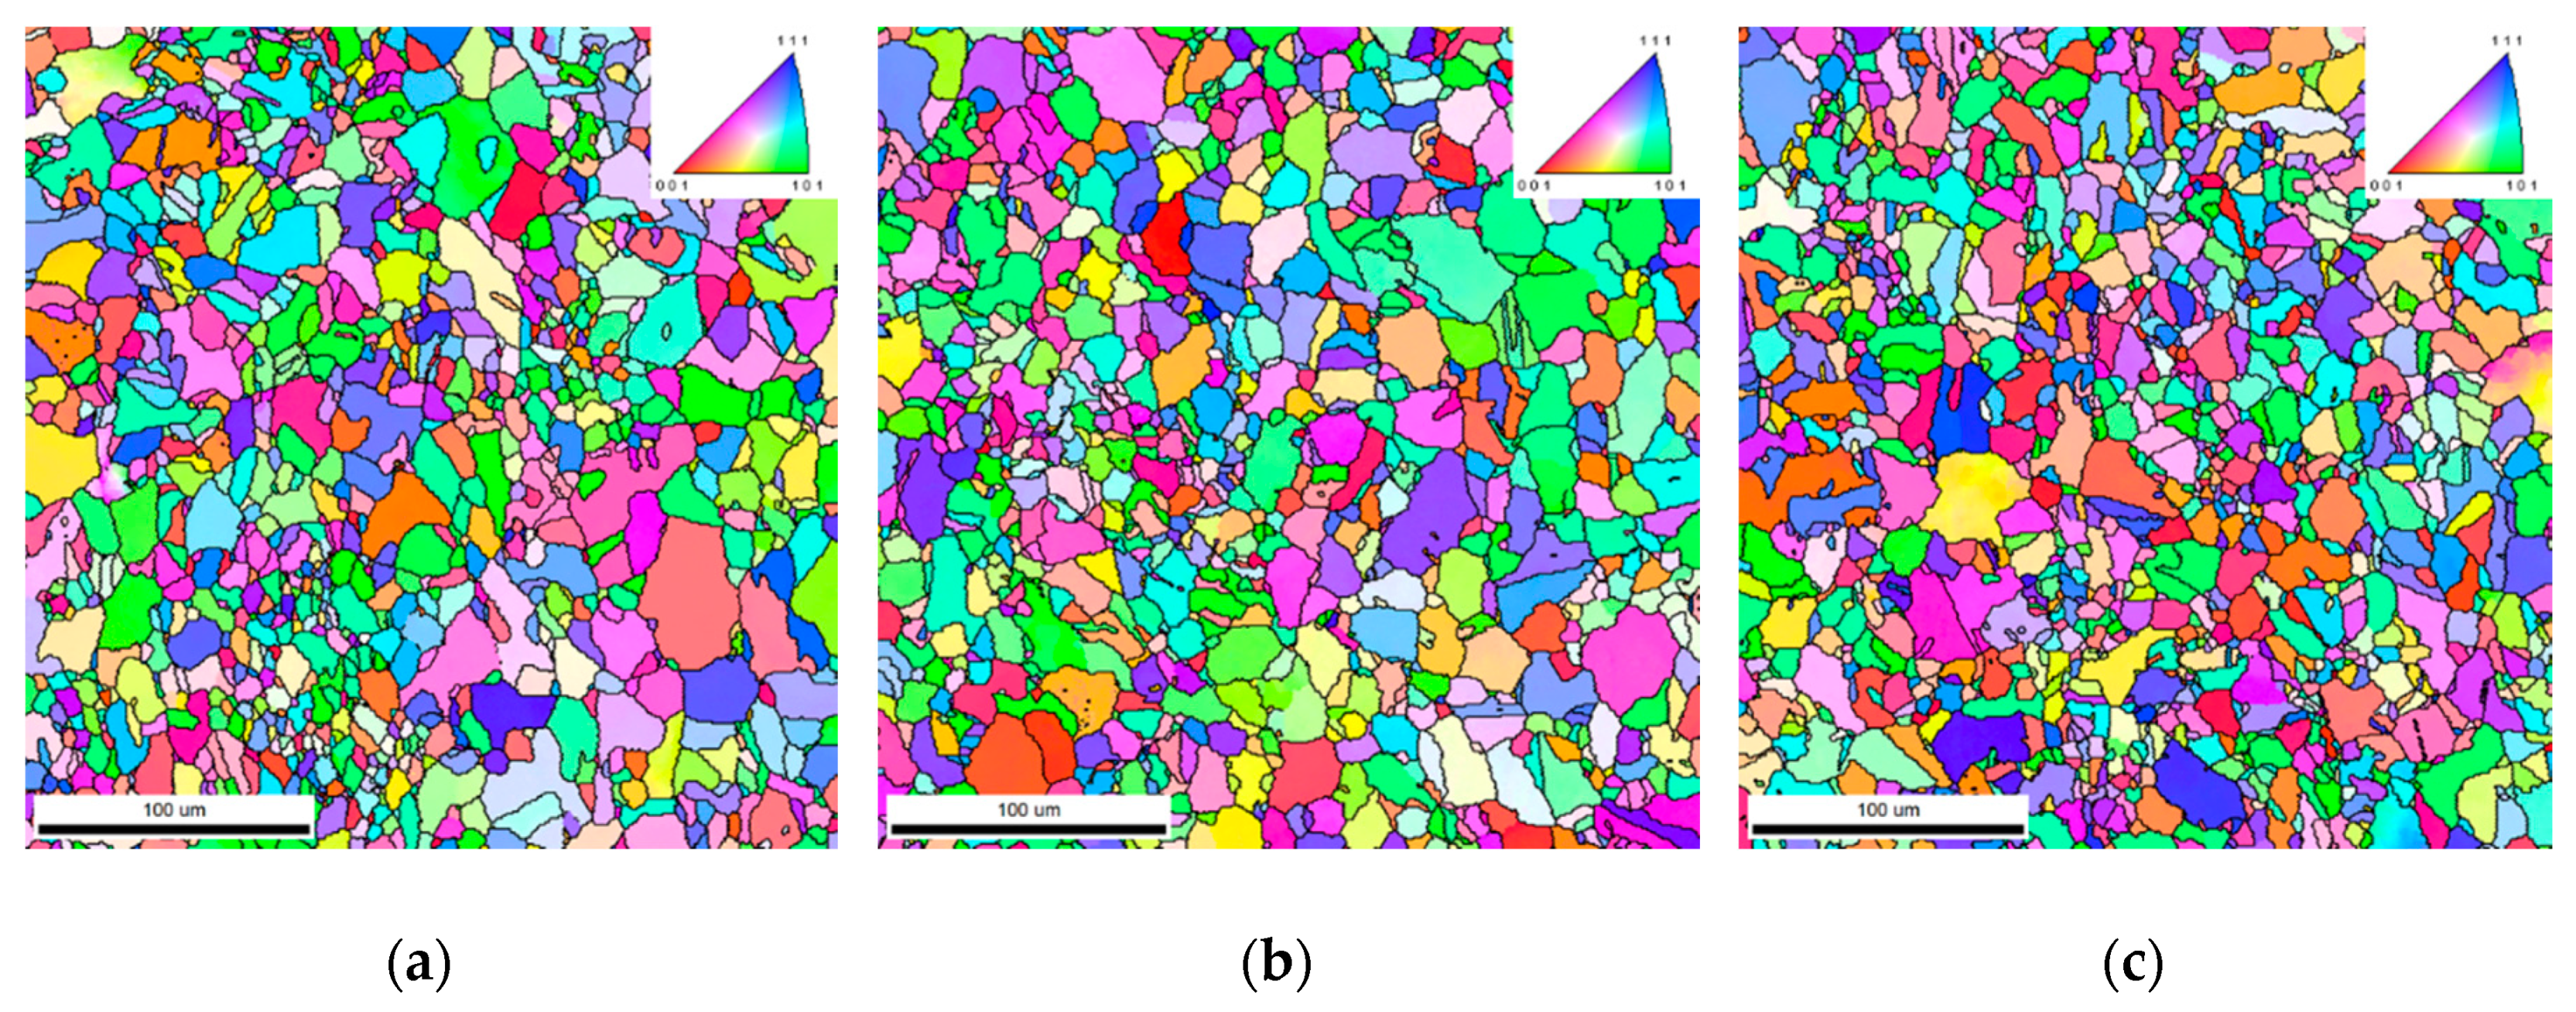
From the curve presented in Figure 8a, the temperature of 850 °C (10 min) was chosen for the heat treatment for all the alloys since they presented similar behavior. The final grain sizes for all the alloys were 8.8 ± 0.8, 11.2 ± 1.7, and 10.2 ± 1.9 µm for the 0Al, 2.5Al, and 5Al alloys, respectively. Figure 9 presents the recrystallized microstructures. It is possible to observe that the microstructure of the 5Al alloy was completely restored to equiaxed grain morphology despite its initial as sprayed microstructure. The annealing twins were highly present in all microstructures and this was, in addition to the grain size, the main difference compared to the as sprayed samples. Moreover, from the EBSD analysis it is possible to observe that the recrystallized samples for all three alloys presented similar microstructures and grain texture.

3.4. Tensile Tests

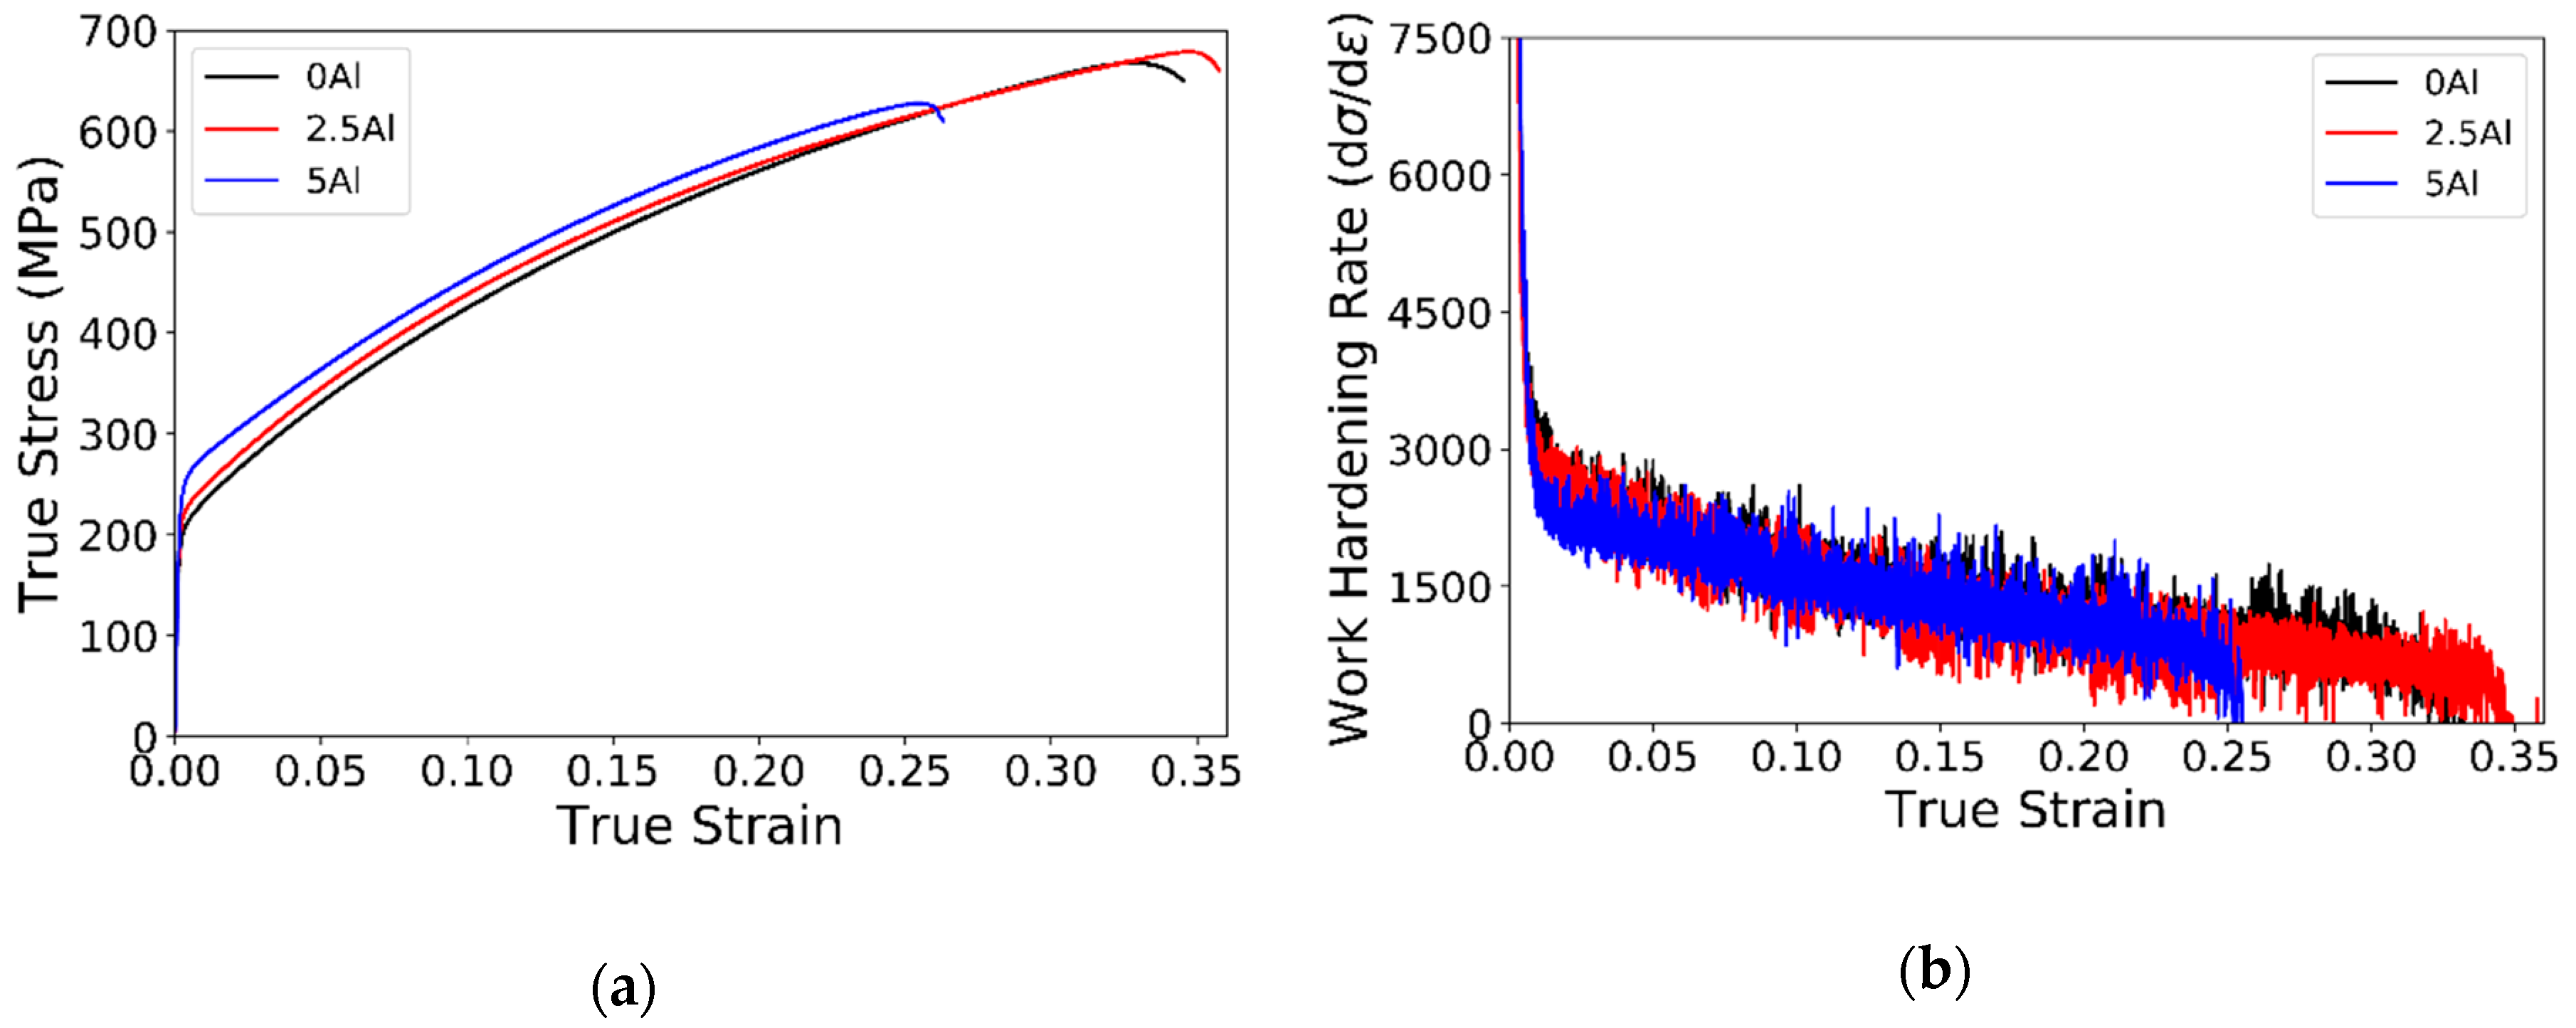
The true stress–strain of all three alloys and the work hardening rate curves are presented in Figure 10. According to some authors, the onset of the twinning effect is related to an increase in the work hardening rate at the beginning of the tensile test, during what is called Stage B of plastic deformation [25,26,27]. However, other authors observed the TRIP/TWIP effect even when there is no evident Stage B at the work hardening rate curve [28,29]. Most authors agree that for an FCC alloy to deform by twinning, there is a critical resolved shear stress (CRSS), which must be achieved in order to trigger this mechanism [30,31,32]. The models that better describe the nucleation of twins in FCC alloys associate this process to the interaction of perfect dislocations and Shockley partials [13]. For this reason, a certain amount of deformation must take place in order to allow the dislocations to interact with each other and to start the twinning mechanism. Despite all the above, the onset of the twinning effect typically is assumed to take place right after the beginning of the plastic deformation [33].
The yield strength (measured at 0.002) was 207, 236, and 253 MPa for the 0Al, 2.5Al, and 5Al alloy, respectively. Table 3 presents the main mechanical properties regarding the alloys, including the Ultimate Tensile Strength (UTS) and the elongation at fracture (εtotal). Assuming the grain refinement contribution from all three alloys was the same (since the grain sizes were similar), this result indicates the potential that the aluminum has as a solid solution strengthener. On average, the effect of aluminum as a solid solution strengthener was 9.3 MPa/wt. % of Al. This result agrees to the values presented in [4], in which it is reported an effect lower than 10 MPa/wt. % Al in fully austenitic Fe–Mn steel. In addition to that, the Al influences the density of the alloys. From the lattice parameter obtained by the XRD, the theoretical densities were 7.81, 7.54, and 7.26 g/cm³ for the 0Al, 2.5Al, and 5Al alloys, respectively.
The elongation at fracture of these alloys was not so high compared to other lightweight austenitic steels described in the literature [15] since the ingots presented non-negligible levels of porosity. Any of the compositions in this work showed the TRIP or the TWIP effects; however, Lee et al. [28] observed that the TRIP/TWIP effects for similar compositions and grain sizes (especially comparing to the 0Al) occurred at deformation levels within the deformation range presented by the alloys studied in the present work. Therefore, if those mechanisms were favorable for the alloys in this work, they would already be present for the samples tested until fracture.
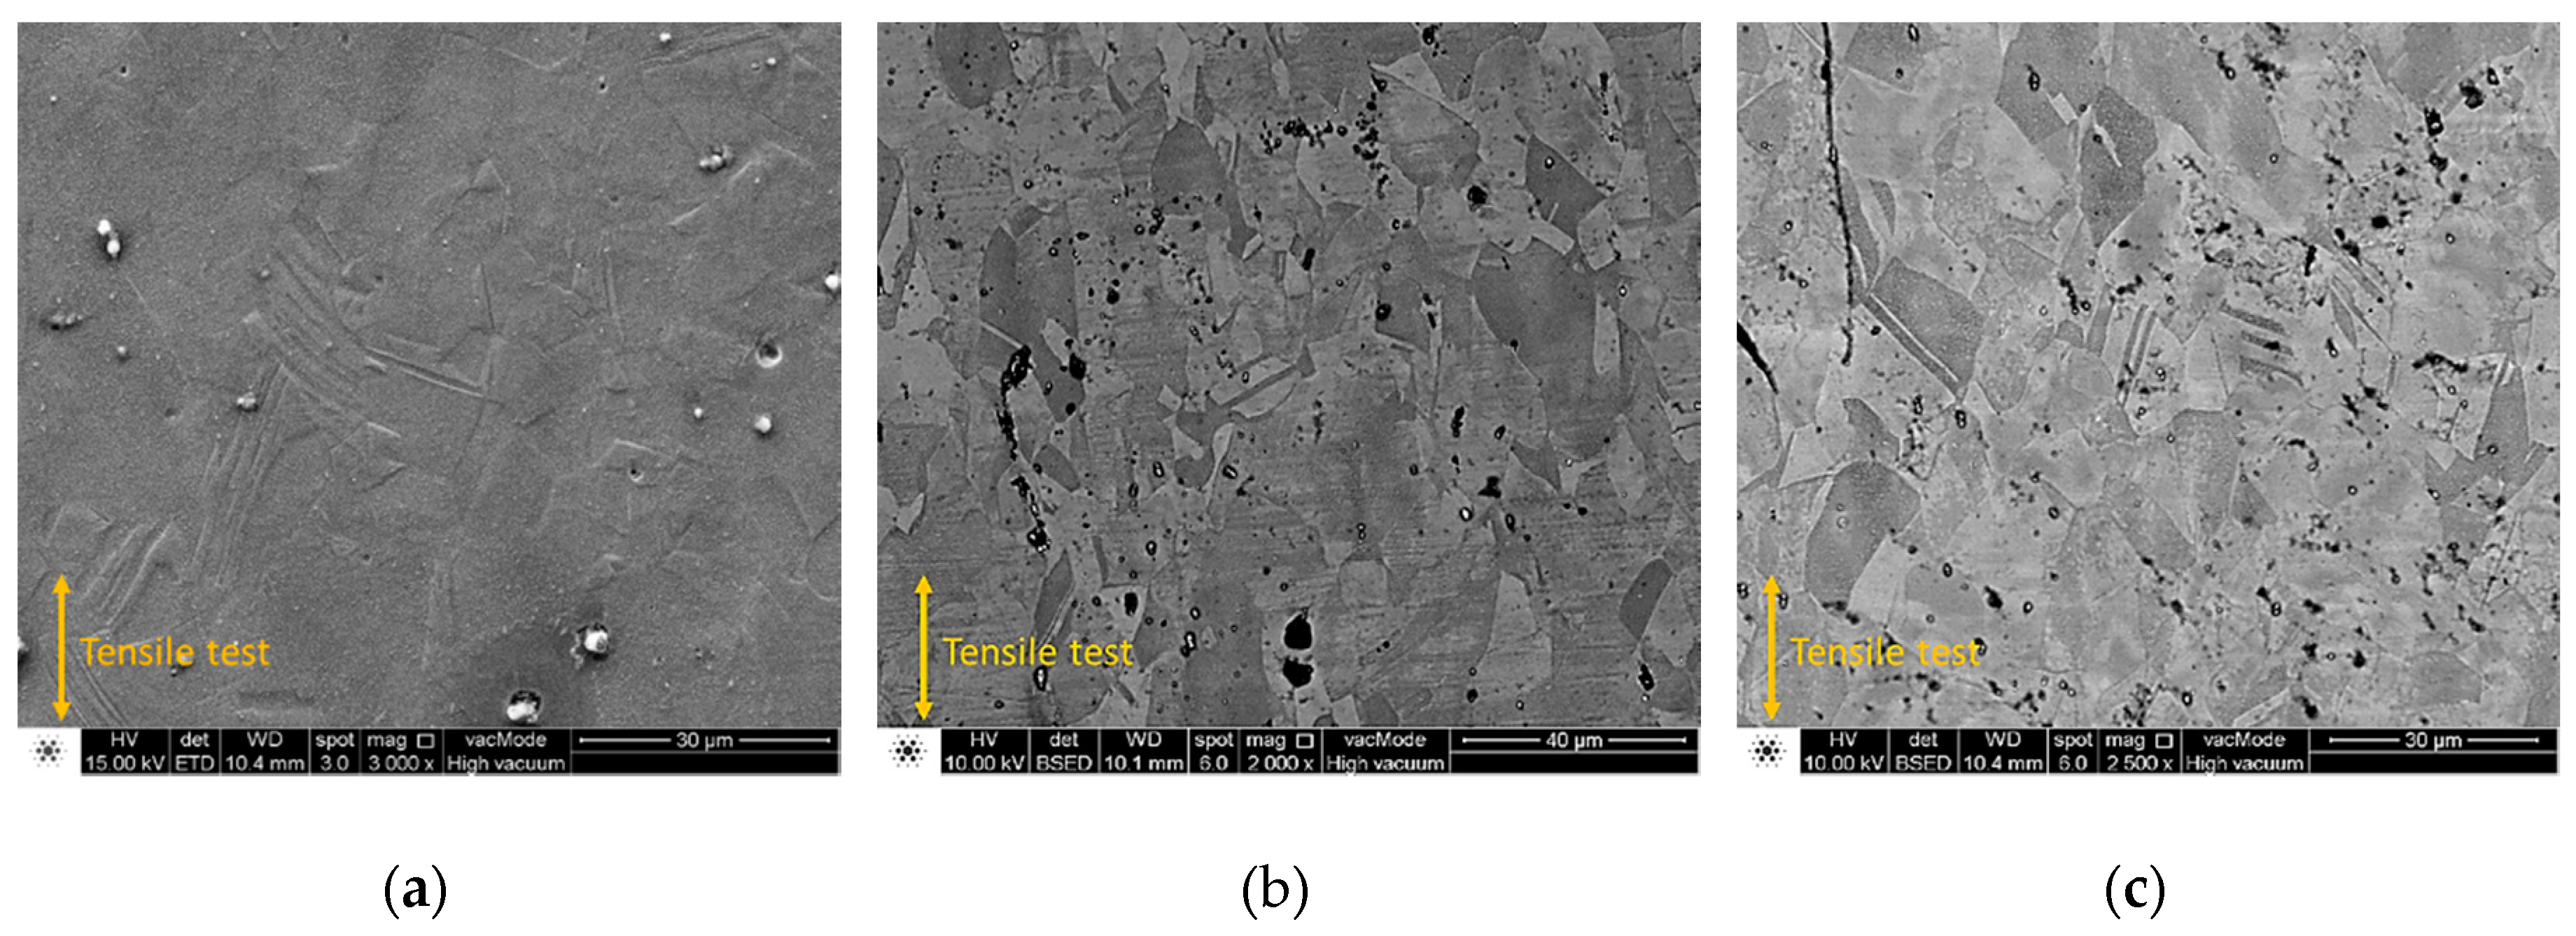
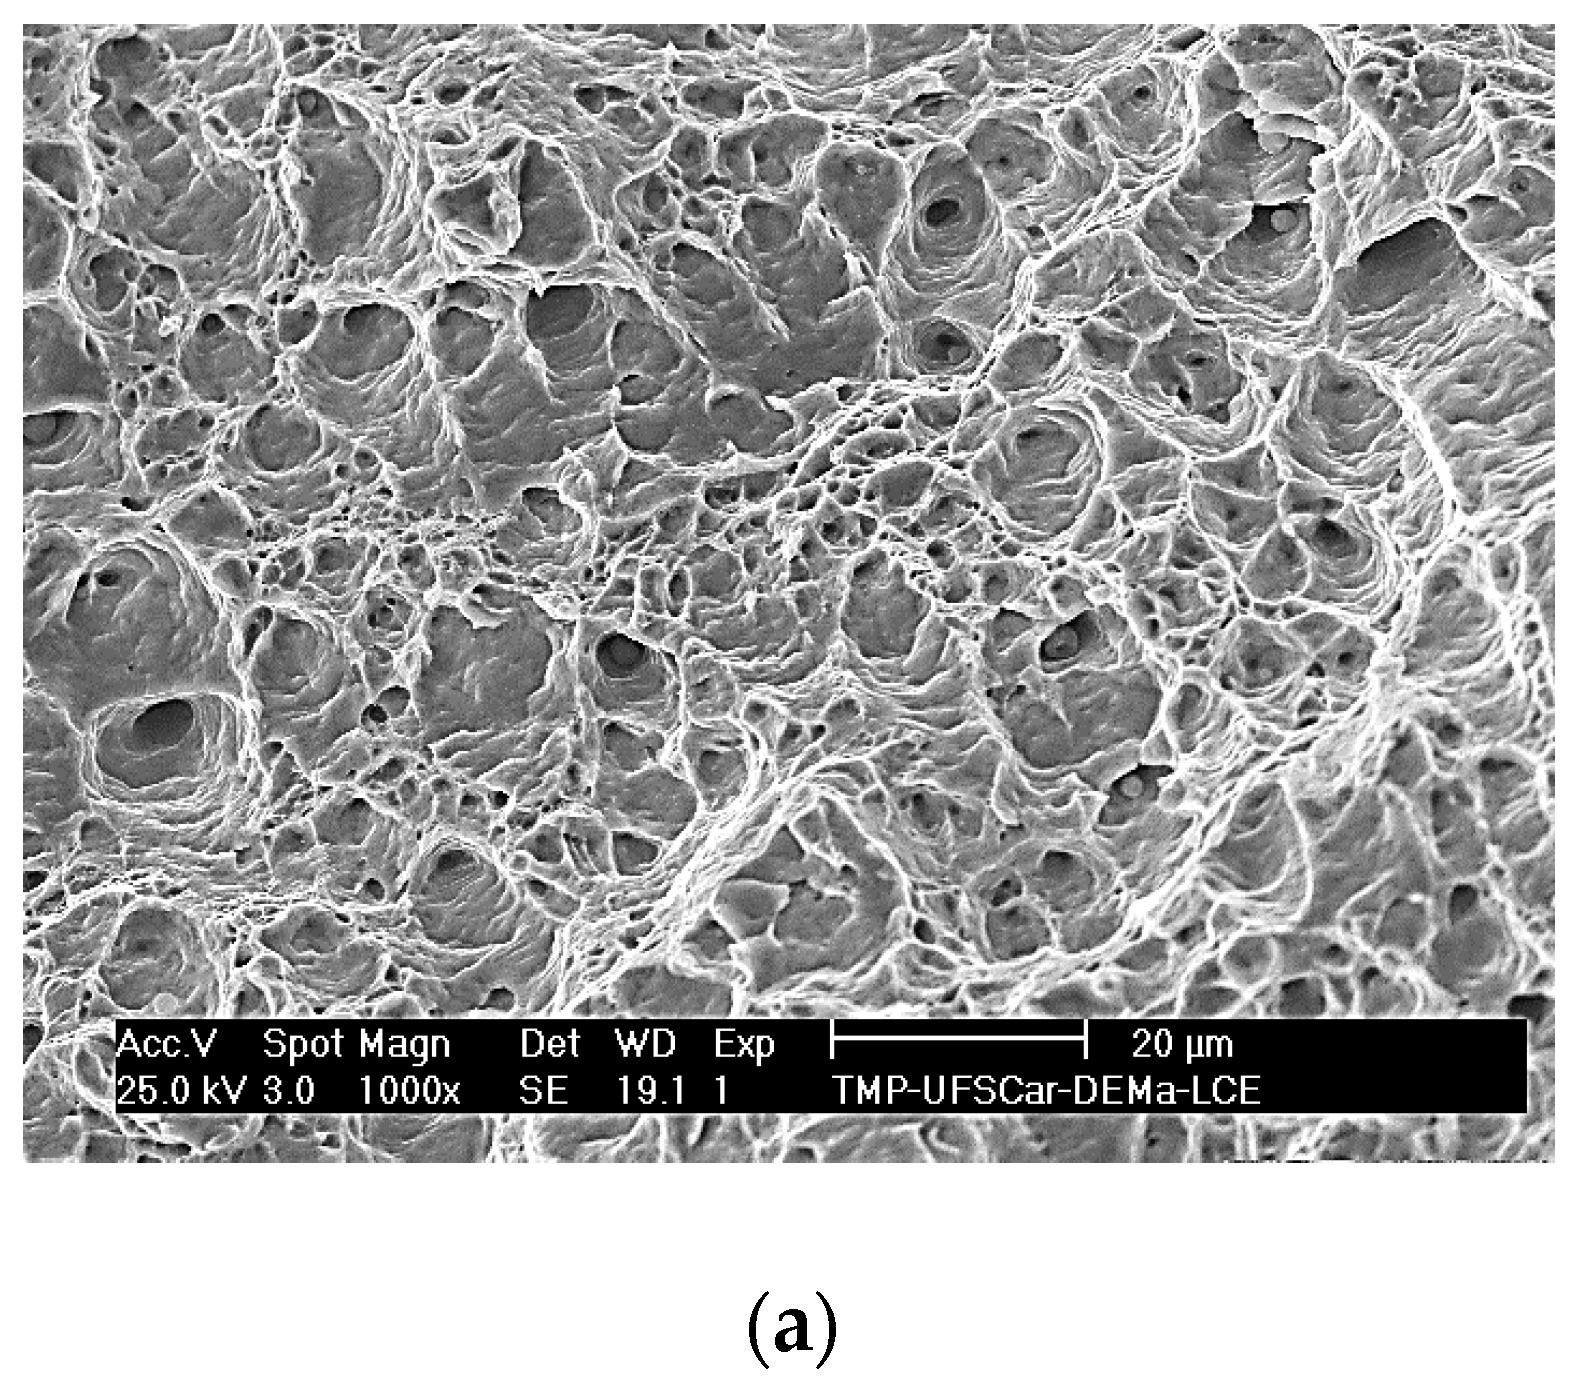
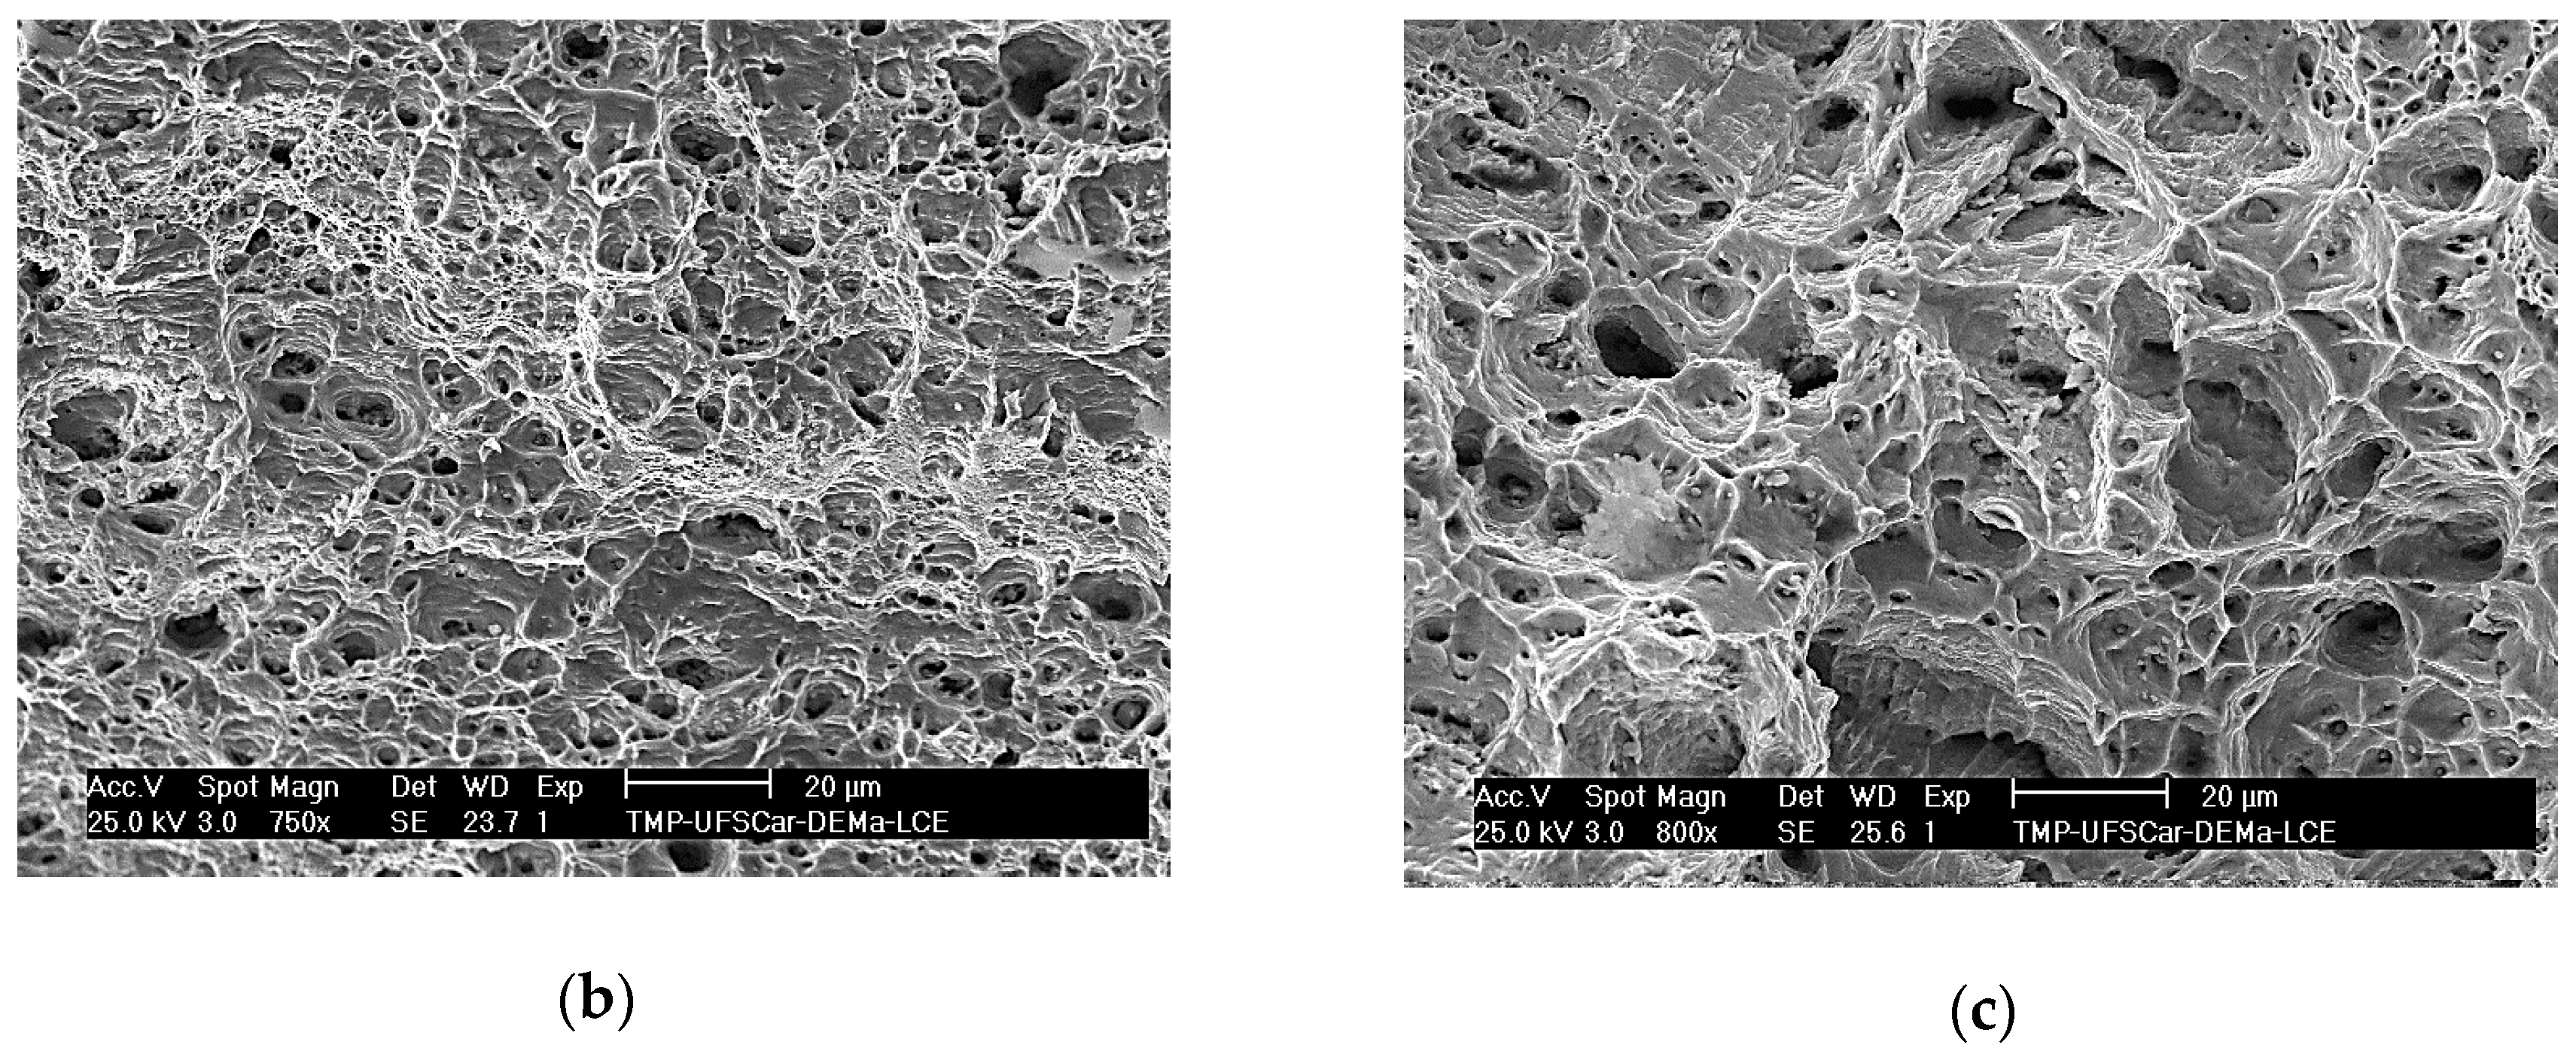
Figure 11 presents SEM microstructures of the samples after the tensile tests, showing the absence of deformation twins and transformation-induced martensite. Figure 12 presents the SEM micrographs of the fracture surface. Typical ductile surfaces are evidenced by the presence of well-defined dimples which can be observed despite the presence of the porosity.
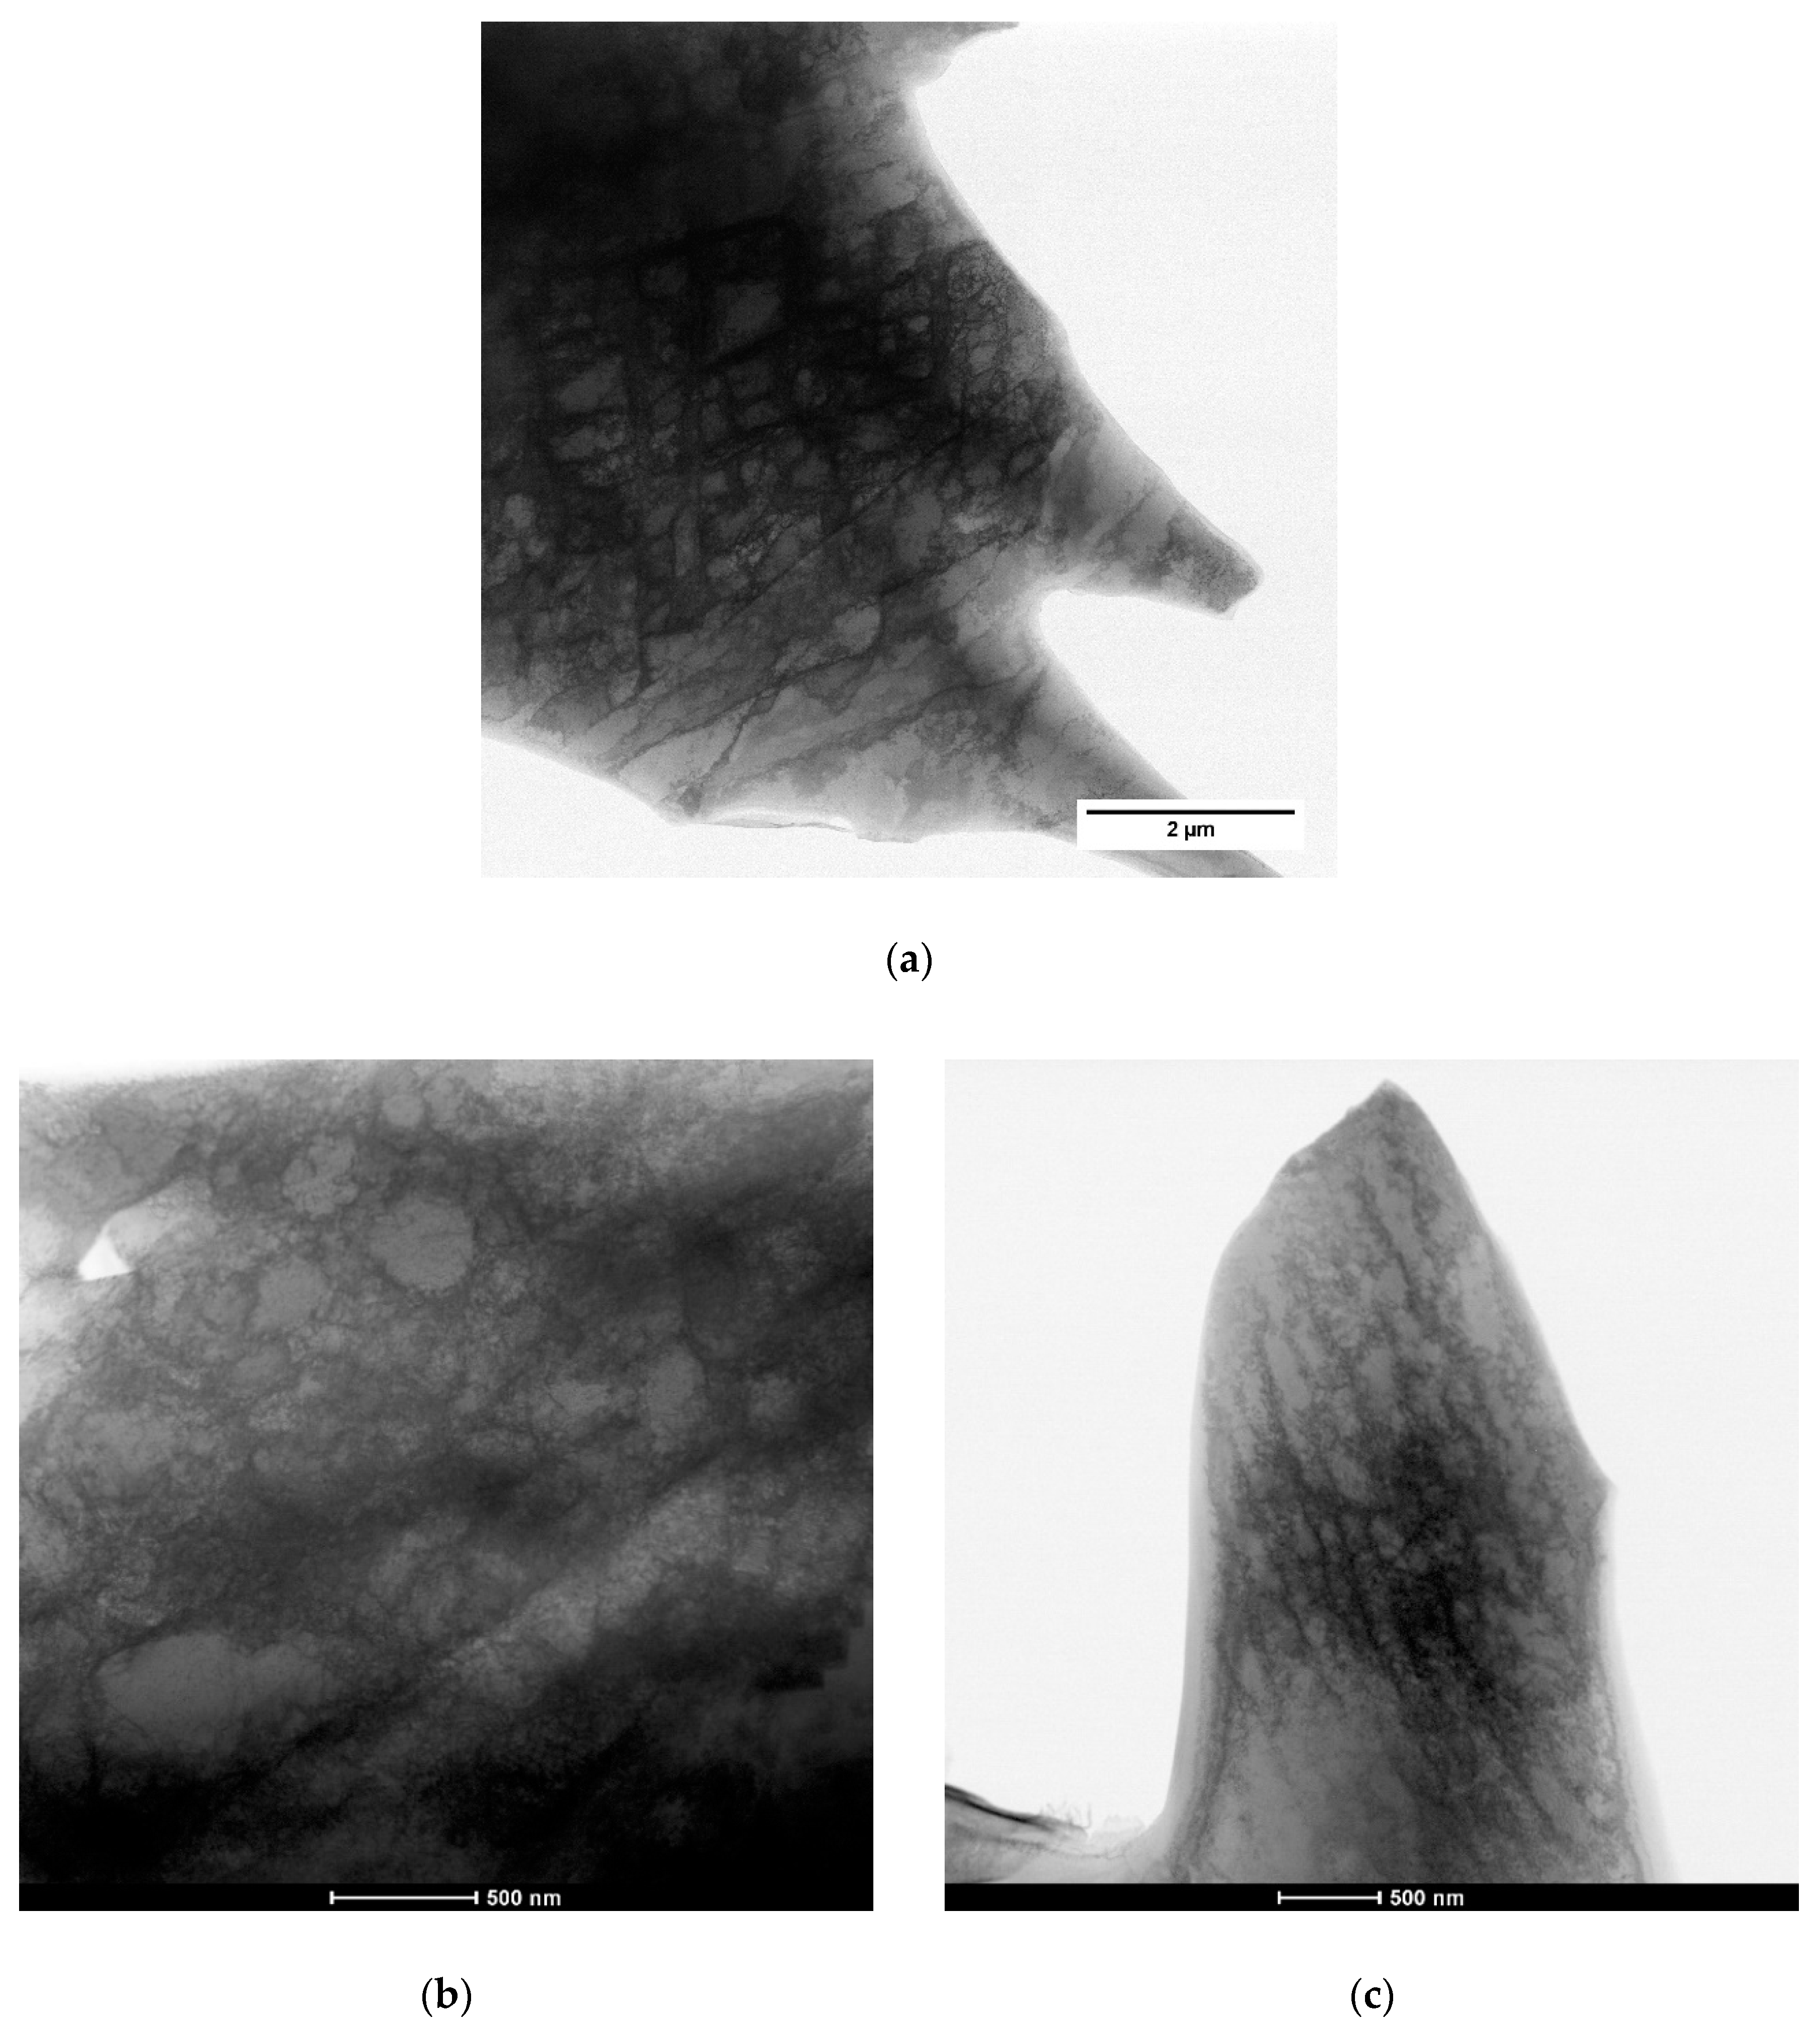
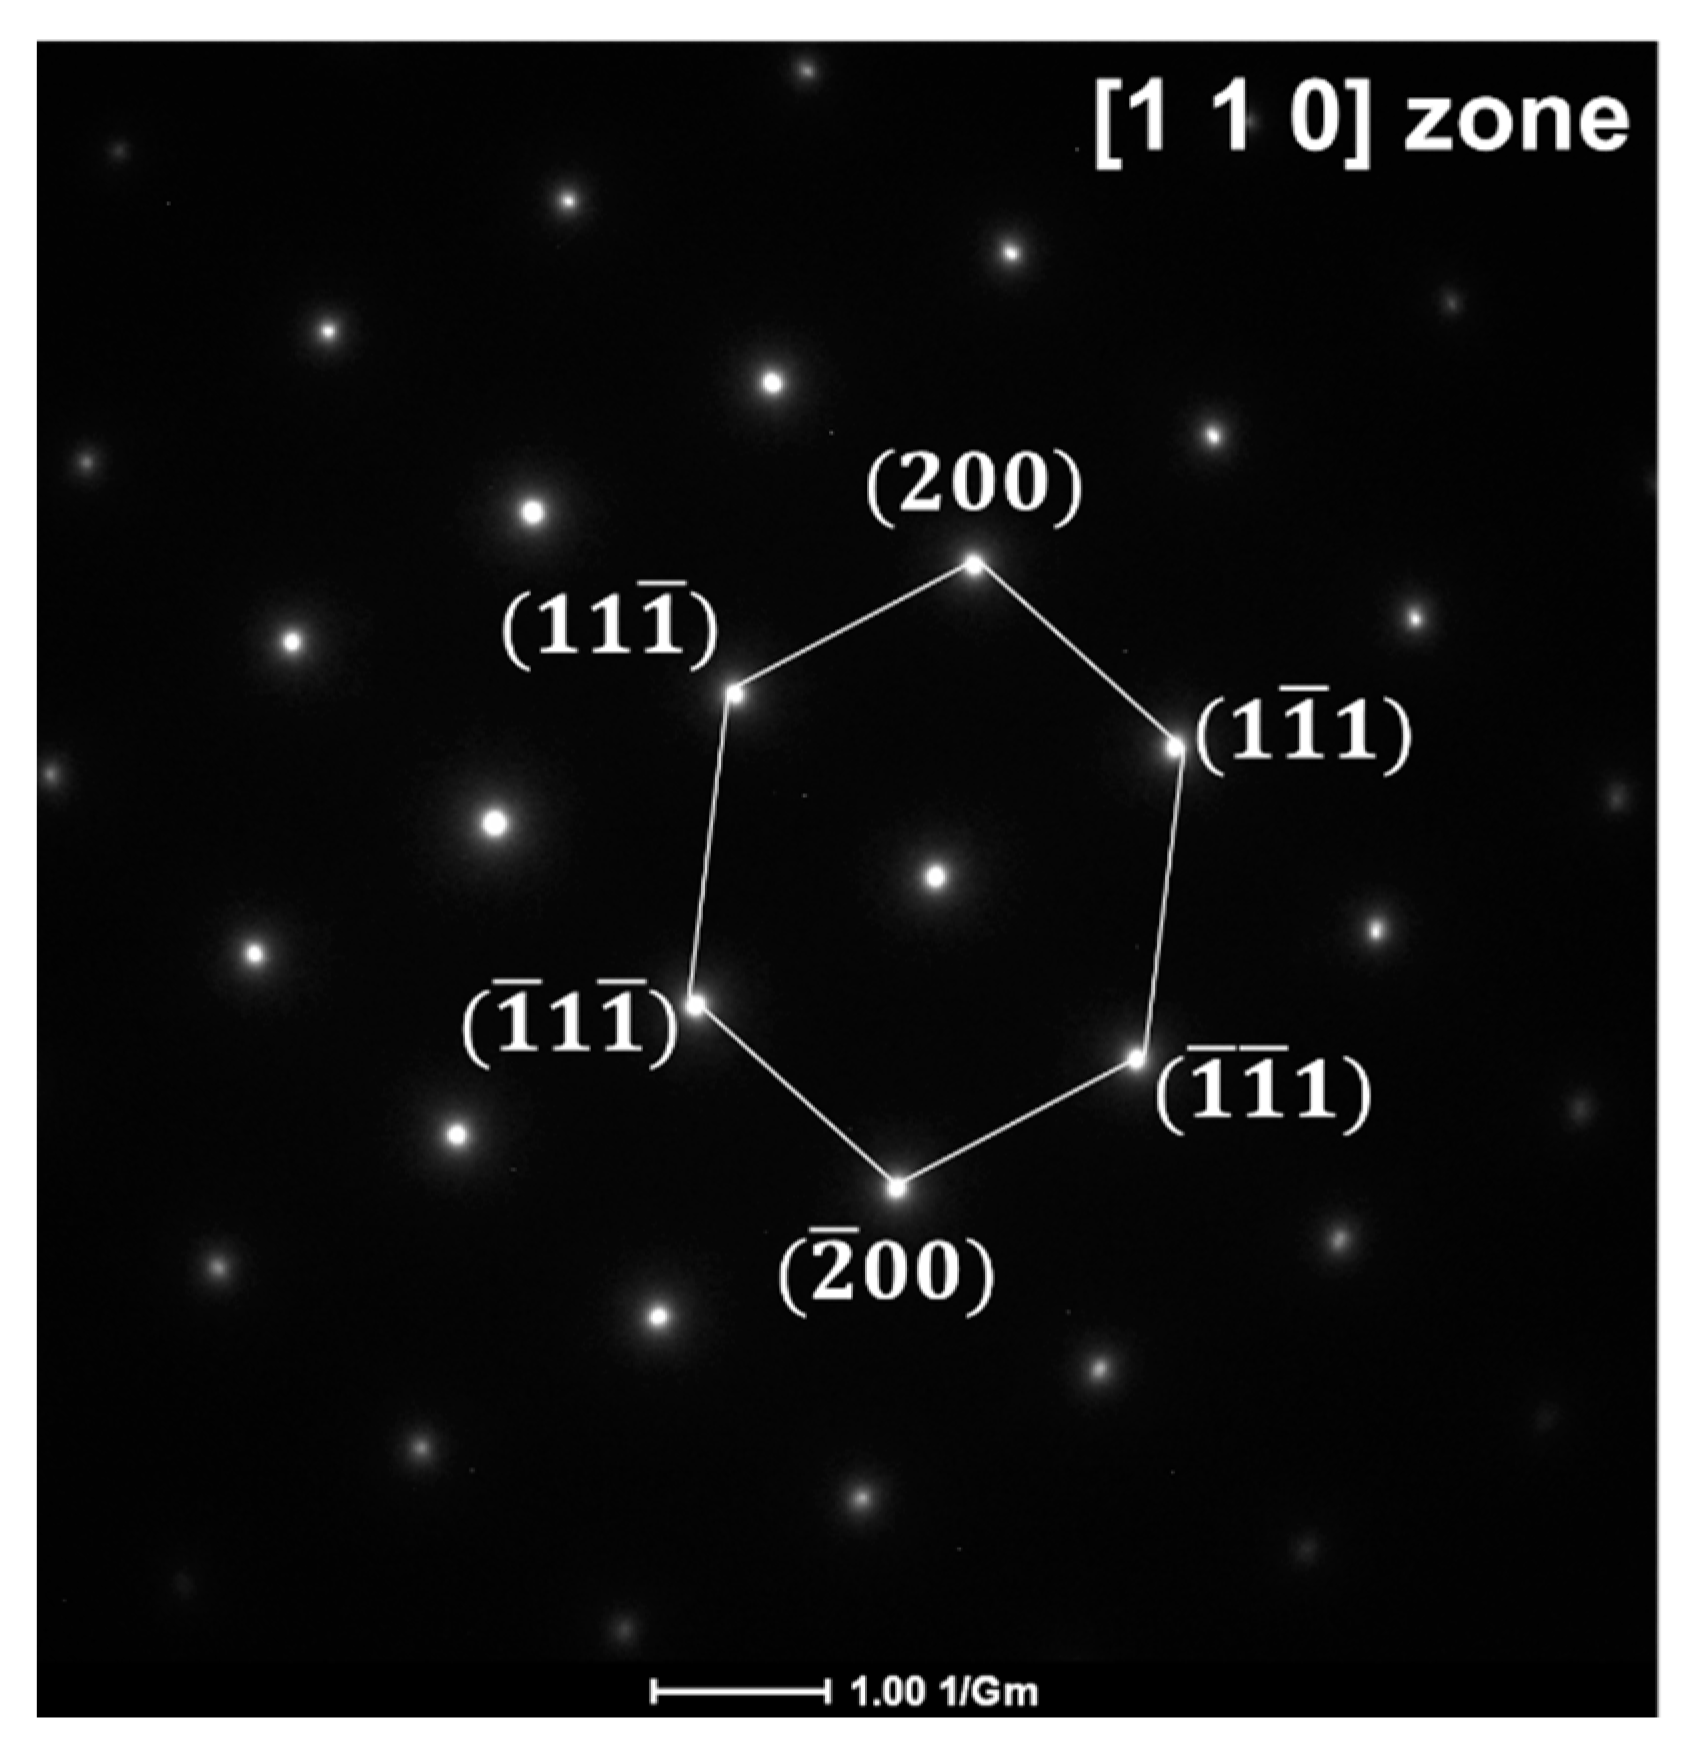
The overall mechanical behavior of all three alloys were similar regardless of their SFE value, especially the work hardening rate curve, which is highly associated to the dislocation structure and the high capacity of such materials to store dislocations [2]. The SFE for the 0Al alloy was predicted by thermodynamic modeling (31 mJ/m²) and determined experimentally (28 ± 9 mJ/m²), which is the lowest value amongst the alloys studied here. Lower SFE is associated with planar slip since the dislocations tend to dissociate into more spaced Shockley partials. Also, for this SFE value, it was expected some level of TWIP, based on [28]. Figure 13a presents the dislocations arrangement for the foil taken close to the fracture surface of 0Al sample. It is possible to observe a high dislocation density arranged in a cells configuration. Since this alloy has a relatively low stacking fault energy, it was expected that at early deformation stages it would form microbands of deformation in which the dislocations should show a predominantly planar slip [8,34]. Later, at higher deformation levels, the formation of the dislocation cells or twins would be expected [15]. As shown in Figure 12a, only the dislocations cells were observed, even though this sample deformed up to a true strain of about 35%. At this deformation level, Lee et al. already observed ε-martensite or mechanical twins for theoretical iso-SFE alloys [28]. Figure 14 presents a selected-area diffraction pattern (SADP) at a similar structure from what is presented in Figure 13a for the 0Al alloy. It is possible to observe that no twin spots were observed at the [110] zone axis, indicating that the presented structures were not composed by twins. In addition to the grains presented in this figure, several other grains and orientations were checked, and no twinning evidence was observed.
The 2.5Al presents the intermediate calculated SFE value of 45 mJ/m². This is considered by some authors as the maximum SFE value in which TWIP effect would take place [35]. As presented in Figure 11, no indication of deformation twins was seen by SEM, and Figure 12b shows that this alloy also presented a similar dislocation structure although with a different disposition. The cells arrangement type of dislocation structure is more commonly observed for higher SFE alloys, since these materials present a smaller partial dislocation separation and higher probability to cross slip [36]. Lower SFE alloys maintain for larger deformation a more planar dislocation structure due to its difficulty to cross slip.
Finally, the 5Al alloy presented the highest calculated SFE value, 57 mJ/m². Although high for this work, this is not generally considered a high SFE value if compared to other Fe–Mn–Al–C FCC alloys [8]. However, as can be seen in Figure 13c, the dislocations were also arranged in cell-like structure, which is more commonly observed for higher SFE alloys.
The work hardening rate curves represented in Figure 10 for the three alloys were all similar despite the Al content. This might happen because of the dislocation structure, similar for all the alloys, producing a similar work hardening ability. It is known that the dislocation structure is the main parameter which contributes to the work hardening and the deformation ability of these alloys [37]. Besides the change in the yield strength, the different levels of Al addition are shown to have little effect on the mechanical properties of high-Mn steels without the presence of C or Si, since all the alloys presented similar work hardening curves together with similar dislocation arrangements.
Although the SFE prediction by thermodynamic modeling presented some errors due to some simplifications introduced in the calculations, the presence of aluminum is mostly reported as one of the elements which increases steeply the SFE of the alloys [35,38]. Notwithstanding, according to the results observed in the present work, the aluminum had little effect on the dislocation behavior and overall work hardening rate. The main contribution of the Al is the increase the yield strength and decrease of the density.

4. Conclusions

It can be concluded that the aluminum had a direct effect on the solidification path of the high Mn Fe–Mn–Al ternary steels, and consequently on the microstructure, especially the grain size, for deposits produced by spray forming. Regardless of the composition, a highly homogeneous material was obtained directly from the liquid by spray forming processing technique.
The experimental SFE value was obtained through the weak beam dark field technique for the 0Al alloy and this result agreed with the thermodynamic model used to predict this parameter for the other alloys. The experimental value was 28 ± 9 mJ/m² in comparison to the 31 mJ/m² predicted by the thermodynamic calculations. For this reason, the model used in this work was considered consistent and the SFE values for the other alloys were used to interpret the mechanical behavior. The recrystallization curve was similar and a homogeneous microstructure with similar grain size values could be obtained for all the alloys after cold rolling and heat treatment. The presence of Al up to 5 wt. % slightly increased the yield strength because of solid solution hardening, without changing the work hardening behavior. Furthermore, the dislocation structure for all three alloys were comparable and cell-like structures could be seen, regardless of their SFE value.
Additionally, the TWIP effect was not observed for any composition despite the favorable SFE value and enough deformation levels, even the 0Al alloy with an experimentally determined SFE of 28 mJ/m² presented such mechanism. Therefore, the presence of the Al did not change considerably the work hardening ability and the mechanical properties were quite similar on samples without C additions. The main effects of the Al additions were the slightly increase in the yield strength and decrease on the theoretical density. Both effects are pursued by the automotive industry and this work contributes to an understanding of the Al effects on high-Mn alloys.

Author Contributions

Conceptualization, L.O., G.Z., and C.B.; formal analysis, L.O., F.C., W.B., and C.B.; funding acquisition, L.O., C.B., W.B., and C.K; investigation, L.O.; methodology, L.O., A.V., G.Z., and C.B.; project administration, C.B., W.B., and C.K.; resources, L.O., G.Z., W.B., C.B., and C.K.; software, L.O.; supervision, G.Z. and C.B.; validation, L.O., A.V., F.C., and G.Z.; writing—original draft preparation, L.O.; writing—review and editing, L.O., F.C., C.B., G.Z., A.V., W.B., and C.K.. All authors have read and agreed to the published version of the manuscript.

Funding

This research was funded by São Paulo Research Foundation, FAPESP, grant number 2013/05987-8 and 2017/14805-1; Coordenação de Aperfeiçoamento de Pessoal de Nível Superior–Brasil (CAPES)–Finance Code 001 and Conselho Nacional de Desenvolvimento Científico e Tecnológico/CNPq (process number 141053/2017-8).

Acknowledgments

The authors acknowledge the Laboratory of Structure Characterization from the Department of Materials Engineering at the Federal University of São Carlos (LCE/DEMa/UFSCar) for the microscopy facilities.

Conflicts of Interest

The authors declare no conflict of interest.

Appendix A

Table A1. Equations used to estimate the SFE of the alloys.
ParameterValueRef.
ρ4/(a2 N √3)[39]
ΔGγ->εΔGγ->εch + ΔGγ->εmag + ΔGex[11]
ΔGγ->εchXFeΔGγ->εFe + XMnΔGγ->εMn + XAlΔGγ->εAl + XCΔGγ->εC + XFeXMnΔΩγ->εFeMn + XFeXAlΔΩγ->εFeAl + XFeXCΔΩγ->εFeC + XMnXCΔΩγ->εMnC[38]
ΔGγ->εFe−2243.38 + 4.309 T[40]
ΔGγ->εMn−1000 + 1.123T[40]
ΔGγ->εAl5481 − 1.8T[40]
ΔGγ->εC−22,166[38]
ΔΩγ->εFeMn2180 + 532(XFe − XMn)[41]
ΔΩγ->εFeAl3326.28[38]
ΔΩγ->εFeC42,538.728[38]
ΔΩγ->εMnC26,910[39]
ΔGγ->εmagRT{ln[1 + βε/(μB)] f(T/ TεN) – ln[1 + βγ/(μB)] f(T/TγN)}[41]
τT/TεNT/TγN[41]
f1−{79τ−1/[140p] + 474/497[1/p − 1][τ3/6 + τ9/135 + τ15/600]}/D for τ ≤ 1−{τ−5/10 + τ−15/315 + τ−25/1500]}/D for τ > 1[41]
p0.28[42]
D2.342456517[42]
βε/μB0.62XMn − 4XC[43]
βγ/μB0.7XFe + 0.62XMn + 0.64XFeXMn − 4 XC[43]
TεN580 XMn[43]
TγN10XMn3 – 898.4XMn2 + 1176XMn – 1992XC – 661XAl + 152.4[44]
2ρΔGex5[22]
σγ−ε10[38]
Where a is the lattice parameter for the alloys (in this case it was estimated by the XRD analysis); N is the Avogadro’s number; ΔGγ->εch is the contribution of the chemical composition on the molar Gibbs Free Energy; ΔGγ->εmag is the magnetic contribution; ΔGex is the excess component for the Gibbs Free Energy taking into account the grain size; XFe, XMn, XAl, and XC are the respective molar fraction of the elements; T is the temperature.

References

  1. Rana, R.; Lahaye, C.; Ray, R.K. Overview of lightweight ferrous materials: strategies and promises. JOM 2014, 66, 1734–1746. [Google Scholar] [CrossRef] [Green Version]
  2. Madivala, M.; Schwedt, A.; Prahl, U.; Bleck, W. Strain hardening, damage and fracture behavior of Al-added high Mn TWIP steels. Metals 2019, 9, 367. [Google Scholar] [CrossRef] [Green Version]
  3. He, B.B.; Hu, B.; Yen, H.W.; Cheng, G.J.; Wang, Z.K.; Luo, H.W.; Huang, M.X. High dislocation density-induced large ductility in deformed and partitioned steels. Science 2017, 357, 1029–1032. [Google Scholar] [CrossRef] [PubMed] [Green Version]
  4. Chen, S.; Rana, R.; Haldar, A.; Ray, R.K. Current state of Fe-Mn-Al-C low density steels. Prog. Mater. Sci. 2017, 89, 345–391. [Google Scholar] [CrossRef]
  5. Bouaziz, O.; Allain, S.; Scott, C.P.; Cugy, P.; Barbier, D. High manganese austenitic twinning induced plasticity steels: A review of the microstructure properties relationships. Curr. Opin. Solid ST M 2011, 15, 141–168. [Google Scholar] [CrossRef]
  6. Grässel, O.; Krüger, L.; Frommeyer, G.; Meyer, L.W. High strength Fe-Mn-(Al, Si) TRIP/TWIP steels development—properties—application. Int. J. Plasticity 2000, 16, 1391–1409. [Google Scholar] [CrossRef]
  7. De Barbieri, F.; Cerda, F.C.; Pérez-Ipiña, J.; Artigas, A.; Monsalve, A. Temperature dependence of the microstructure and mechanical properties of a twinning-induced plasticity steel. Metals 2018, 8, 262. [Google Scholar] [CrossRef] [Green Version]
  8. Yoo, J.D.; Park, K.T. Microband-induced plasticity in a high Mn-Al-C light steel. Mat. Sci. Eng. A 2008, 496, 417–424. [Google Scholar] [CrossRef]
  9. Lee, S.J.; Han, J.; Lee, C.Y.; Park, I.J.; Lee, Y.K. Elastic strain energy induced by epsilon martensitic transformation and its contribution to the stacking-fault energy of austenite in Fe-15Mn-xC alloys. J. Alloys Compd. 2014, 617, 588–596. [Google Scholar] [CrossRef]
  10. Saeed-Akbari, A.; Imlau, J.; Prahl, U.; Bleck, W. Derivation and variation in composition-dependent stacking fault energy maps based on subregular solution model in high-manganese steels. Metall. Mater. Trans. A 2009, 40, 3076–3090. [Google Scholar] [CrossRef]
  11. Zambrano, O.A. Stacking fault energy maps of Fe–Mn–Al–C–Si steels: Effect of temperature, grain size, and variations in compositions. J. Eng. Mater. Tech. 2016, 138, 041010. [Google Scholar] [CrossRef]
  12. Olson, G.B.; Cohen, M. A general mechanism of martensitic nucleation. Metall. Trans. A 1976, 7, 1897–1904. [Google Scholar]
  13. De Cooman, B.C.; Estrin, Y.; Kim, S.K. Twinning-induced plasticity (TWIP) steels. Acta Mater. 2017, 142, 283–362. [Google Scholar] [CrossRef]
  14. Jin, J.E.; Lee, Y.K. Effects of Al on microstructure and tensile properties of C-bearing high Mn TWIP steel. Acta Mater. 2012, 60, 1680–1688. [Google Scholar] [CrossRef]
  15. Park, K.T.; Jin, K.G.; Han, S.H.; Hwang, S.W.; Choi, K.; Lee, C.S. Stacking fault energy and plastic deformation of fully austenitic high manganese steels: Effect of Al addition. Mat. Sci. Eng. A 2010, 527, 3651–3661. [Google Scholar] [CrossRef]
  16. Kozłowska, A.; Grzegorczyk, B.; Morawiec, M.; Grajcar, A. Explanation of the PLC effect in advanced high-strength medium-Mn steels: A review. Materials 2019, 12, 4175. [Google Scholar] [CrossRef] [PubMed] [Green Version]
  17. Kim, H.; Suh, D.; Kim, N.J. Fe–Al–Mn–C lightweight structural alloys: a review on the microstructures and mechanical properties. Sci. Technol. Adv. Mat. 2013, 14, 014205. [Google Scholar] [CrossRef]
  18. Grant, P.S. Solidification in Spray Forming. Metall. Mater. Trans. A 2007, 38, 1520–1529. [Google Scholar] [CrossRef]
  19. Pierce, D.T.; Jiménez, J.A.; Bentley, J.; Raabe, D.; Oskay, C.; Wittig, J.E. The influence of manganese content on the stacking fault and austenite/ε-martensite interfacial energies in Fe-Mn-(Al-Si) steels investigated by experiment and theory. Acta Mater. 2014, 68, 238–253. [Google Scholar] [CrossRef]
  20. Lu, J.; Hultman, L.; Holmström, E.; Antonsson, K.H.; Grehk, M.; Li, W.; Vitos, L.; Golpayegani, A. Stacking fault energies in austenitic stainless steels. Acta Mater. 2016, 111, 39–46. [Google Scholar] [CrossRef]
  21. Pierce, D.T.; Nowag, K.; Montagne, A.; Jiménez, J.A.; Wittig, J.E.; Ghisleni, R. Single crystal elastic constants of high-manganese transformation- and twinning-induced plasticity steels determined by a new method utilizing nanoindentation. Mat. Sci. Eng. A 2013, 578, 134–139. [Google Scholar] [CrossRef]
  22. Lee, Y.-K.; Choi, C.-S. Driving force for γ→ε martensitic transformation and stacking fault energy of γ in Fe-Mn binary system. Metall. Mater. Trans. A 2000, 31, 355–360. [Google Scholar] [CrossRef]
  23. Zepon, G.; Ellendt, N.; Uhlenwinkel, V.; Bolfarini, C. Solidification sequence of spray-formed steels. Metall. Mater. Trans. A 2016, 47, 842–851. [Google Scholar] [CrossRef]
  24. Zepon, G.; Fernandes, J.F.M.; Otani, L.B.; Bolfarini, C. Stable eutectic formation in spray-formed cast iron. Metall. Mater. Trans. A 2020, 51, 798–808. [Google Scholar] [CrossRef]
  25. Asgari, S.; El-Danaf, E.; Kalidindi, S.R.; Doherty, R.D. Strain hardening regimes and microstructural evolution during large strain compression of low stacking fault energy fcc alloys that form deformation twins. Metall. Mater. Trans. A 1997, 28, 1781–1795. [Google Scholar] [CrossRef]
  26. Kalidindi, S.R. Modeling the strain hardening response of low SFE FCC alloys. Int. J. Plasticity 1998, 14, 1265–1277. [Google Scholar] [CrossRef]
  27. Lee, Y.K. Microstructural evolution during plastic deformation of twinning-induced plasticity steels. Scr. Mater. 2012, 66, 1002–1006. [Google Scholar] [CrossRef]
  28. Lee, S.-J.; Han, J.; Lee, S.; Kang, S.-H.; Lee, S.-M.; Lee, Y.-K. Design for Fe-high Mn alloy with an improved combination of strength and ductility. Sci. Rep.-UK 2017, 7, 3573. [Google Scholar] [CrossRef] [Green Version]
  29. Rahman, K.M.; Vorontsov, V.A.; Dye, D. The effect of grain size on the twin initiation stress in a TWIP steel. Acta Mater. 2015, 89, 247–257. [Google Scholar] [CrossRef] [Green Version]
  30. Narita, N.; Takamura, J. Deformation twinning in silver-and copper-alloy crystals. Philos. Mag. 1974, 29, 1001–1028. [Google Scholar]
  31. Mahajan, S.; Chin, G.Y. Formation of deformation twins in f.c.c. crystals. Acta Metall. 1973, 21, 1353–1363. [Google Scholar] [CrossRef]
  32. Gutierrez-Urrutia, I.; Zaefferer, S.; Raabe, D. The effect of grain size and grain orientation on deformation twinning in a Fe–22wt. % Mn–0.6wt. % C TWIP steel. Mat. Sci. Eng. A 2010, 527, 3552–3560. [Google Scholar] [CrossRef]
  33. Kim, J.K.; Kwon, M.H.; De Cooman, B.C. On the deformation twinning mechanisms in twinning-induced plasticity steel. Acta Mater. 2017, 141, 444–455. [Google Scholar] [CrossRef]
  34. Tang, Z.; Huang, J.; Ding, H.; Cai, Z.; Zhang, D.; Misra, D. Effect of Deformation Temperature on Mechanical Properties and Deformation Mechanisms of Cold-Rolled Low C High Mn TRIP/TWIP Steel. Metals 2018, 8, 476. [Google Scholar] [CrossRef] [Green Version]
  35. Kim, J.K.; De Cooman, B.C. Stacking fault energy and deformation mechanisms in Fe-xMn-0.6C-yAl TWIP steel. Mat. Sci. Eng. A 2016, 676, 216–231. [Google Scholar] [CrossRef]
  36. Zhang, L.; Song, R.; Zhao, C.; Yang, F. Work hardening behavior involving the substructural evolution of an austenite–ferrite Fe–Mn–Al–C steel. Mat. Sci. Eng. A 2015, 640, 225–234. [Google Scholar] [CrossRef]
  37. Luo, Z.C.; Huang, M.X. Revisit the role of deformation twins on the work-hardening behaviour of twinning-induced plasticity steels. Scripta Mater. 2018, 142, 28–31. [Google Scholar] [CrossRef]
  38. Yang, W.S.; Wan, C.M. The influence of aluminium content to the stacking fault energy in Fe-Mn-Al-C alloy system. J. Mater. Sci. 1990. [Google Scholar] [CrossRef]
  39. Allain, S.; Chateau, J.P.; Bouaziz, O.; Migot, S.; Guelton, N. Correlations between the calculated stacking fault energy and the plasticity mechanisms in Fe-Mn-C alloys. Mat. Sci. Eng. A 2004, 387–389, 158–162. [Google Scholar] [CrossRef]
  40. Dinsdale, A.T. Sgte data for pure elements. Calphad 1991, 15, 317–425. [Google Scholar] [CrossRef]
  41. Huang, W. An assessment of the Fe-Mn system. Calphad 1989, 13, 243–252. [Google Scholar] [CrossRef]
  42. Li, L.; Hsu(Xu Zuyao), T.Y. Gibbs free energy evaluation of the fcc(γ) and hcp(ε) phases in Fe-Mn-Si alloys. Calphad 1997, 21, 443–448. [Google Scholar] [CrossRef]
  43. Dumay, A.; Chateau, J.P.; Allain, S.; Migot, S.; Bouaziz, O. Influence of addition elements on the stacking-fault energy and mechanical properties of an austenitic Fe-Mn-C steel. Mat. Sci. Eng. A 2008, 483–484, 184–187. [Google Scholar] [CrossRef]
  44. Kusakin, P.; Belyakov, A.; Molodov, D.A.; Kaibyshev, R. On the effect of chemical composition on yield strength of TWIP steels. Mater. Sci. Eng. A 2017, 687, 82–84. [Google Scholar] [CrossRef]
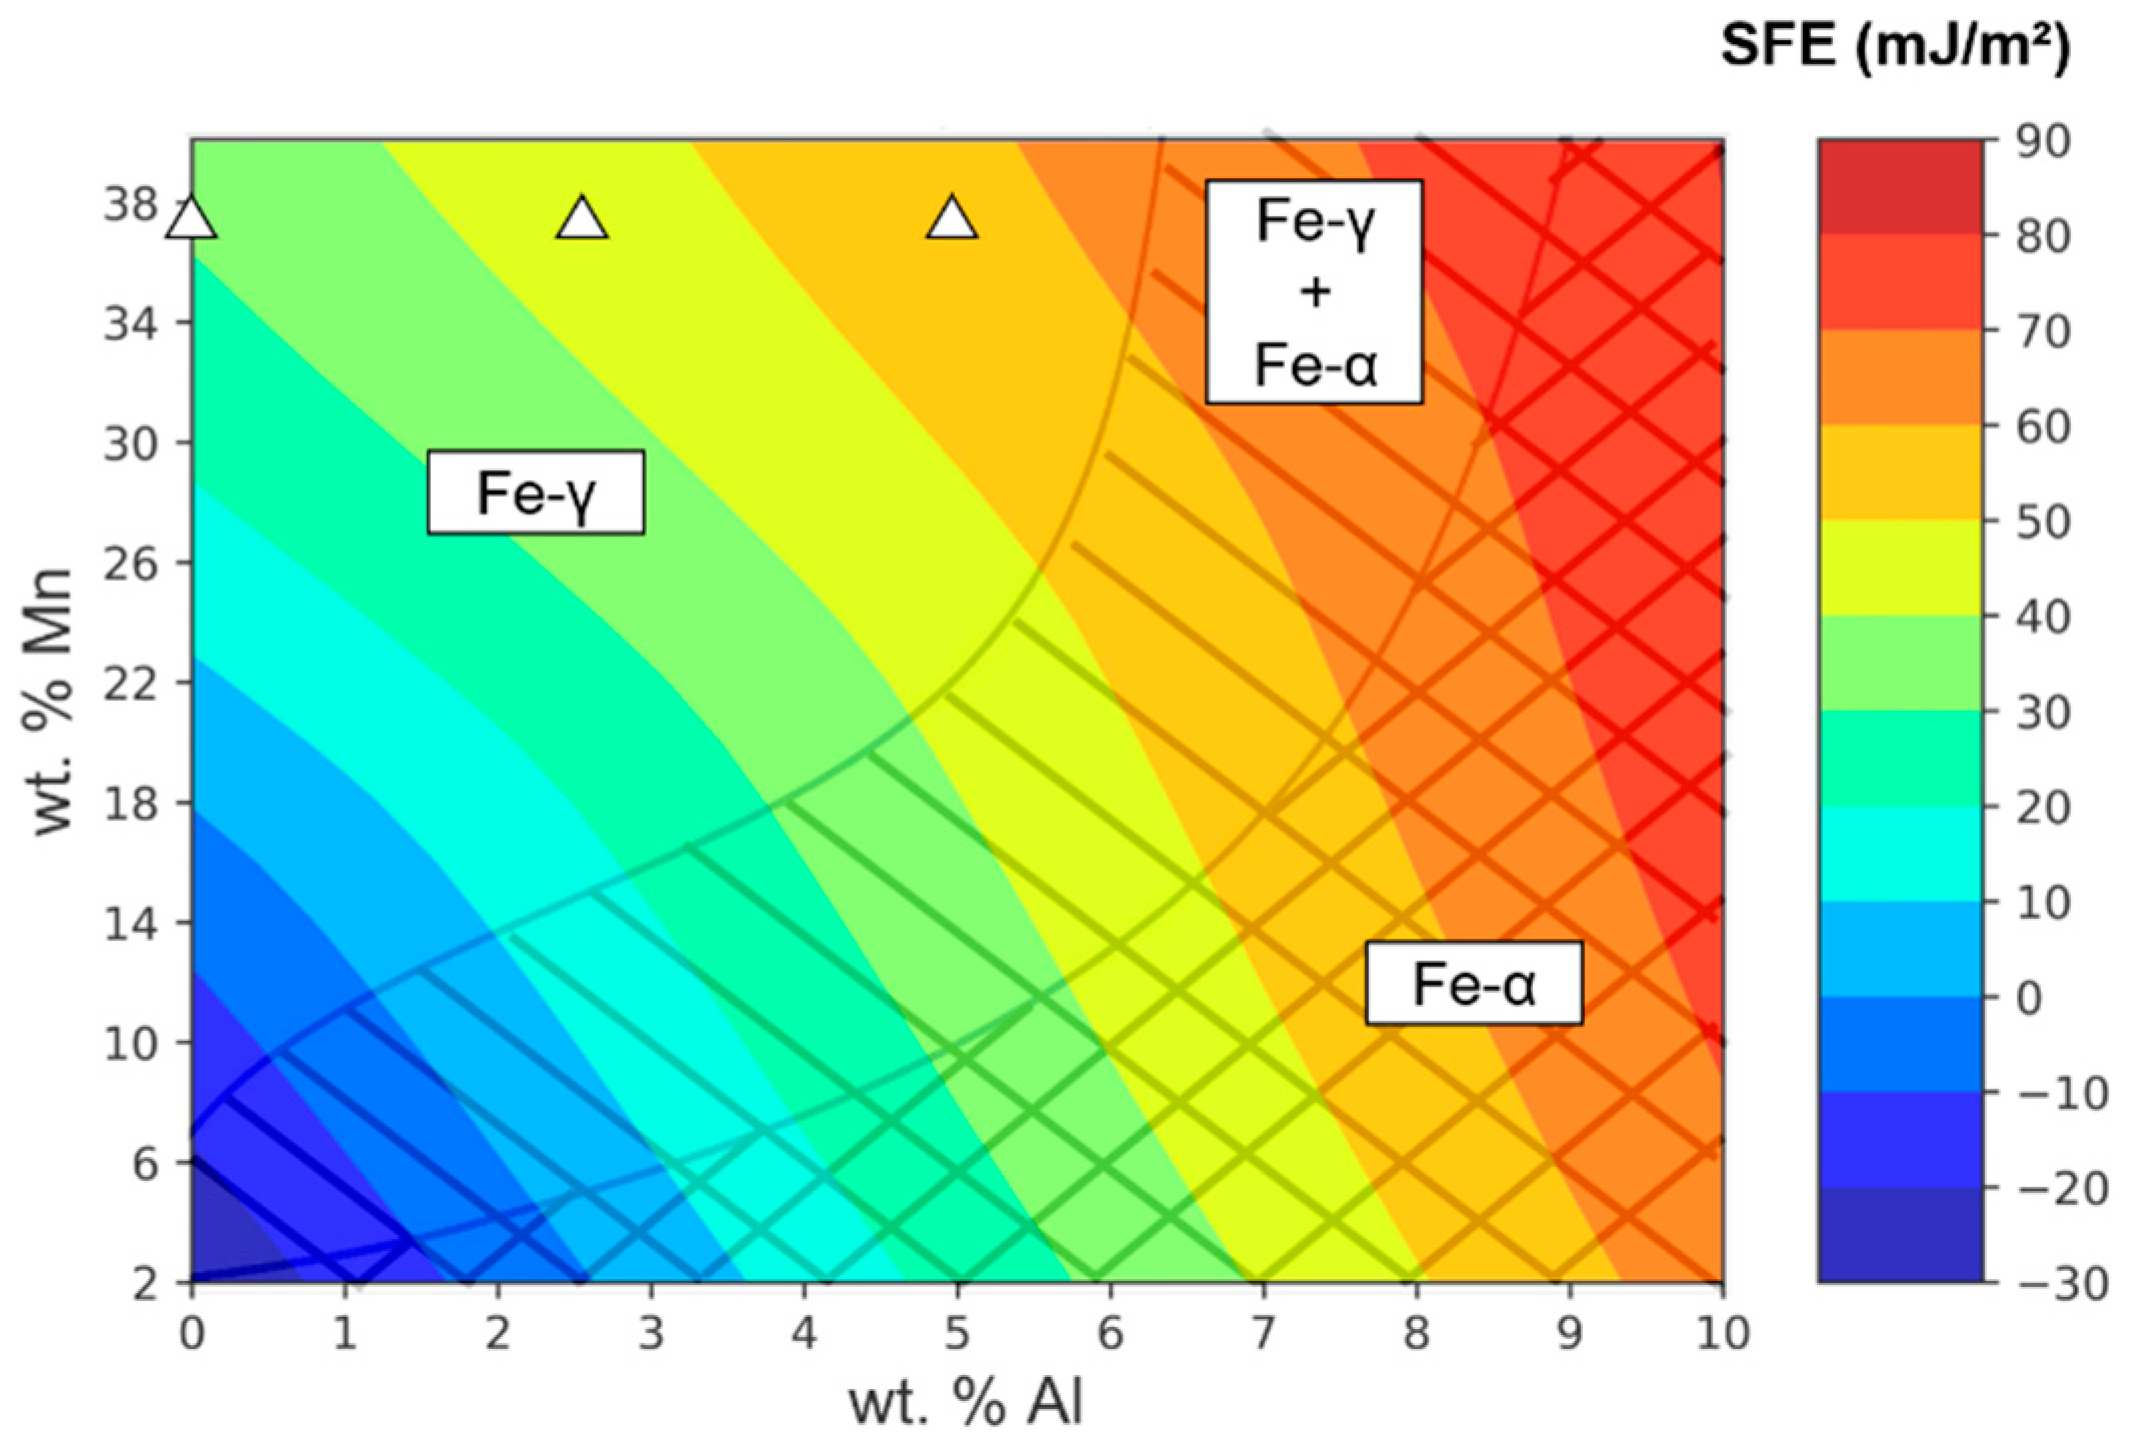
Figure 1. Calculated Stacking Fault Energy (SFE) values of ternary Fe–Mn–Al alloys. The triangles represent the chemical composition for the alloys of the present work.
Metals 10 00352 g001
Figure 2. (a) An example of a weak beam dark field transmission electron microscopy (WBDF–TEM) image of a dissociated dislocation used to determine the distance between the Shockley partials for the 0Al alloy and (b) partial dislocation spacing as a function of total dislocation character angle for different dislocations.
Metals 10 00352 g002
Figure 3. Stable phases calculated by the CALPHAD method (Thermo-Calc® software with the TCFE7 database) at different temperatures for the (a) 0Al, (b) 2.5Al, and (c) 5Al alloys.
Metals 10 00352 g003
Figure 4. Optical micrographs of the droplet microstructure for the (a) 0Al, (b) 2.5Al, and (c) 5Al.
Metals 10 00352 g004
Figure 5. Optical micrographs of the as-spray deposit microstructure for the (a) 0Al, (b) 2.5Al, and (c) 5Al.
Metals 10 00352 g005
Figure 6. Inverse pole figure (IPF) map of the 0Al as-sprayed ingot.
Metals 10 00352 g006
Figure 7. XRD patterns for the overspray powder of the 0Al, 2.5Al, and 5Al alloys.
Metals 10 00352 g007
Figure 8. (a) Recrystallization curves with the microstructures of the 2.5Al heat treated at (b) 500, (c) 750, and (d) 900 °C.
Metals 10 00352 g008
Figure 9. IPF maps showing the recrystallized microstructures of (a) 0Al, (b) 2.5Al, and (c) 5Al.
Metals 10 00352 g009
Figure 10. (a) True stress–strain curves and (b) work hardening rate for the 0Al, 2.5Al, and 5Al alloys.
Metals 10 00352 g010
Figure 11. SEM images of the microstructures of the samples after the tensile test of the (a) 0Al, (b) 2.5Al, and (c) 5Al alloys.
Metals 10 00352 g011
Figure 12. SEM–Secondary Electrons images of the fracture surfaces of the (a) 0Al, (b) 2.5Al, and (c) 5Al alloys.
Metals 10 00352 g012aMetals 10 00352 g012b
Figure 13. Scanning Transmission Electron Microscopy (STEM)–Bright Field (BF) images of the (a) 0Al, (b) 2.5Al, and (c) 5Al samples after the tensile test.
Metals 10 00352 g013
Figure 14. Selected Area Diffraction Pattern (SADP) for the sample 0Al in a similar structure as presented in Figure 13a.
Metals 10 00352 g014
Table 1. Chemical composition of the alloys from the present work. The Mn and Al contents were measured by EDS and the C content was measured by the inert gas fusion method.
AlloyMnAlCFe
0Al36.8900.02Bal.
2.5Al38.222.460.01Bal.
5Al38.264.960.01Bal.
Table 2. Spray forming parameters.
Pouring temperature1793 K (1520 °C)
Atomization gasNitrogen
Atomization pressure0.5 MPa
Feedstock mass4.0 kg
Gas–metal ratio (GMR)1.7
Flight distance200 mm
Substrate materialMild steel
Diameter of the substrate300 mm
Rotation of the substrate20 rpm
Table 3. Mechanical properties of the alloys (Ultimate Tensile Strength (UTS)).
AlloyσyUTSεtotal
0Al207 MPa484 MPa42.5%
2.5Al236 MPa497 MPa37.5%
5Al253 MPa488 MPa30.9%