A Novel Ultrasonic Cleaning Tank Developed by Harmonic Response Analysis and Computational Fluid Dynamics


Abstract
1. Introduction
2. Theoretical Background
2.1. Harmonic Response Analysis (HRA)
2.2. Computational Fluid Dynamics (CFD)
3. Methodology
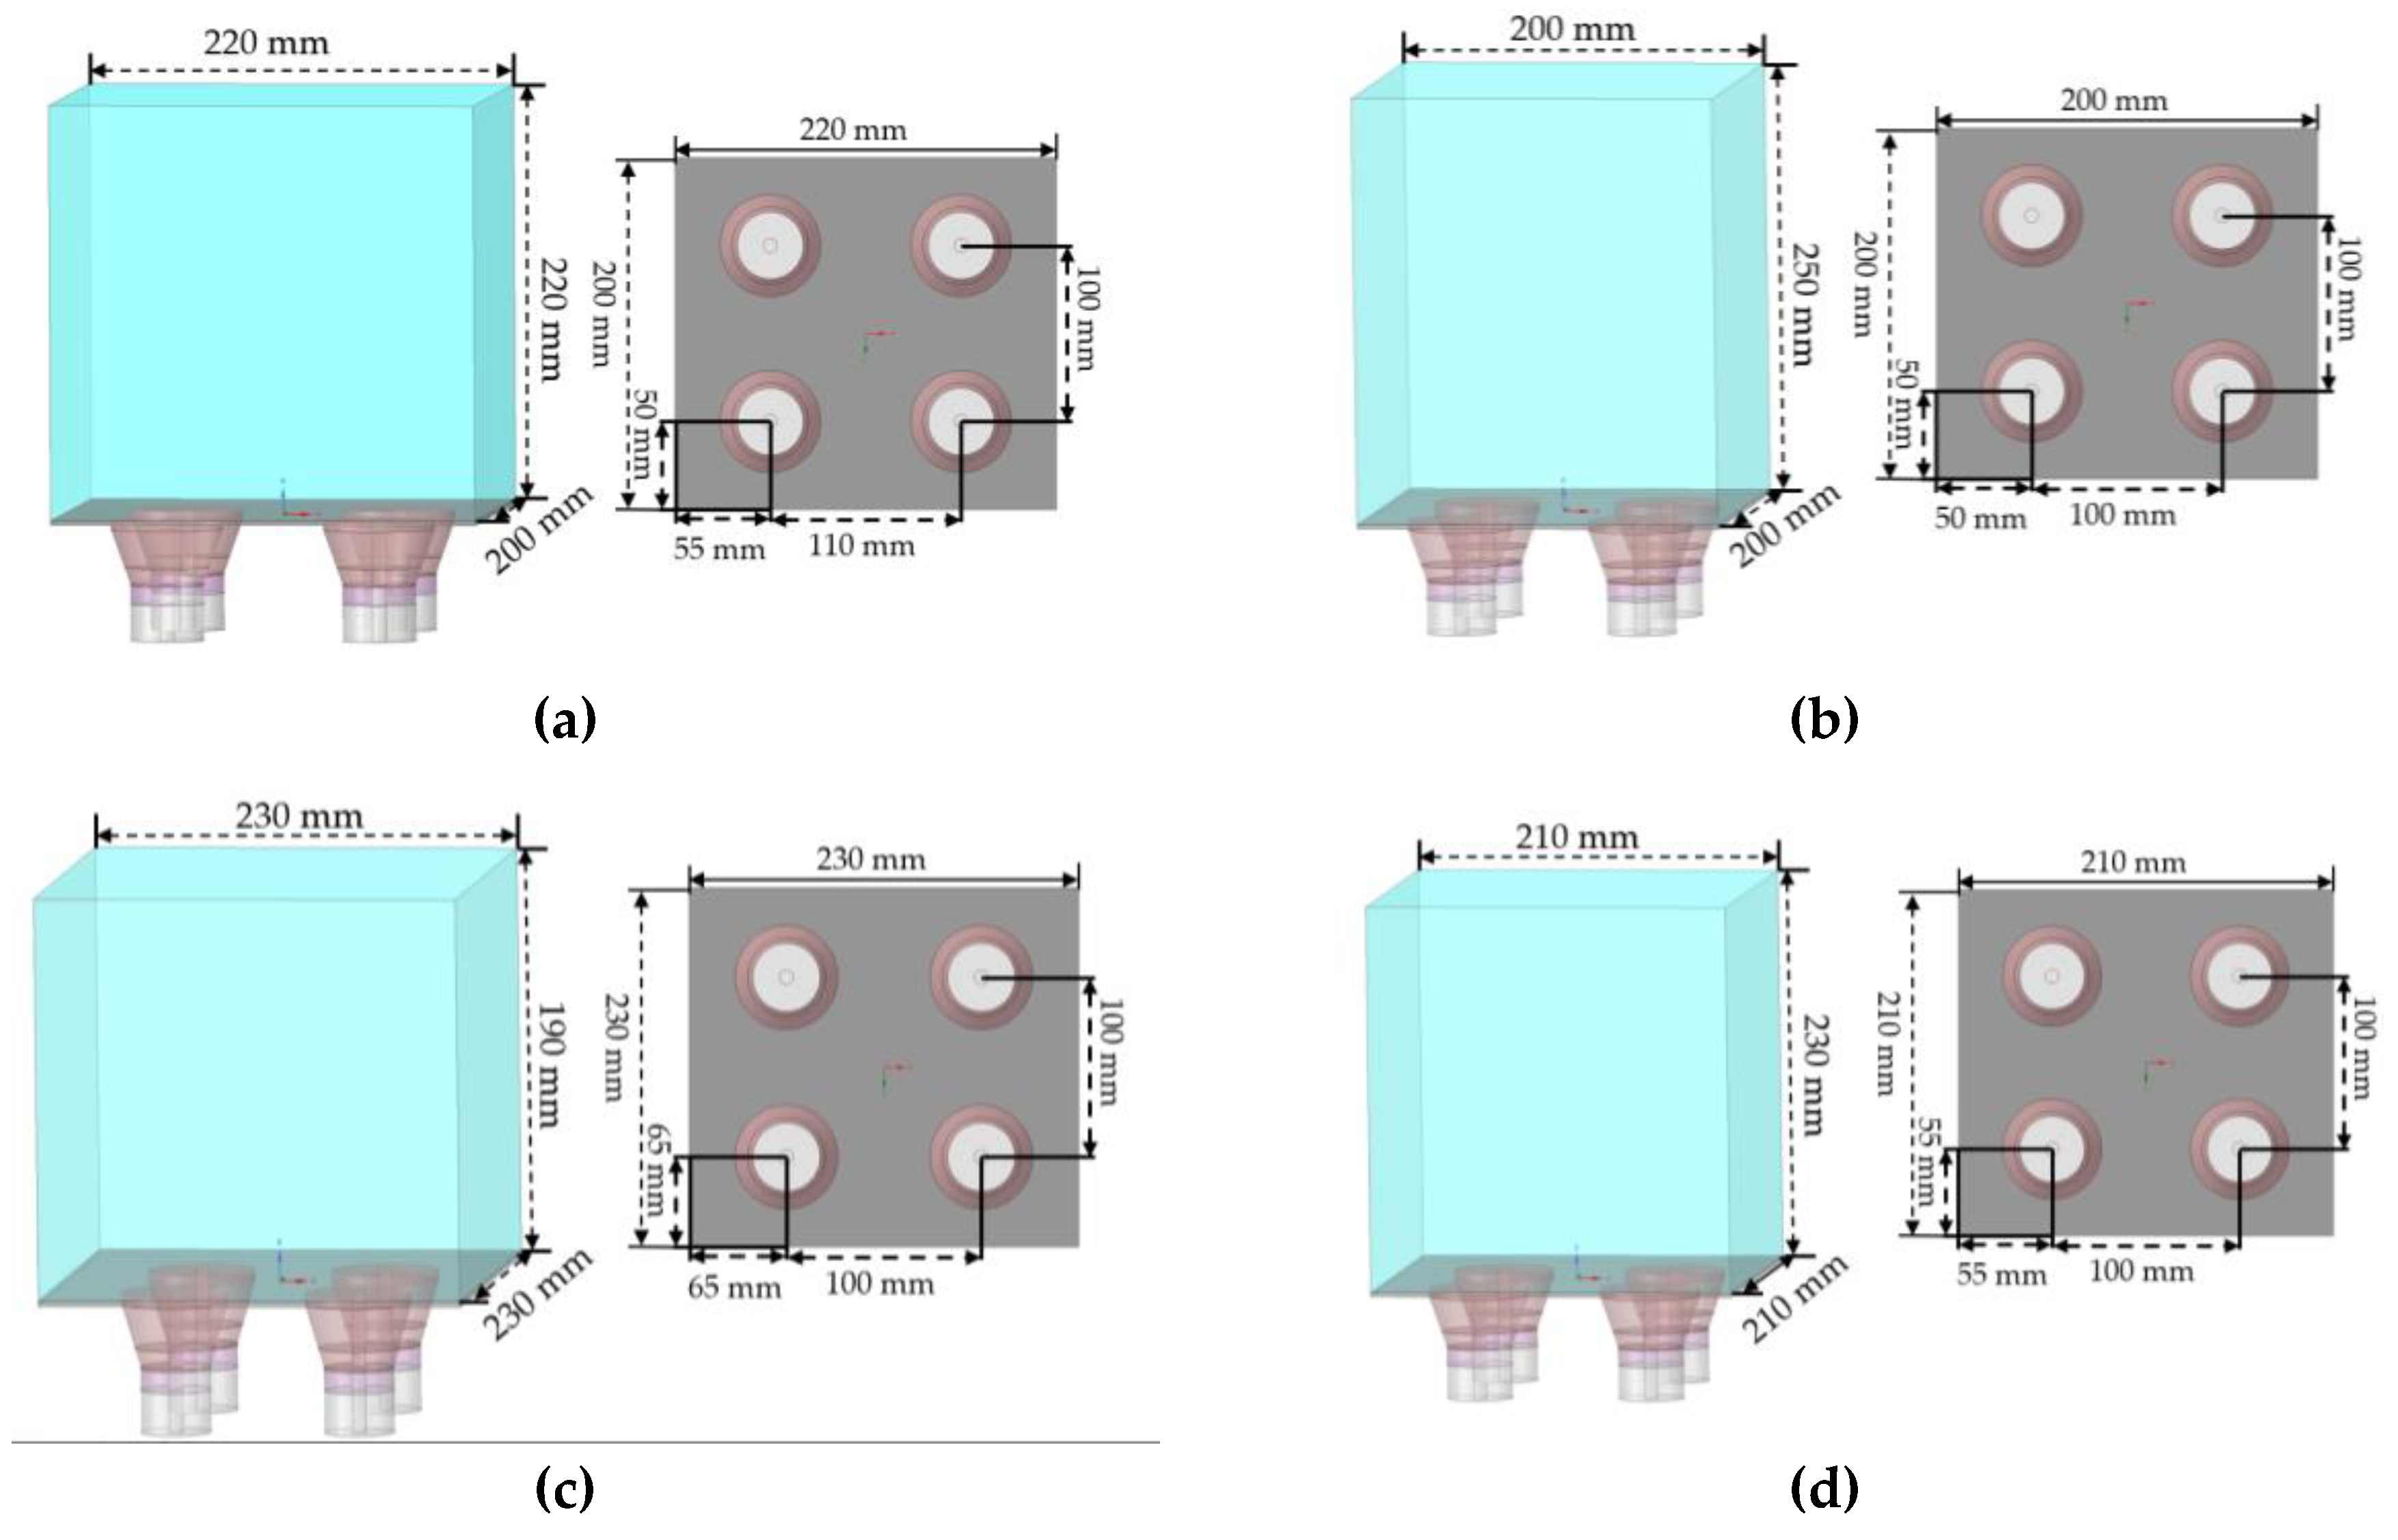
3.1. A Conventional Ultrasonic Cleaning Tank
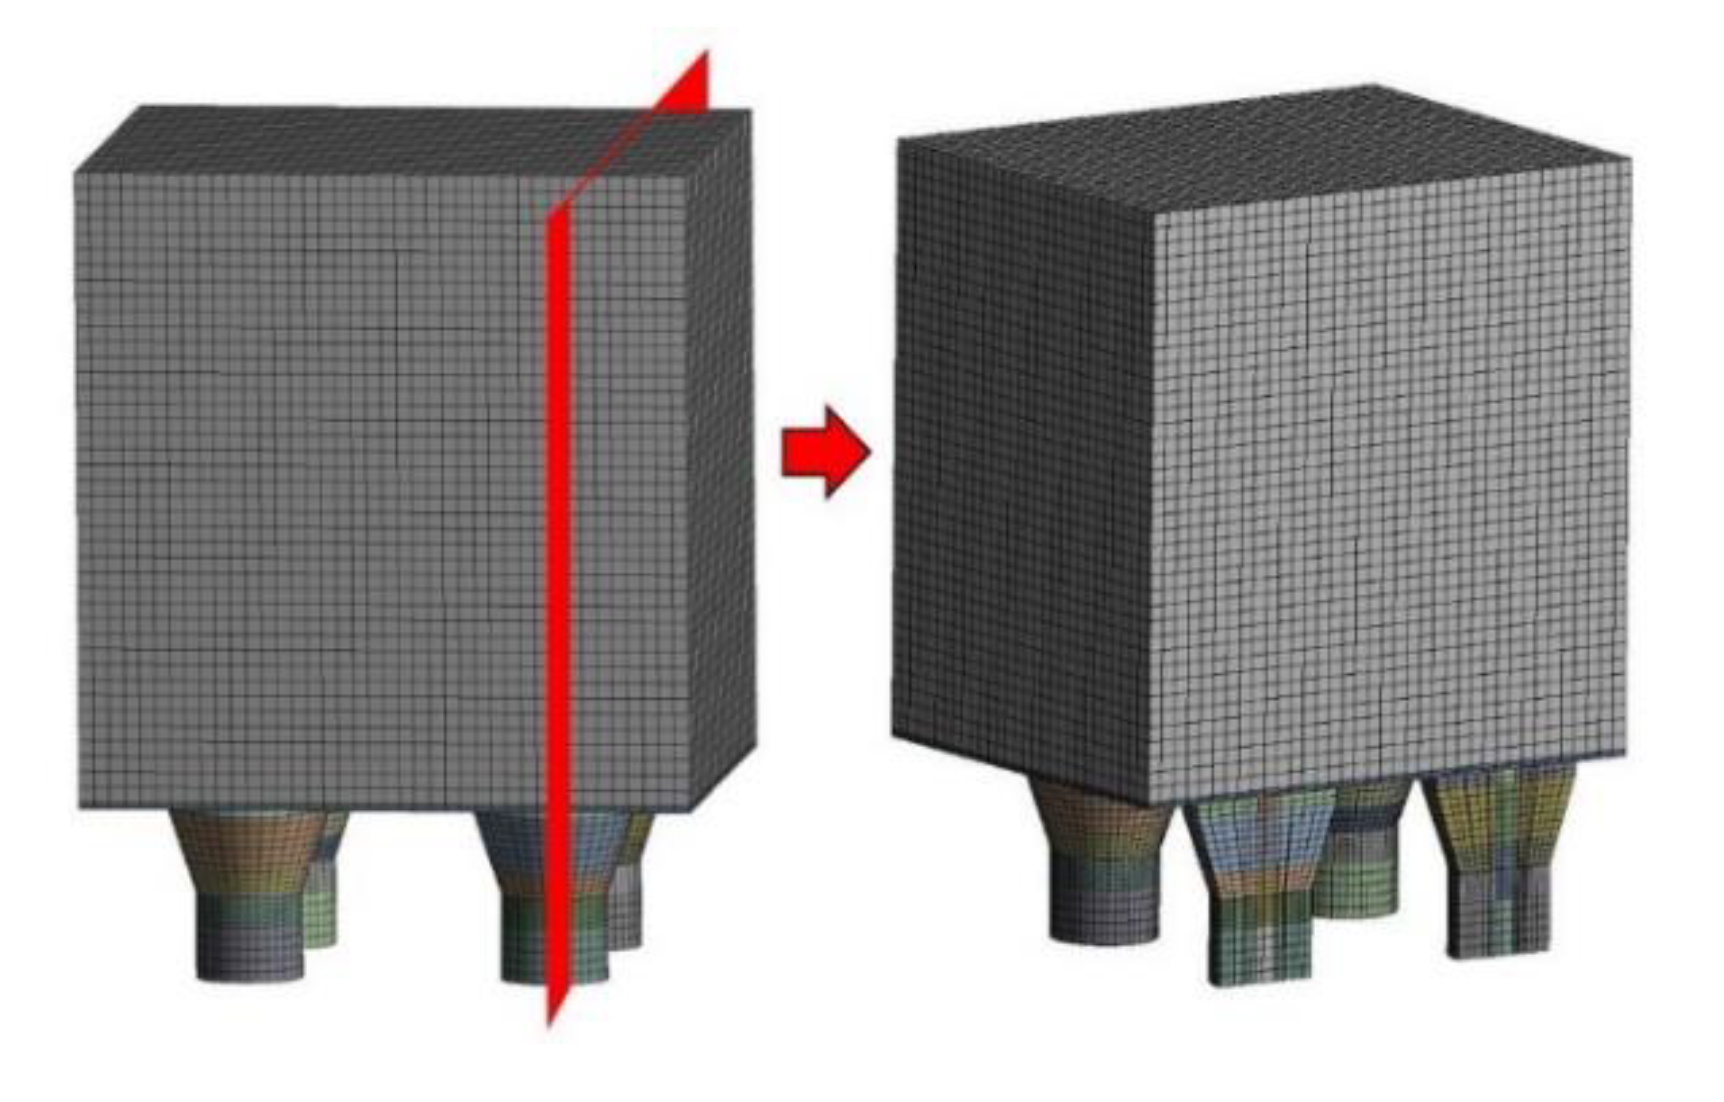
3.2. HRA Setting
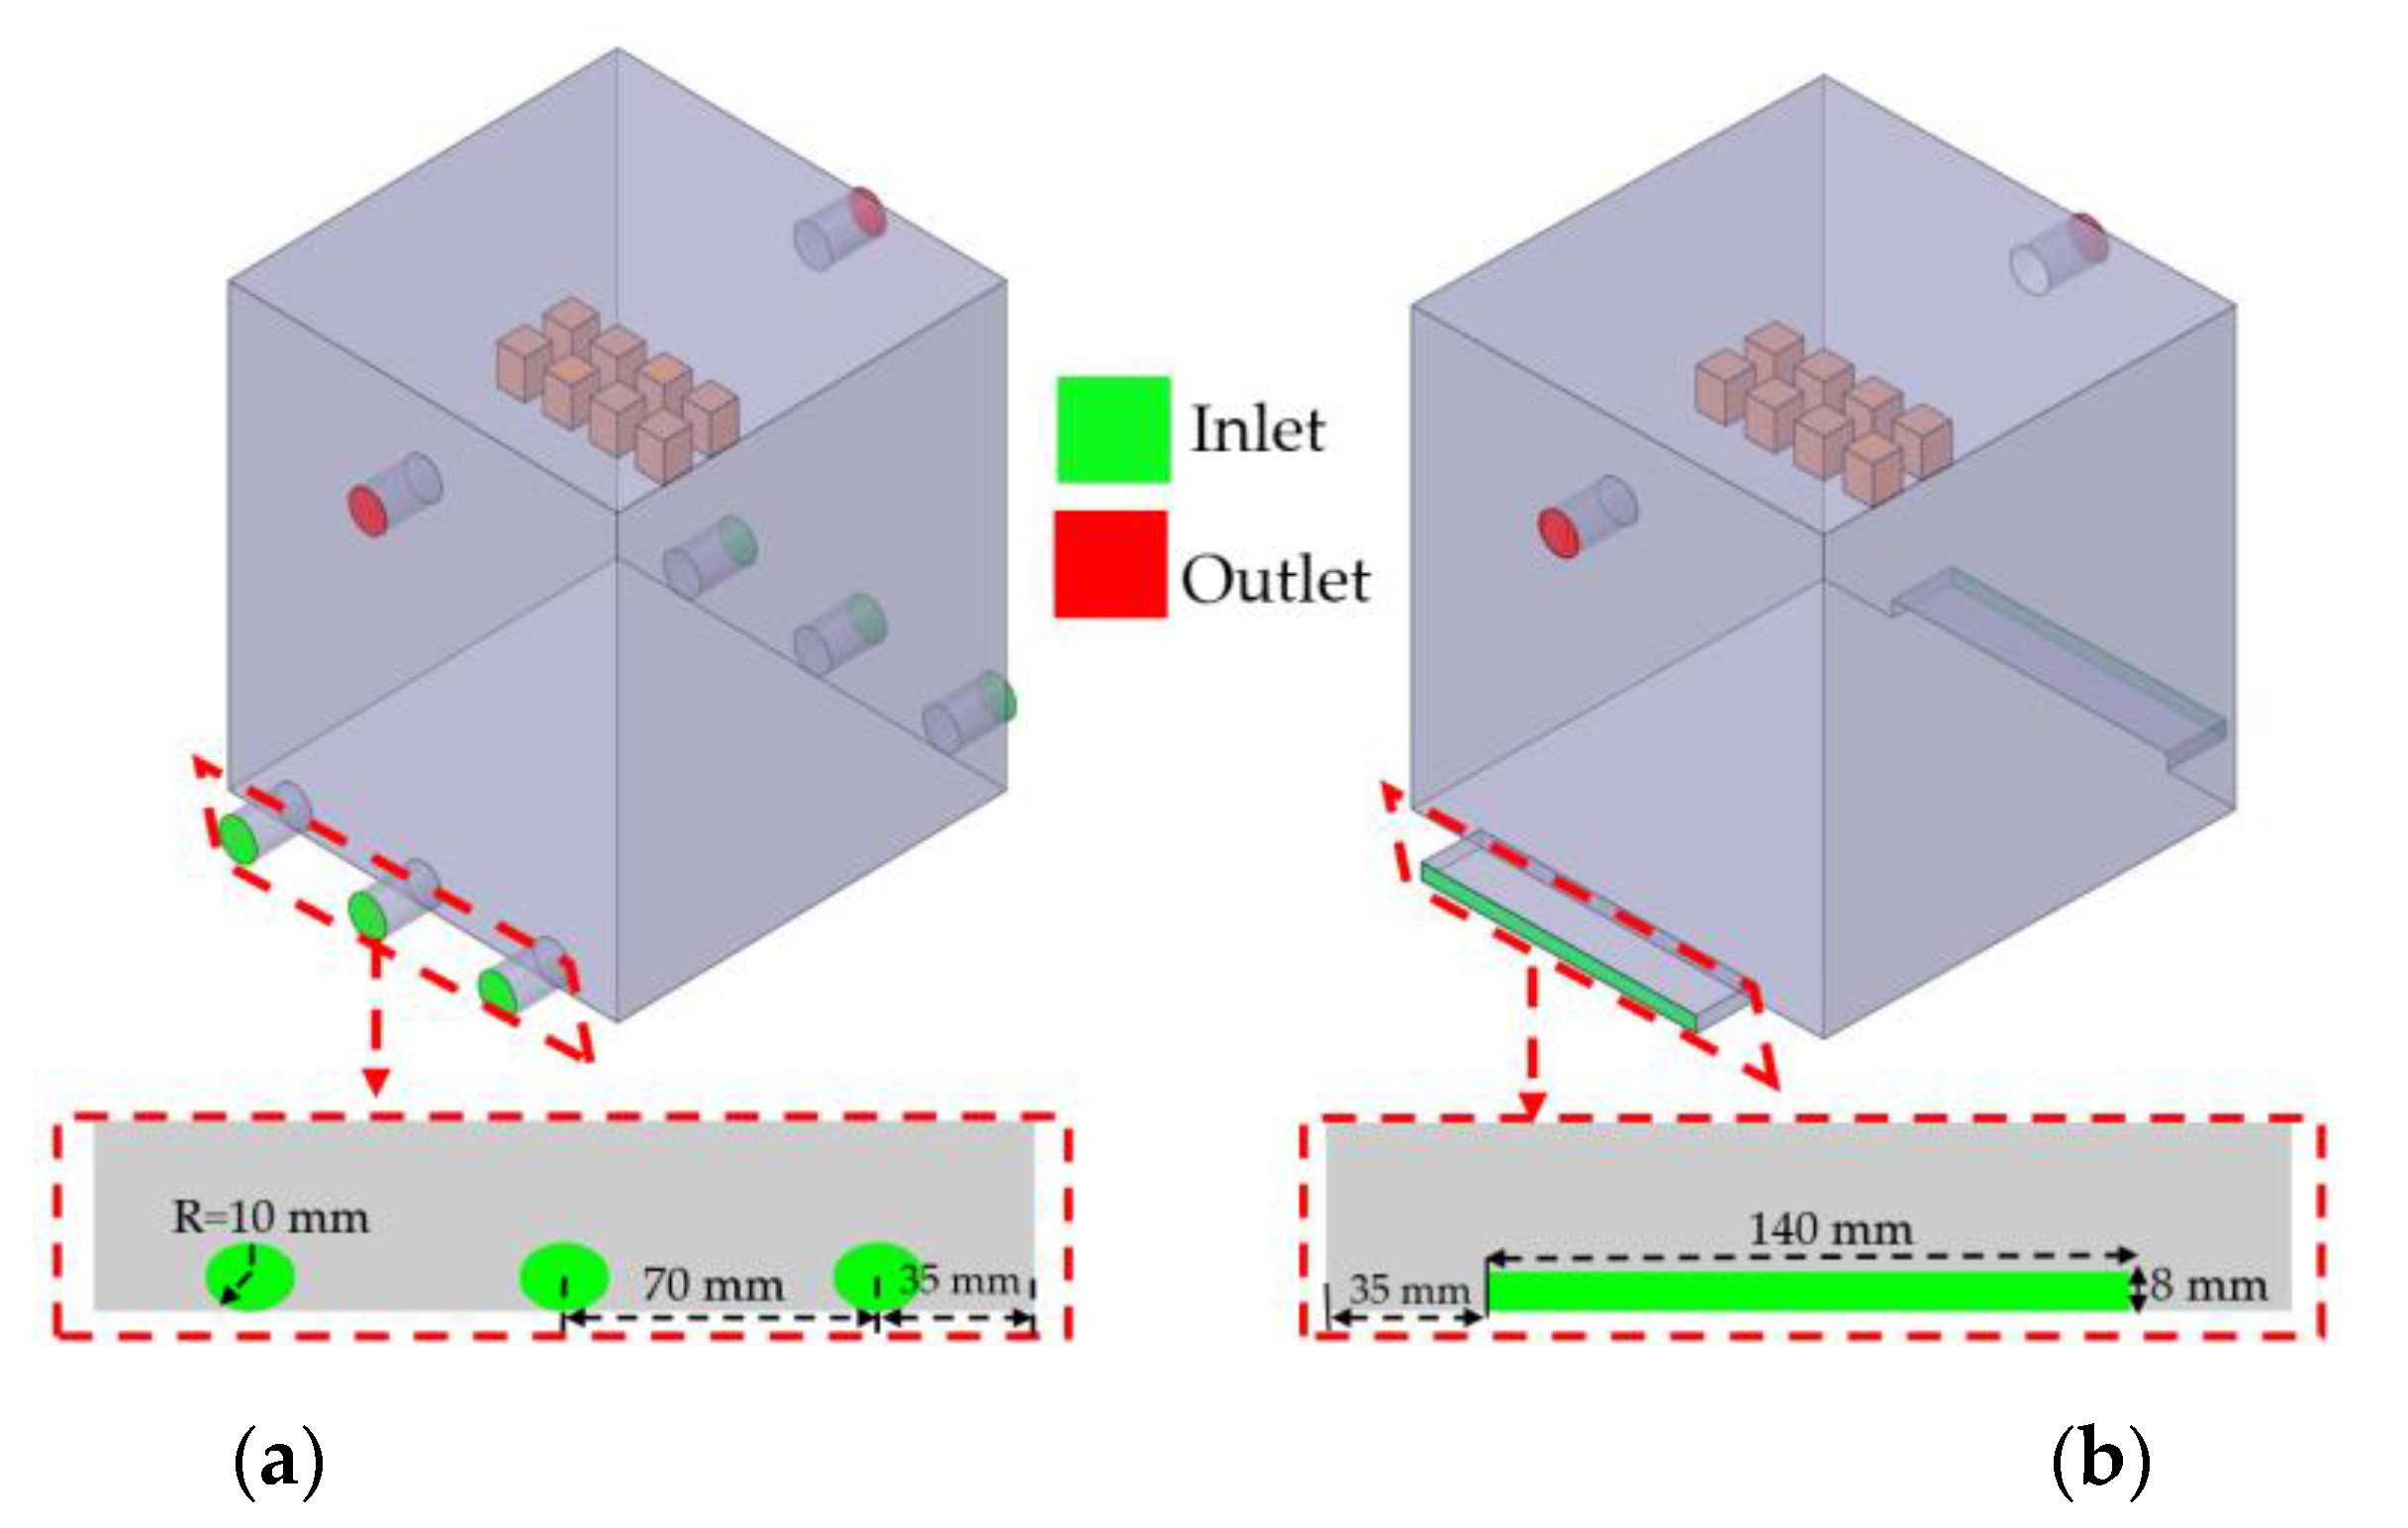
3.3. CFD Setting
4. Results
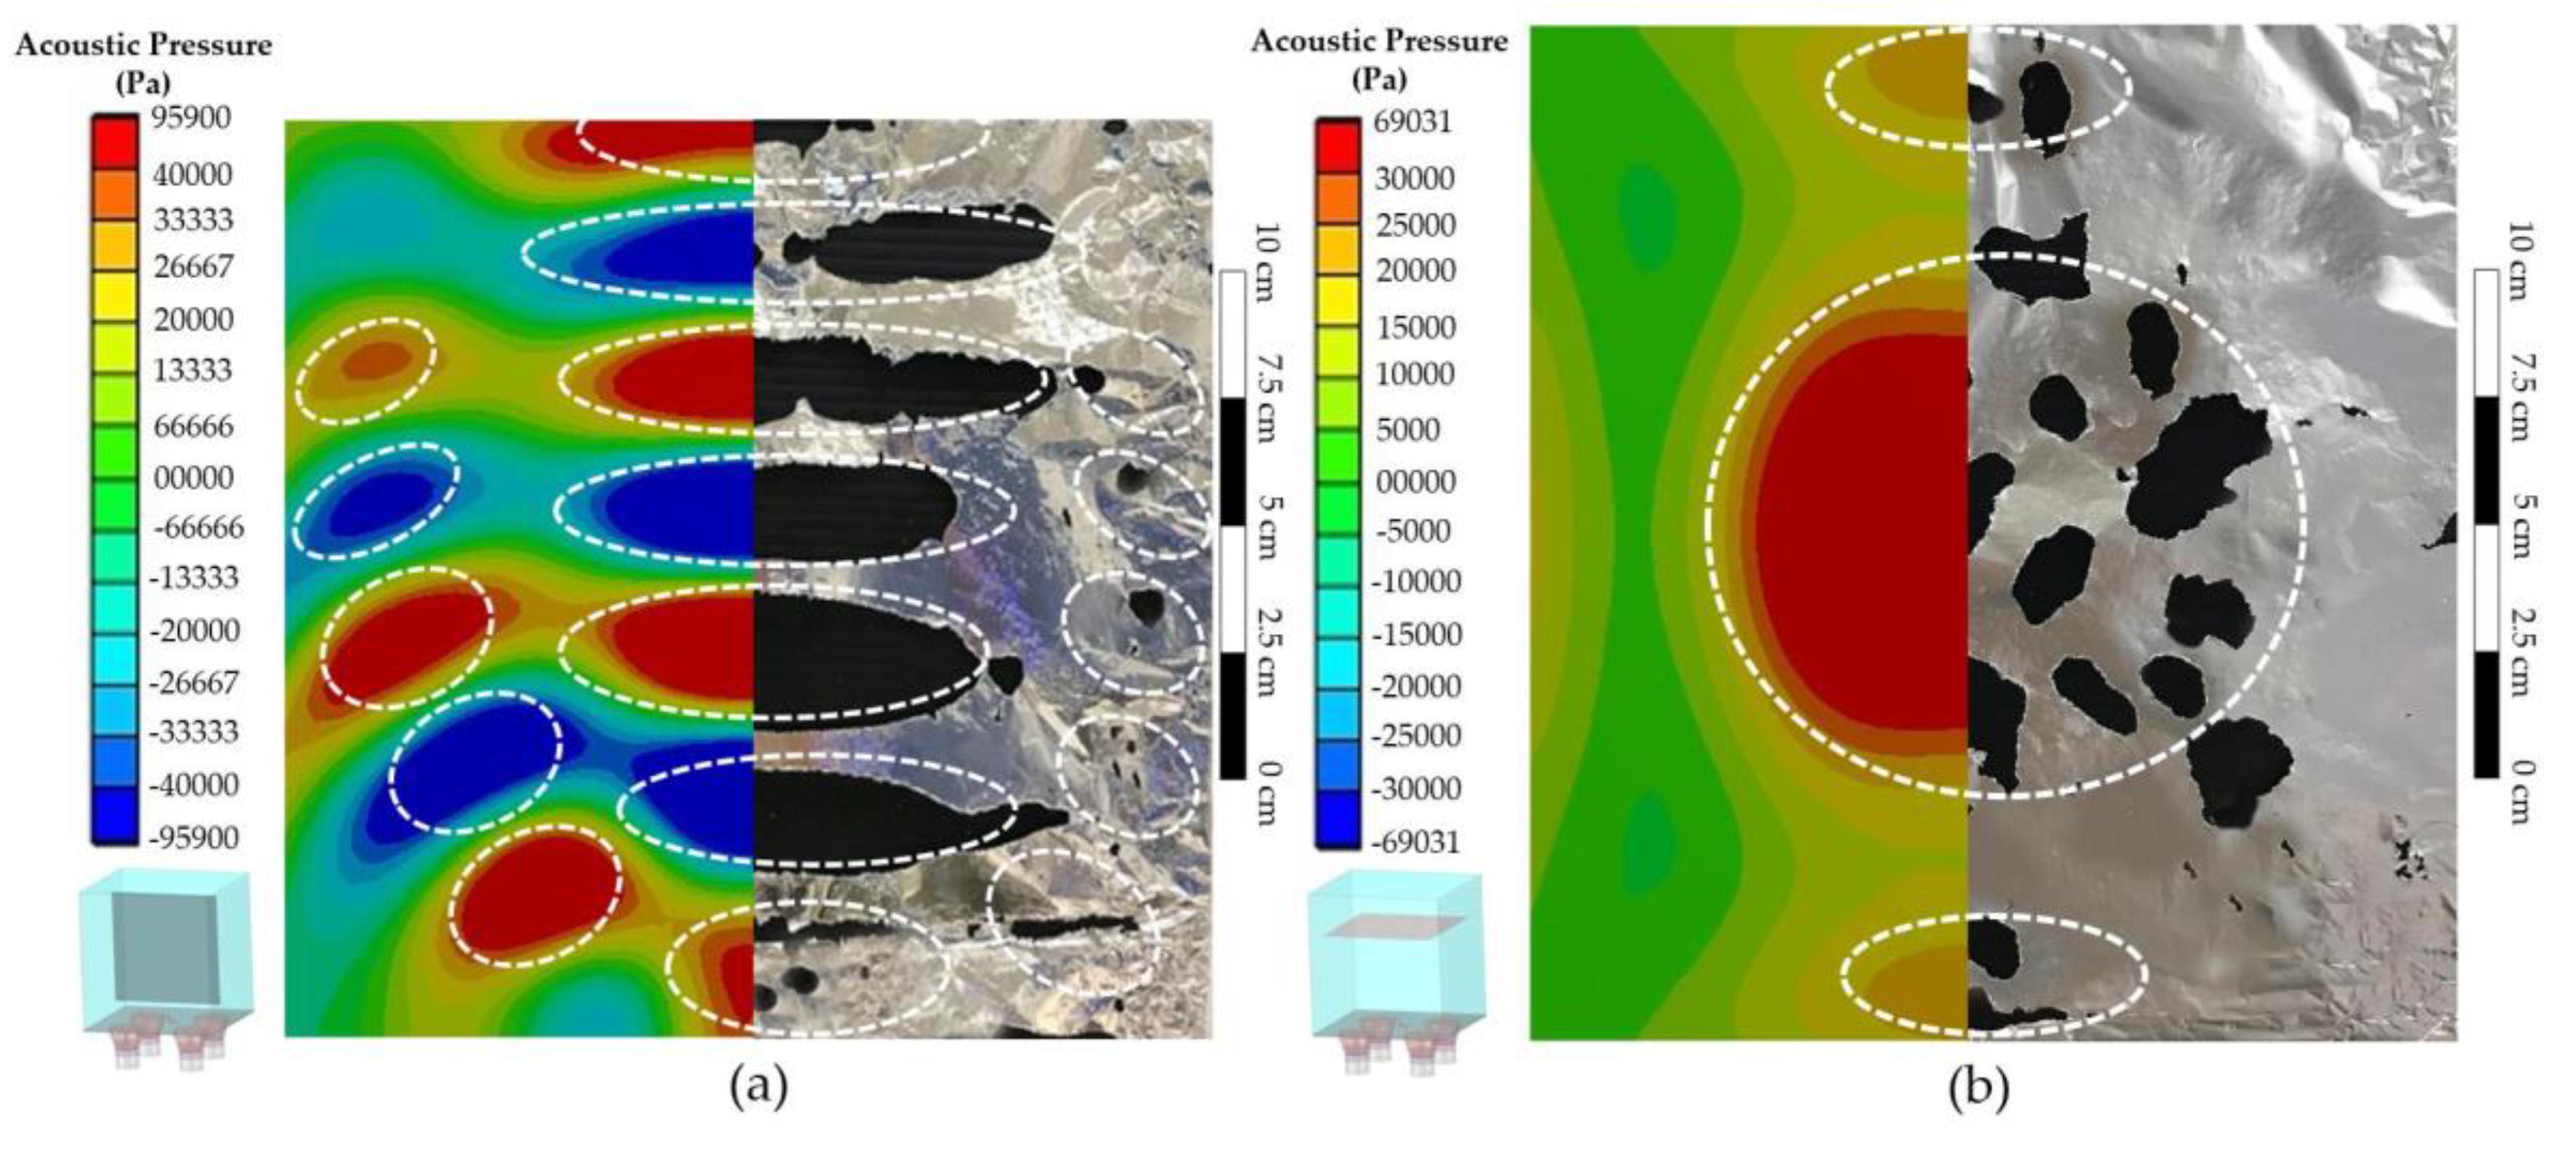
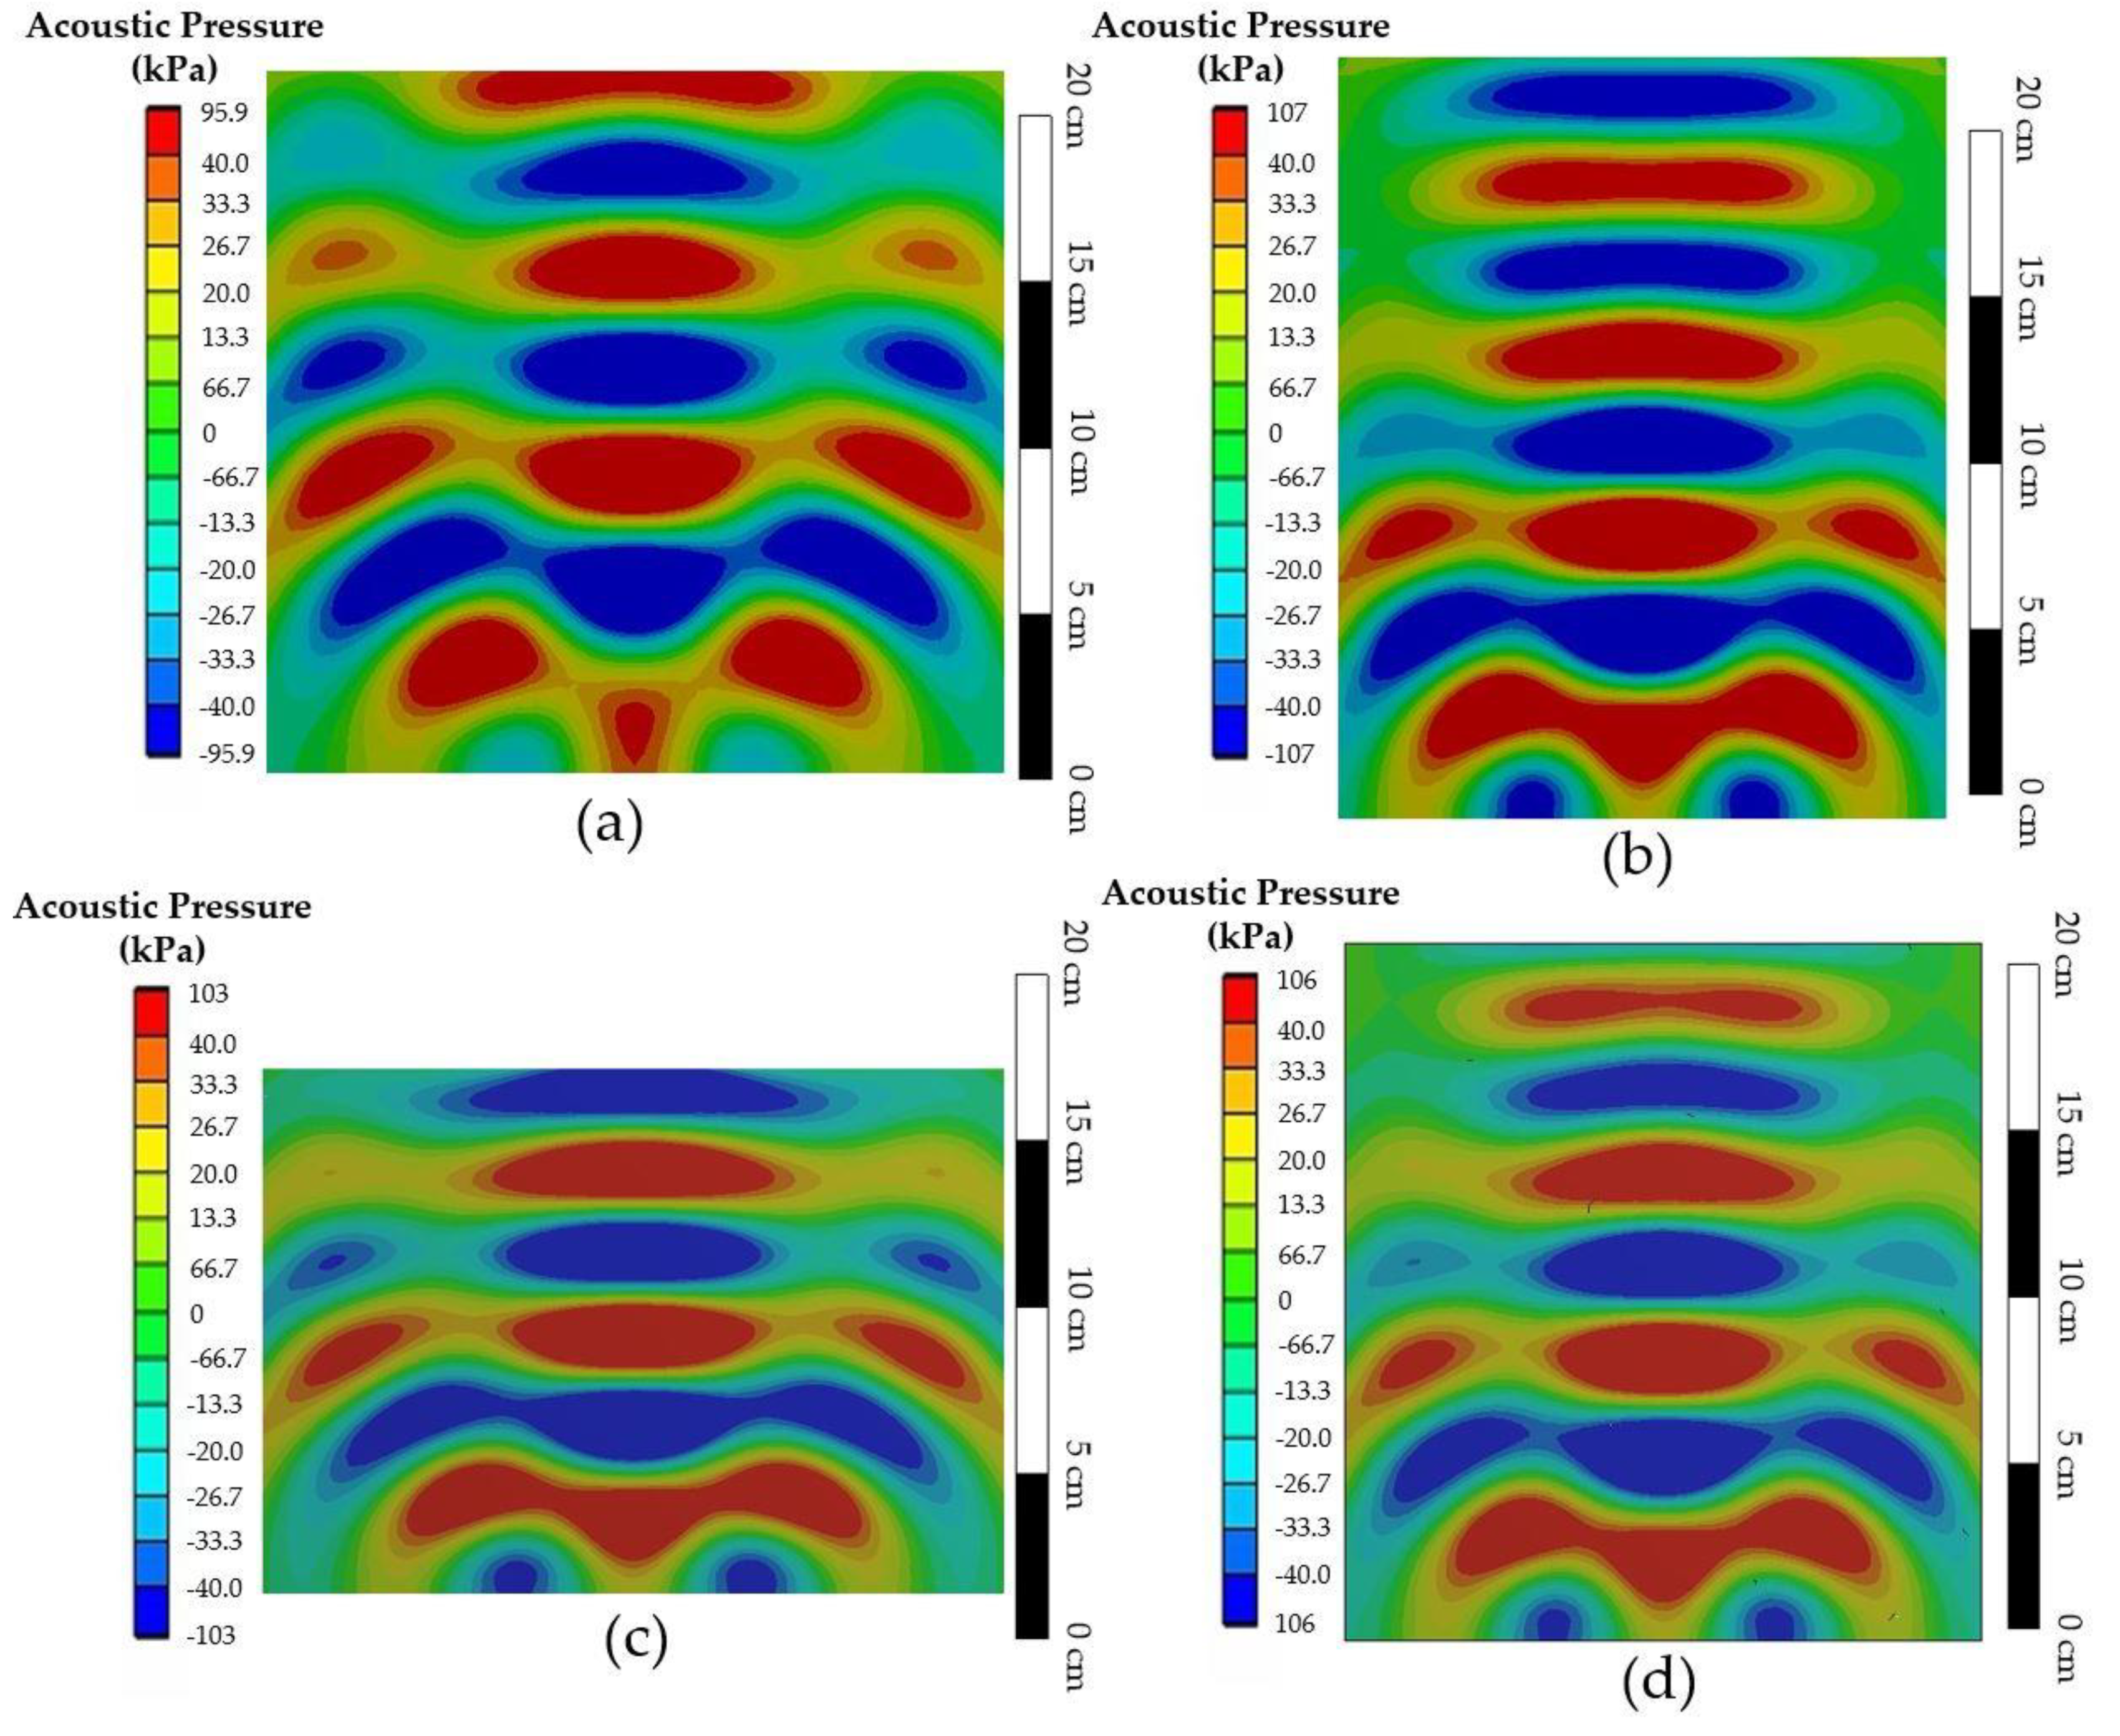
4.1. Validation and HRA Approach
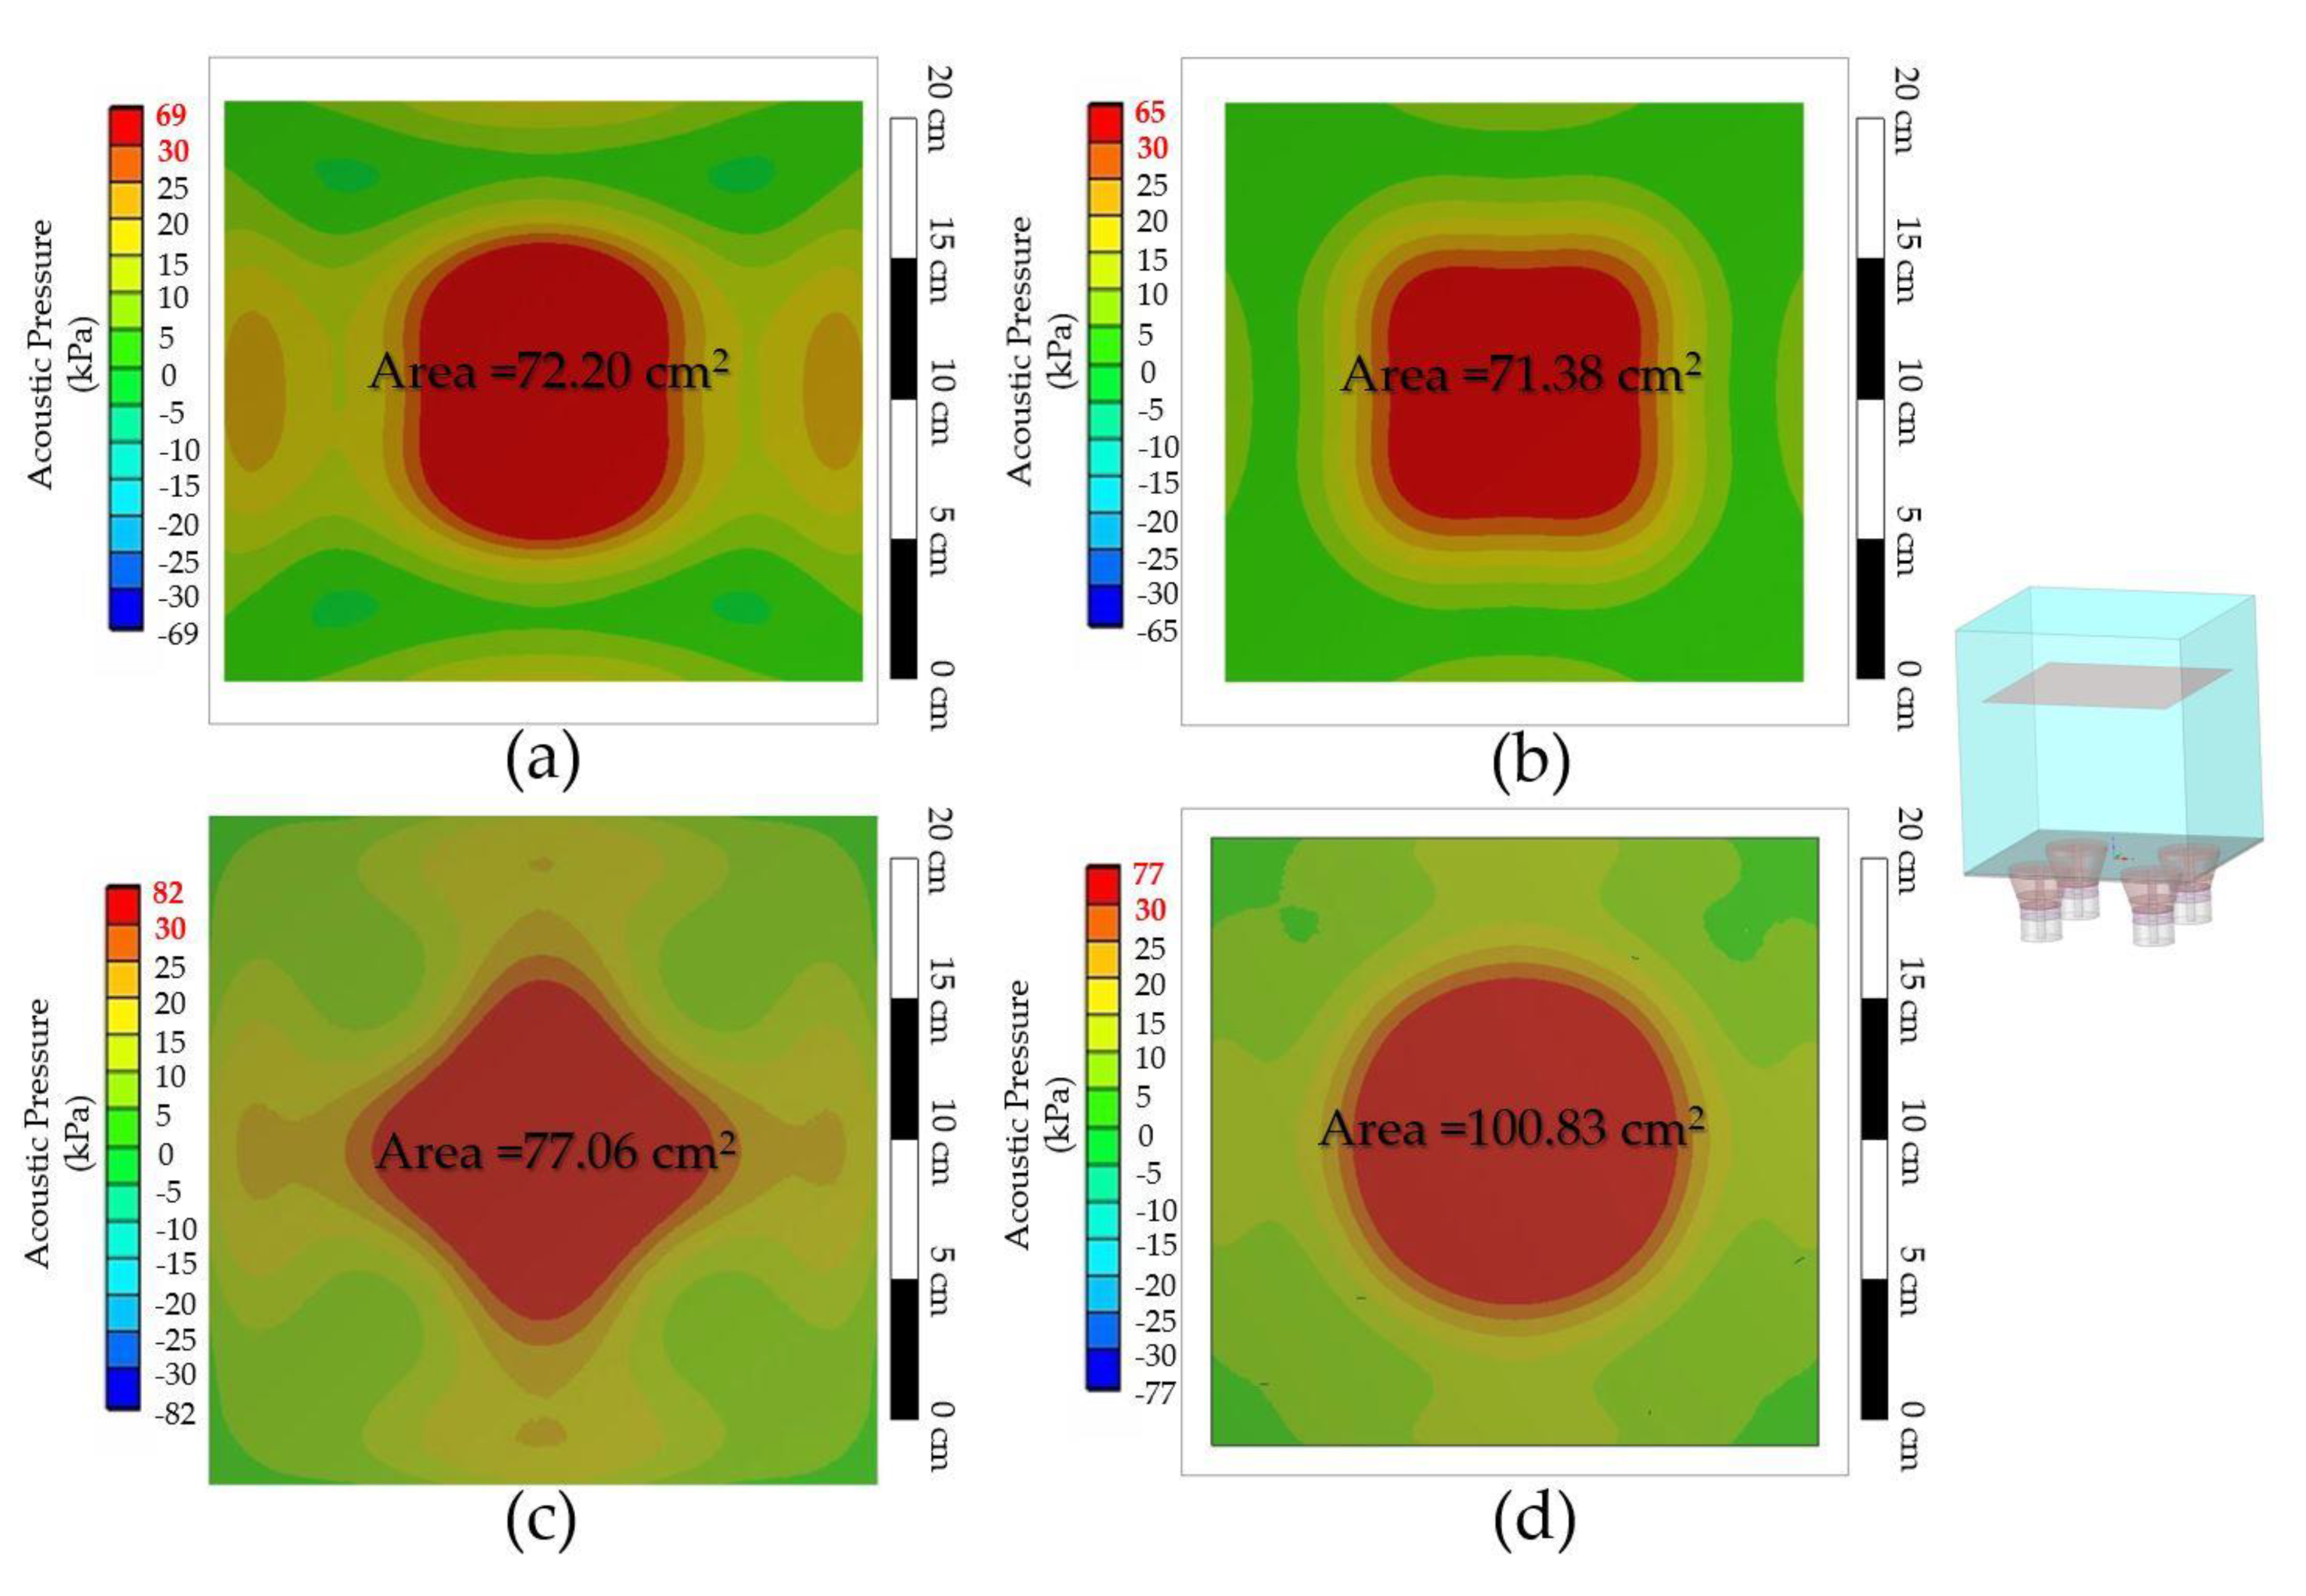
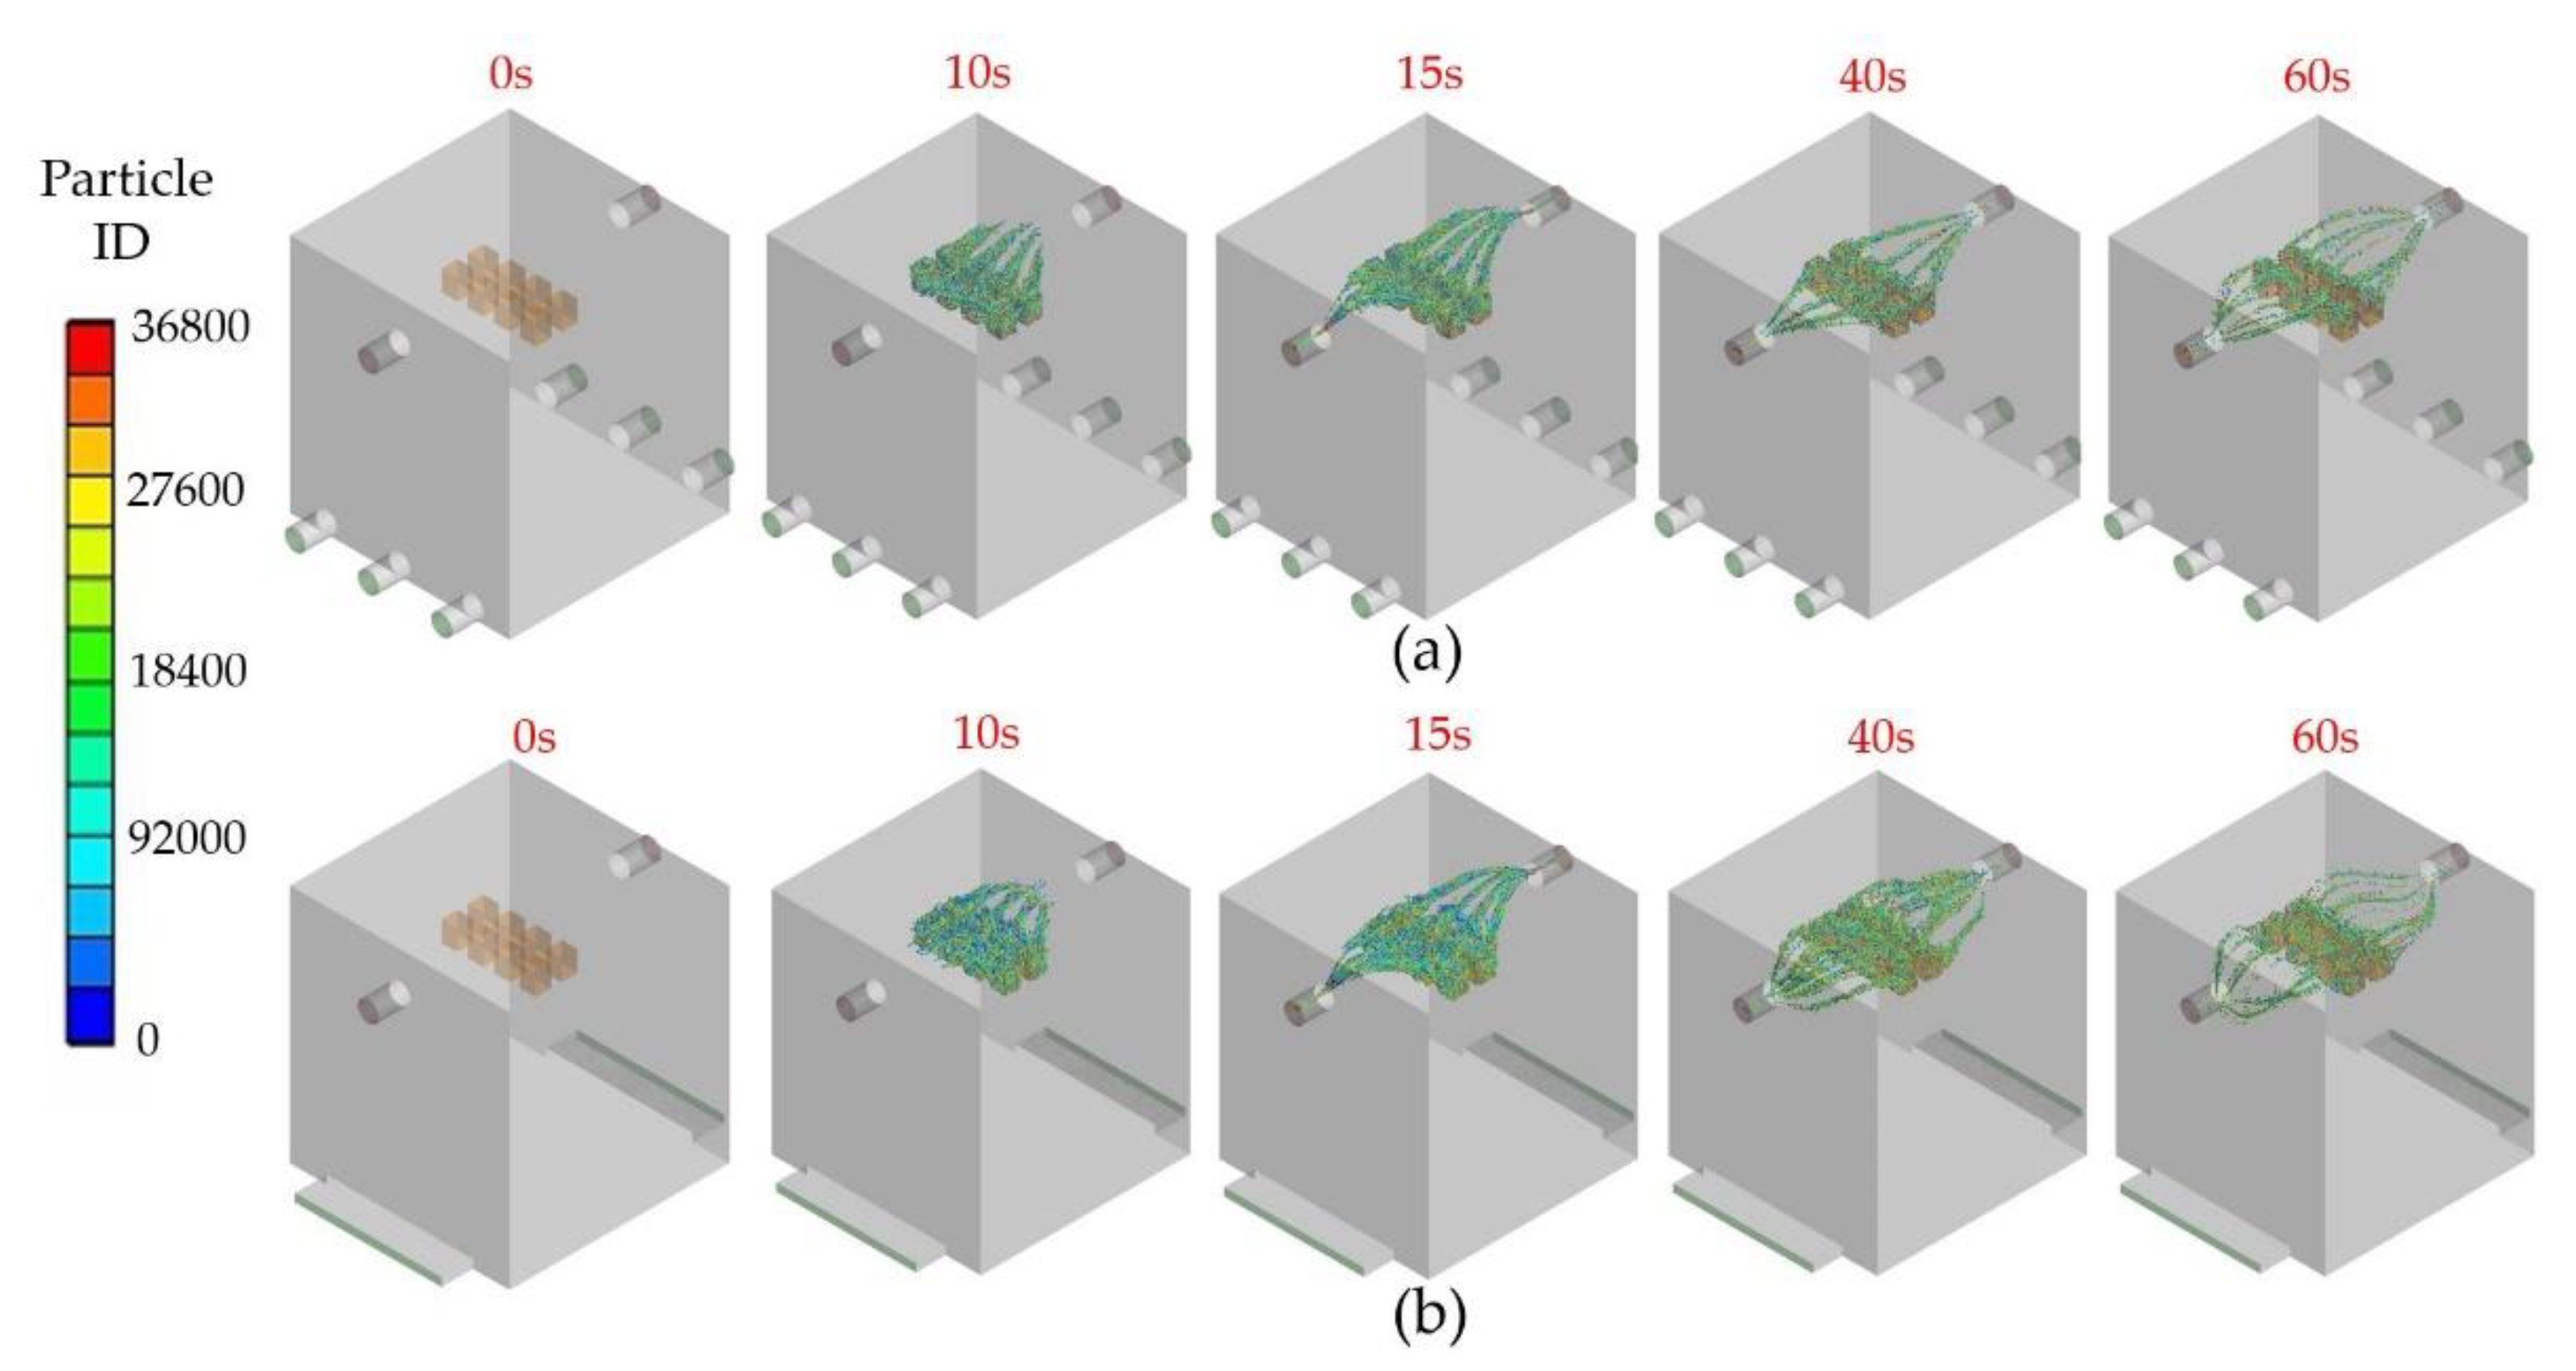
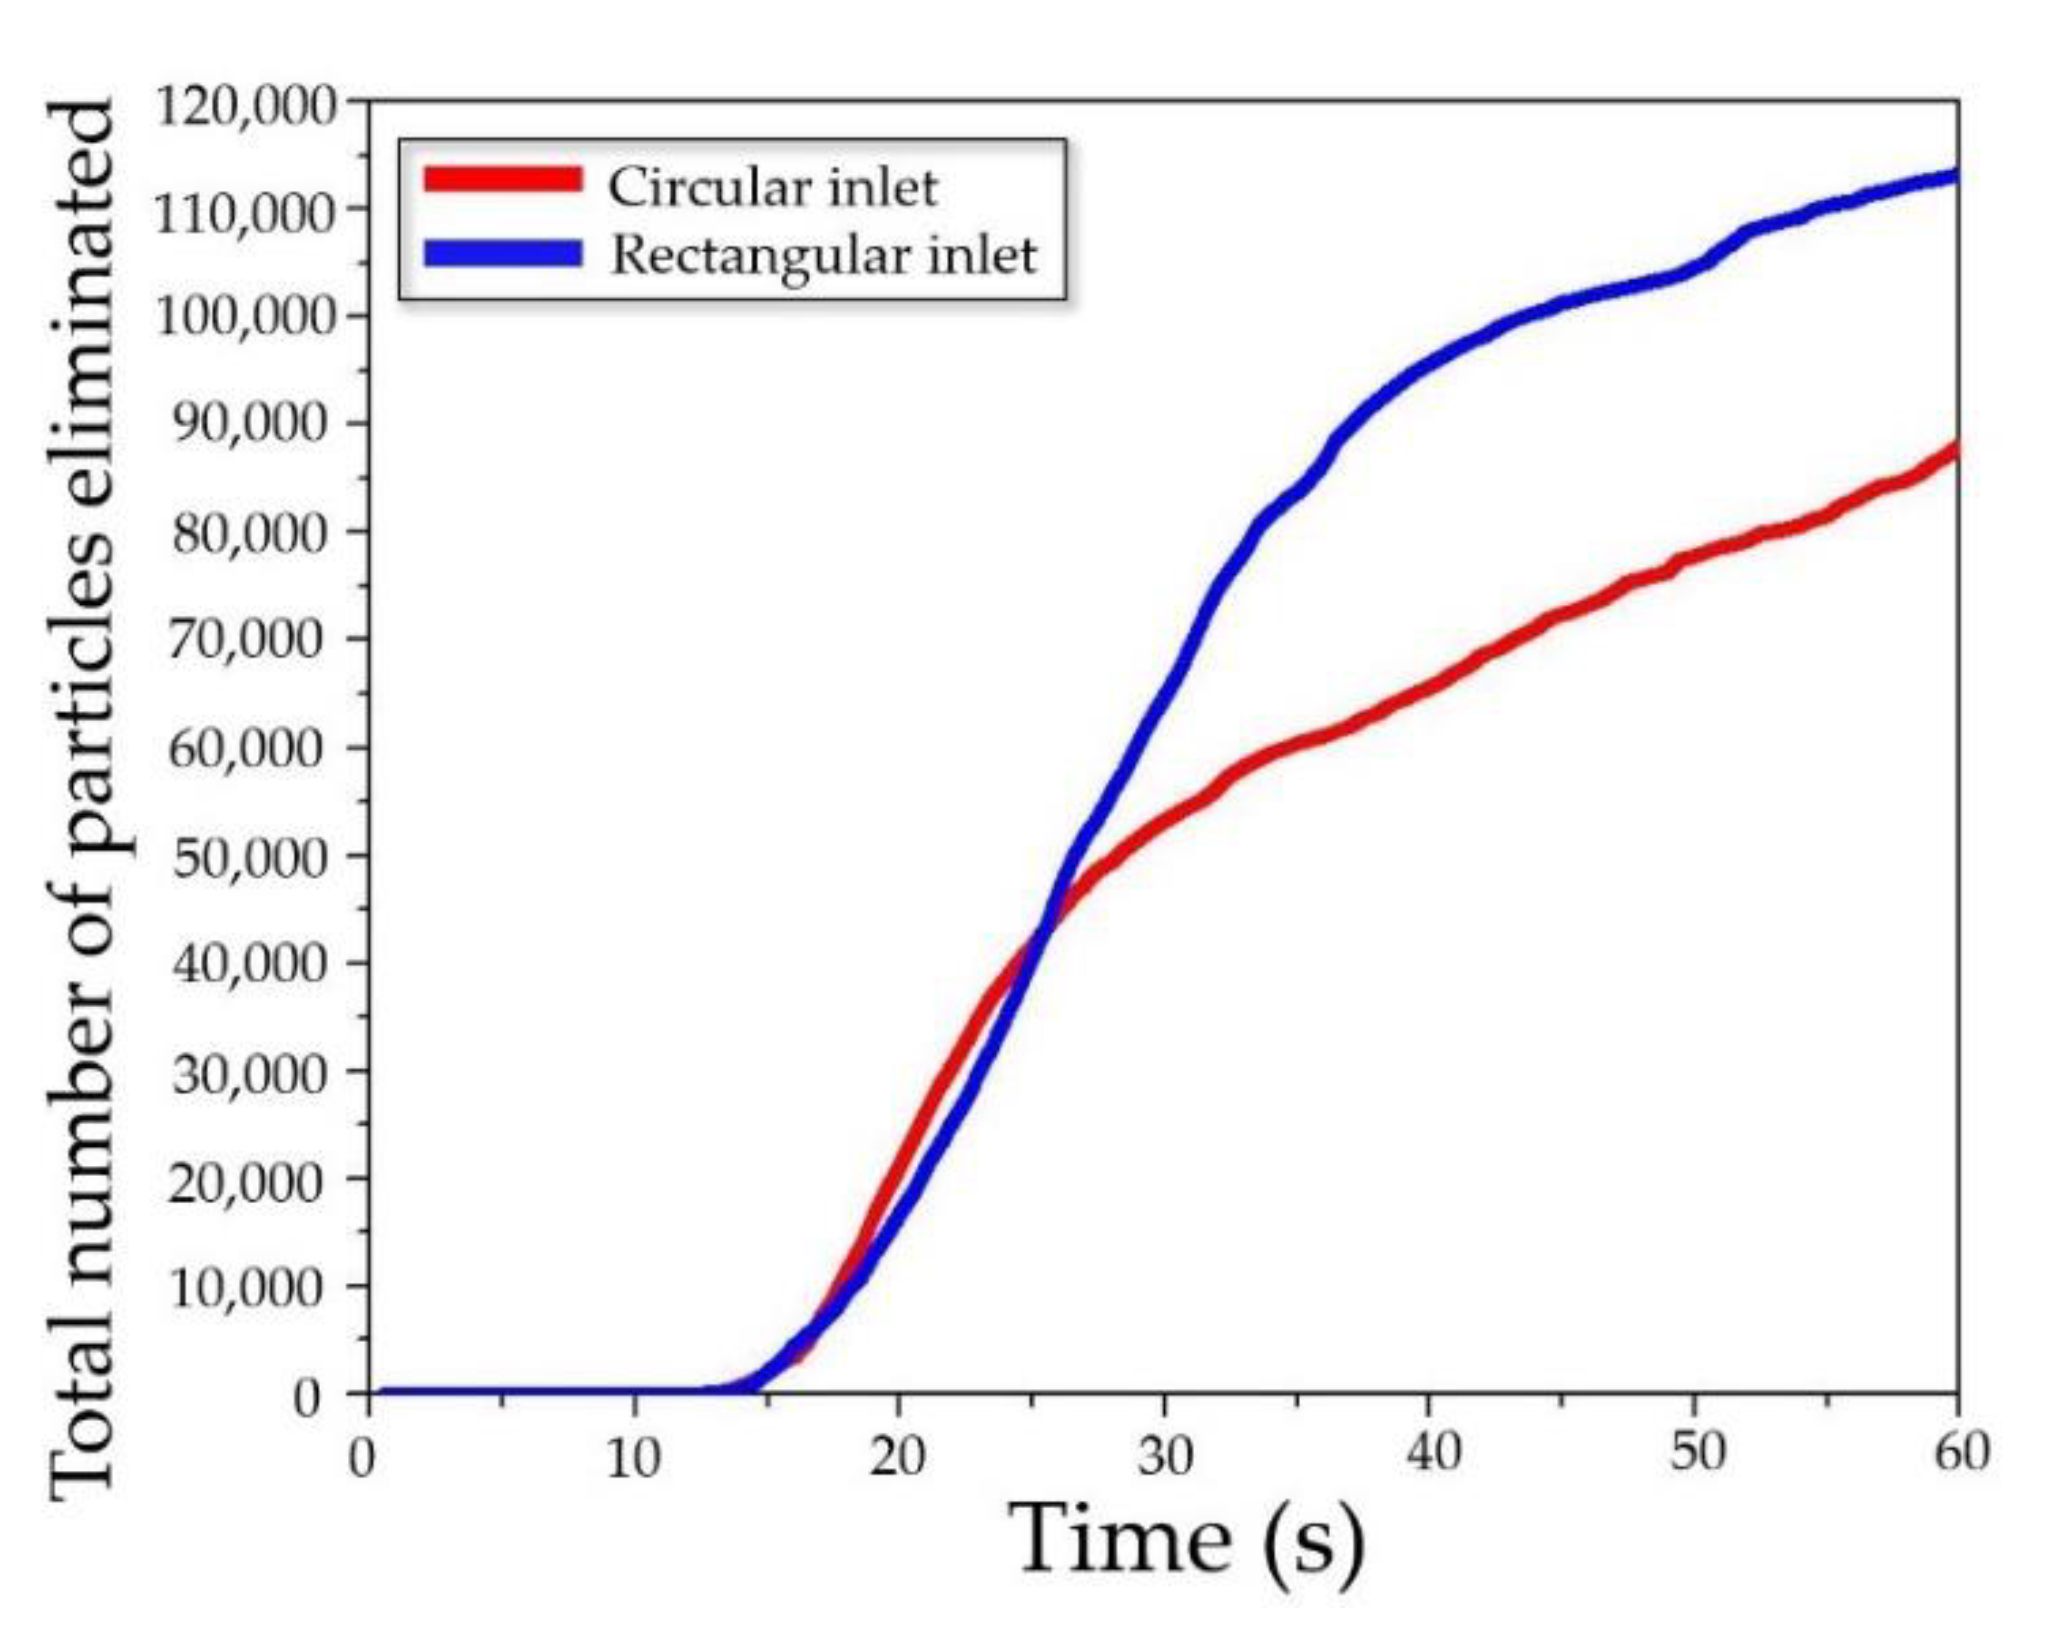
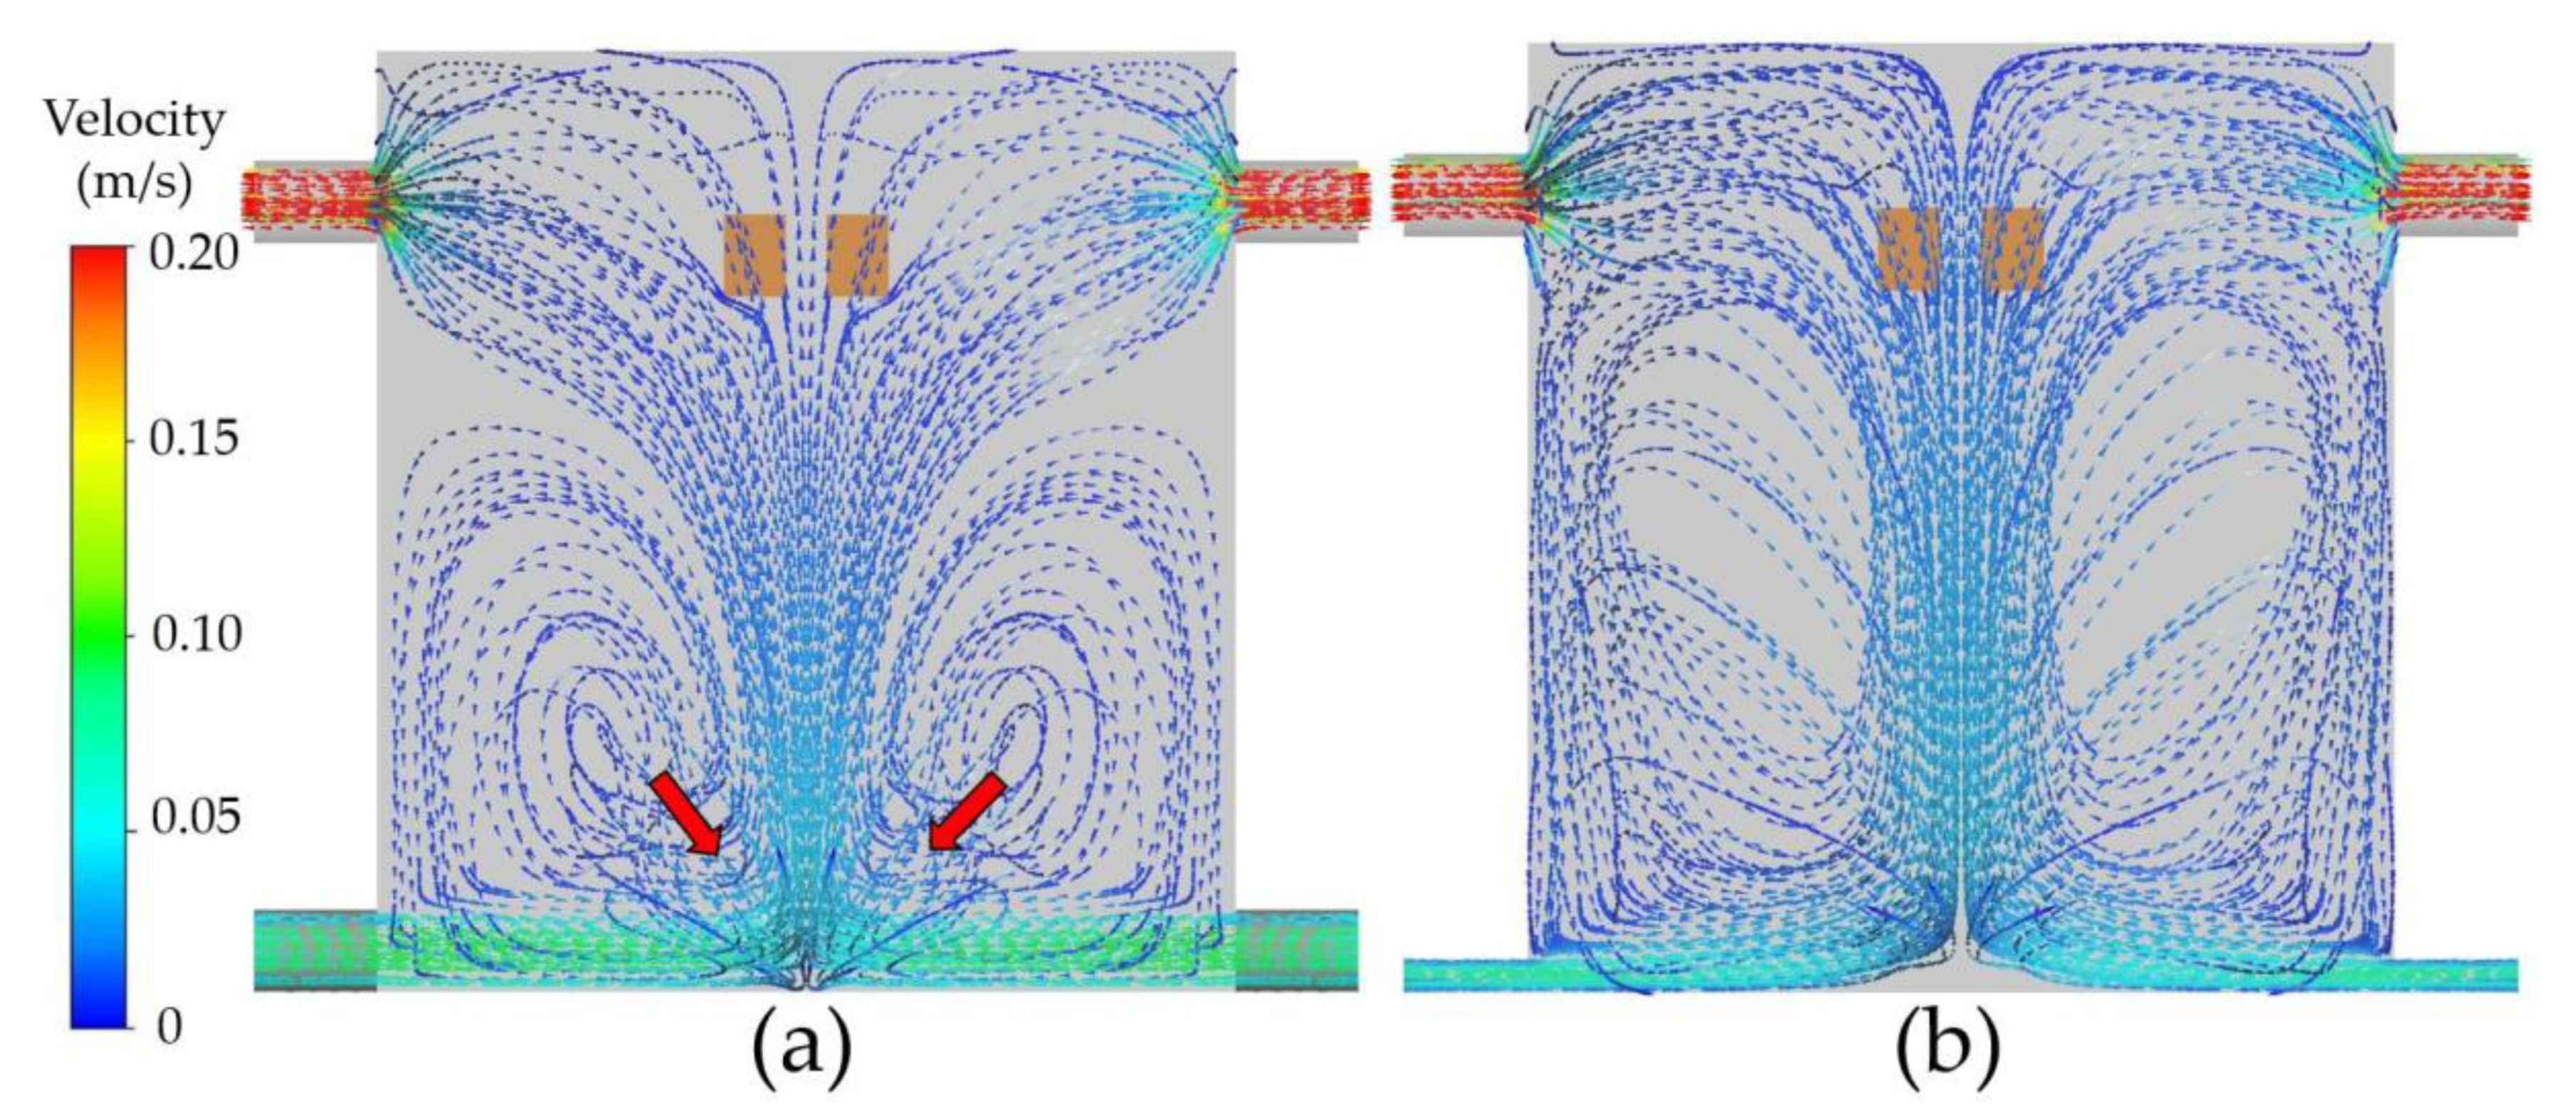
4.2. CFD Approach
5. Conclusions
Supplementary Materials
Author Contributions
Funding
Acknowledgments
Conflicts of Interest
Nomenclature
| c | acoustic velocity (m/s) |
| [CF] | acoustic damping matrix (N s/Pa) |
| [KF] | acoustic fluid stiffness matrices (N/Pa) |
| p | acoustic pressure (Pa) |
| {p} | acoustic pressure vector (Pa) |
| [R]T | acoustic fluid boundary matrices (m3) |
| ω | angular frequency (rad/s) |
| xi | cartesian coordinate in ith direction (m) |
| K | constant = 2.594 |
| [MUU] | coupling mass matrix (kg) |
| [C] | damping matrix (N s/m) |
| dij | deformation tensor |
| ρ | density (kg/m3) |
| [CVV] | dielectric dissipation matrices |
| [KVV] | dielectric permittivity matrices |
| FD | drag force (N) |
| μeff | effective viscosity (kg/m.s) |
| ρf | fluid density (kg/m3) |
| {fF} | fluid load (N) |
| [MF] | fluid mass matrix (N s2/Pa) |
| uf | fluid velocity (m/s) |
| f | frequency (Hz) |
| g | gravity of earth (m/s2) |
| E | internal energy (J) |
| δij | Kronecker delta function |
| {F} | load (N) |
| [M] | mass matrix (kg) |
| Ui | mean velocity component in ith direction (m/s) |
| μ | molecular dynamics viscosity (kg/m.s) |
| {u} | nodal displacement vector (m) |
| Fs | other forces acting on the particle (N) |
| ρp | particle density (kg/m3) |
| dp | particle diameter (m) |
| up | particle velocity (m/s) |
| [KUV] | piezoelectric coupling element matrix |
| Pk | production of turbulent kinetic energy (kg/m.s3) |
| [MS] | solid mass matrix (N s2/m) |
| Sm | source terms of momentum (N/m3) |
| [CS], [CUU] | structural damping matrices (N s/m) |
| i, j | 1, 2, 3 correspond to the components of x, y and z, respectively |
| {fS} | structural load (N) |
| [KUU], [KS] | structural stiffness matrices (N/m) |
| w | testing function |
| u | velocity (m/s) |
| V | volume of element (m3) |
| {V} | voltage vector (V) |
References
- Mason, T.J. Ultrasonic cleaning: An historical perspective. Ultrason. Sonochem. 2016, 29, 519–523. [Google Scholar] [CrossRef] [PubMed]
- Fuchs, F.J. 19—Ultrasonic cleaning and washing of surfaces. In Power Ultrasonics; Gallego-Juárez, J.A., Graff, K.F., Eds.; Woodhead Publishing: Oxford, UK, 2015; pp. 577–609. [Google Scholar] [CrossRef]
- Thammaruaksa, S.; Saneha, W.; Apirajkamol, S. Thai gems and jewely industries census project. Univ. Thai Chamb. Commer. J. Humanit. Soc. Sci. 2010, 30, 68–80. [Google Scholar]
- Vetrimurugan, R. Optimization of hard disk drive heads cleaning by using ultrasonics and prevention of its damage. APCBEE Procedia 2012, 3, 222–230. [Google Scholar] [CrossRef]
- Vetrimurugan, R.; Goodson, J.M.; Lim, T. Ultrasonic and megasonic cleaning to remove nano-dimensional contaminants from various disk drive components. Int. J. Innov. Res. Sci. Eng. Technol. 2013, 2, 5971–5977. [Google Scholar]
- Ye, L.; Zhu, X.; Liu, Y. Numerical study on dual-frequency ultrasonic enhancing cavitation effect based on bubble dynamic evolution. Ultrason. Sonochem. 2019, 59, 104744. [Google Scholar] [CrossRef]
- Tan, K.L.; Yeo, S.H. Bubble dynamics and cavitation intensity in milli-scale channels under an ultrasonic horn. Ultrason. Sonochem. 2019, 58, 104666. [Google Scholar] [CrossRef]
- Wu, H.; Zhou, C.; Pu, Z.; Yu, H.; Li, D. Effect of low-frequency ultrasonic field at different power on the dynamics of a single bubble near a rigid wall. Ultrason. Sonochem. 2019, 58, 104704. [Google Scholar] [CrossRef]
- Pflieger, R.; Nikitenko, S.I.; Ashokkumar, M. Effect of NaCl salt on sonochemistry and sonoluminescence in aqueous solutions. Ultrason. Sonochem. 2019, 59, 104753. [Google Scholar] [CrossRef]
- Luo, J.; Xu, W.; Zhai, Y.; Zhang, Q. Experimental study on the mesoscale causes of the influence of viscosity on material erosion in a cavitation field. Ultrason. Sonochem. 2019, 59, 104699. [Google Scholar] [CrossRef]
- Liu, H.; Chen, J.; Sun, J.; Kang, C. Influence of the concentration of NaHCO3 solution on cavitation erosion of copper alloy. Results Phys. 2019, 13, 102145. [Google Scholar] [CrossRef]
- Khmelev, V.N.; Tsyganok, S.N.; Kuzovnikov, Y.M.; Shakura, V.A.; Khmelev, V.; Zorin, S.S. Study of ultrasonic cavitation action on the process of part cleaning from burrs. Proceedings of 17th International Conference of Young Specialists on Micro/Nanotechnologies and Electron Devices, Erlagol, Russia, 30 June 2016; pp. 275–279. [Google Scholar]
- Wood, R.J.; Lee, J.; Bussemaker, M.J. Combined effects of flow, surface stabilisation and salt concentration in aqueous solution to control and enhance sonoluminescence. Ultrason. Sonochem. 2019, 58, 104683. [Google Scholar] [CrossRef] [PubMed]
- Zupanc, M.; Pandur, Z.; Stepisnik Perdih, T.; Stopar, D.; Petkovsek, M.; Dular, M. Effects of cavitation on different microorganisms: The current understanding of the mechanisms taking place behind the phenomenon. a review and proposals for further research. Ultrason. Sonochem. 2019, 57, 147–165. [Google Scholar] [CrossRef] [PubMed]
- Lais, H.; Lowe, P.S.; Gan, T.H.; Wrobel, L.C. Numerical modelling of acoustic pressure fields to optimize the ultrasonic cleaning technique for cylinders. Ultrason. Sonochem. 2018, 45, 7–16. [Google Scholar] [CrossRef] [PubMed]
- Lais, H.; Lowe, P.S.; Wrobel, L.C.; Gan, T.-H. Ultrasonic transducer array performance for improved cleaning of pipelines in marine and freshwater applications. Appl. Sci. 2019, 9, 4353. [Google Scholar] [CrossRef]
- Tangsopha, W.; Thongsri, J.; Busayaporn, W. Simulation of ultrasonic cleaning and ways to improve the efficiency. Proceedings of 2017 International Electrical Engineering Congress (iEECON), Pattaya, Thailand, 8–10 March 2017; pp. 1–4. [Google Scholar]
- Tangsopa, W.; Keawklan, T.; Kesngam, K.; Ngaochai, S.; Thongsri, J. Improved design of ultrasonic cleaning tank using harmonic response analysis in ANSYS. Proceeding IOP Conf. Ser. Earth Environ. Sci. 2018, 159, 012042. [Google Scholar] [CrossRef]
- Tangsopa, W.; Thongsri, J. Development of an industrial ultrasonic cleaning tank based on harmonic response analysis. Ultrasonics 2019, 91, 68–76. [Google Scholar] [CrossRef] [PubMed]
- Birkin, P.R.; Offin, D.G.; Joseph, P.F.; Leighton, T.G. Cavitation, Shock waves and the invasive nature of sonoelectrochemistry. J. Phys. Chem. B 2005, 109, 16997–17005. [Google Scholar] [CrossRef]
- Kim, J.O.; Ho Kim, J.; Choi, S. Vibroacoustic characteristics of ultrasonic cleaners. Appl. Acoust. 1999, 58, 211–228. [Google Scholar] [CrossRef]
- Ansys, Inc. Harmonic Analysis; ANSYS Inc.: Southpointe, FL, USA, 2016. [Google Scholar]
- Ansys, Inc. Piezo and MEMS ACTx R180; ANSYS Inc.: Southpointe, FL, USA, 2018. [Google Scholar]
- Ansys, Inc. Introduction to Acoustics; ANSYS Inc.: Southpointe, FL, USA, 2017. [Google Scholar]
- Ansys, Inc. Turbulence, Fluent Theory Guide 17.1; ANSYS Inc.: Southpointe, FL, USA, 2016. [Google Scholar]
- Argyropoulos, C.D.; Markatos, N.C. Recent advances on the numerical modelling of turbulent flows. Appl. Math. Model. 2015, 39, 693–732. [Google Scholar] [CrossRef]
- Ansys, Inc. Multiphase Flow, Fluent Theory Guide 17.1; ANSYS Inc.: Southpointe, FL, USA, 2016. [Google Scholar]
- Ansys, Inc. Discrete Phase, Fluent Theory Guide 17.1; ANSYS Inc.: Southpointe, FL, USA, 2016. [Google Scholar]
- Kaewbumrung, M.; Tangsopa, W.; Thongsri, J. Investigation of the trailing edge modification effect on compressor blade aerodynamics using SST k-ω turbulence model. Aerospace 2019, 6, 48. [Google Scholar] [CrossRef]
- Santati, S.; Thongsri, J.; Sarntima, P. Modified small-volume jet nebulizer based on CFD simulation and its clinical outcomes in small asthmatic children. J. Healthc. Eng. 2019, 2019, 2524583. [Google Scholar] [CrossRef] [PubMed]
- Mason, T.; Peters, D. 2—The ultrasonic bath. In Practical Sonochemistry, 2nd ed.; Mason, T., Peters, D., Eds.; Woodhead Publishing: Cambridge, UK, 2002; pp. 49–63. [Google Scholar] [CrossRef]
- Niazi, S.; Hashemabadi, S.H.; Razi, M.M. CFD simulation of acoustic cavitation in a crude oil upgrading sonoreactor and prediction of collapse temperature and pressure of a cavitation bubble. Chem. Eng. Res. Des. 2014, 92, 166–173. [Google Scholar] [CrossRef]
- Thongsri, J.; Pimsarn, M. Optimum airflow to reduce particle contamination inside welding automation machine of hard disk drive production line. Int. J. Precis. Eng. Man. 2015, 16, 509–515. [Google Scholar] [CrossRef]
- Thongsri, J. A Problem of particulate contamination in an automated assembly machine successfully solved by CFD and simple experiments. Math. Probl. Eng. 2017, 2017, 1–9. [Google Scholar] [CrossRef]
- Naosungnoen, J.; Thongsri, J. Simulation of airflow in a cleanroom to solve contamination problem in an HDD production line. Int. J. Mech. Eng. Rob. Res. 2018, 7, 41–45. [Google Scholar] [CrossRef]


| Domain | Type | Value |
|---|---|---|
| Water (45 °C) | Water density | 990.15 kg/m3 |
| Acoustic velocity | 1533.5 m/s | |
| Dynamic viscosity | 5.7977 × 10⁻⁴ kg/m s | |
| Aluminum alloy | Density | 2770 kg/m3 |
| Young’s modulus | 7.1 × 10¹⁰ Pa | |
| Poisson’s ratio | 0.33 | |
| Bulk modulus | 6.9608 × 10¹⁰ Pa | |
| Shear modulus | 2.6692 × 10¹⁰ Pa | |
| Stainless steel | Density | 7750 kg/m3 |
| Young’s modulus | 1.93 × 10¹¹ Pa | |
| Poisson’s ratio | 0.31 | |
| Bulk modulus | 1.693 × 10¹⁰ Pa | |
| Shear modulus | 7.3664 × 10¹⁰ Pa | |
| Gold (Au) | Density | 19,520 kg/m3 |
| Diameter | 5 × 10⁻⁶ m | |
| Chromium oxide (Cr2O3) | Density | 5220 kg/m3 |
| Diameter | 5 × 10⁻⁶ m | |
| Lead Zirconate Titanate (PZT4) | Density | 7500 kg/m3 |
| Permittivity constant () | 8.854 × 10⁻¹² F/m | |
| Stiffness matrix [cE] | C11 = C22 = 1.39 × 10¹¹, C21 = 7.78 × 10¹⁰, C31 = C32 = 7.43 × 10¹⁰, C44 = 3.06 × 10¹⁰, C55 = C66 = 2.56 × 10¹⁰ Pa | |
| Piezoelectric stress matrix [e] | e31- = 5.2 c/m2, e33 = 15.1 c/m2, e15 = 12.7 | |
| Relative permittivity () | K11 = 1475, K33 = 1300 |
| Case | Particle | Flow Rate (L/min) | Inlet Shape | Boundary Condition | Number of Opening | Mass Flow Rates of Water (kg/s) |
|---|---|---|---|---|---|---|
| 1 | Cr2O3 | 10 | Circle | mass flow inlet | 6 | 0.0278 |
| mass flow outlet | 2 | 0.0833 | ||||
| 2 | Rectangle | mass flow inlet | 2 | 0.0833 | ||
| mass flow outlet | 2 | 0.0833 | ||||
| 3 | 15 | mass flow inlet | 2 | 0.1250 | ||
| mass flow outlet | 2 | 0.1250 | ||||
| 4 | 7.5 | mass flow inlet | 2 | 0.0625 | ||
| mass flow outlet | 2 | 0.0625 | ||||
| 5 | Au | 7.5 | mass flow inlet | 2 | 0.0625 | |
| mass flow outlet | 2 | 0.0625 | ||||
| 6 | 10 | mass flow inlet | 2 | 0.0833 | ||
| mass flow outlet | 2 | 0.0833 | ||||
| 7 | 15 | mass flow inlet | 2 | 0.1250 | ||
| mass flow outlet | 2 | 0.1250 |
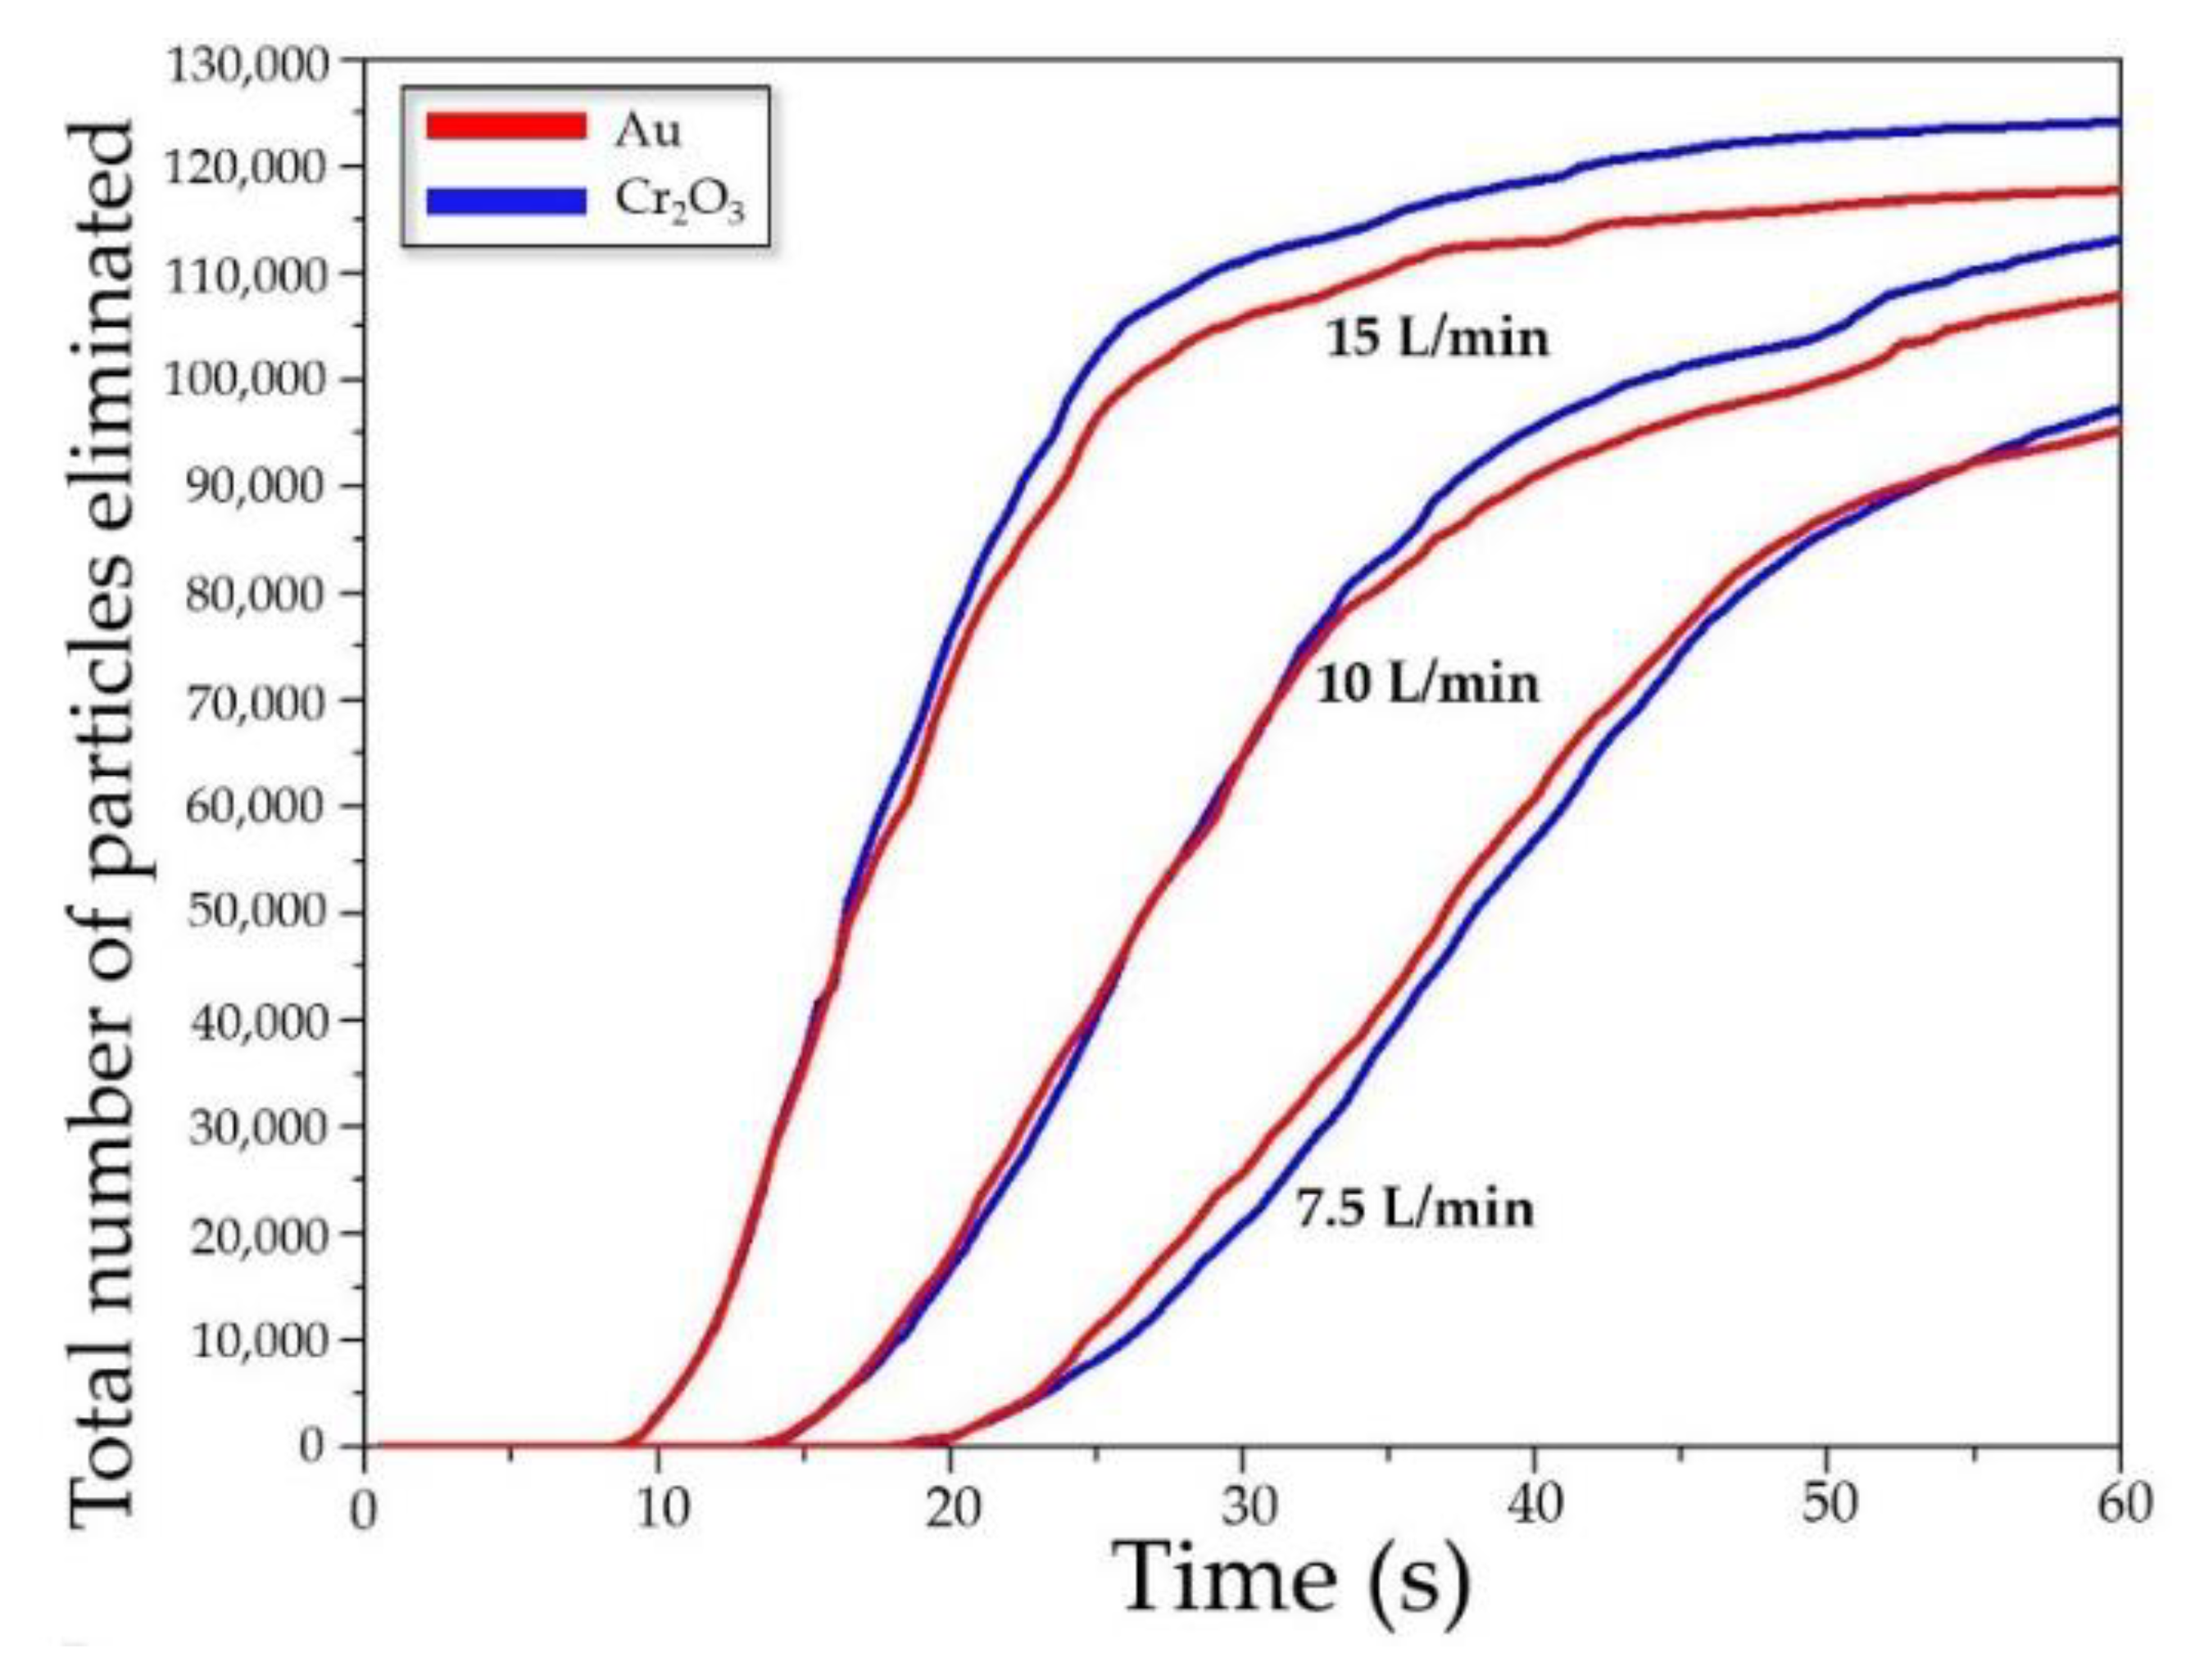
| Flow Rate (L/min) | Particle | Total Number of Particles Eliminated at 60 s | Efficiency of Cleaning |
|---|---|---|---|
| 7.5 | Cr2O3 Au | 97,328 95,368 | 66.12% 64.79% |
| 10 | Cr2O3 Au | 113,264 107,964 | 76.95% 73.35% |
| 15 | Cr2O3 Au | 124,188 117,972 | 84.37% 80.14% |
© 2020 by the authors. Licensee MDPI, Basel, Switzerland. This article is an open access article distributed under the terms and conditions of the Creative Commons Attribution (CC BY) license (http://creativecommons.org/licenses/by/4.0/).
Share and Cite
Tangsopa, W.; Thongsri, J. A Novel Ultrasonic Cleaning Tank Developed by Harmonic Response Analysis and Computational Fluid Dynamics. Metals 2020, 10, 335. https://doi.org/10.3390/met10030335
Tangsopa W, Thongsri J. A Novel Ultrasonic Cleaning Tank Developed by Harmonic Response Analysis and Computational Fluid Dynamics. Metals. 2020; 10(3):335. https://doi.org/10.3390/met10030335
Chicago/Turabian StyleTangsopa, Worapol, and Jatuporn Thongsri. 2020. "A Novel Ultrasonic Cleaning Tank Developed by Harmonic Response Analysis and Computational Fluid Dynamics" Metals 10, no. 3: 335. https://doi.org/10.3390/met10030335
APA StyleTangsopa, W., & Thongsri, J. (2020). A Novel Ultrasonic Cleaning Tank Developed by Harmonic Response Analysis and Computational Fluid Dynamics. Metals, 10(3), 335. https://doi.org/10.3390/met10030335