Abstract
Elucidating the evolution law of the elastic properties of the matrix phase is of great significance for the control of steel properties and quality during continuous casting and subsequent heat treatment. In this paper, thermal expansion experiments and ab initio calculations are used to study the elastic properties of the interstitial free (IF) steel matrix phase in different magnetic states and crystal structures. The results show that the bulk modulus B and the tetragonal shear elastic constant C’ for the entire temperature range decrease with increasing temperature, but C44 is the opposite. While from paramagnetic (PM) to ferromagnetic (FM) state, C’(C44) have changed ~188% (~27%), B increases by ~55% during the crystal structure change (fcc→bcc). With the FM to PM state, the Zener anisotropy parameter increases sharply, and Young’s modulus decreases significantly in the [001] direction; the maximum difference is ~76 GPa. The evolution rate of average Young’s modulus in single bcc-phase FM (fcc-phase PM) range reaches ~5.5(~5.6) × 10−2 GPa K−1. The research provides an effective method for ab initio calculation of the elastic properties of interstitial free and ultra-low carbon steels at high temperature, also furnishing a basis for the application of ab initio calculations to the high temperature performance of steel materials.
1. Introduction
Interstitial free (IF) steel provides a combination of deep drawability, formability, and weldability, and hence has been widely used in the automobile industry in recent years [1,2,3]. As a type of ultralow carbon ferritic steel in which the content of interstitial elements (C and N) is strictly controlled [4], the properties of IF steel matrix phase make a fundamental contribution to the properties of the steel. Experimentally, it is well known that the matrix phase of the body-centered cubic (bcc) structure at the low temperature stage undergoes a phase transition to the face-centered cubic (fcc) structure at 1185 K and then transitions to another bcc stage at 1667 K [5]. In addition to these structural transformations, the magnetic transition of the matrix phase near Curie temperature (1043 K) is known to have an impact on the metallurgy of steels [6].
The elastic properties of high-temperature phases are of practical importance in the high-temperature applications of steel, mainly because the manufacture of various grades of steel undergoes heat treatments and/or mechanical treatments in the phase transition region [7]. Despite their importance, experimental data on the elastic properties of matrix phase are very scarce. Only one study reports the elastic properties of the high temperature at 1428 K, which is evaluated by the phonon dispersion relationship obtained by Zarestky in neutron scattering experiments [8]. The situation is similar for δ-Fe, for which there is only one set of data available [9]. Tsujino et al. used the high temperature Birch–Murnaghan equation of state to obtain the temperature dependence of the isothermal bulk modulus of γ-Fe by extrapolating the data of compressibility measurements [10].
Ab initio calculation can provide the necessary information when experimental data are lacking due to difficulties in high temperature measurement and sample preparation. Ab initio calculation is particularly difficult at finite-temperature (T > 0 K), which is closely related to the complex thermal-magnetic coupling effects in thermally excited states, lattice vibrations, and anharmonicity effects at high temperatures. In a limited study, Vitos et al. [11,12,13] calculated the intrinsic properties such as the stacking fault energy and elastic constant of austenitic stainless steel at ~500 K as a function of temperature by simplifying the thermo-magnetic coupling in the system. Lu et al. [14,15] discussed the evolution of fcc γ-Fe and austenite fault energy with temperature based on the lattice thermal expansion and volume-magnetic interaction as the main thermal effects. Ehteshami et al. [7] calculated the thermophysical properties of Fe at 1000−1800 K, but the calculation results seem to underestimate the thermal expansion of the crystal lattice compared with the experimental data. In summary, ab initio calculation at high temperature relies on a large number of computing resources, and the calculation process is quite complicated. The volume expansion is an important temperature effect from lattice anharmonicity [16]. Actually, the thermal lattice expansion is recognized as the main parameter influencing the temperature [14]. Based on the thermal expansion effect of the lattice, the results of static calculation can be extended to the entire high temperature range by the thermal expansion curve, greatly simplifying the calculation process due to the avoidance of the complex coupling of thermo-magnetic effects.
As the IF steel matrix phase is nearly completely free of solute interstitials, the calculation using ab intio would be more realistic. In this paper, through the thermal expansion experiments of IF steel and the static ab initio calculation of the matrix phase, the evolution relationship of the elastic properties of the IF steel matrix phase with temperature is obtained. Then, the change of the matrix phase elastic properties is discussed, due to the transition in magnetic state and crystal structure. Moreover, the additional objective in current study provides a simplified and effective ab initio calculation, as a computational technique to evaluate the evolution law of interstitial free and ultra-low carbon steels at high temperatures.
2. Materials and Methods
2.1. Ab Initio Computational Methods
IF steel is nearly completely free of interstitial atoms, and the influence of carbon and other elements are ignored in the calculation model. Only the properties of the matrix phase under different magnetic states and crystal structures are considered. All calculations in this study are performed using the exact muffin-tin orbitals (EMTO) method [17], in combination with the coherent potential approximation (CPA) [18]. The EMTO-CPA approach can accurately trace energy change related to lattice distortion in complex alloys [13], widely used in the phase stability, magnetic behavior and mechanical performance of Fe-based alloys [19,20]. The Perdew–Burke–Ernzerhof (PBE) exchange correlation approximation [21] is used to obtain the charge density and total energy. Before theoretical calculations, careful testing of convergence with respect to k points and the Brillouin zone integrations are performed on 27 × 27 × 27 k-points mesh. The paramagnetic state is modeled with the disordered local moment (DLM) approximation [22]. At high temperatures, the spin magnetic moment of electrons would fluctuate around its expected value, which affects the magnetic susceptibility and Curie temperature of the system to a certain extent [16]. Current research usually takes 1043 K as the temperature of the magnetic transition of iron [6,23], ignoring the effect of electron spin fluctuations on the Curie temperature. Therefore, in order to simplify the calculations, all calculations are performed on completely disordered solid solutions, considering static lattices and neglecting electronic and magnetic thermal excitations.
The elastic constants describe the crystal’s response to relatively small external forces and provide important information concerning the nature of the internal forces operating in the solids [24]. For cubic lattices, there are three independent elastic constants, C11, C12, and C44. Elastic constants C11 and C12 can be derived from the bulk modulus B and the tetragonal shear modulus C′: B = (C11 + 2C12)/3 and C′ = (C11 − C12)/2. The bulk modulus B is obtained by fitting total energies as an exponential Morse-type function [17]. According to the scheme proposed by Mehl [25], the set of primitive vectors is transformed to obtain a uniform lattice distortion:
where and are the original and the new vectors, I is the 3 × 3 identity matrix, and ε is a strain tensor matrix.
The orthorhombic distortion given by the following strain tensor is used to calculate the tetragonal shear modulus C′:
and the corresponding energy change is
The C44 elastic constant is calculated using a monoclinic distortion:
and the corresponding energy change is
where the distortion parameter δ is set to be 0.00, 0.01, …, 0.05, according to Mehl’s prescription [26].
The polycrystalline elastic modulus can be obtained by transforming the single elastic constants with suitable averaging methods. Here, the Voigt–Reuss–Hill averaging method [27] is employed to estimate the shear modulus:
The Young’s modulus Y, Poisson ratio v, and the Zener anisotropy parameter AZ can be calculated from the following equations [17]:
2.2. Materials and Experimental Procedures
The material, i.e., IF steel, used for the present study is collected from a commercial steel plant, and the carbon composition of the casting slab is 25 ppm. The dilatometry experiments are initially performed on a high-resolution dilatometer DIL402 (Netzsch, Germany). Cylindrical specimens for dilatometry with a length of 25 mm and a diameter of 4 mm are machined, and then, the specimens are polished and cleaned with the standard sample preparation method. As shown in Figure 1, all samples are employed from a continuously casting slab 230 mm in thickness with the axes parallel to the casting direction, and the sample locations are at around 10 mm below the surface and more than 100 mm away from the narrow face.
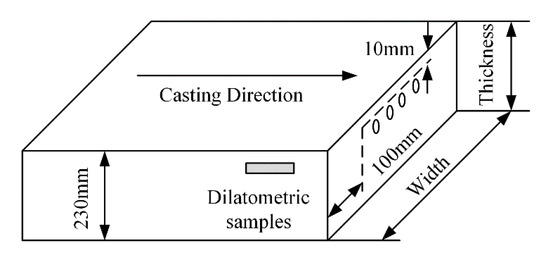
Figure 1.
Schematic diagram of the position for samples.
Currently, the average cooling rate in the secondary cooling zone is less than 30 K/min during the continuous casting [28,29]. Meanwhile, it can be found that the austenite decomposition temperatures (Ar3 and Ar1) are inversely proportional to the cooling rate, but the linear thermal expansion coefficient of the single-phase region at different cooling rates does not seem to be significantly different according to the published literatures [30,31]. Therefore, dilatometry experiments are performed with a cooling rate of 5 K/min in this work to obtain an austenite decomposition temperature as accurate as possible (close to the equilibrium). The detailed schematic of experimental procedures is illustrated as follows. The dilatometric specimen is heated to 1473 K with a heating rate of 5 K/min; kept for 5 min at this temperature to make the specimen temperature homogenize; and thereafter, cooled to 473 K with the cooling rate of 5 K/min. In the whole experiment process, a stable argon gas flow of 100 mL/min is maintained in the dilatometer chamber to prevent specimen oxidation.
3. Results and Discussion
3.1. Thermal Expansion and Phase Transition Behavior of IF Steel
Because of the lattice structure difference between austenite (face centered cubic, fcc) and ferrite (body-centered cubic, bcc), austenite decomposition during continuous casting is generally accompanied by a specific volume expansion due to the lattice structure change. Thus, a significant dimensional change on the cooling dilation curve can be observed. The change in specimen length is usually presented by a function of temperature. Based on the measured linear change curve during continuous cooling, the linear thermal expansion coefficient (LTEC) of austenite decomposition can be definitely obtained by Equation (8).
where β is the LTEC of steel, K−1; LT and dLT are the length and the length change of the sample, mm; dT is the corresponding temperature interval, K.
Figure 2 shows that the relative changes in the length of the IF steel sample and the thermal expansion coefficient are a function of temperature. Cooling of the sample shows a decrease in the specimen dimension until it reaches 1183 K. After that, there is an increase in dilation up to 1143 K, which is followed by a decrease in dilation again due to contraction of the specimen up to room temperature. Thus, Ar3 and Ar1 for the present material are estimated to be 1183 K and 1143 K, respectively. Moreover, the dilation curve shows clearly the linear thermal expansion characteristics in the two temperature ranges where no phase transformation occurred. In the single austenite region, the change of sample length linearly decreases with a constant slope around −2.30 × 10⁻⁵ K−1. In the region of austenite decomposition finish, the change of the sample length linearly decreases with a constant slope around 1.54 × 10⁻⁵ K−1. The negative value reflects the contraction behavior of sample during continuous cooling, whereas a positive value means expansion.
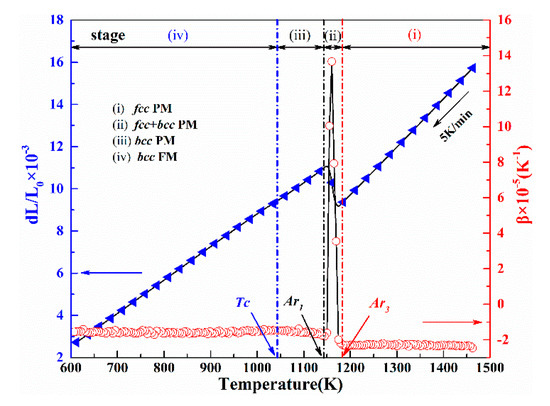
Figure 2.
Expansion curve and linear thermal expansion coefficient (LTEC) curve of sample at heating rate of 5 K/min.
At the same time, the matrix phase undergoes a FM to PM transition near the Curie temperature (1043 K). Therefore, during the continuous cooling process from 1473 K, the steel has gone through four stages: (i) single fcc-phase PM region; (ii) coexistence fcc + bcc phase PM region; (iii) single bcc-phase PM region; and (iv) single bcc-phase FM region. Nevertheless, ab initio calculations of coexisting structures are particularly difficult in computational materials science. Moreover, the coexistence region is limited in the whole temperature range. Thus, single fcc-phase PM, bcc-phase PM, and bcc-phase FM three different regions are considered in the subsequent calculations to simplify the calculation, respectively.
3.2. Calculation of Wigner–Seitz Radii w Based on Thermal Expansion
In the EMTO ab initio calculations, Wigner-Seitz radius w (bohr) is an important parameter, and the atomic volume VA can be shown as . Meanwhile, the expansion curve provides important information such as atomic volume changes and critical temperatures due to phase transitions. As the Figure 3 shows, pearlite is not observed in the microstructure due to ultra-low C content (0.0025%) in the IF steel. Thus, the influence of cementite on average atomic volume is ignored in the calculation.
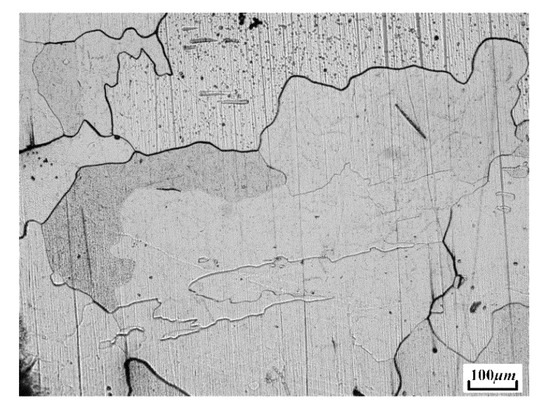
Figure 3.
Microstructure of the IF steel after thermal experiment.
The atomic volume of austenite and ferrite can be theoretically obtained from the different lattice structures as:
where the coefficients 1/4 and 1/2 in the equations are related to the number of lattice atoms contained in a unit cell of different lattice structures. and are the lattice parameters of austenite and ferrite, and they can be calculated by:
where βγ, α are the linear thermal expansion coefficients of austenite and ferrite, which can be obtained from the thermal expansion curve. Moreover, is the lattice parameter of ferrite at room temperature, taken to be that of pure iron ( Å); and is the lattice parameter of austenite as a function of the chemical composition of the austenite [32]:
according to Equations (9)–(13), combined with thermal expansion experimental data, the Wigner–Seitz radius w can be obtained as a function of temperature.
The result of Wigner–Seitz radii w based on dilatometry are plotted as functions of temperature in Figure 4. It is worth noting that the results of Basinski et al. [33] and Acet et al. [34] according to the lattice parameters of pure iron are also included for comparison. The test results are in good agreement with the existing literature in the single bcc-phase and fcc-phase region, which should be related to the small amount of alloying elements in the IF steel matrix phase. In particular, the calculated slopes of temperature dependencies are similar to the experimental observations. Meanwhile, Wigner–Seitz radius w (bohr) of single bcc-phase and fcc-phase ranges are fitted (red dashed lines) as a function of temperature, as shown in Equations (14) and (15):
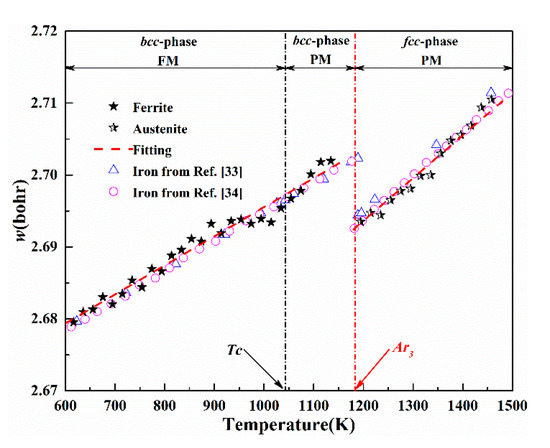
Figure 4.
Wigner–Seitz radius w of single bcc-phase and fcc-phase as a function of temperature. Experimental data of lattice parameter measurements (open symbols) from References [33,34] are taken. Solid symbols show the dilation test temperature dependencies of the Wigner–Seitz radius for single bcc-phase and fcc-phase, from left to right, and their linear regressions are plotted with red dashed lines.
3.3. Elastic Properties of IF Steel Matrix Phase
3.3.1. Magnetic Moment and Elastic Constants
Partially disordered ferromagnetic state with long-range magnetic order parameter (magnetization) m is approximately a random alloy such that m = 1 − 2y. In the completely ordered FM state, one has m = 1. The disordered paramagnetic state with m = 0 reduces to the well-known disordered local moment (DLM) state, which for pure Fe is represented by a random alloy of Fe atoms with spin up (↑) and spin down (↓) orientations [35]. Figure 5 shows the variation of the matrix phase magnetic moment with temperature in the different magnetic state and crystal structure; available experimental and calculated data are plotted in the figure. The calculated value agrees with the experimental data from Reference [36] in the single bcc-phase FM region, and the calculated slopes of temperature dependencies are similar to those in the Reference [7]. Above the Curie temperature. The magnetic moment shows a downward trend as the temperature rises, but the opposite evolution law appears in the single bcc-phase FM, bcc-phase PM and fcc-phase PM region. The transition of magnetic state and crystal structure greatly affects the magnetic moment; the values obtained in this work are reduced from 2.28~2.33μB in single bcc-phase FM to 1.81~1.96μB in fcc-phase PM region. The magnetic moment has increased by ~10% and ~16% with the transition of magnetic state (PM→FM) and crystal structure (fcc→bcc).
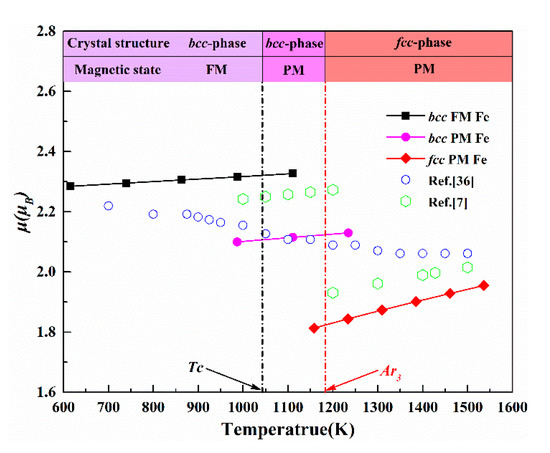
Figure 5.
Variation of magnetic moment μ with temperature. The values of present results are plotted as solid symbols connected with lines and the available data from Reference [36] are represented as open symbols.
The mechanical strength of the material is the stress required to force deformation or fracture due to the instability of the crystal lattice [37]. The two cubic shear elastic constants C′ and C44 describe the ability of the crystal to resist orthorhombic and monoclinic deformation, respectively. The bulk modulus B is used to assess the capacity to resist deformation under an applied pressure. As shown in Figure 6, the elastic moduli obtained in this work are basically consistent with the results of other calculations and experiments. Like the bulk modulus B obtained in published literature, the calculated elastic moduli exhibit a normal softening behavior with increasing temperature. According to Figure 6, the bulk modulus B decreases in a monotonic manner as the temperature increases, which indicates that the ability of the matrix phase to resist compression decreases at high temperature. It is worth noting that tetragonal shear elastic constant C′ also shows a similar evolution law (except that it is stable around 17.90 GPa in the single bcc-phase PM region), which shows that the ability of the matrix phase to resist orthorhombic deformation decreases with increasing temperature. C44 decreases almost linearly in the three single phase ranges, and the evolution rate is ~2.1 × 10⁻², ~1. 8 × 10⁻², and ~3.5 × 10⁻² GPa K−1 for single bcc-phase FM, bcc-phase PM, and fcc-phase PM, respectively. Moreover, noting that the bulk modulus B is improved ~55% when the crystal structure is transitioned from fcc to bcc; C′ and C44 have changed ~188% and ~27% with the transformation of magnetic state.
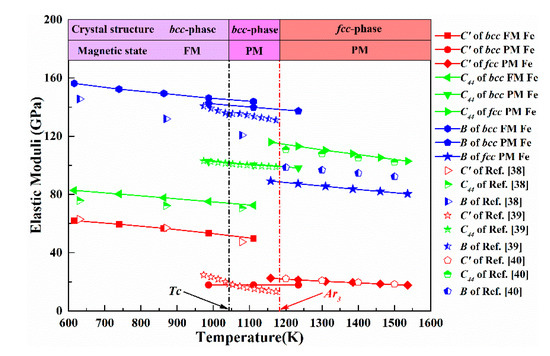
Figure 6.
Calculated temperature dependence of elastic moduli of bcc-phase FM, bcc-phase PM, and fcc-phase PM in comparison with published data of References [38,39,40].
3.3.2. Young’s modulus, Zener Anisotropy Parameter, and Poisson’s Ratio
The Young’s modulus Y and the Zener anisotropy parameter AZ are the important characteristic parameters for investigating the mechanical properties in the process of material deformation. Y reflects the stiffness of crystals, where larger values indicate stiffer crystals. AZ equals to 1 for an isotropic crystal, while values smaller or greater than unity measure the degree of elastic anisotropy. The change of the anisotropy parameter of matrix phase with temperature is further illustrated in Figure 7, where the 3D characteristic surfaces and the 2D section (110) of the Young’s modulus are plotted. AZ is rather weak in single bcc-phase FM range and simultaneously becomes strongly elastically anisotropic in the paramagnetic phase above TC; see Figure 7f. The high anisotropy values are mainly due to softening of C’ in the paramagnetic state of the matrix phase. This softening of the crystal lattice with respect to tetragonal shear has important metallurgical implications, e.g., for the activation energy of carbon diffusion in steel [39]. Figure 7a–e can further illustrate the effect of the transition of magnetic state and crystal structure on elastic anisotropy. All structures exhibit anisotropy, especially under high temperature paramagnetic conditions. As the Figure 7a,b,e shows, the degree of anisotropy of bcc-phase FM is the smallest, and it increases significantly in bcc-phase PM with the magnetic state change around TC; the Young’s modulus change in the [001] direction is particularly significant. At 1043 K, with the transition from FM to PM, the maximum difference between the Young’s modulus in the [110] direction is ~76 GPa, a decrease of ~55%. Similarly, the minimum Young’s modulus in the [001] direction is reduced from 173 GPa to 126 GPa. As (c), (d), and (e) show, the effect of the crystal structure transition near Ar3 is not significant, and the maximum changes in Young’s modulus in the [110] and [001] directions are 14 GPa and 10 GPa, respectively. Meanwhile, as the temperature in the bcc-phase PM region increases, the changes in Young’s modulus in the [110] and [001] directions are smaller. Overall, the Young’s modulus of the matrix phase in the [001] direction is generally lower than in the [110] direction.
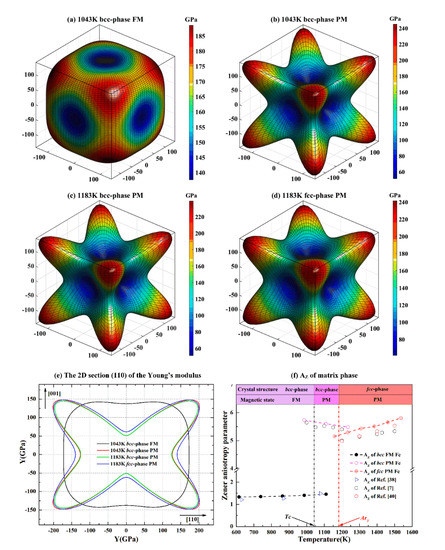
Figure 7.
Calculated 3D characteristic surfaces (a–d) and the 2D section (110) of the Young’s modulus as a function of crystallographic direction in IF steel matrix phase. The values on the color scale and on the axes are in GPa. The Zener anisotropy parameter AZ is plotted against temperature for the matrix phase, along with the available data (open symbols) from References [7,38,39,40]. (a) 1043 K bcc-phase FM, (b) 1043 K bcc-phase PM, (c) 1083 K bcc-phase PM, (d) 1083 K fcc-phase PM, (e) the 2D section (110) of the Young’s modlus, (f) AZ of matrix phase.
In order to comprehensively evaluate the evolution law of the Young’s modulus Y and Poisson’s ratio v of the matrix phase with temperature, the Hill average method is adopted, as shown in Figure 8. Y (v) monotonically increases (decreases) with the temperature decrease in the single fcc-phase PM and bcc-phase FM regions at the evolution rates of ~5.5 × 10⁻² and ~5.6 × 10⁻² GPa K−1 (~3.3 × 10⁻⁵ and ~2.9 × 10⁻⁵ K−1) but is relatively stable in the bcc-phase PM region. Based on the above results, in the single fcc-phase PM and bcc-phase FM ranges, the ability of the matrix phase to return to original shape when elastically deformed decreases rapidly with increasing temperature. In addition, the influence of the transition of the magnetic state on Y seems to be obvious compared to the transition of the crystal structure, and the opposite result appears in v. Meanwhile, the matrix phase in the high temperature fcc-phase PM region shows brittleness characteristics according to the Pugh criterion [41], that the materials prefer brittleness when v < 0.26.
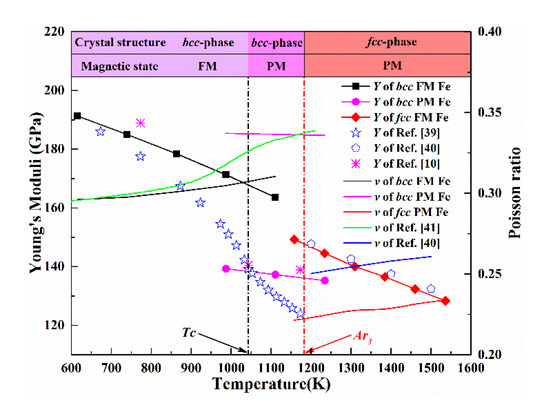
Figure 8.
Relationship of average Young’s modulus and Poisson’s ratio of matrix phase with temperature for different lattice and magnetic structures, along with the available data from References [40,42].
4. Conclusions
In this paper, combining the thermal expansion test of IF steel with EMTO ab initio calculation, a simple calculation method of high temperature elastic properties is proposed instead of a complicated self-consistent process. The evolution of the elastic properties of the matrix phase with temperature under different magnetic states and crystal structures is analyzed. The conclusions are as follows:
The austenite decomposition temperature range of IF steel samples is 1183~1143 K. The LTEC of the single-phase ferrite and austenite region is 1.54 × 10⁻⁵ K−1 and –2.30 × 10⁻⁵ K−1, respectively. Good agreement is found between the Wigner–Seitz radii w based on thermal expansion test of IF steel and available experimental data. The linear regression for single bcc-phase ferrite is w(T) = 2.65513 + 4.03963 × 10⁻⁵ T and for single fcc-phase austenite is w(T) = 2.61340 + 6.61356 × 10⁻⁵ T.
Over the entire temperature range, the bulk modulus B and the tetragonal shear elastic constant C′ exhibit a normal softening behavior with increasing temperature, while the ability to resist monoclinic deformation tends to increase. The transition of the magnetic state has an important effect on the two cubic shear elastic constants C′ and C44; the bulk modulus B increases by ~55% with the transition from fcc-phase to bcc-phase; magnetic state and crystal structure contribute equivalent magnetic moments.
The Zener anisotropy parameter AZ increases rapidly above the Curie temperature, and the Young’s modulus decreases significantly in the [001] direction, a decrease of ~55%. The evolution rate of average Young’s modulus (Poisson’s ratio) in single bcc-phase FM and fcc-phase PM range reaches ~5.5 × 10⁻² and ~5.6×10⁻² GPa K−1 (~3.3×10⁻⁵ and ~2.9×10⁻⁵ K−1). The single fcc-phase PM range has a Poisson’s ratio of less than 0.26, showing brittleness characteristics.
Author Contributions
Conceptualization, data curation, writing—original draft, writing—review and editing, S.A., Z.D. and M.L.; visualization, investigation, formal analysis, writing—original draft, S.Z., P.L. and Y.Z.; supervision, M.L., D.C. and H.D. All authors have read and agreed to the published version of the manuscript.
Funding
This work is supported financially by the Natural Science Foundation of China (NSFC, Project Nos. 51874059, U1960113 and 51874060) and the Natural Science Foundation of Chongqing (Project No. cstc2018jcyjAX0647 and cstc2018jszx-cyzdX0076).
Acknowledgments
The authors thank the members of Laboratory of Metallurgy and Materials, Chongqing University, for the support of this work.
Conflicts of Interest
The authors declare no conflict of interest.
References
- Liu, B.P.H.; Yang, J.R.; Wu, Y.; Shen, P.; Fu, J.; Chen, C.Y.; Wang, S.H.; Tsai, M.C.; Huang, C.Y. Investigation of massive ferrite in an interstitial-free steel. Mater. Charact. 2019, 157, 109920. [Google Scholar] [CrossRef]
- Yin, A.; Xu, X.; Zhang, S.; Glorieux, C.; Shu, X.; Wang, Y.; Yan, X. Characterization of Texture Evolution during Recrystallization by Laser-Induced Transient Thermal Grating Method. Metals 2019, 9, 288. [Google Scholar] [CrossRef]
- Konrádyová, J.; Longauerová, M.; Jonšta, P.; Jonšta, Z.; Longauer, S.; Girman, V.; Vojtko, M.; Bořuta, A.; Matvija, M.; Fujda, M.; et al. Hot ductility of TiNb IF steel slab after hot torsion testing. Metals 2019, 9, 752. [Google Scholar] [CrossRef]
- Majumdar, S.; Bhattacharjee, D.; Ray, K.K. Mechanism of fatigue failure in interstitial-free and interstitial-free high-strength steel sheets. Scr. Mater. 2011, 64, 288–291. [Google Scholar] [CrossRef]
- Chen, Q.; Sundman, B. Modeling of thermodynamic properties for Bcc, Fcc, liquid, and amorphous iron. J. Phase Equilib. 2001, 22, 631–644. [Google Scholar] [CrossRef]
- Körmann, F.; Breidi, A.A.H.; Dudarev, S.L.; Dupin, N.; Ghosh, G.; Hickel, T.; Korzhavyi, P.; Muñoz, J.A.; Ohnuma, I. Lambda transitions in materials science: Recent advances in CALPHAD and first-principles modelling. Phys. Status Solidi B 2014, 251, 53–80. [Google Scholar] [CrossRef]
- Ehteshami, H.; Korzhavyi, P.A. Thermophysical properties of paramagnetic Fe from first principles. Phys. Rev. B 2017, 96, 224406. [Google Scholar] [CrossRef]
- Zarestky, J.; Stassis, C. Lattice dynamics of γ-Fe. Phys. Rev. B 1987, 35, 4500. [Google Scholar] [CrossRef]
- Neuhaus, J.; Leitner, M.; Nicolaus, K.; Petry, W.; Hennion, B.; Hiess, A. Role of vibrational entropy in the stabilization of the high-temperature phases of iron. Phys. Rev. B 2014, 89, 184302. [Google Scholar] [CrossRef]
- Tsujino, N.; Nishihara, Y.; Nakajima, Y.; Takahashi, E.; Funakoshi, K.I.; Higo, Y. Equation of state of γ-Fe: Reference density for planetary cores. Earth Planet. Sci. Lett. 2013, 375, 244–253. [Google Scholar] [CrossRef]
- Vitos, L.; Nilsson, J.O.; Johansson, B. Alloying effects on the stacking fault energy in austenitic stainless steels from first-principles theory. Acta Mater. 2006, 54, 3821–3826. [Google Scholar] [CrossRef]
- Vitos, L.; Johansson, B. Large magnetoelastic effects in paramagnetic stainless steels from first principles. Phys. Rev. B 2009, 79, 024415. [Google Scholar] [CrossRef]
- Vitos, L.; Korzhavyi, P.A.; Johansson, B. Evidence of large magnetostructural effects in austenitic stainless steels. Phys. Rev. Lett. 2006, 96, 117210. [Google Scholar] [CrossRef] [PubMed]
- Li, W.; Lu, S.; Hu, Q.M.; Johansson, B.; Kwon, S.K.; Grehk, M.; Johnsson, J.Y.; Vitos, L. Generalized stacking fault energy of γ-Fe. Philos. Mag. 2016, 96, 524–541. [Google Scholar] [CrossRef]
- Lu, S.; Hu, Q.M.; Johansson, B.; Vitos, L. Stacking fault energies of Mn, Co and Nb alloyed austenitic stainless steels. Acta Mater. 2011, 59, 5728–5734. [Google Scholar] [CrossRef]
- Dong, Z.; Li, W.; Chen, D.; Schönecker, S.; Long, M.; Vitos, L. Longitudinal spin fluctuation contribution to thermal lattice expansion of paramagnetic Fe. Phys. Rev. B 2017, 95, 054426. [Google Scholar] [CrossRef]
- Vitos, L. Computational Quantum Mechanics for Materials Engineers: The EMTO Method and Applications; Springer: London, UK, 2007; pp. 1–115. [Google Scholar]
- Gyorffy, B.L. Coherent-potential approximation for a nonoverlapping-muffin-tin-potential model of random substitutional alloys. Phys. Rev. B 1972, 5, 2382. [Google Scholar] [CrossRef]
- Huang, S.; Li, W.; Li, X.; Schönecker, S.; Bergqvist, L.; Holmström, E.; Varga, L.K.; Vitos, L. Mechanism of magnetic transition in FeCrCoNi-based high entropy alloys. Mater. Des. 2016, 103, 71–74. [Google Scholar] [CrossRef]
- Zhang, H.; Li, X.; Schönecker, S.; Jesperson, H.; Johansson, B.; Vitos, L. Anomalous elastic hardening in Fe-Co alloys at high temperature. Phys. Rev. B 2014, 89, 184107. [Google Scholar] [CrossRef]
- Perdew, J.P.; Burke, K.; Ernzerhof, M. Generalized gradient approximation made simple. Phys. Rev. Lett. 1996, 77, 3865. [Google Scholar] [CrossRef]
- Staunton, J.; Gyorffy, B.L.; Pindor, A.J.; Stocks, G.M.; Winter, H. The “disordered local moment” picture of itinerant magnetism at finite temperatures. J. Magn. Magn. Mater. 1984, 45, 15–22. [Google Scholar] [CrossRef]
- Dong, Z.; Li, W.; Schönecker, S.; Lu, S.; Chen, D.; Vitos, L. Thermal spin fluctuation effect on the elastic constants of paramagnetic Fe from first principles. Phys. Rev. B 2015, 92, 224420. [Google Scholar] [CrossRef]
- Jhi, S.H.; Ihm, J.; Louie, S.G.; Cohen, M.L. Electronic mechanism of hardness enhancement in transition-metal carbonitrides. Nature 1999, 399, 132. [Google Scholar] [CrossRef]
- Mehl, M.J.; Klein, B.M.; Papaconstantopoulos, D.A. Intermetallic Compounds: Principle and Practice. Volume I: Principles; Wiley: London, UK, 1995; pp. 195–210. [Google Scholar]
- Mehl, M.J. Pressure dependence of the elastic moduli in aluminum-rich Al-Li compounds. Phys. Rev. B 1993, 47, 2493. [Google Scholar] [CrossRef] [PubMed]
- Hill, R. The elastic behaviour of a crystalline aggregate. Proc. Phys. Soc. A 1952, 65, 349. [Google Scholar] [CrossRef]
- Long, M.; Chen, D.; Zhang, L.; Zhao, Y.; Liu, Q. A mathematical model for mitigating centerline macro segregation in continuous casting slab. Metal. Int. 2011, 16, 19–33. [Google Scholar]
- Long, M.; Dong, Z.; Chen, D.; Zhang, X.; Zhang, L. Influence of cooling rate on austenite transformation and contraction of continuously cast steels. Ironmak. Steelmak. 2015, 42, 282–289. [Google Scholar] [CrossRef]
- Dong, Z.; Chen, D.; Long, M.; Li, W.; Chen, H.; Vitos, L. Computation of phase fractions in austenite transformation with the dilation curve for various cooling regimens in continuous casting. Metall. Mater. Trans. B 2016, 47, 1553–1564. [Google Scholar] [CrossRef]
- Liu, T.; Long, M.; Fan, H.; Chen, D.; Chen, H.; Duan, H.; Jiang, W.; He, W. Dilatometric determination of four critical temperatures and phase transition fraction for austenite decomposition in hypo-eutectoid steels using peak separation method. J. Mater. Res. 2018, 33, 967–977. [Google Scholar] [CrossRef]
- Dyson, D.J. Effect of alloying additions on the lattice parameter of austenite. J. Iron Steel Inst. 1970, 208, 469–474. [Google Scholar]
- Basinski, Z.S.; Hume-Rothery, W.; Sutton, A. The lattice expansion of iron. Proc. R. Soc. Lond. Ser. A 1955, 229, 459–467. [Google Scholar]
- Acet, M.; Zähres, H.; Wassermann, E.F.; Pepperhoff, W. High-temperature moment-volume instability and anti-Invar of γ-Fe. Phys. Rev. B 1994, 49, 6012. [Google Scholar] [CrossRef] [PubMed]
- Gyorffy, B.L.; Pindor, A.J.; Staunton, J.; Stocks, G.M.; Winter, H. A first-principles theory of ferromagnetic phase transitions in metals. J. Phys. F Met. Phys. 1985, 15, 1337. [Google Scholar] [CrossRef]
- Pan, F.; Chico, J.; Delin, A.; Bergman, A.; Bergqvist, L. Extended spin model in atomistic simulations of alloys. Phys. Rev. B 2017, 95, 184432. [Google Scholar] [CrossRef]
- Clatterbuck, D.M.; Chrzan, D.C.; Morris, J.W., Jr. The ideal strength of iron in tension and shear. Acta Mater. 2003, 51, 2271–2283. [Google Scholar] [CrossRef]
- Razumovskiy, V.I.; Ruban, A.V.; Korzhavyi, P.A. Effect of temperature on the elastic anisotropy of pure Fe and Fe 0.9 Cr 0.1 random alloy. Phys. Rev. Lett. 2011, 107, 205504. [Google Scholar] [CrossRef]
- Dever, D.J. Temperature dependence of the elastic constants in α-iron single crystals: Relationship to spin order and diffusion anomalies. J. Appl. Phys. 1972, 43, 3293–3301. [Google Scholar] [CrossRef]
- Hutchinson, B.; Malmström, M.; Lönnqvist, J.; Bate, P.; Ehteshami, H.; Korzhavyi, P.A. Elasticity and wave velocity in fcc iron (austenite) at elevated temperatures–Experimental verification of ab-initio calculations. Ultrasonics 2018, 87, 44–47. [Google Scholar] [CrossRef]
- Pugh, S.F. XCII. Relations between the elastic moduli and the plastic properties of polycrystalline pure metals. Philos. Mag. 1954, 45, 823–843. [Google Scholar] [CrossRef]
- Lindgren, L.E.; Back, J.G. Elastic properties of ferrite and austenite in low alloy steels versus temperature and alloying. Materialia 2019, 5, 100193. [Google Scholar] [CrossRef]


© 2020 by the authors. Licensee MDPI, Basel, Switzerland. This article is an open access article distributed under the terms and conditions of the Creative Commons Attribution (CC BY) license (http://creativecommons.org/licenses/by/4.0/).