Article

Influence of Martensite Deformation on Cu Precipitation Strengthening

COMTES FHT a.s., Prumyslova 995, 334 41 Dobrany, Czech Republic
*
Author to whom correspondence should be addressed.
Metals 2020, 10(2), 282; https://doi.org/10.3390/met10020282
Submission received: 31 December 2019 / Revised: 14 February 2020 / Accepted: 15 February 2020 / Published: 21 February 2020

Abstract

:
Cu precipitation strengthening was compared in steels after treatments with and without cold rolling. A 0.2% C steel containing up to 1.5% Cu was quenched and tempered. Cu precipitation took place during tempering and increased its yield strength (YS). Quenched and tempered samples were compared with samples where cold rolling was performed between quenching and tempering. They exhibited significantly different mechanical properties. In addition, Cu alloying influenced the properties of each group of samples in different ways. The quenched and tempered samples exhibited behavior that is typical of precipitation hardening. Cu caused yield strength to increase with tempering temperature and time. The cold rolling of martensite reduced the maximal Cu-related strengthening and also eliminated its time and temperature dependence.

1. Introduction

Researchers of high strength steels continue to seek new ways to enhance the strength of these materials without compromising their ductility. Precipitation hardening is one of the available methods. Copper is one of the elements that is used for precipitation hardening of steels. Copper precipitation in ferrite is one of the strengthening mechanisms of steels that has been studied extensively in recent decades [1,2,3,4].
Cu precipitates from supersaturated ferrite. Cu solubility in ferrite increases with temperature: negligible at room temperature, it reaches 1 wt.% at 700 °C and 1.8 wt.% at 850 °C. The solubility of copper in austenite is higher: 5 wt.% at 900 °C [5]. Quenching and tempering is therefore one way to induce Cu precipitation. At austenitization temperatures, Cu is present in solid solution and remains there during quenching. The resulting martensite is supersaturated with Cu, which then precipitates out upon tempering. Cu precipitation was reported as a sequence involving the formation of coherent bcc Cu clusters in the ferrite matrix, which transform to 9R twinned particles, and, finally, become incoherent fcc (face-centered cubic) Cu particles [6]. Studies have identified Cu precipitation and described its kinetics at temperatures as low as 400 °C [3]. The amount of precipitation strengthening generally depends on the precipitation stage and shows a typical peak at a particular state of the precipitates. However, it is not clear whether the effect of strengthening is mainly related to the precipitate type (bcc, 9R, or fcc) [7,8] or to its size and spatial density [9,10].
A previous study by the authors [11] showed the influence of Cu and Mn on yield stress (YS) of quenched and tempered 0.2 C boron steel microalloyed by Ti. This alloying concept could be beneficial due to the possible synergy of Cu and TiC precipitation [12,13,14,15,16].
This paper deals with the effect of the condition of a martensitic structure on precipitation strengthening. As-quenched martensite and cold-rolled martensite structures were tempered and their mechanical properties and microstructure were examined. The impact of the initial microstructure was rarely studied in the literature known to the authors. Most studies are devoted to time, temperature, or composition dependence of Cu precipitation.
The present experiment involved the comparison of two treatment routes: quenching and tempering vs. quenching, cold rolling, and tempering. Three experimental 0.2 C steels with different Cu contents were studied. The cold rolling operation produced crystal lattice defects in martensite and led to different substructures after tempering. This affected the Cu-related strengthening significantly.

2. Materials and Methods

Three experimental melts with different Cu levels were made and cast. Their chemical compositions are given in Table 1. Sheets 3.2 mm in thickness and 300 mm in width were produced by forging and hot and cold rolling. The production route was described in the previous study [11]. Samples were cut out in the form of plates 75 mm in width and 250 mm in length. Their longer side was parallel to the sheet rolling direction.
The samples were austenitized in an electric atmospheric furnace (manufacturer: BVD pece spol. s.r.o., Podlesí, Czech Republic) at 870 °C for 30 min. Protective coating Tinderex (AZ PROKAL s.r.o, Brno, Czech Republic) was applied beforehand to avoid sample scaling and decarburization. Quenching was carried out by immersion into a water bath. Cold deformation by rolling followed within 1 h of quenching. The samples were ground with sandpaper (120 grit) to remove the protective coating, and then rolled in a 4-high rolling mill (První železářská společnost Kladno, s.r.o., Kladno, Czech Republic) at a speed of 0.25 m/s. The samples were cooled with water-oil emulsion during rolling. A thickness reduction of 50% was obtained in all samples in 15 consecutive passes.
The tempering temperatures and times are given in Table 2. Samples produced by this route are identified as QRT (quenched, rolled, and tempered). Smaller specimens were cut from these samples for testing mechanical properties and for structural analysis.
The tempering regimes were chosen with regard to the results of the quenching and tempering study [11]. The study involved a quenching and tempering experiment on all three materials and included all the tempering regimes shown in Table 2. The samples from this earlier study are identified as QT (quenched and tempered) and used as reference for exploring the effects of cold rolling. The highest Cu-related strengthening was found after 60 min tempering at 500 °C. Therefore, the tempering time of 60 minutes was chosen for exploring the temperature dependence of the mechanical properties in an interval from 300 °C to 500 °C. Similarly, the temperature of 400 °C was used for showing the tempering time dependence of mechanical properties. In quenched samples [11], Cu-related strengthening increased with the duration of tempering at this temperature. Hence, the effects of cold rolling were expected to be manifested clearly.
Specimens for mechanical testing were cut in the rolling direction. The thickness of the QT samples was 3.1 mm, whereas the QRT samples were 1.6 mm thick, and the width of the samples was 8 mm. Yield stress (YS), ultimate tensile strength (UTS), uniform elongation (Ag), total plastic elongation (A5), and reduction of area (Z) were measured. The tensile tests were performed according to the EN ISO 6892-1 standard [17] using a Zwick Z250 testing machine with a 250 kN capacity (ZwickRoell GmbH & Co. KG, Ulm, Germany). Three specimens were tested for each material condition.
Metallographic sections were prepared in the longitudinal (rolling) direction. The sections were mechanically ground with sandpaper and polished by diamond suspensions (3 µm and 1 µm grain size) and colloidal silica with a grain size of 0.05 µm. The microstructure was revealed by etching with Nital (3 wt.% solution of nitric acid in methanol).
The microstructure was observed using a scanning electron microscope JEOL IT-500 HR (JEOL, Tokyo, Japan). EBSD (Electron backscatter diffraction) maps were acquired by EDAX Hikari camera (EDAX, Mahwah, NJ, USA). The maps were acquired on unetched sections at 30 kV accelerating voltage. Their size was 43 µm x 33 µm, and the step size was 0.05 µm. Raw data were processed with OIM software (EDAX, Mahwah, NJ, USA). The maps were cleaned by the “grain dilation” procedure with a grain tolerance angle and minimum grain size of 5 points. All points with a confidence index of less than 0.05 were excluded from the EBSD maps shown in the paper. Grains were determined by using a minimum misorientation of 1° and a minimum average confidence index of 0.05. Grains that touched the border of the map were excluded from the statistics.
TEM observation of thin foils was performed in the microscope JEOL JEM-2200 FS (JEOL, Tokyo, Japan) in HR-STEM mode at an accelerating voltage of 200 kV. The crystallographic parameters of the precipitates were determined by means of fast Fourier transform (FFT) and inverse fast Fourier transform (IFFT) of HR-STEM images. Thin foils were prepared by mechanical grinding of the samples to a thickness of 100 µm and by the punching of 3 mm discs. The discs were fine-ground on a Gatan Disc Grinder (Gatan, Inc., Warrendale, PA, USA) to a final thickness of 60 µm on 2000 grit paper. The final step was twin jet electropolishing in Fishione Twin Jet Electropolisher M220 (E.A. Fischione Instruments, Inc., Export, PA, USA) in a 5% solution of perchloric acid in methanol. The applied voltage was 25 V and the temperature was −50 °C.

3. Results

The complete results of the tensile tests are given in Appendix A. Strengthening was manifested as a change in the YS value. Therefore, only the YS value is reported in the body of the paper for clarity and conciseness.
The QT and QRT samples exhibited a clear difference in the relationship between the YS and the tempering temperature (Figure 1). The QT samples showed a slight increase in YS after tempering at 300 °C, but lower YS values at higher tempering temperatures. The QRT samples showed a monotonous decrease of YS with an increasing tempering temperature. This decrease seems to have different kinetics from that in the QT samples (Figure 2). The YS dropped by approx. 400 MPa after 15 min of tempering at 400 °C. At longer times, there was a slight decrease. The QT samples did not exhibit any drop in YS due to tempering.
Figure 3 shows the stress–strain curves for specimens tempered for 60 min at different temperatures. Higher tempering temperatures were coupled with a decrease in YS but not with an increase of plasticity in most cases. Only the highest tempering temperature led to an appreciable increase in ductility.
The strain hardening ability of the material was gradually reduced with increasing tempering temperatures for the QT samples. A sharp yield point was only observed after tempering at 500 °C.
The QRT samples exhibited a lack of strain hardening in the tensile test. Their UTS was almost identical with their YS and uniform plastic deformation was negligible.
The microstructure of the QT samples consisted of martensite tempered to various degrees. Figure 4 illustrates the difference between a QT and a QRT sample for one particular tempering regime. Both contain martensite crystals and cementite particles. Martensite crystals are visibly deformed in the QRT material. Cementite precipitation occurred both on martensite crystal boundaries and in the crystal’s interior. Detailed SE (secondary electrons) micrographs are shown in Figure 5. The size and morphology of cementite particles did not appear to be significantly affected by the Cu alloying (which was up to 1.5%) or by martensite rolling. There are visible fine bright particles in the matrix of 1Cu and 1.5Cu materials (Figure 5c–f). This is an indication of the presence of Cu precipitates within the matrix.
Figure 6 is a TEM image of a thin foil from the QT 500 °C/60 min sample. Several cementite particles can be seen in the micrograph. The ferrite matrix contains many precipitates with sizes from 10 to 20 nm. Figure 7 shows one of the precipitates in detail. In fact, there are probably two precipitate particles, overlapping or even directly connected, with sizes of roughly 20 nm. Their structure was identified as fcc Cu.

4. Discussion

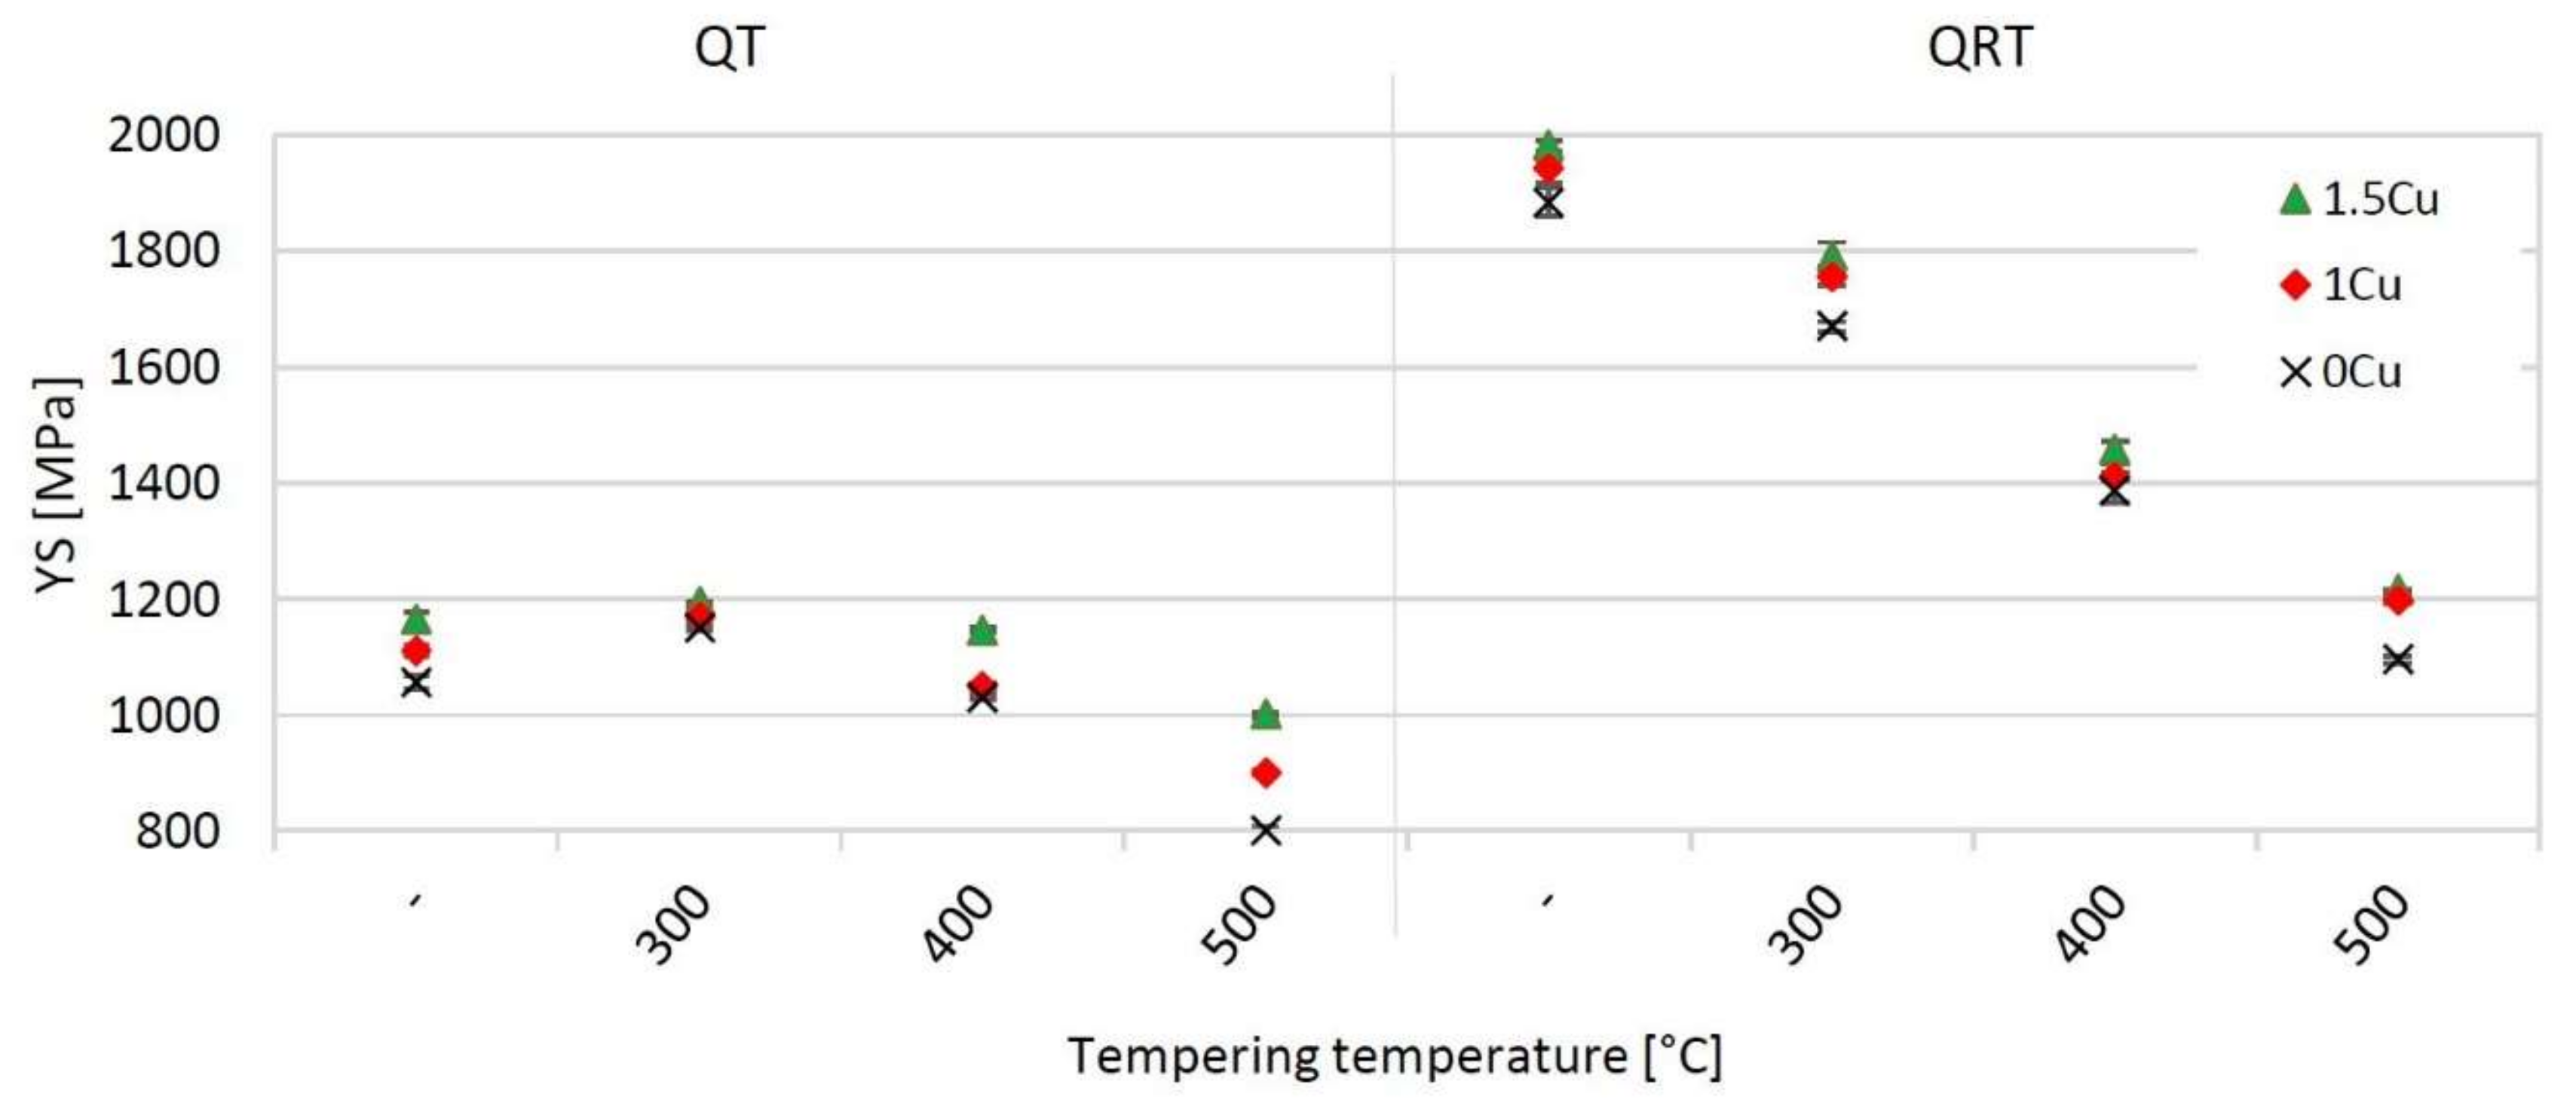
4.1. QT Samples–Yield Stress

The QT materials exhibited significant strain hardening in the as-quenched condition. Plastic yielding was not a distinctive feature here. The s-s curves moved away from the linear elastic behavior gradually (Figure 3). This indicates the presence of free dislocations that can pass through martensite crystals when sufficient external stress is applied. As the dislocations travelled through fresh martensite, they eventually became pinned on the existing dislocation structure within martensite. It was necessary to increase the stress to keep the dislocations moving. Low-temperature tempering or tempering at 400 °C for 15 min did not cause the YS to decrease. However, the 0Cu material exhibited a rise in YS. The s-s curve diverged much more sharply from the linear elastic trend when compared to the as-quenched state. This behavior indicates that the dislocations were pinned either by Cottrell atmospheres or by carbide precipitates forming in low-tempered martensite. They moved more rapidly upon release from the pinning locations, which caused sharper yield points on the s-s curve. The YS of all three tested materials was also the closest to the UTS after low-tempering regimes (300 °C in Figure 8 and 15 min in Figure 9 for the QT samples).
Higher tempering temperatures caused more appreciable plastic yielding on the s-s curve and a decrease in load (Figure 1). Tempering at 500 °C resulted in a distinct yield point followed by the typical plateau. This behavior is typical of materials with pinned dislocations and a crystalline structure, where dislocations can easily move when released. This is in agreement with the microstructure of martensite crystals with the carbide particles at their boundaries, and within them (Figure 4a). Higher tempering temperatures also led to a greater influence of the Cu level on the YS (Figure 8). This can be explained by the presence of Cu precipitates within the martensite crystals, contributing to YS by precipitation strengthening (Figure 6 and Figure 7). The Cu content influenced the amount of strengthening and also its kinetics. Cu of 1% only strengthened the material noticeably after 60 min of tempering at 400 °C (Figure 9). The 1.5Cu material exhibited a linear dependence of ΔYS on tempering time.

4.2. QRT Samples—Yield Stress

The rolling step changed the behavior of all three experimental materials. The YS increased by 800 MPa due to rolling to 50% thickness. The A5 values were reduced to roughly one half of the level in the corresponding QT samples (Figure 3, Table A1 and Table A2 in Appendix A). This behavior can be explained in terms of the well-known strength–ductility trade-off.
There was a striking difference between the QT and QRT s-s curves. The QRT materials lacked the strain hardening stage in all cases. The absence of strain hardening can be explained as the lack of ability to increase resistance to dislocation movement through the crystal. If the resistance increased locally, another region of the sample would have to be plastically deformed. This mechanism would then prevent the localization of plastic deformation and delay the necking and fracture.
The quenched and rolled samples were expected to develop a maximum density of lattice defects (dislocations and vacancies). Plastic deformation increased dislocation density. There was almost no capacity for its further increase. Reductions by more than 50% caused sheet cracking during cold rolling. Once plastic deformation (i.e., dislocation movement) occurred, it continued locally without strengthening and concentrated in the weakest area of a tensile specimen. Therefore, quenched and rolled samples exhibited almost no strain hardening.
Tempering for 15 min at 400 °C caused a 400 MPa drop in YS (Figure 2). The cause of this drop can be deduced from the comparison with corresponding QT samples, in which YS did not change significantly during this tempering regime. The QT and QRT samples had different lattice defect densities before tempering. Tempering seemingly caused a much greater reduction in the density of the lattice defects in the QRT samples. However, the capacity for strain hardening was not recovered. Plastic deformation of QRT samples did not lead to higher resistance to dislocation movement once the dislocation started to move massively at the YS. A higher tempering temperature led to nothing more than “levelling” of the post-YS part of the s-s curve (Figure 3).
Cu did not cause as significant strengthening as in the case of the QT samples. Maximal ΔYS levels were approximately one half of those for the QT state. The Cu-induced strengthening was also less dependent on the Cu content (Figure 8 and Figure 9). There was no trend in Cu-induced strengthening, as opposed to the QT samples. The QT samples exhibited the expected behavior, where ΔYS rises with increasing tempering temperature and time. This is typical of precipitation strengthening, as the number and size of the precipitates increase, creating more obstacles for dislocation movement. It was documented for Cu precipitation in several studies [7,8,9].
ΔYS was roughly the same in the quenched-rolled state and the maximal degree of tempering. Precipitation is expected to progress with time and temperature. Cu precipitation must be accompanied by another strengthening mechanism with a comparable strengthening effect taking place after low-tempering regimes.

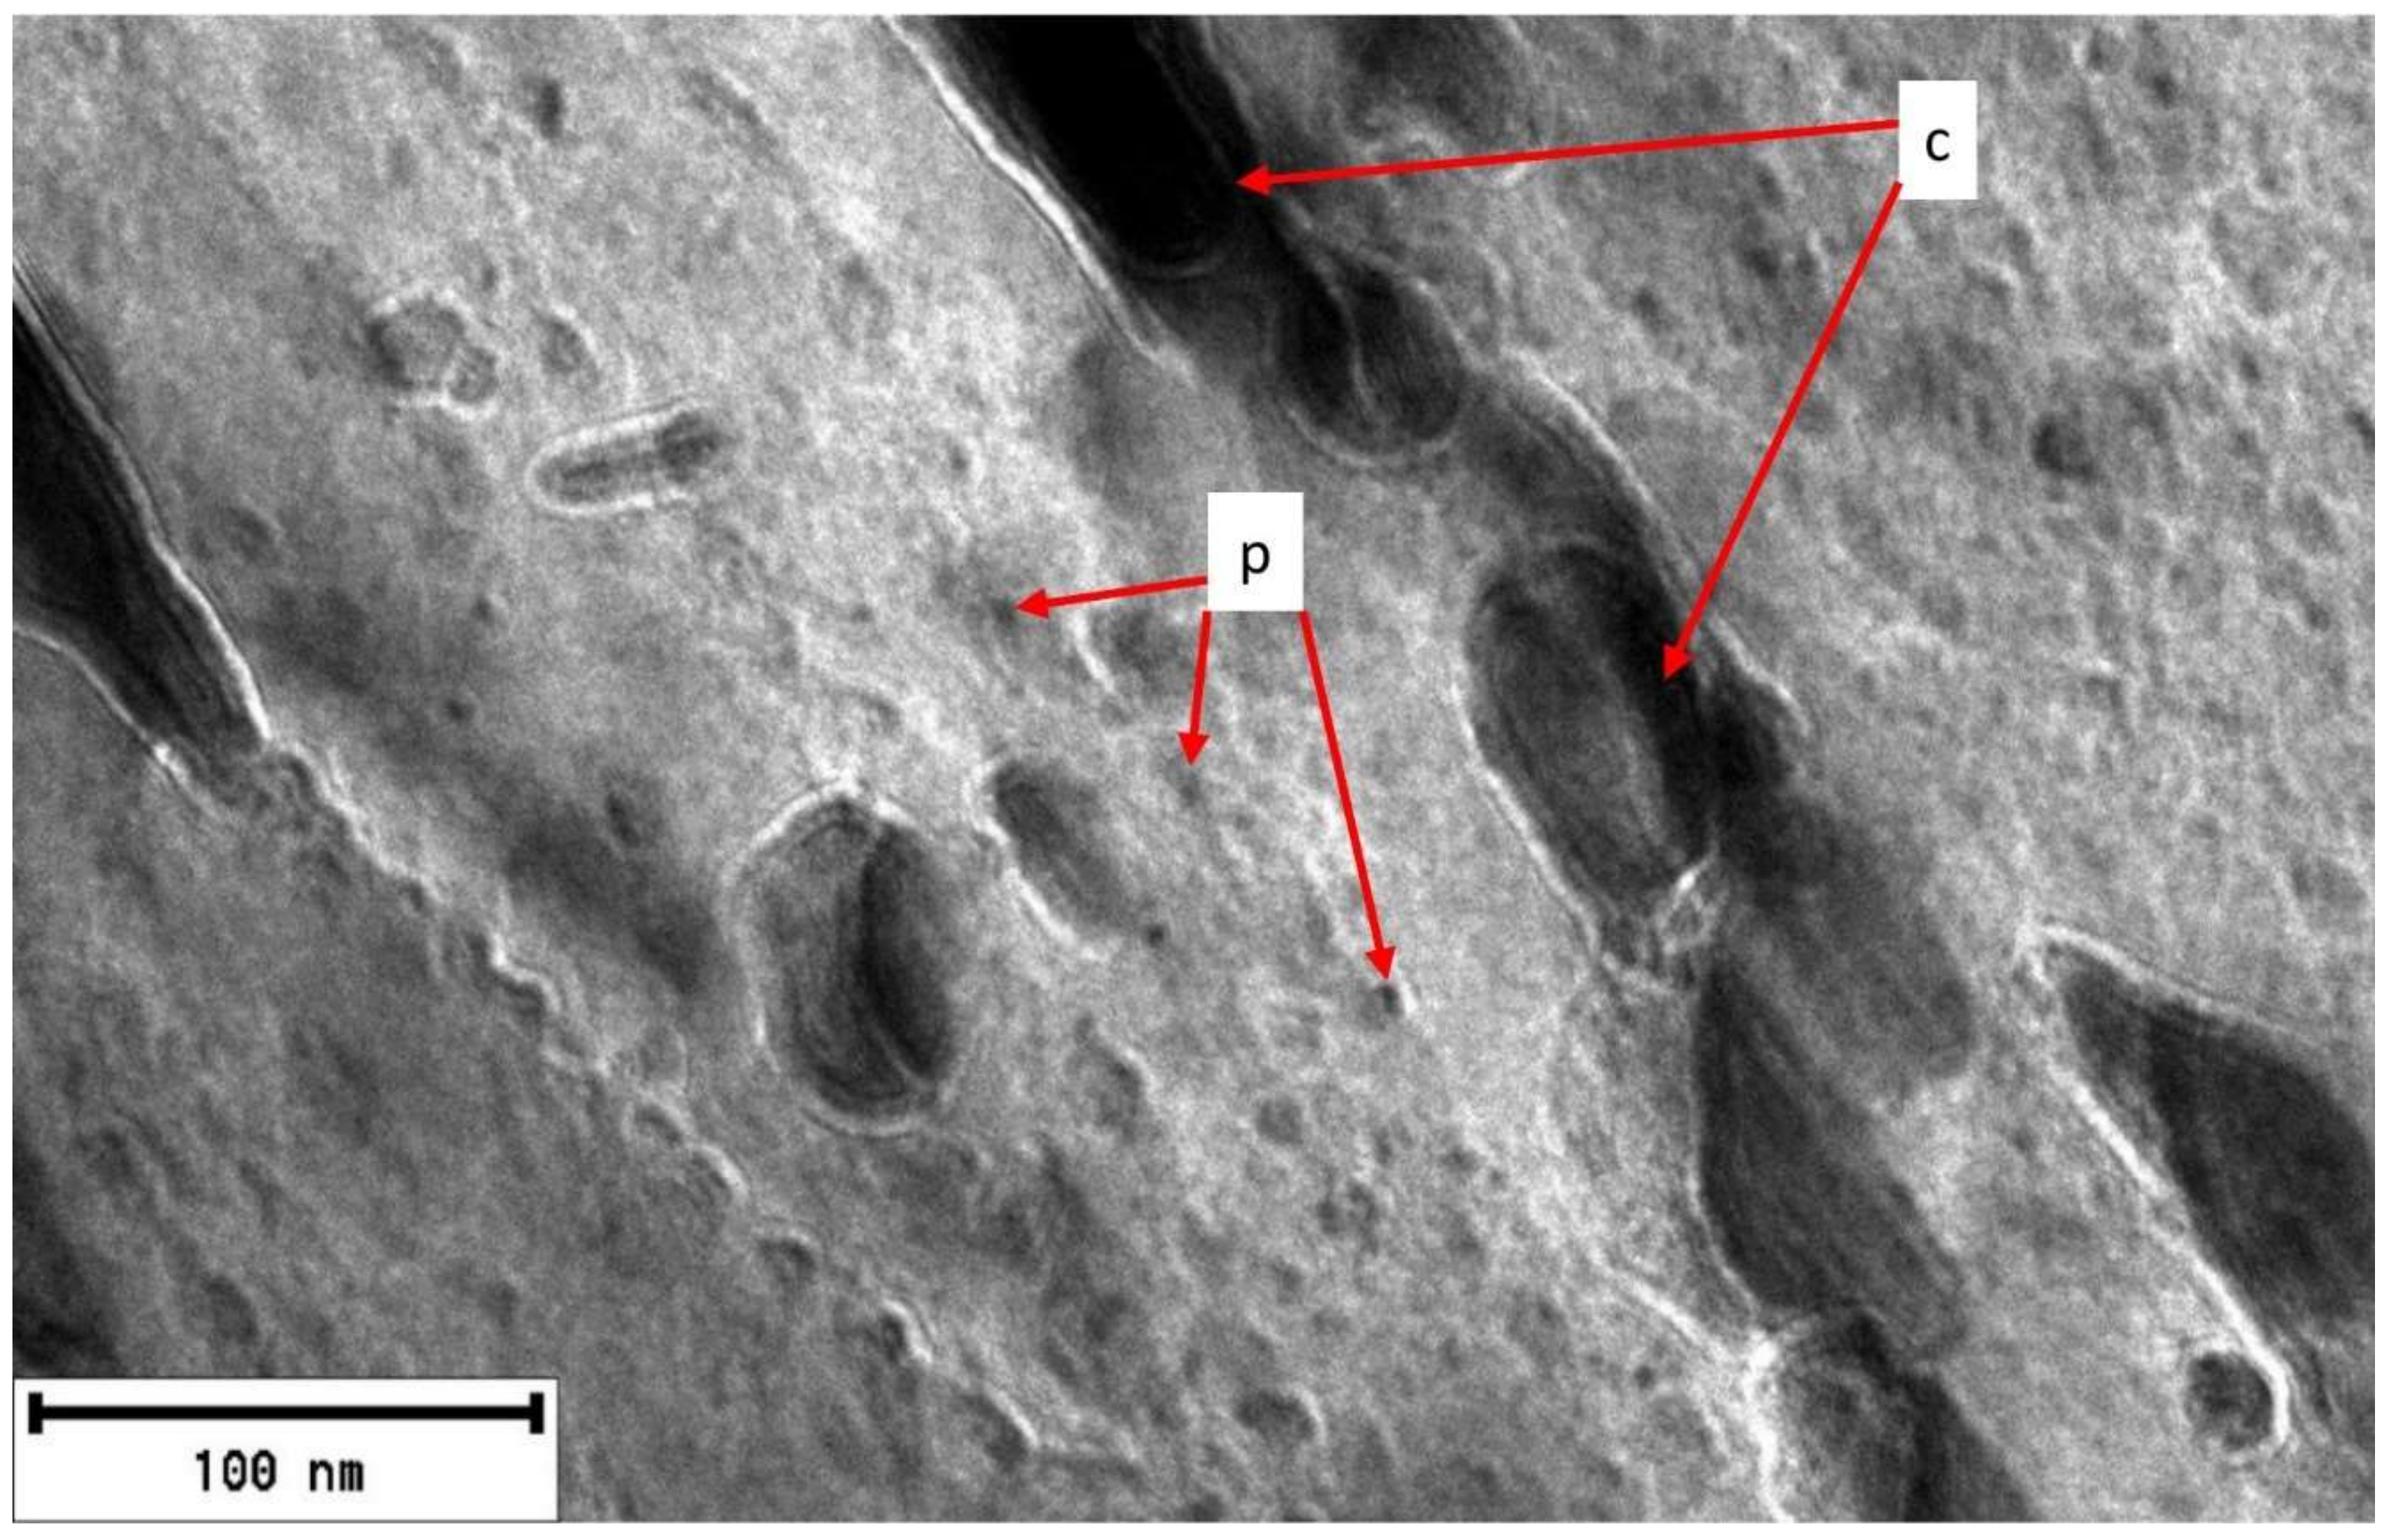
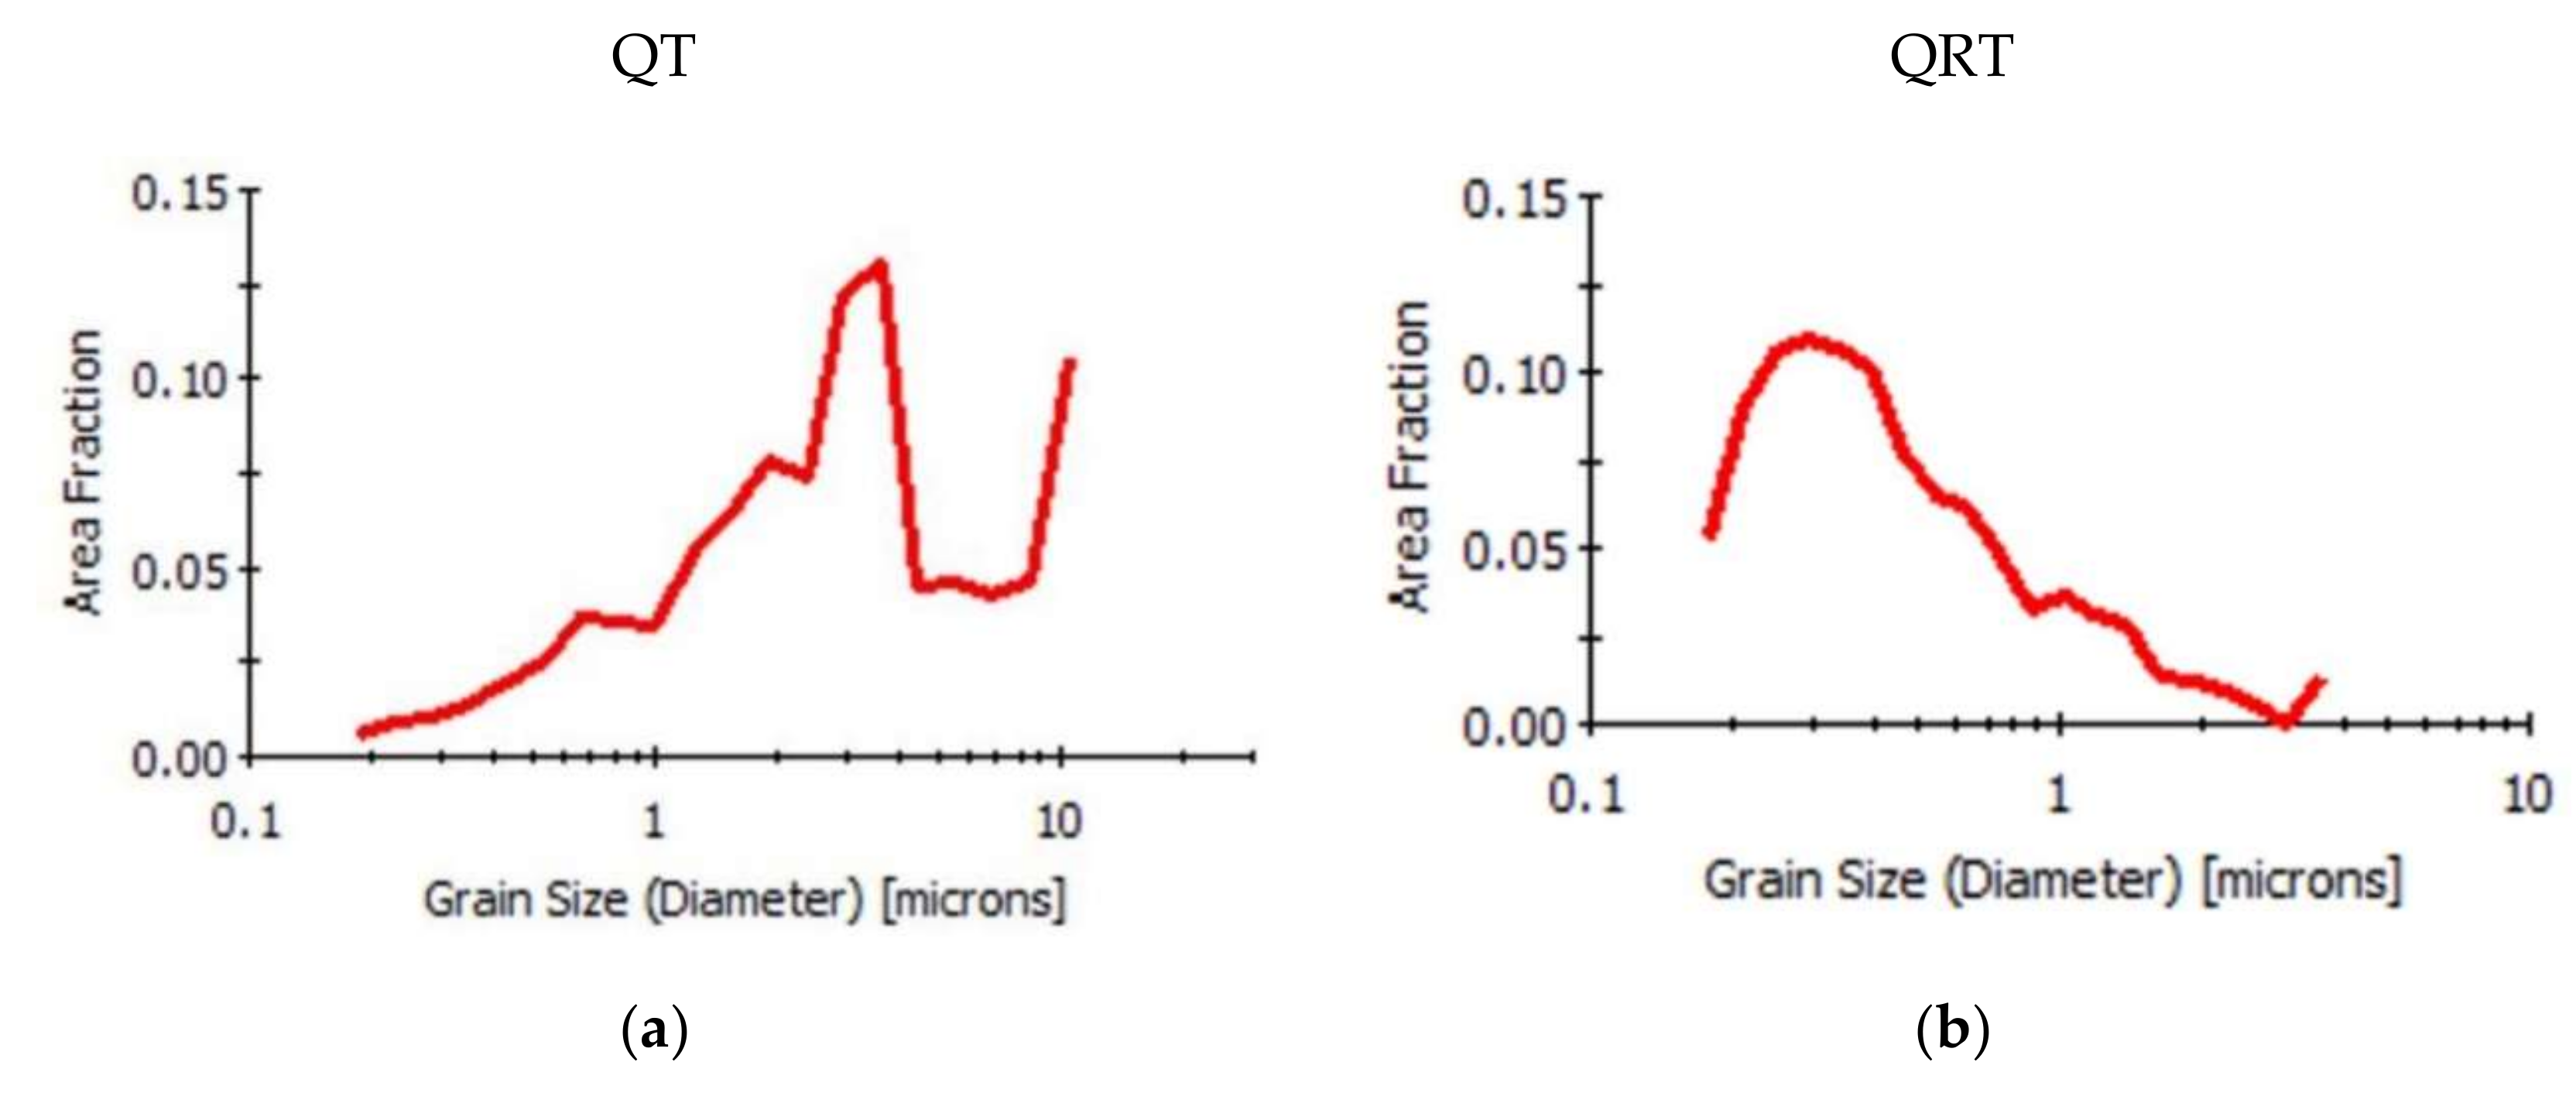
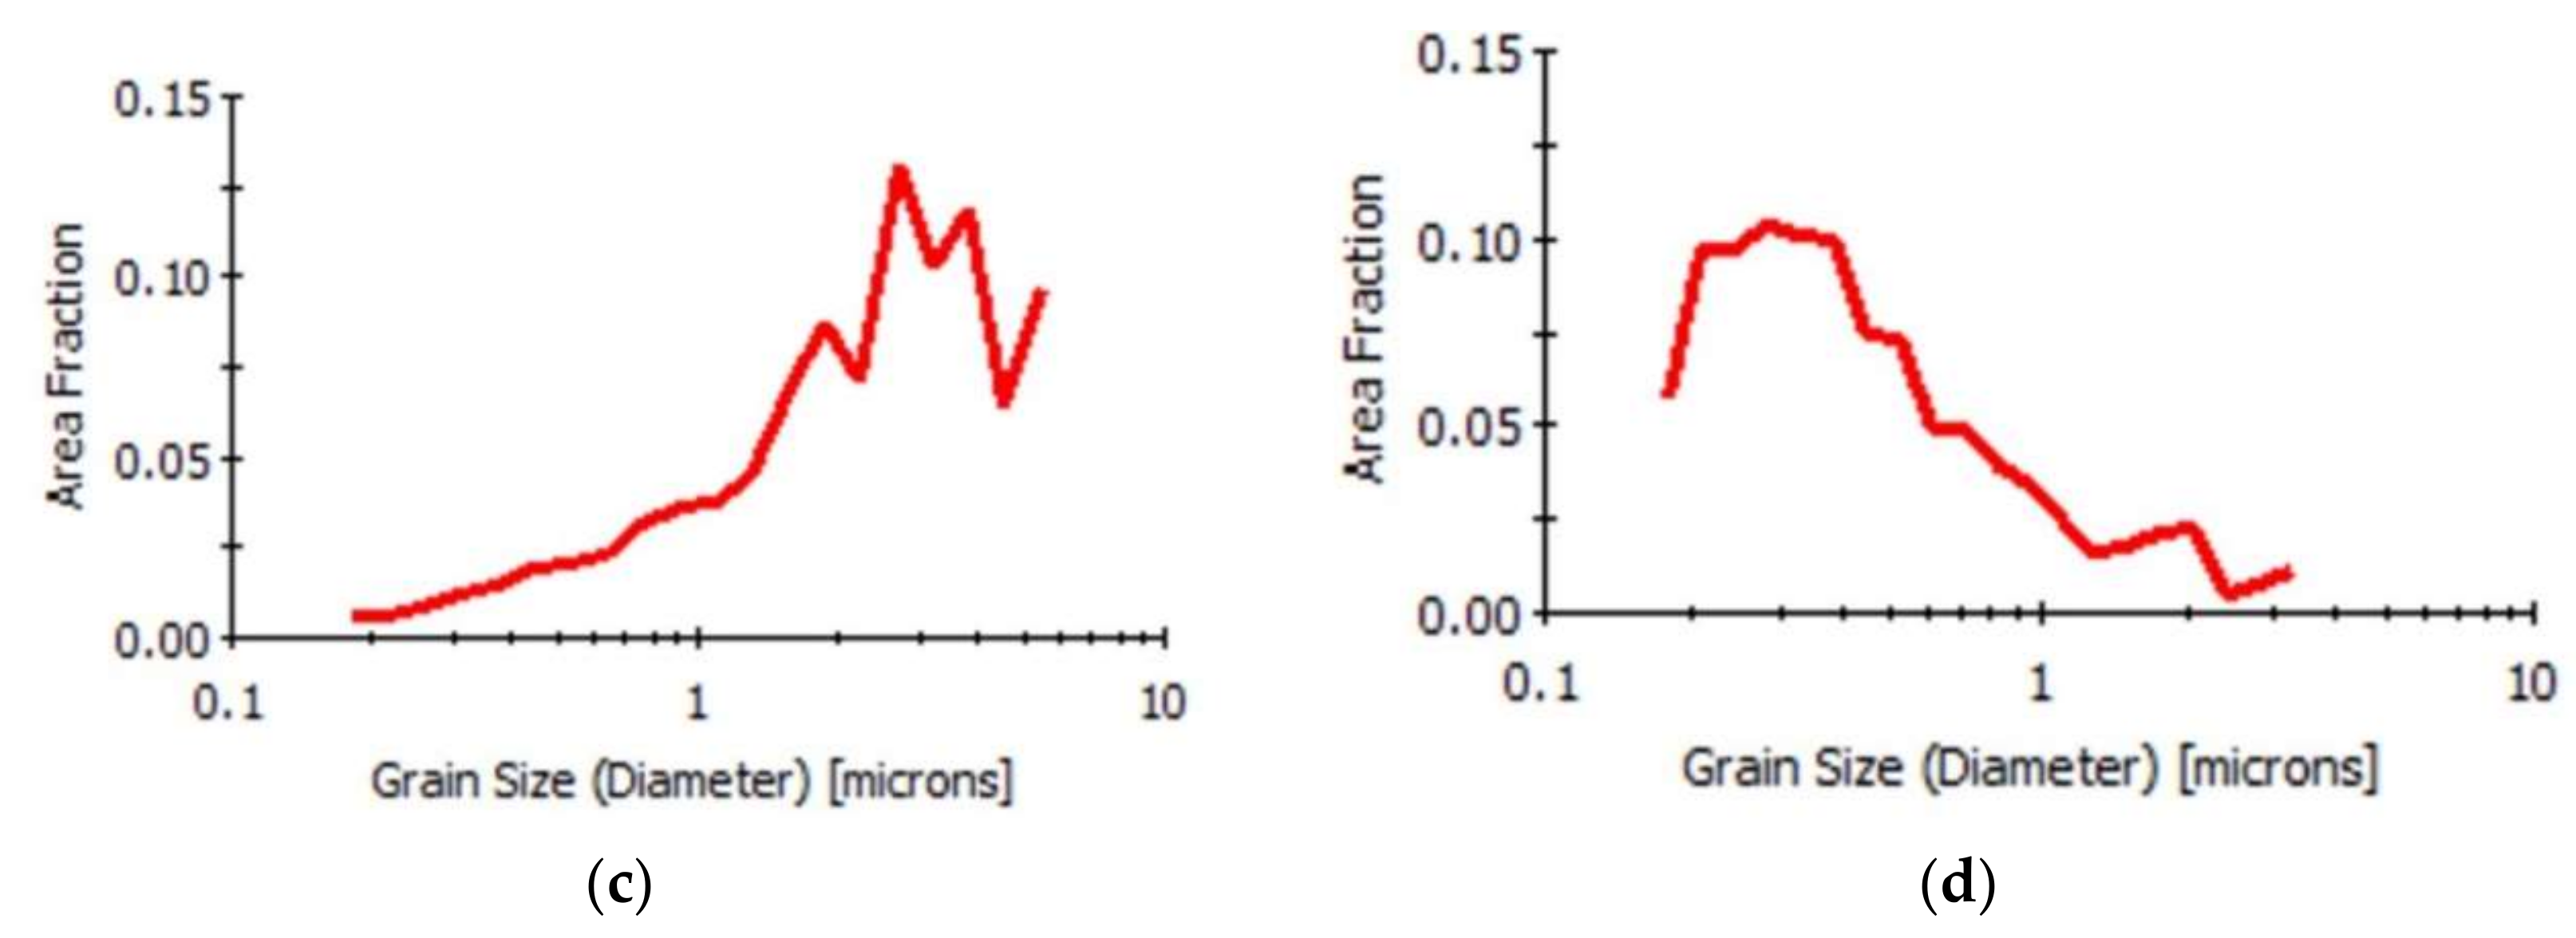
4.3. Subgrain Structure

EBSD maps revealed the differences in the microstructures of the QT and QRT samples. The inverse pole figure (IPF) maps of tempered martensite are shown in Figure 10. There is visible elongation of the grain structure in the rolling direction. Kernell average misorientation (KAM) maps reveal the impact of plastic deformation on the structure (Figure 11). There are visible boundaries between martensite crystals in the QT samples and several large crystals of several µm with low misorientation in their interior. The QRT samples exhibited a structure with large and homogeneous lattice deformation. There is a dense substructure in the martensite crystals with the same initial size as in the QT samples.
A grain was defined for the purpose of the analysis as a crystal with boundaries misoriented by at least 1° from its neighbors. This low-angle boundary setting effectively provides an analysis of sub-grain size. Figure 12 shows sub-grain size histograms for 500 °C/60 min tempered samples.
The difference between the YS of the QT and QRT 500 °C/60 min samples can be explained by their different grain sizes if we consider the sub-grain boundary as an obstacle to the dislocation movement. The QRT samples can then be considered as an ultra-fine sub-grained material [18]. Lack of strain hardening is typical of ultra-fine structures. The size of the sub-grain is too small to support intensive dislocation interlocking and pile up, which would normally increase the dislocation density. A study [19] shows that strain hardening is effectively prevented in structures with a grain size of 200–300 nm. This is the case of the QRT samples (Figure 12). Particles within the grain act as obstacles to dislocation movement and can help trap the dislocations within the grains. Cementite and Cu particles are present in the experimental samples. Fine grains in the QRT structures are too small to contain the cementite particles. They precipitated mainly at grain and sub-grain boundaries (Figure 4, Figure 5 and Figure 6). The density of cementite particles is not sufficient to populate 200–300 nm sub-grains. Cu particles were observed within the grains. However, their presence did not lead to more significant strain hardening in either the QT or QRT samples.
The QRT samples showed significant Cu-related strengthening even after low-tempering regimes (Figure 8 and Figure 9), such as 300 °C/60 min or 400 °C/15 min. The strengthening was much higher than in the corresponding QT samples. A study [20] was published dealing with Cu atom clustering around dislocations. This phenomenon could be the reason for the low-tempering Cu-related strengthening of the QRT samples. The QT samples contained only those dislocations which had formed during martensitic transformation. Until the moment of a tensile test, their only movement could involve polygonization or annihilation during tempering. No external stress was applied to the QT samples during processing: hence, there was no reason to expect dislocations to form upon tempering. This means that the existing dislocations only had to move once, and for a maximum distance equal to the grain size.
Dislocations in the QRT samples formed due to cold rolling and had to move to enable plastic deformation after quenching. This movement through the crystals could promote the Cu clustering in the ferrite lattice. High concentration of lattice defects could also promote Cu diffusion and the formation of clusters. This is a speculative assumption that would probably require an APT (atom probe tomography) analysis to prove, as high dislocation density in a low-tempered state effectively obscures fine structural features in the TEM.
Cold rolling significantly affected the kinetics and magnitude of Cu-related strengthening. This is in contrast with a study [21] that reports independence of dislocation and precipitation strengthening. The precipitation annealing [21] was performed at 500 °C for five hours—longer than in the present experiment. This may be the reason for the different results; however, this discrepancy is a motivation for a detailed structural investigation of the QRT samples.

5. Conclusions

Copper precipitation was induced in low-carbon steel by martensite tempering. Precipitation strengthening was compared in martensite and cold-rolled martensite. There was a significant difference between martensite and cold-rolled martensite concerning their precipitation strengthening behavior.
Non-rolled martensite exhibited a predictable behavior: the precipitation strengthening intensified at higher tempering temperatures and with longer tempering times. A 200 MPa increase in YS was observed after 60 min tempering at 500 °C, caused by 1.5% Cu addition.
Cold-rolled martensite exhibited lower maximum strengthening (120 MPa after 60 min/500 °C tempering) in the material with an addition of 1.5% Cu. The strengthening did not exhibit dependence on tempering time or temperature.
The presence of Cu-related strengthening after low-tempering opens new possibilities for Cu utilization in alloying. It is not necessary to rely on precipitation at temperatures of 400–500 °C, where most low-alloyed steels lose their strength significantly. Cu can be effectively used as a strengthening element by combining martensite deformation and low tempering.

Author Contributions

J.D. (Jaromir Dlouhy) and P.P. designed the experiment; J.D. (Jaromir Dlouhy) analyzed the microstructures; J. Dl. and J.D. (Jan Dzugan) analysed tensile test data; J.D. (Jaromir Dlouhy) wrote the paper. All authors have read and agreed to the published version of the manuscript.

Funding

This research was funded by Czech Science Foundation, grant number 17-19002S “Synergy of precipitation, deformation and transformation hardening in steels with higher copper content” and by ERDF Research of advanced steels with unique properties, No. CZ02.1.01/0.0/0.0/16_019/0000836.

Conflicts of Interest

The authors declare no conflict of interest.

Appendix A

Table A1. Tensile test results for the tempering at 400 °C. Values of QT samples were taken from [11].
RegimeMaterialTempering Time [min]YS
[MPa]
UTS
[MPa]
Ag
[%]
A5
[%]
Z
[%]
QT0Cu01057±111447±113.6±0.113.9±0.243.7±0.1
QT0Cu151062±41101±22.6±0.312.6±0.256.2±0.8
QT0Cu301030±21051±61.6±0.711.9±1.056.3±1.2
QT0Cu60982±121010±192.8±0.612.0±0.157.0±2.7
QT0Cu1201100±21156±82.2±0.511.1±2.052.2±2.3
QT1Cu01105±31495±113.1±0.311.2±0.546.8±1.0
QT1Cu151097±11137±72.6±0.310.2±0.754.3±1.8
QT1Cu301071±81091±12.1±0.610.4±0.855.4±1.8
QT1Cu601043±31059±112.2±0.911.4±0.451.5±1.1
QT1Cu1201038±51050±62.5±0.112.6±0.351.5±1.7
QT1.5Cu01166±41520±51.9±0.212.9±1.548.6±0.8
QT1.5Cu151156±71203±53.1±0.111.2±0.854.6±0.0
QT1.5Cu301153±21183±13.4±0.112.0±0.751.4±0.5
QT1.5Cu601147±31157±21.7±0.111.7±0.654.2±0.4
QT1.5Cu1201128±21142±33.9±0.615.4±0.751.5±1.0
QRT0Cu01884±251911±240.4±0.14.5±1.029.8±14.9
QRT0Cu151411±251419±220.3±0.14.5±0.418.9±8.7
QRT0Cu301393±121402±110.3±0.14.8±1.216.9±8.1
QRT0Cu601388±231396±260.3±0.13.8±0.59.0±0.8
QRT0Cu1201328±121334±120.4±0.16.4±0.516.0±9.5
QRT1Cu01943±271976±220.4±0.14.4±0.730.1±4.0
QRT1Cu151451±391456±360.4±0.16.4±1.012.2±9.0
QRT1Cu301456±291458±250.3±0.16.1±0.724.1±4.2
QRT1Cu601410±71412±110.3±0.15.1±0.417.3±3.8
QRT1Cu1201376±231380±220.3±0.16.6±0.513.2±1.7
QRT1.5Cu01983±72006±100.4±0.14.3±0.422.8±3.7
QRT1.5Cu151496±191500±180.3±0.15.6±0.215.4±0.7
QRT1.5Cu301505±51506±50.3±0.14.8±0.112.0±0.9
QRT1.5Cu601459±141462±140.3±0.14.7±0.916.3±2.9
QRT1.5Cu1201413±71415±70.2±0.16.0±0.48.8±4.2
Table A2. Tensile test results for 60 min tempering at different temperatures. Values of QT samples were taken from [11].
RegimeMaterialTempering Temperature [°C]YS
[MPa]
UTS
[MPa]
Ag
[%]
A5
[%]
Z
[%]
QT0Cu-1057±111447±113.6±0.113.9±0.243.7±0.1
QT0Cu3001151±41252±32.5±0.112.6±0.254.7±1.8
QT0Cu4001030±21051±61.6±0.711.9±1.056.3±1.2
QT0Cu500802±7832±34.1±0.216.7±0.261.1±0.8
QT1Cu-1110±91495±113.1±0.411.2±0.946.8±2.3
QT1Cu3001170±91284±112.7±0.210.5±1.051.2±1.2
QT1Cu4001049±81059±112.2±0.611.4±0.851.5±1.8
QT1Cu500901±4937±37.1±0.916.8±0.756.4±1.5
QT1.5Cu-1166±121520±141.9±0.112.9±0.648.6±1.5
QT1.5Cu3001196±91292±71.5±0.112.0±0.652.4±3.2
QT1.5Cu4001147±31157±21.7±0.111.7±0.654.2±0.4
QT1.5Cu5001003±41024±25.7±0.116.7±0.454.1±0.5
QRT0Cu-1884±251911±240.4±0.14.5±1.029.8±14.9
QRT0Cu3001670±91671±80.2±0.16.0±0.812.6±7.0
QRT0Cu4001388±231396±260.3±0.13.8±0.59.0±0.8
QRT0Cu5001095±71101±40.2±0.17.8±1.020.0±6.1
QRT1Cu-1943±271976±220.4±0.14.4±0.730.1±4.0
QRT1Cu3001757±151761±150.2±0.15.0±0.98.7±1.4
QRT1Cu4001410±71412±110.3±0.15.1±0.417.3±3.8
QRT1Cu5001197±41201±50.2±0.18.6±1.121.2±2.7
QRT1.5Cu-1983±72006±100.4±0.14.3±0.422.8±3.7
QRT1.5Cu3001792±231796±250.1±0.14.1±0.310.4±3.4
QRT1.5Cu4001459±141462±140.3±0.14.7±0.916.3±2.9
QRT1.5Cu5001216±11221±30.1±0.18.8±1.024.0±6.2

References

  1. Isheim, D.; Kolli, R.P.; Morris, E.F.; Seidman, D.N. An atom-probe tomographic study of the temporal evolution of the nanostructure of Fe–Cu based high-strength low-carbon steels. Scr. Mater. 2006, 55, 35–40. [Google Scholar] [CrossRef]
  2. Takaki, S.; Fujioka, M.; Aihara, S.; Nagataki, Y.; Yamashita, T.; Sano, N.; Adachi, Y.; Nomura, M.; Yaguchi, H. Effect of Copper on Tensile Properties and Grain-Refinement of Steel and its Relation to Precipitation Behavior. Mater. Trans. 2004, 45, 2239–2294. [Google Scholar] [CrossRef] [Green Version]
  3. Ghosh, S.K.; Haldar, A.; Chattopadhyay, P.P. Effect of ageing on the mechanical properties of directly quenched copper bearing microalloyed steels. Mater. Chem. Phys. 2010, 119, 436–441. [Google Scholar] [CrossRef]
  4. Rana, R.; Bleck, W.; Singh, S.B.; Mohanty, O.N. Development of high strength interstitial free steel by copper precipitation hardening. Mater. Lett. 2007, 61, 2919–2922. [Google Scholar] [CrossRef]
  5. Von Goldbeck, O.K. Iron—Copper Fe—Cu. In IRON—Binary Phase Diagrams; Springer: Berlin, Germany, 1982. [Google Scholar] [CrossRef]
  6. Sun, M.; Zhang, W.; Liu, Z.; Wang, G. Direct observations on the crystal structure evolution of nano Cu-precipitates in an extremely low carbon steel. Mater. Lett. 2017, 187, 49–52. [Google Scholar] [CrossRef]
  7. Hu, L.; Zhao, S.J.; Liu, Q. The effect of size of Cu precipitation on the mechanical properties of microalloyed steel. Mater. Sci. Eng. A 2012, 556, 140–146. [Google Scholar] [CrossRef]
  8. Holzer, I.; Kozeschnik, E. Computer simulation of the yield strength evolution in Cu-precipitation strengthened ferritic steel. Mater. Sci. Eng. A 2010, 527, 546–3551. [Google Scholar] [CrossRef]
  9. Takahashi, J.; Kawakami, K.; Kobayashi, Y. Consideration of particle-strengthening mechanism of copper-precipitation-strengthened steels by atom probe tomography analysis. Mater. Sci. Eng. A 2012, 535, 144–152. [Google Scholar] [CrossRef]
  10. Guo, H.; Cheng, J.; Yang, S.; He, X. Influence of combined Cu and Nb addition on the quenched microstructure and precipitation during tempering in ultra-low carbon steels. J. Alloys Compd. 2013, 557, S619–S625. [Google Scholar] [CrossRef]
  11. Dlouhy, J.; Podany, P.; Dzugan, J. Strengthening from Cu Addition in 0.2C-(1–2)Mn Steels during Tempering. Materials 2019, 12, 247. [Google Scholar] [CrossRef] [PubMed] [Green Version]
  12. Ghosh, S.K.; Bhowmik, N.; Haldar, A.; Chattopadhyay, P.P. Effects of Cu addition on the synergistic effects of Ti–B in thermomechanically processed low carbon steels. Mater. Sci. Eng. A 2010, 527, 1082–1088. [Google Scholar] [CrossRef]
  13. Kapoor, M.; Isheim, D.; Ghosh, G.; Vaynman, S.; Fine, M.E.; Chung, Y.W. Aging characteristics and mechanical properties of 1600 MPa body-centered cubic Cu and B2-NiAl precipitation-strengthened ferritic steel. Acta Mater. 2014, 73, 56–74. [Google Scholar] [CrossRef]
  14. Podany, P.; Martinek, P. Thermomechanical processing of micro-alloyed steel. Mater. Tehnol. 2014, 48, 855–859. [Google Scholar]
  15. Podany, P.; Martinek, P.; Balcar, M. Mechanical properties of steel with various microalloying addition after particular thermomechanical processing. In Proceedings of the METAL 2011—20th International Conference on Metallurgy and Materials, Brno, Czech Republic, 18–20 May 2011; pp. 646–649. [Google Scholar]
  16. Ghosh, S.K.; Haldar, A.; Chattopadhyay, P.P. On the Cu precipitation behavior in thermomechanically processed low carbon microalloyed steels. Mater. Sci. Eng. A 2009, 519, 88–93. [Google Scholar] [CrossRef]
  17. International Standard EN ISO 6892-1. Metallic Materials—Tensile Testing—Part1: Method of Test at Room Temperature; International Organization for Standardization: Geneva, Switzerland, 2016. [Google Scholar]
  18. Lefebvre, S.; Devincre, B.; Hoc, T. Yield stress strengthening in ultrafine-grained metals: A two-dimensional simulation of dislocation dynamics. J. Mech. Phys. Solids 2007, 55, 788–802. [Google Scholar] [CrossRef]
  19. Wang, Y.M.; Ma, E. Strain hardening, strain rate sensitivity, and ductility of nanostructured metals. Mater. Sci. Eng. A 2004, 375, 46–52. [Google Scholar] [CrossRef]
  20. Pascuet, M.I.; Monnet, G.; Bonny, G.; Martinez, E.; Lim, J.J.H.; Burke, M.G.; Malerba, L. Solute precipitation on a screw dislocation and its effects on dislocation mobility in bcc Fe. J. Nucl. Mater. 2019, 519, 265–273. [Google Scholar] [CrossRef]
  21. Xu, S.S.; Zhao, Y.; Tong, X.; Guo, H.; Chen, L.; Sun, L.W.; Sun, G.A. Independence of work hardening and precipitation strengthening in ananocluster strengthened steel. J. Alloys Compd. 2017, 712, 573–578. [Google Scholar] [CrossRef] [Green Version]
Figure 1. Yield stress (YS) of samples without tempering and after tempering at different temperatures for 60 min.
Metals 10 00282 g001
Figure 2. Yield stress after different times of tempering at 400 °C for 0, 15, 30, 60, and 120 min.
Metals 10 00282 g002
Figure 3. Engineering stress–strain diagrams of samples of 0Cu, 1Cu, and 1.5Cu materials: (a) quenched and tempered samples (60 min); (b) quenched, rolled, and tempered samples (60 min).
Metals 10 00282 g003
Figure 4. Microstructures of the material 0Cu tempered for 60 min at 500 °C: (a) quenched and tempered (QT); (b) quenched, rolled, and tempered (QRT) (the rolling direction is horizontal in the image).
Metals 10 00282 g004
Figure 5. Microstructures of the samples after tempering at 500 °C for 1 h: (a) 0Cu QT; (b) 0Cu QRT; (c) 1Cu QT; (d) 1Cu QRT; (e) 1Cu QT; (f) 1Cu QRT.
Metals 10 00282 g005
Figure 6. TEM bright field image of the sample 1.5Cu QT 500 °C/60 min. There are dark elongated particles of carbides (c) and small round precipitates (p) within the ferrite matrix.
Metals 10 00282 g006
Figure 7. TEM image of a precipitate in the sample 1.5Cu QT 500 °C/60 min. It is probably two coalesced particles or two overlapping ones. Their structure corresponds to fcc Cu.
Metals 10 00282 g007
Figure 8. Difference ΔYS between the YS of Cu-alloyed materials and 0Cu samples tempered for 60 min. YS of 0Cu samples is the zero-line.
Metals 10 00282 g008
Figure 9. Difference ΔYS between YS of Cu-alloyed materials and 0Cu samples tempered at 400 °C. YS of 0Cu samples is the zero-line.
Metals 10 00282 g009
Figure 10. Inverse pole figure (IPF) maps for 0Cu and 1.5Cu materials tempered for 60 min at temperature 500 °C: (a) 0Cu QT; (b) 0Cu QRT; (c) 1.5Cu QT; (d) 1.5Cu QRT. The map step was 0.05 µm. The coloring indicates local lattice orientation (legend in (d)). The rolling direction is oriented vertically for the QRT samples.
Metals 10 00282 g010
Figure 11. Kernell average misorientation (KAM) maps for the 0Cu and 1.5Cu materials tempered for 60 min at temperature 500 °C: (a) 0Cu QT; (b) 0Cu QRT; (c) 1.5Cu QT; (d) 1.5Cu QRT. The map step was 0.05 µm. Each pixel is colored according to its average misorientation with its six neighbors (maps were acquired in a hexagonal pixel pattern). The legend is in (d).
Metals 10 00282 g011
Figure 12. Grain size measured from EBSD maps for grains separated by boundaries with misorientation >1°: (a) 0Cu QT; (b) 0Cu QRT; (c) 1.5Cu QT; (d) 1.5Cu QRT. Map step was 0.05 µm.
Metals 10 00282 g012aMetals 10 00282 g012b
Table 1. Chemical compositions of experimental steels in wt.%.
MaterialCCuMnSiTiBN
0Cu0.220.120.980.070.0220.00140.0056
1Cu0.211.080.980.080.0250.00130.0063
1.5Cu0.211.490.990.100.0220.00130.0054
Table 2. Times and temperatures of tempering. “X” marks regimes of tempering in corresponding fields.
Regime15 min30 min60 min120 min
300 °C X
400 °CXXXX
500 °C X

