Article

Fatigue Examination of HSLA Steel with Yield Strength of 960 MPa and Its Welded Joints under Strain Mode

Faculty of Mechanical Engineering, Military University of Technology, ul. gen. S. Kaliskiego 2, 00-908 Warsaw, Poland
Metals 2020, 10(2), 228; https://doi.org/10.3390/met10020228
Submission received: 30 December 2019 / Revised: 3 February 2020 / Accepted: 4 February 2020 / Published: 7 February 2020
(This article belongs to the Special Issue High-Strength Low-Alloy Steels)

Abstract

:
The full benefits of application the high strength low alloyed steels HSLA can be achieved if the structures will be able to carry the alternate loads and fatigue cracks will not be formed, even in the vicinity of welded joints. For this reason the purpose of this study is to find and to explain the influence of different factors on fatigue crack initiation and the nature of crack propagation in HSLA steel and its welded joints. The S960QL steel and two types of welded joints were subjected to low cycle fatigue (LCF) tests at a strain mode and the received surfaces of fractures were analyzed using SEM microscope. Additionally, the microhardness measurements and the residual stress analyze in a cross-section of the joint were conducted. The maximum hardness was determined on the fusion line and more favorable hardness distribution was in the square joints than in single-V. Compiled maps of residual stresses have shown that the local orientation and values of the principal stress vector near the fusion line can influence negative the fatigue life. Finally, the square joints tested in the low cycle fatigue regime have shown a slightly higher fatigue life in comparison with single-V.

1. Introduction

The main purpose of modern companies is focused on the gaining economic efficiency of the production processes and the costs of the final product maintenance. In order to meet the increasing customer demands the metallurgical industry is still developing modern advanced structural steels with increasingly better performance characteristics. Although the advanced methods for improving the performance of structural materials present exist or are being developed [1,2,3], the reduction of total weight as the main factor affecting the production costs is achieved through the use of steels with a reduced cross-section or smaller thickness, compensated by higher strength. This approach leads to lower production costs and improved operating characteristics, such as capacity, strength or energy efficiency.
One of the most popular steel grades used to fulfill the aforementioned requirements are high performance steels (HPS), which can be divided into high strength low alloyed steels (HSLA) and high strength steels (HSS). These steels are produced in processes of thermo-mechanical processing (TMCP) and liquid-quenching and tempering (Q&T). They have a low content of micro-alloying elements (Ti, V or Al) and carbon resulting in a low carbon equivalent value (CE) and good weldability [4,5]. Moreover, all this makes the structure ultra fine-grained, consisting of martensite and bainite [4,6]. For this reason, HSS steels are widely used in the design solutions for heavily loaded elements and entire structures, in particular those transferring tensile and bending loads, but the grades of S960 steel or above have presently little applicability in construction. They can be found in bridges, pipelines, pressure vessels, platforms or mobile cranes [7,8,9] and S960/S1100 grades were used for example in Swedish military bridge Fast Bridge 48 [10] or the MS-20 scissors type Polish mobile assault bridge [11].
HSS steels have higher yield-to-tensile strength ratios, which reduces their ability to carry loads that cause plastic deformation. The value of this ratio reaches the value of 0.90–0.99 and unintentional, local loads exceeding the yield point, may lead to rapid destruction of the structure [12,13,14,15,16]. Moreover, the martensite/bainite structures increase the sensitivity of the steels to the presence of notches. These properties of HSS steel are characterized by a greater crack propagation rate da/dN during the crack growth stage together with increased resistance to fatigue crack initiation characterized by the higher value of fatigue crack threshold ΔKth [17,18,19]. For this reason it is essential to discover the mechanism of crack initiation in these steels, especially taking under consideration the presence of welded joints. It is commonly known that the presence of welds significantly reduces the carrying capacity under the variable loads, characteristic of engineering structures and significantly deteriorates fatigue life. While this phenomenon is very well recognized in the case of carbon steels, for HSS steels despite some research, i.e., [20,21,22,23,24,25], further deepening of this knowledge is needed.
The perspective of the wide application of HSLA steels in engineering constructions has led to extended research on the welded joints prepared with these grades of steel [26,27,28,29,30]. High-strength low-alloy steels, due to their specific microstructure and alloying design, are sensitive to welding and the full benefit of applications of those steels can only be obtained by suitable welding [28]. Additionally, the most problematic domain in terms of strength/hardness of welded joints is the recrystallized zone, moreover crack initiation is commonly observed at the fusion line at the face side, but in some cases the crack initiation is observed at the root side too [30]. The main aim of the presented research was to investigate the behavior of HSS and two types of their welded joints subjected to high loads controlled at strain mode. Additionally, the study was extended by the measurements of microhardness, a residual stress analysis and by the SEM observation of received fractures. Indicated research program has allowed to perform a comprehensive analysis of investigated material in the area of fatigue failure influenced by different factors.

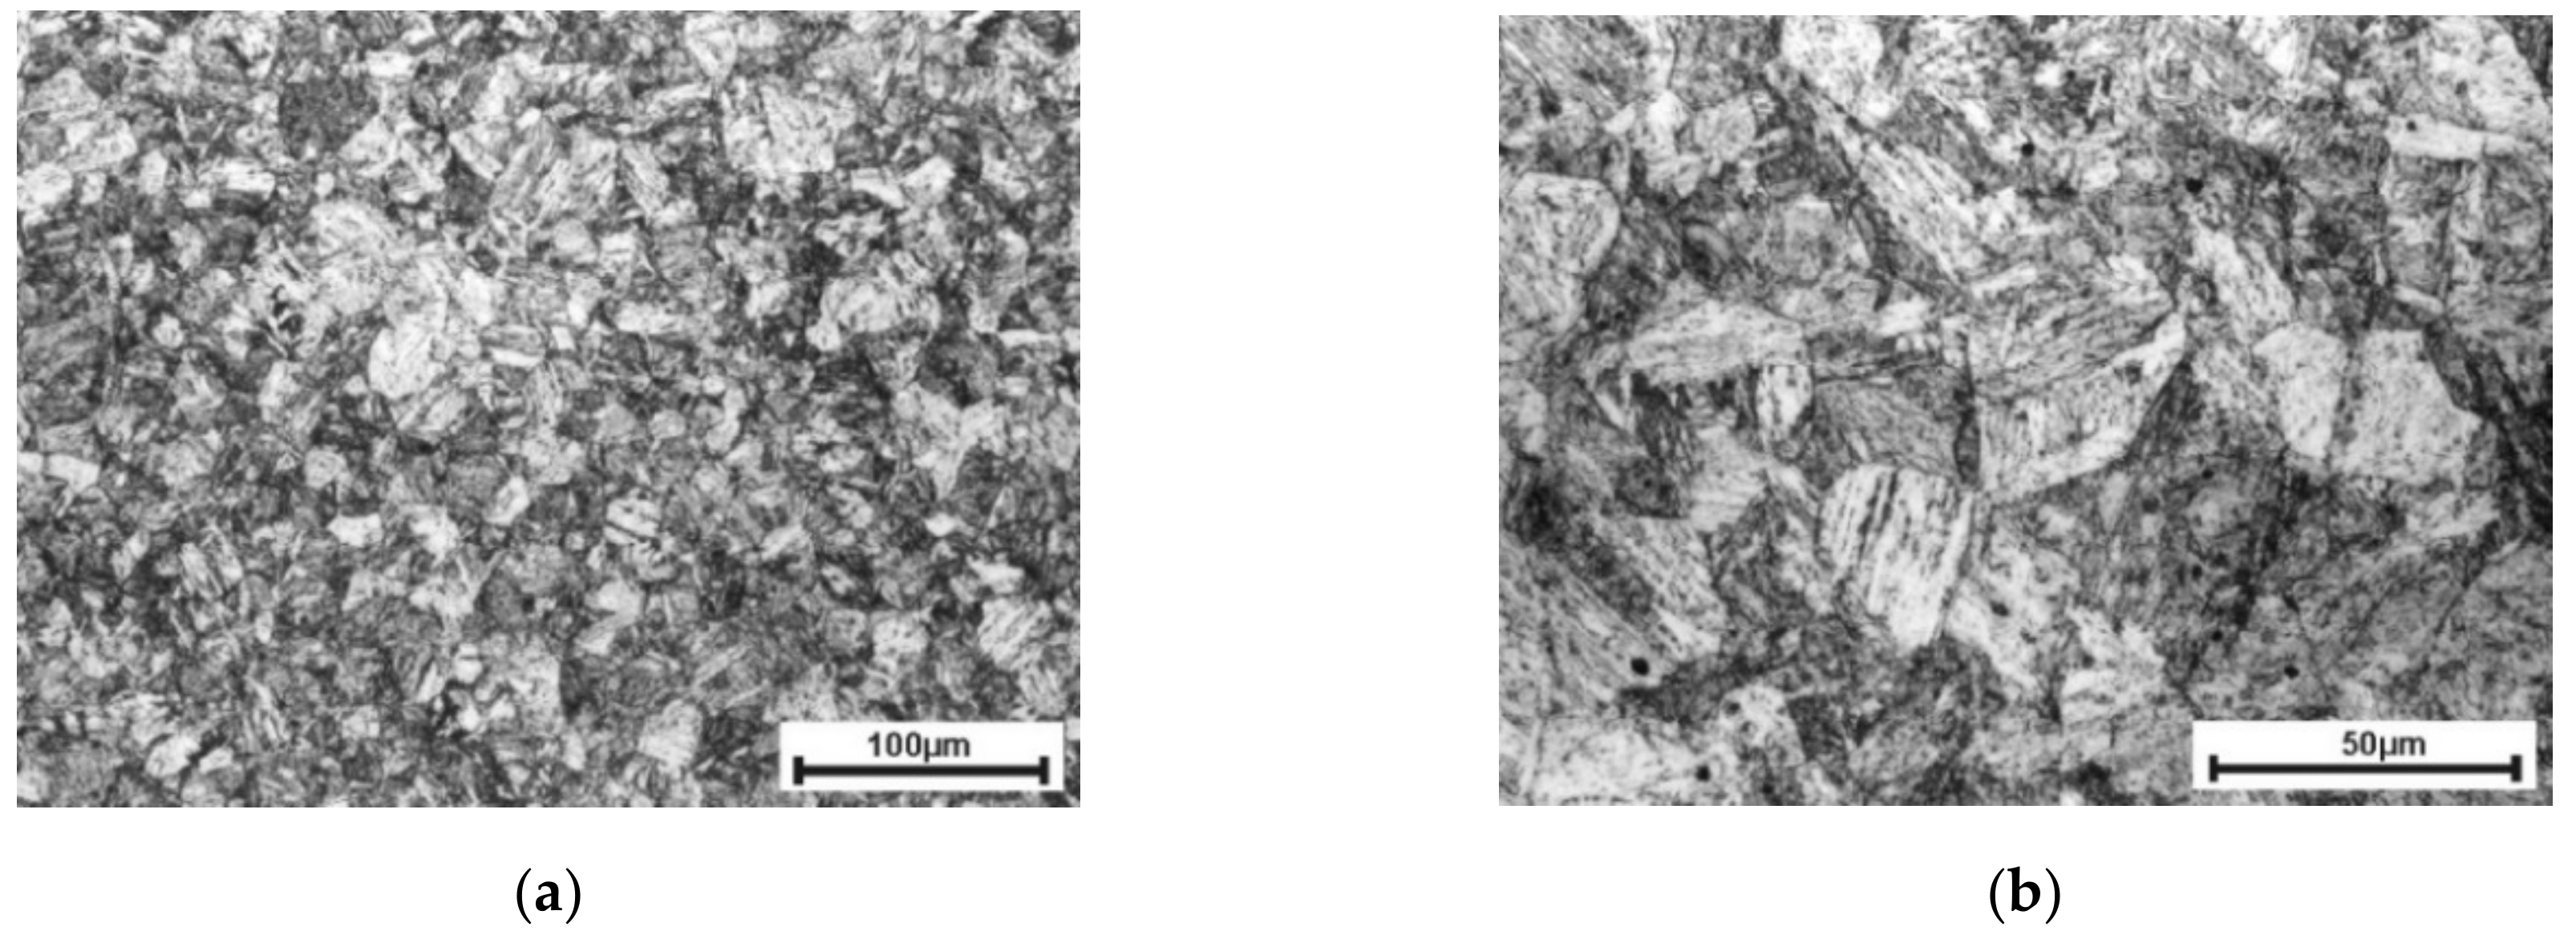
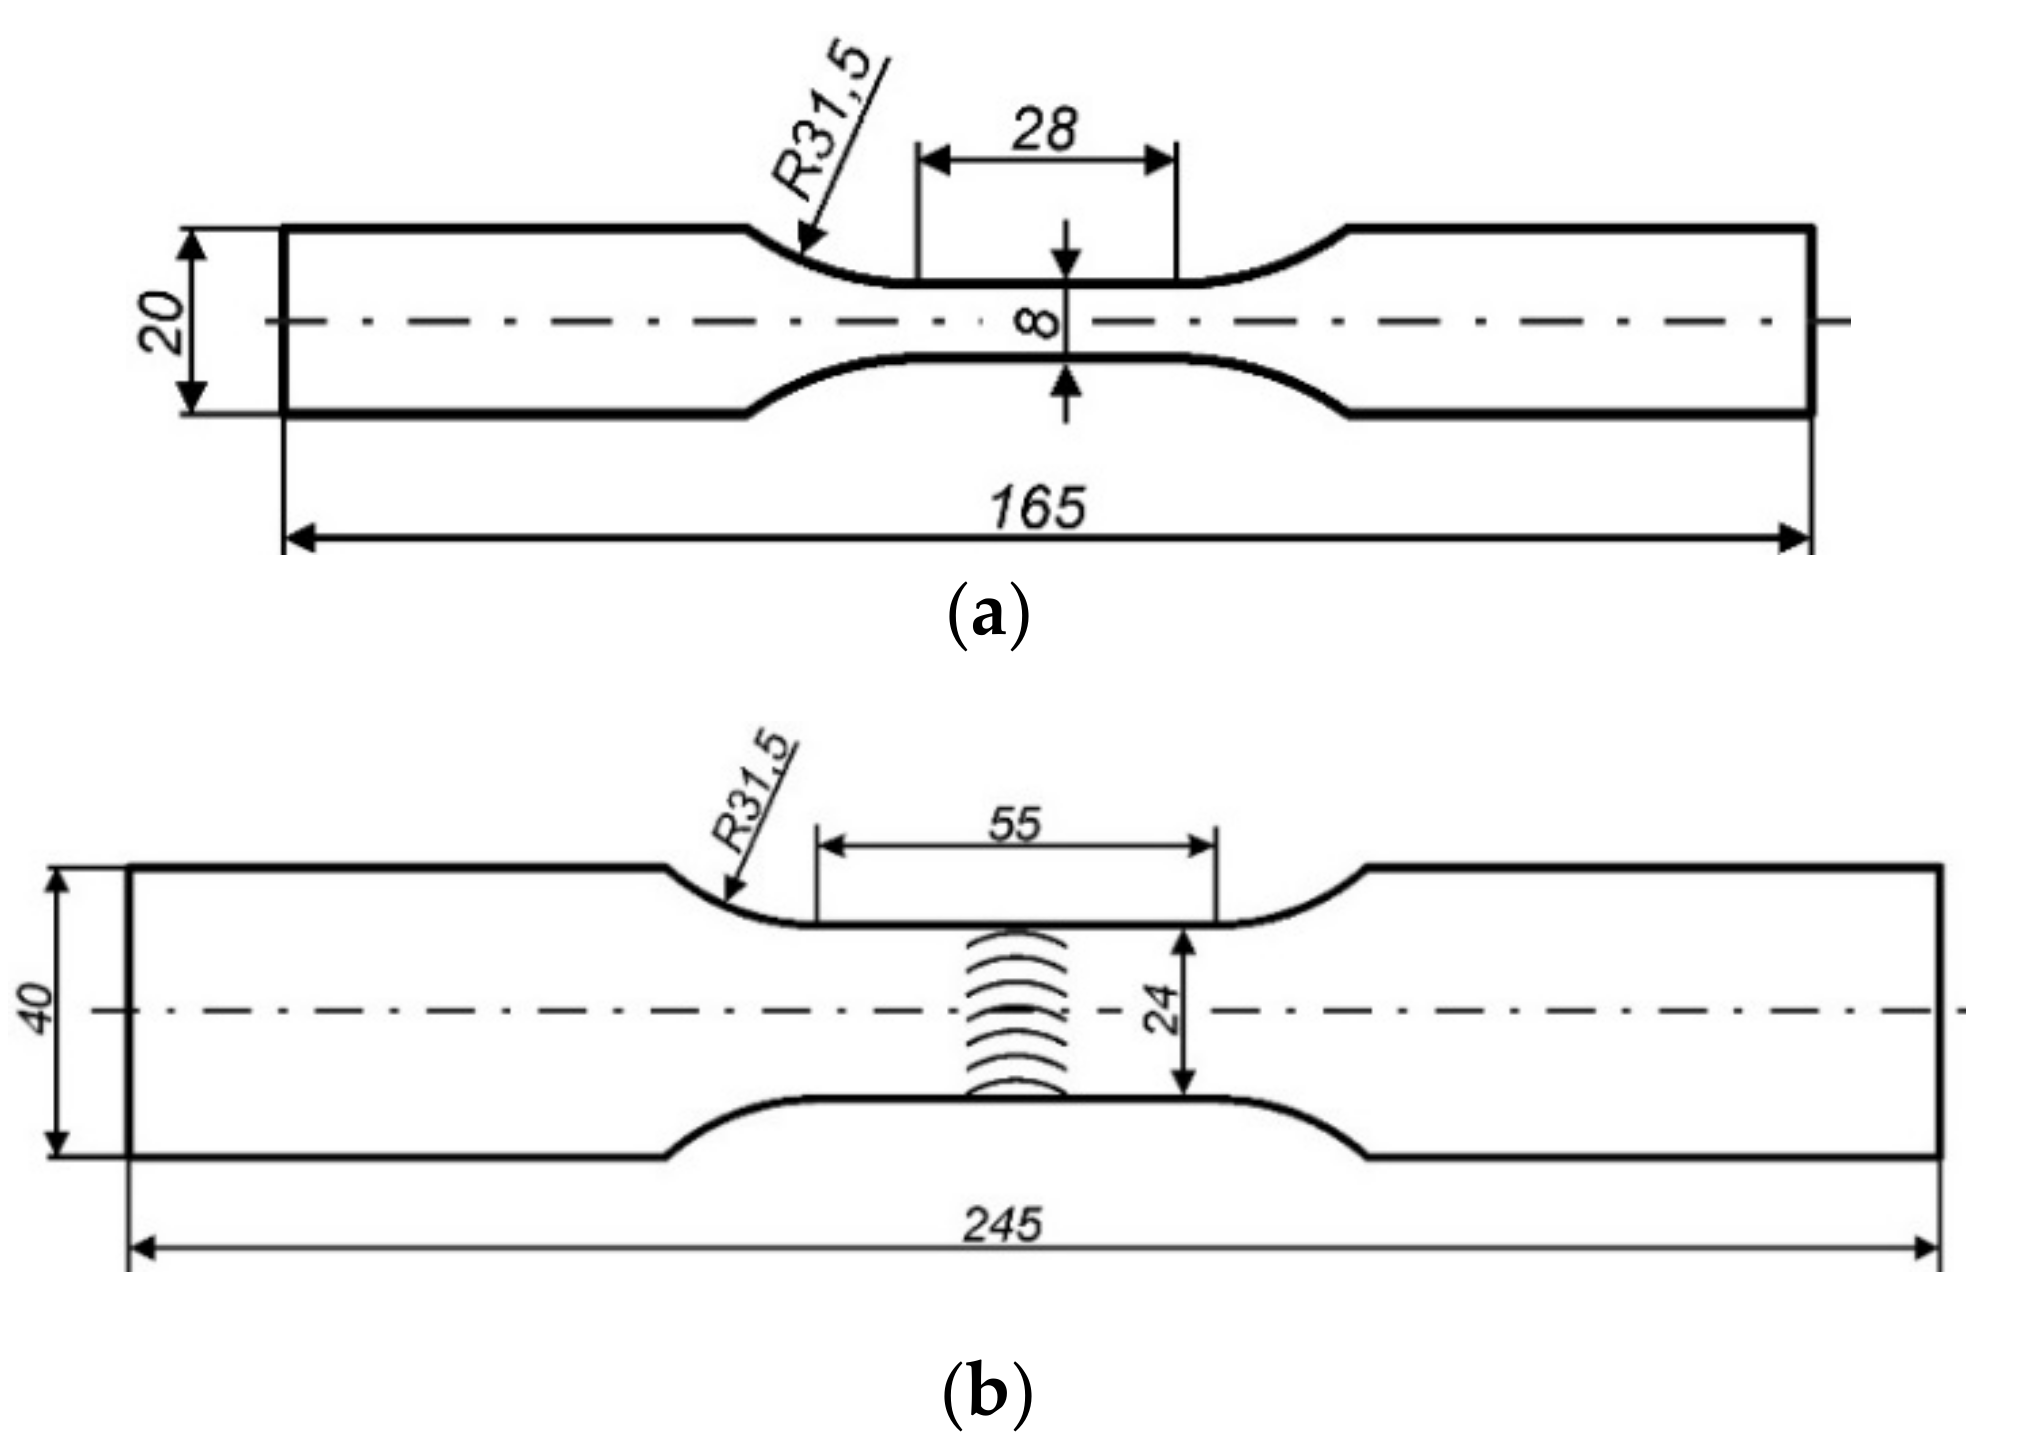
2. Materials and Methods

The research has been conducted on the high strength steel S960QL (1.8933). The verification of the chemical composition and mechanical properties was executed. Obtained results, along with the data from the delivery certificate, are presented in Table 1 and Table 2.
Chemical composition was determined by the energy-dispersive X-ray spectroscopy (EDS) method using a scanning electron microscope JSM-6610 (Jeol Ltd., Tokyo, Japan) equipped with an EDS spectrometer X-Max 50 (Oxford Instruments NanoAnalysis, High Wycombe, UK) whereas the strength properties were established during tensile tests carried out according to the standard [31] and the post-test made measurements. The microstructure of the investigated S960QL steel is shown in Figure 1.
The photos of the structure were obtained on metallographic microsections after grinding (finished at grade 2000) and polishing (1 µm Al2O3) which were then subjected to etching for approx. 15 s with nital (4% solution of nitric acid in ethanol). This steel features a fine-grained martensitic-bainitic structure with equivalent grain diameter of 10–25 μm (the cross-section of etched material was observed using SEM and the surface areas of selected grains were measured; the equivalent grain diameters were calculated as the diameter of circle with the same measured surface area).
The main investigations were performed on prepared two types of butt welds, namely a square joint and a single-V joint. The welding parameters were selected in order to reduce the amount of input heat which, in accordance with the welding requirements for the tested material should not exceed 1 kJ/mm [32]. The welds were made using MAG welding with shielding gas containing 82% CO2 and 18% Ar (EN ISO 14175-M21-ArC-18). Wire UNION X96 (EN ISO 16834-A-G Mn4Ni25CrMo) with a diameter of 1.2 mm was used to make the welds. Maximum heat did not exceed 0.75 kJ/mm. The second crucial difference in the execution of the welds was the type of welding process. The square joints were made using an automatic process, contrary to the single-V joints where a root was made manually, followed by automatic welding of a face. Detailed descriptions of the welding conditions, geometry of the welded joints before welding and macroscopic evaluations of the welds can be found in [33]. The quality assessment was made on the basis of X-ray tests and confirmed the high quality of the welds. The negligible welding defects were detected in the square joints, but in the single-V joints their concentration was significantly greater.
The assessment of fatigue properties was performed in terms of the low cycle fatigue (LCF) and carried out for the paternal material (PM) and welded joints (WJ). Fatigue tests were conducted on flat samples prepared on the basis of the ASTM E606-4 standard [34]. Test samples were cut from a slab with a nominal thickness of 6 mm. The length of reduced section in the samples has got 28 mm for PM (55 mm for WJ) and the width of 6 mm (24 mm for WJ). The technical drawings of the samples were shown in Figure 2.
The fatigue tests were performed on the material as supplied to reflect the causes of fatigue crack initiation in real conditions. Fatigue tests were carried out using an Instron 8808 pulsator (Instron, Norwood, MA, US) equipped with a dynamic extensometer with a 25 mm and 50 mm gauge length, respectively, for the fatigue tests of PM and WJ. The tests were conducted in strain mode controlled with the value of the total strain amplitude εac with a sinusoidal waveform. The values of εac fit in the range from 0.30% to 1.5% for PM and from 0.15% to 0.40% for WJ. The value of the strain ratio R of 0.1 and an average strain rate of έ = 10−2 s−1 was adopted. Used value of έ has prevented the samples against the growth of temperature in at the higher strains, and has allowed for shorting the duration of testing. The adopted failure criterion was a 25% decrease of maximum load. During the research a minimum of ten reliable tests were performed for each case (PM and two types of WJ).
The main investigations were expanded by the measurements of microhardness, the measurements of residual stresses in the cross-section of the weldments and the fractographic analysis of the fatigue fracture surfaces in order to more accurate description the influence of welding on fatigue behavior of high strength steel.
The measurement of Vickers HV0.1 micro-hardness on cross-sections of the welds of examined HSS steel was carried out using a semi-automatic micro-hardness meter (Shimadzu, Kyoto, Japan).
Residual stresses have been measured in the cross-section of WJ-S joint in two directions: vertically (perpendicularly to the sample surfaces) and horizontally (parallel to the sample surfaces). The surface of metallographic micro section was prepared by grinding under final gradation not lower than 600 and electrochemical polishing. The aim of preparation was to remove surface layer disrupted by machining. Measurements of residual stresses were conducted by X-ray diffraction technique using the sin2ψ method. The angular position of the selected Bragg diffraction hkl was the measured value, whose change reflects the elastic deformation of the crystal lattice of the tested material. The measurement was performed using a Rigaku MSF-3M system (Rigaku, Tokyo, Japan) equipped with an X-ray tube with a cobalt anode (filtered radiation CoKα, λ = 1.79026 Å). The fractographic observations were conducted using a JSM-6610 scanning electron microscope equipped with two detectors: secondary electrons (SE) and backscattered electrons (BSE).

3. Results

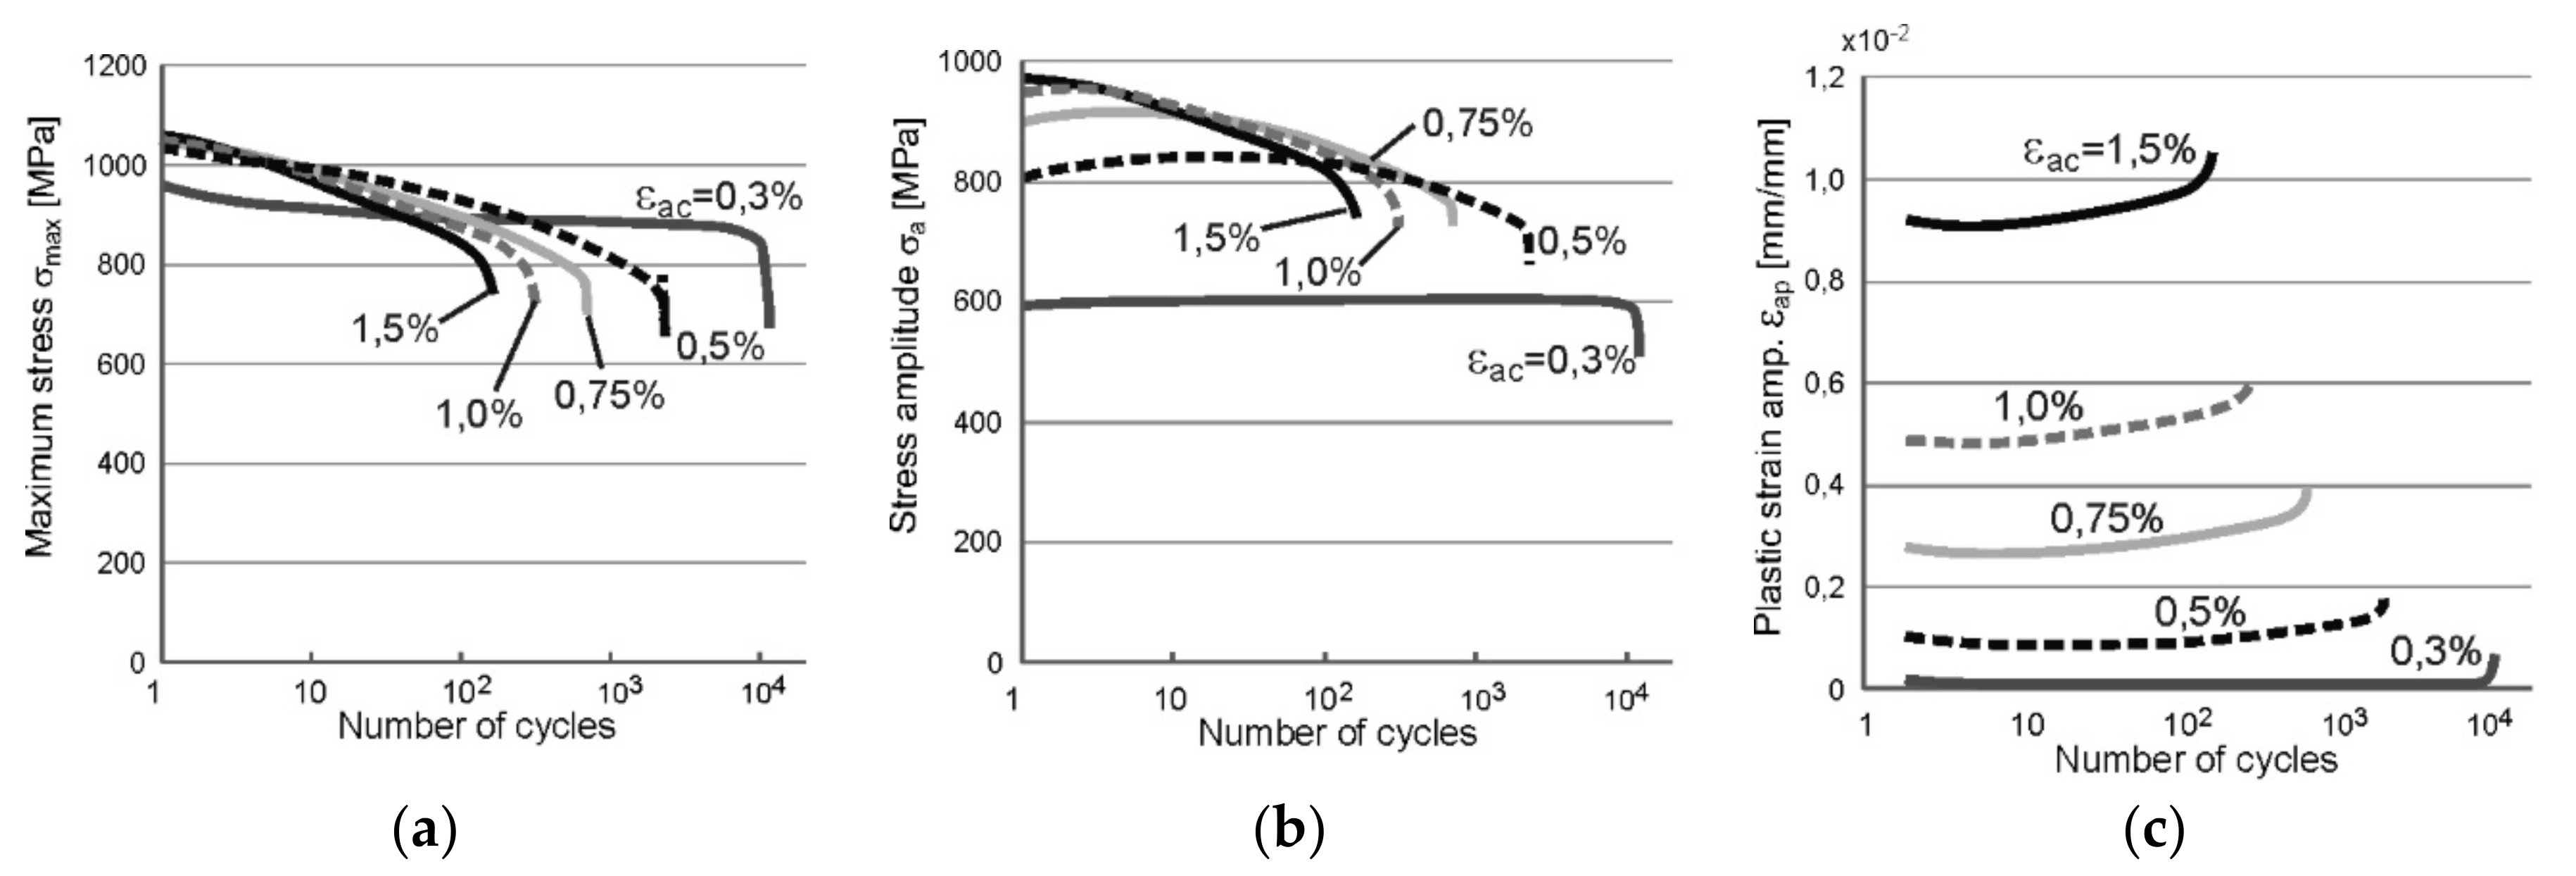
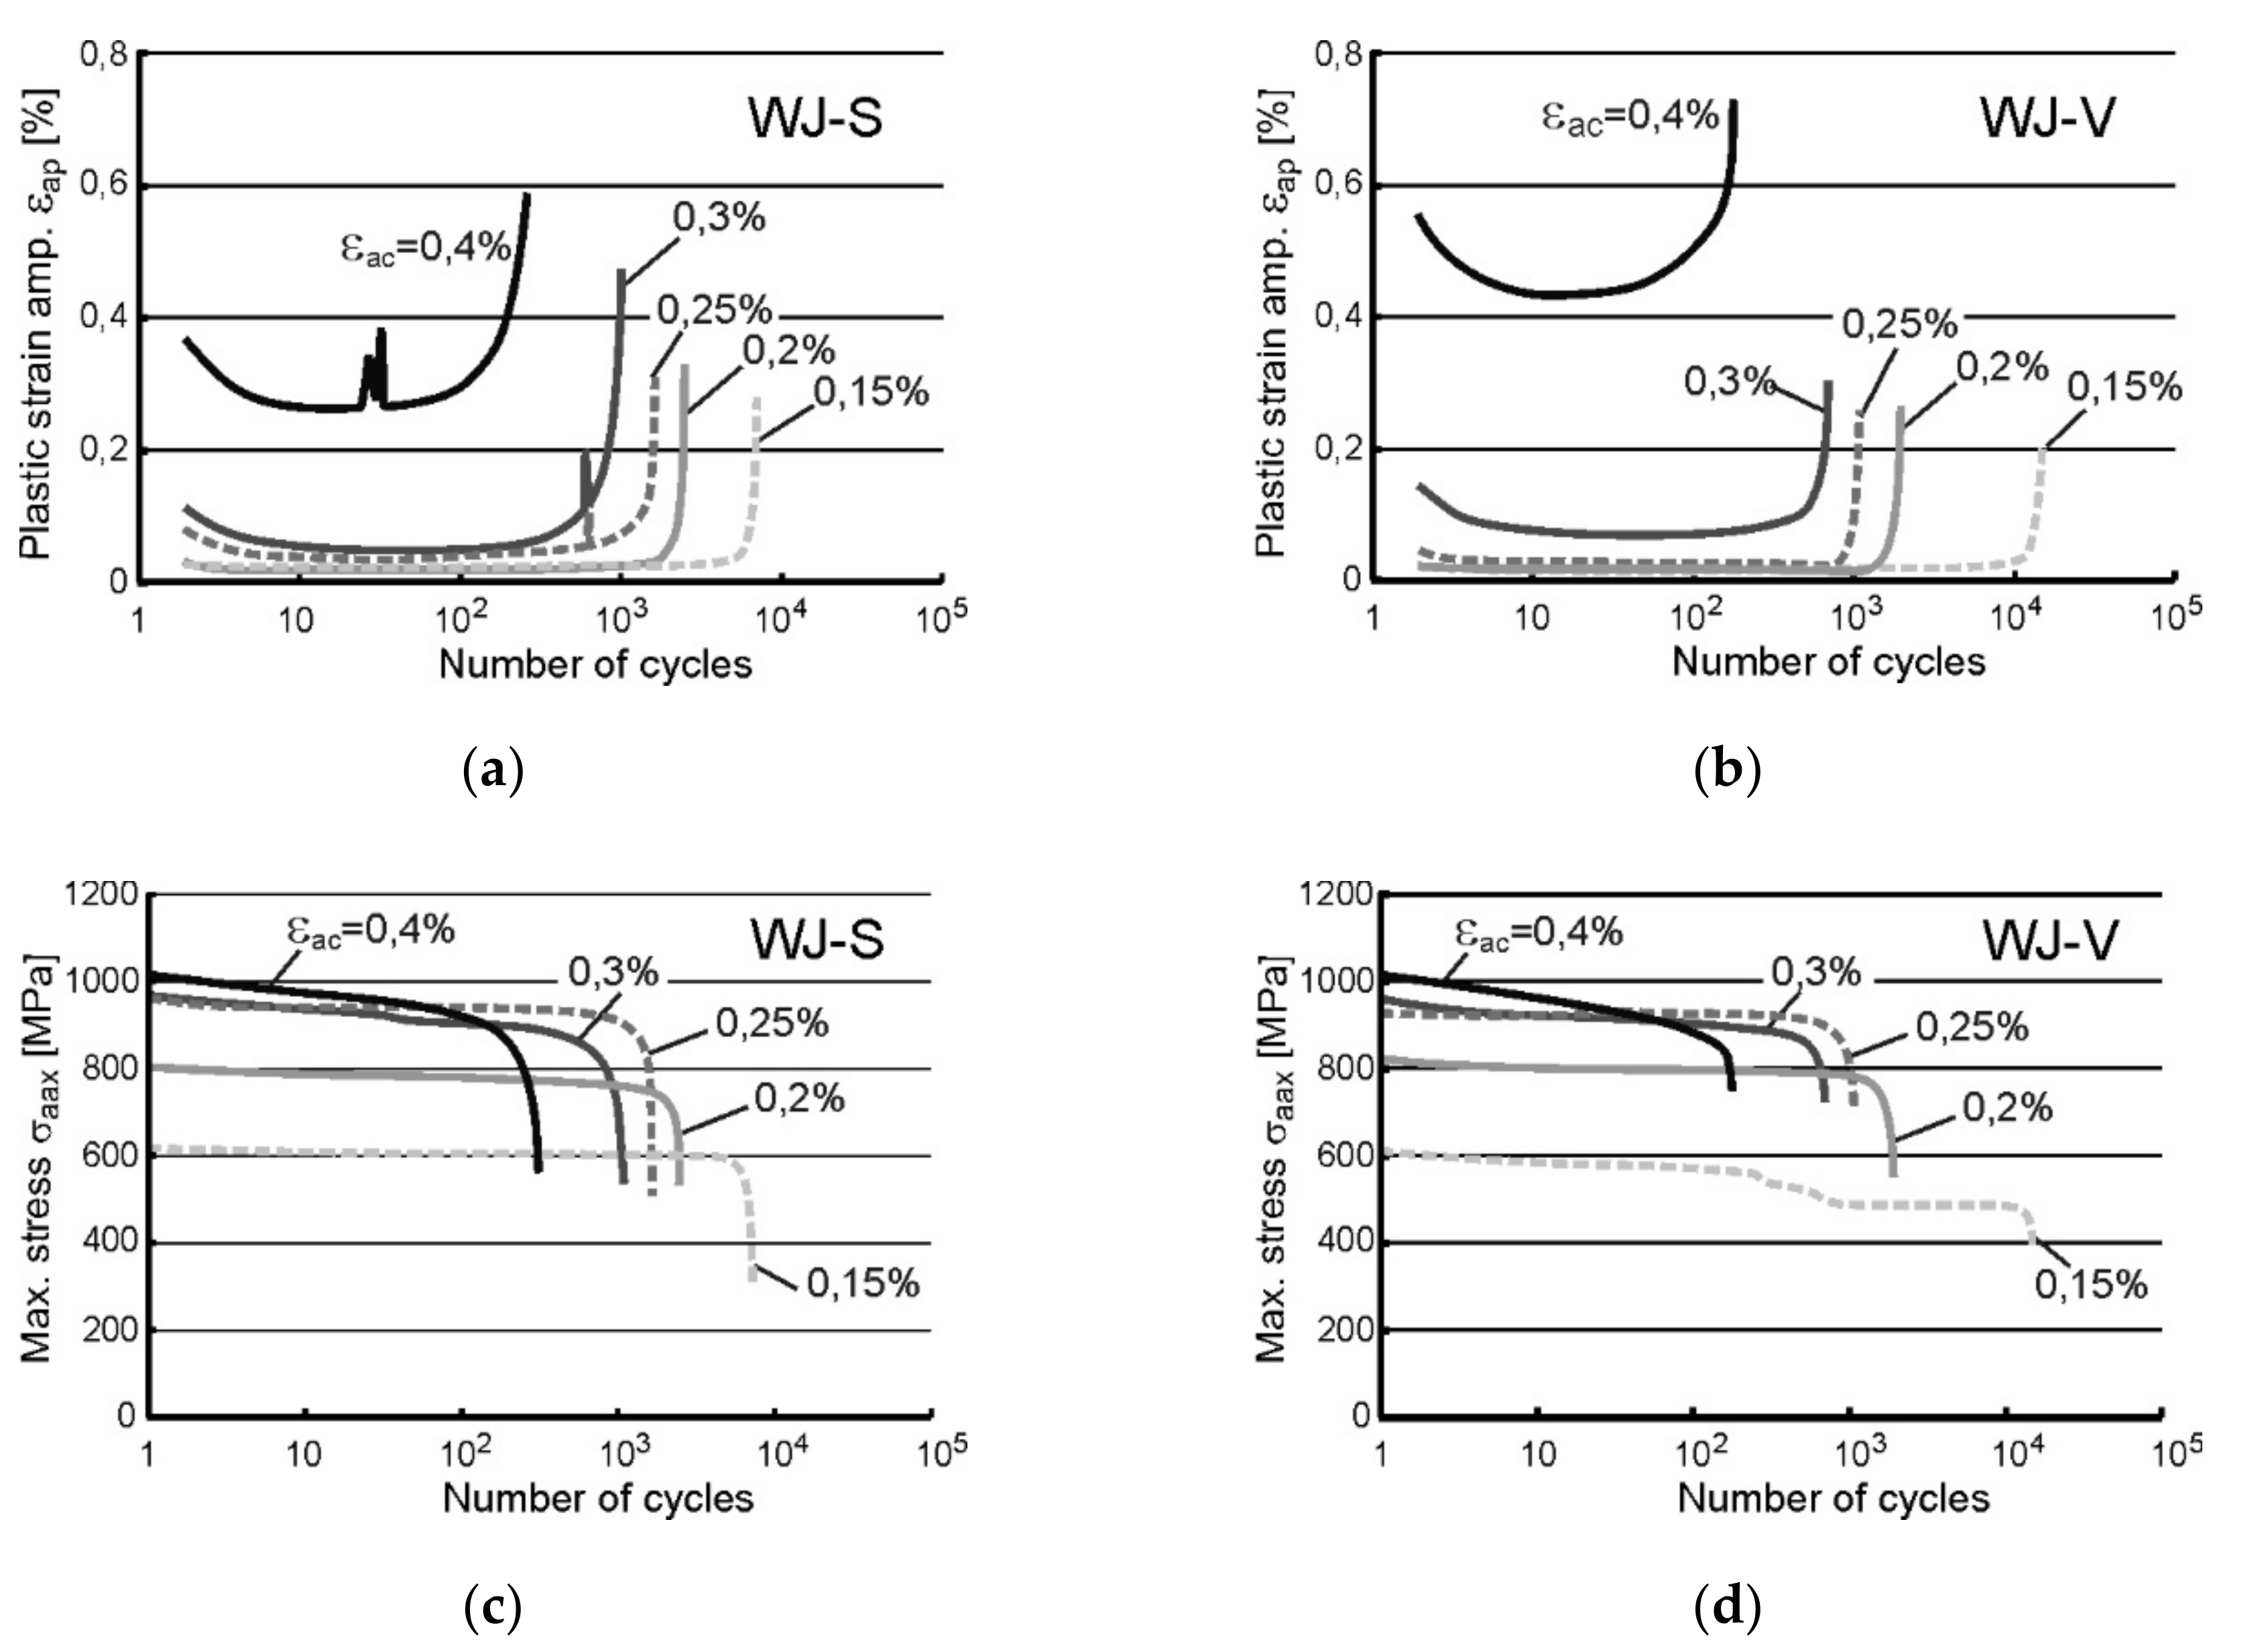
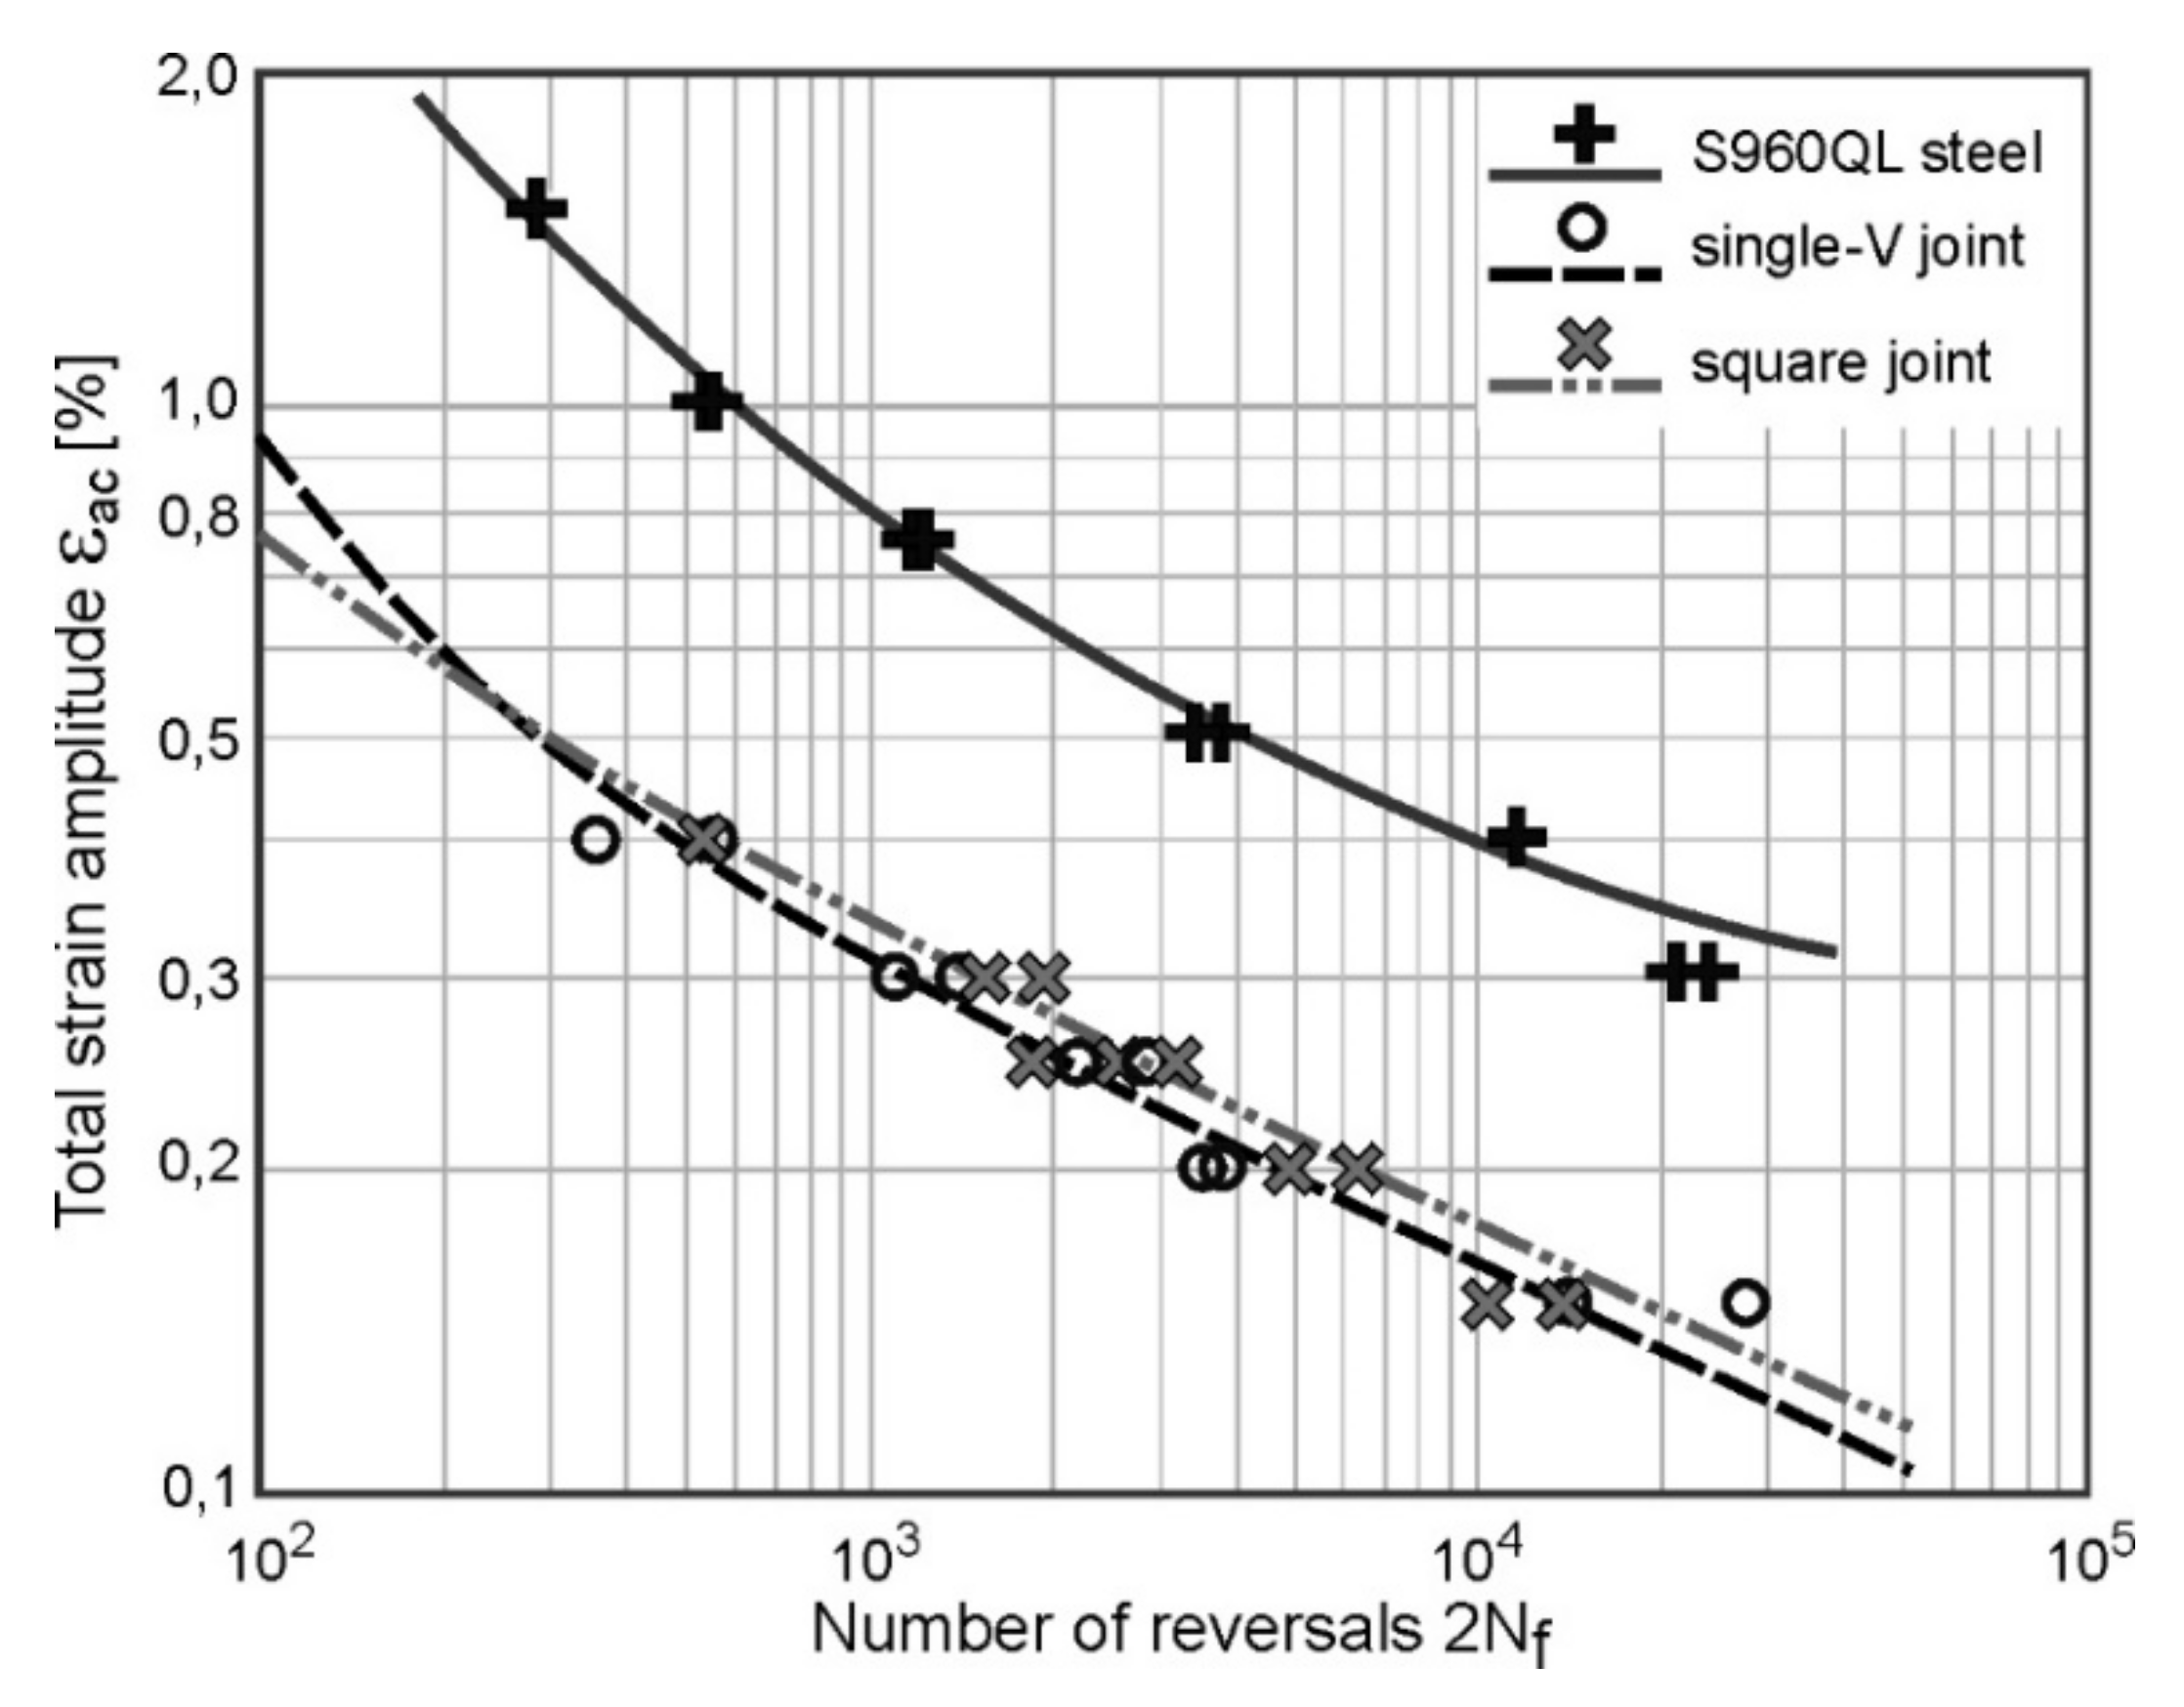
3.1. LCF Tests for S960QL Steel and Its Welded Joints

The results of the performed low cycle fatigue tests are presented in the form of recorded exemplary courses of fatigue parameters: a maximum stress σmax, a stress amplitude σa, and an amplitude of plastic strain component εap, both for PM and two types of WJ. Obtained data are shown in Figure 3 and Figure 4, nevertheless in the case of WJ the results of the amplitude of plastic strain component εap and the maximum stress σmax are presented.
On the basis of the graphs presented in Figure 3 it can be stated that the steel S960QL is subjected to cyclic weakening at load amplitudes εac higher than 0.5% (Figure 3a) while this phenomenon has not been observed at the amplitude of 0.3%. This indicates a low propensity of the examined steel to strengthen. A change in the behavior occurs after 5–10 cycles what can be seen in Figure 3a,c. It involves the stabilization of the parameters (at εac = 0.3%) or a change of their course (at other values of εac) from increasing/decreasing to the opposite (both in case of σa and εap).
Significant differences in the courses of the plastic strain amplitude εap were revealed during the tests of both types of welds WJ-S and WJ-V (Figure 4a,b). At loads εac equal to 0.3% and 0.4% the amplitude εap is much higher in WJ-V than in WJ-S joints. At lower loads the recorded values of εap are comparable, although it can be noted that in the case of WJ-S the values are slightly higher. Courses of σmax value (Figure 4c,d) have not shown significant differences.
The further study of the cyclical behavior of examined PM and its welds, both the WJ-S and WJ-V, was performed on the basis of data obtained from each LCF fatigue test and the values of parameters determined from recorded stabilized hysteresis loops. This data have been used to conduct the fatigue analysis based on the Manson-Coffin-Basquin relationship (1):
εac = εae + εap = σ’f ∙ E−1 ∙ (2Nf)b + ε’f ∙ (2Nf)c
where:
  • εac—a total strain amplitude;
  • εae—an elastic component of total strain;
  • εap—a plastic component of total strain;
  • σ’f—a fatigue strength coefficient;
  • ε’f—a fatigue ductility coefficient;
  • Nf—a number of cycles to failure;
  • 2Nf—a number of reversals to failure;
  • b—a fatigue strength exponent;
  • c—a fatigue ductility exponent.
In order to determine the values of fatigue coefficients and exponents, two curves are considered separately, namely elastic curve and plastic. These curves have courses similar to rectilinear in log-log system of strain amplitude (εae or εap) and number of reversals (2Nf). That means that they can be determined easily and than add up, according to relationship (1).
In Figure 5 the strain-life curves obtained for S960QL steel and two types of their WJ are presented. There are shown both the experimental data (points) and the curves described by relationship (1).
Determined values of individual coefficients and the corresponding exponents, both for PM and welded joints WJ-S and WJ-V, are summarised in Table 3. There are also the values of the correlation coefficient R2 corresponding to particular groups of parameters placed.

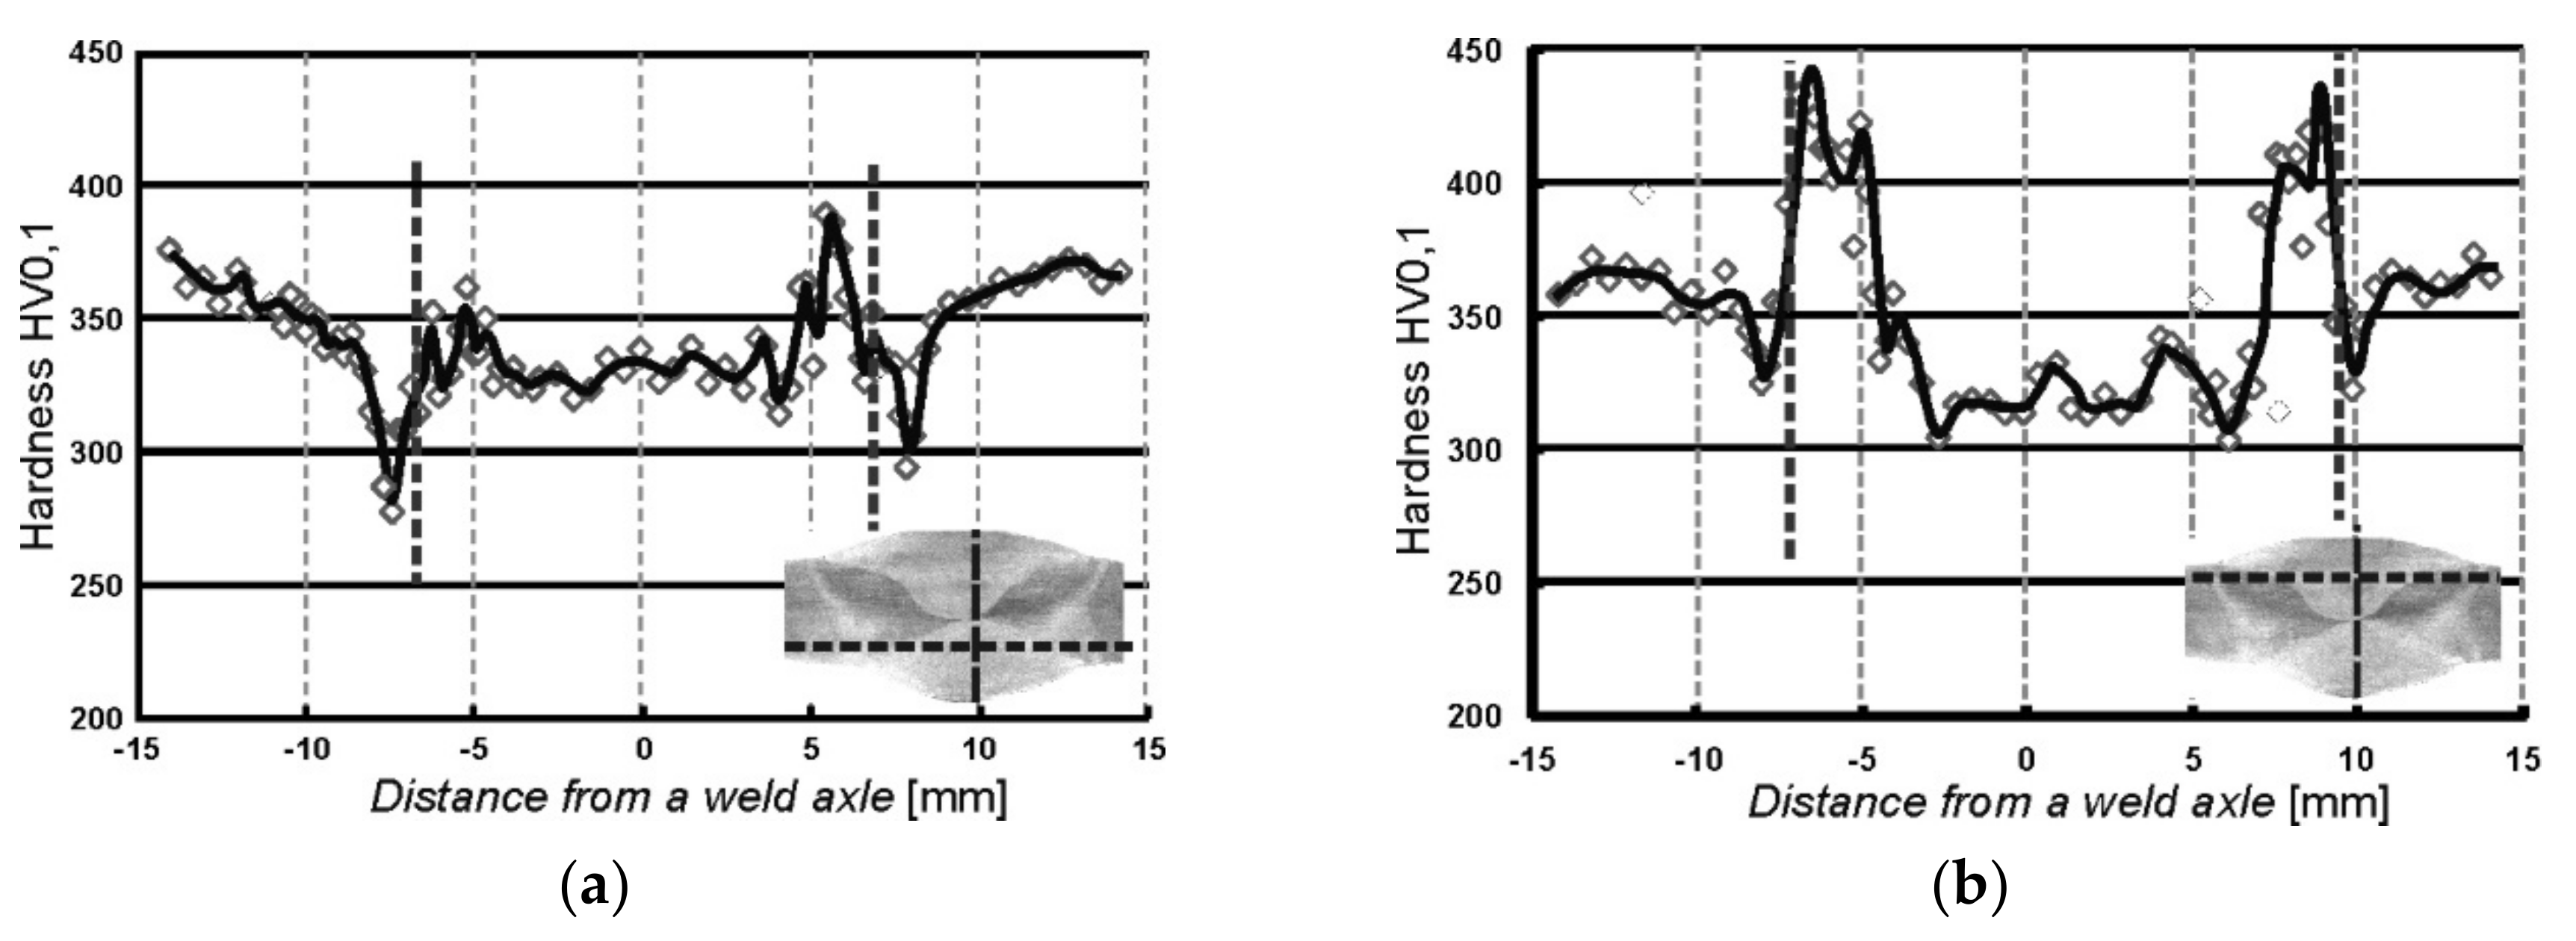
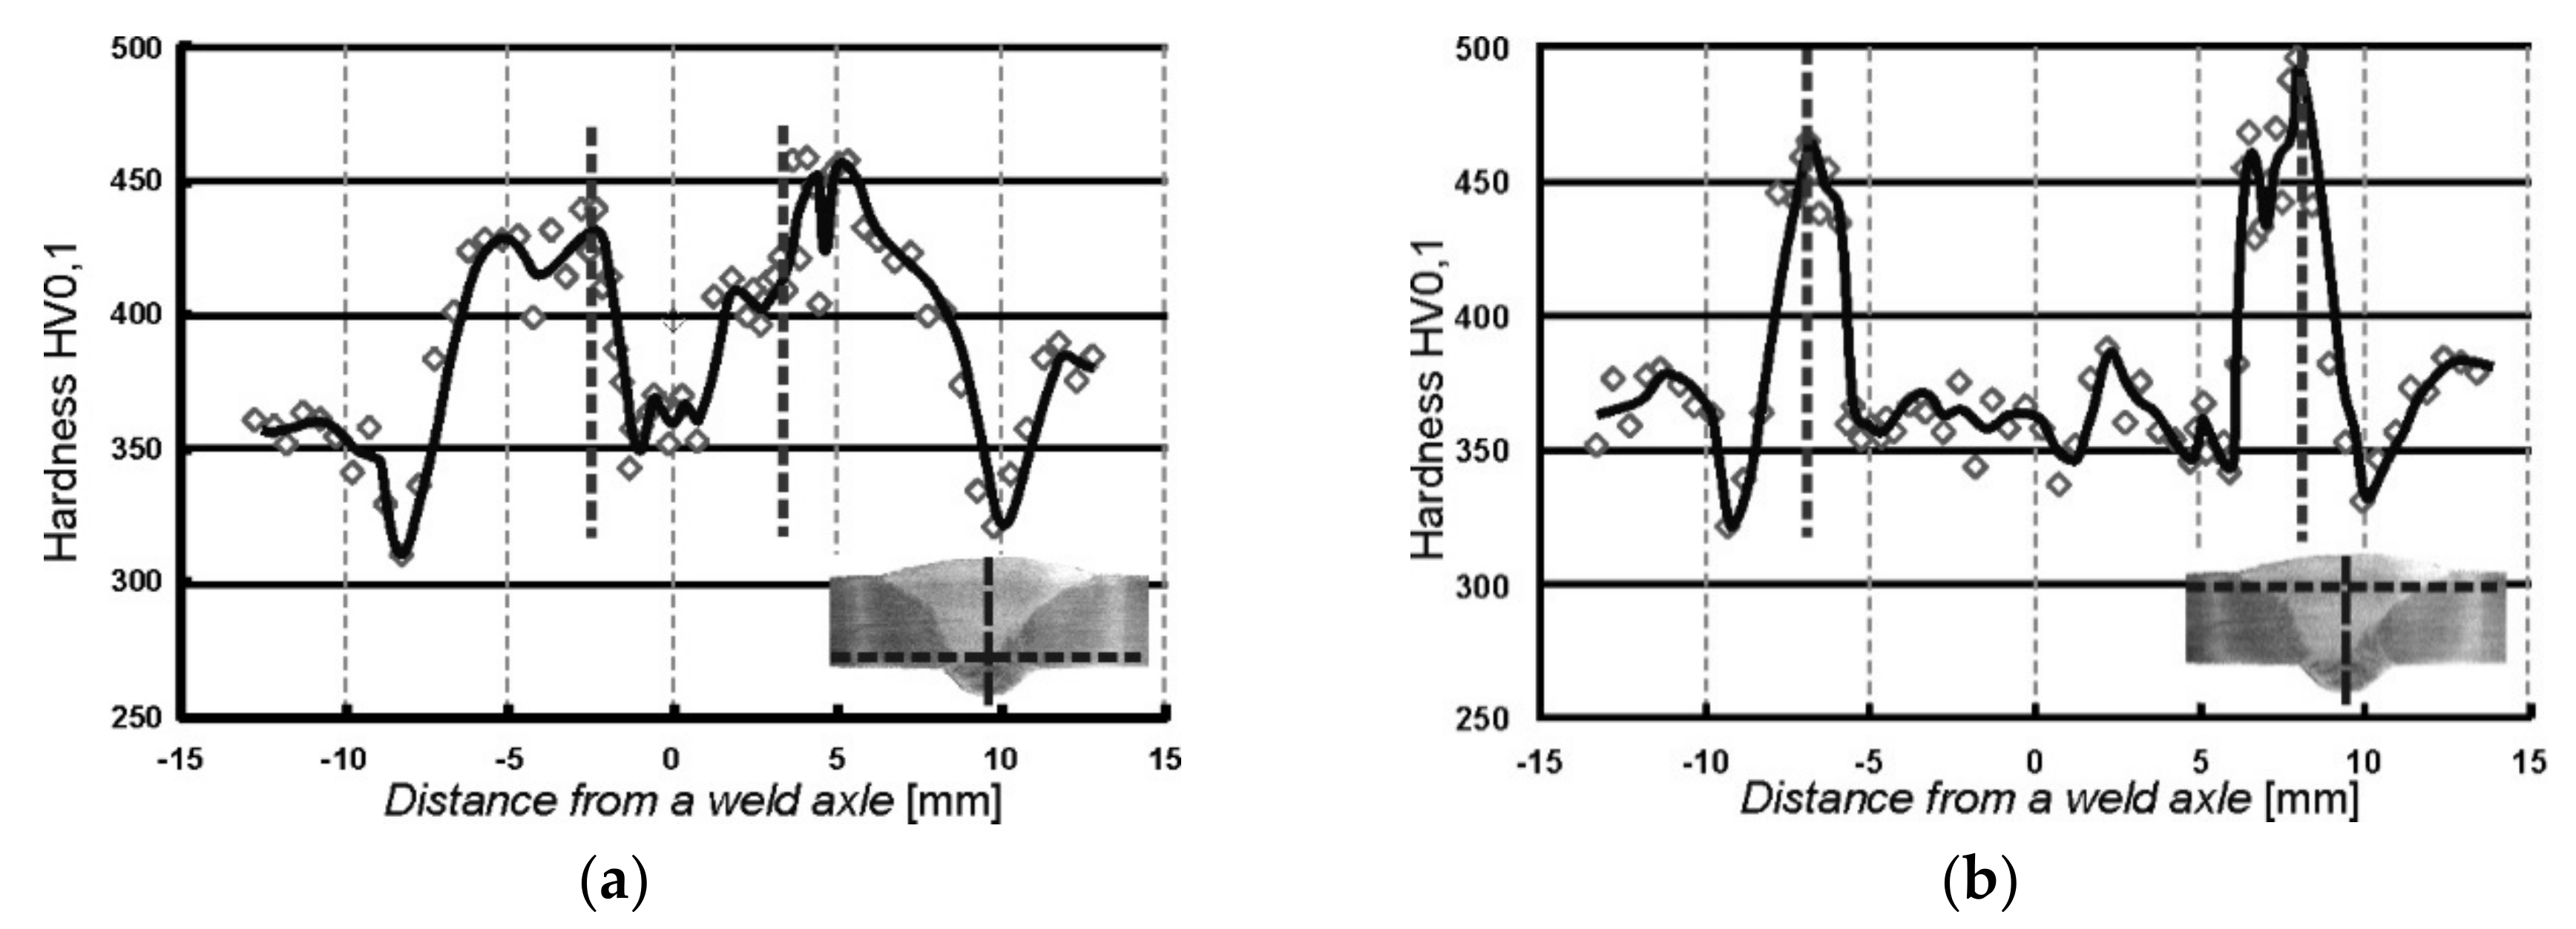
3.2. Measurement of Microhardness

The measurements were carried out on the cross-sections of samples in two rows which were in a distance of approximately 1 mm from the surface. The distribution of micro-hardness obtained in the tested WJ-S and WJ-V joints are shown in Figure 6 and Figure 7.
The distributions of micro-hardness in measurement rows involving welding runs made first are shown in Figure 6a and Figure 7a, contrary to Figure 6b and Figure 7b, where the distributions in measurement rows covering the second runs are presented. On the weld thumbnails horizontal lines indicate the track along which the measurements were made and the vertical lines indicate the weld axis from with the distances were measured. Vertical dashed lines placed in the plots represent the position of the fusion line of individual welds.
On the basis of the presented results it can be stated that the greatest micro-hardness of almost 500 HV0.1 is located into welded area in the immediate vicinity of the fusion line. In addition, tempering zones (incomplete normalization) are visible, manifested by the maximum hardness decrease out of the weld. Moreover, the course of hardness in the first run is smoothed as the beneficial effect of the second welding run (Figure 6a and Figure 7a).

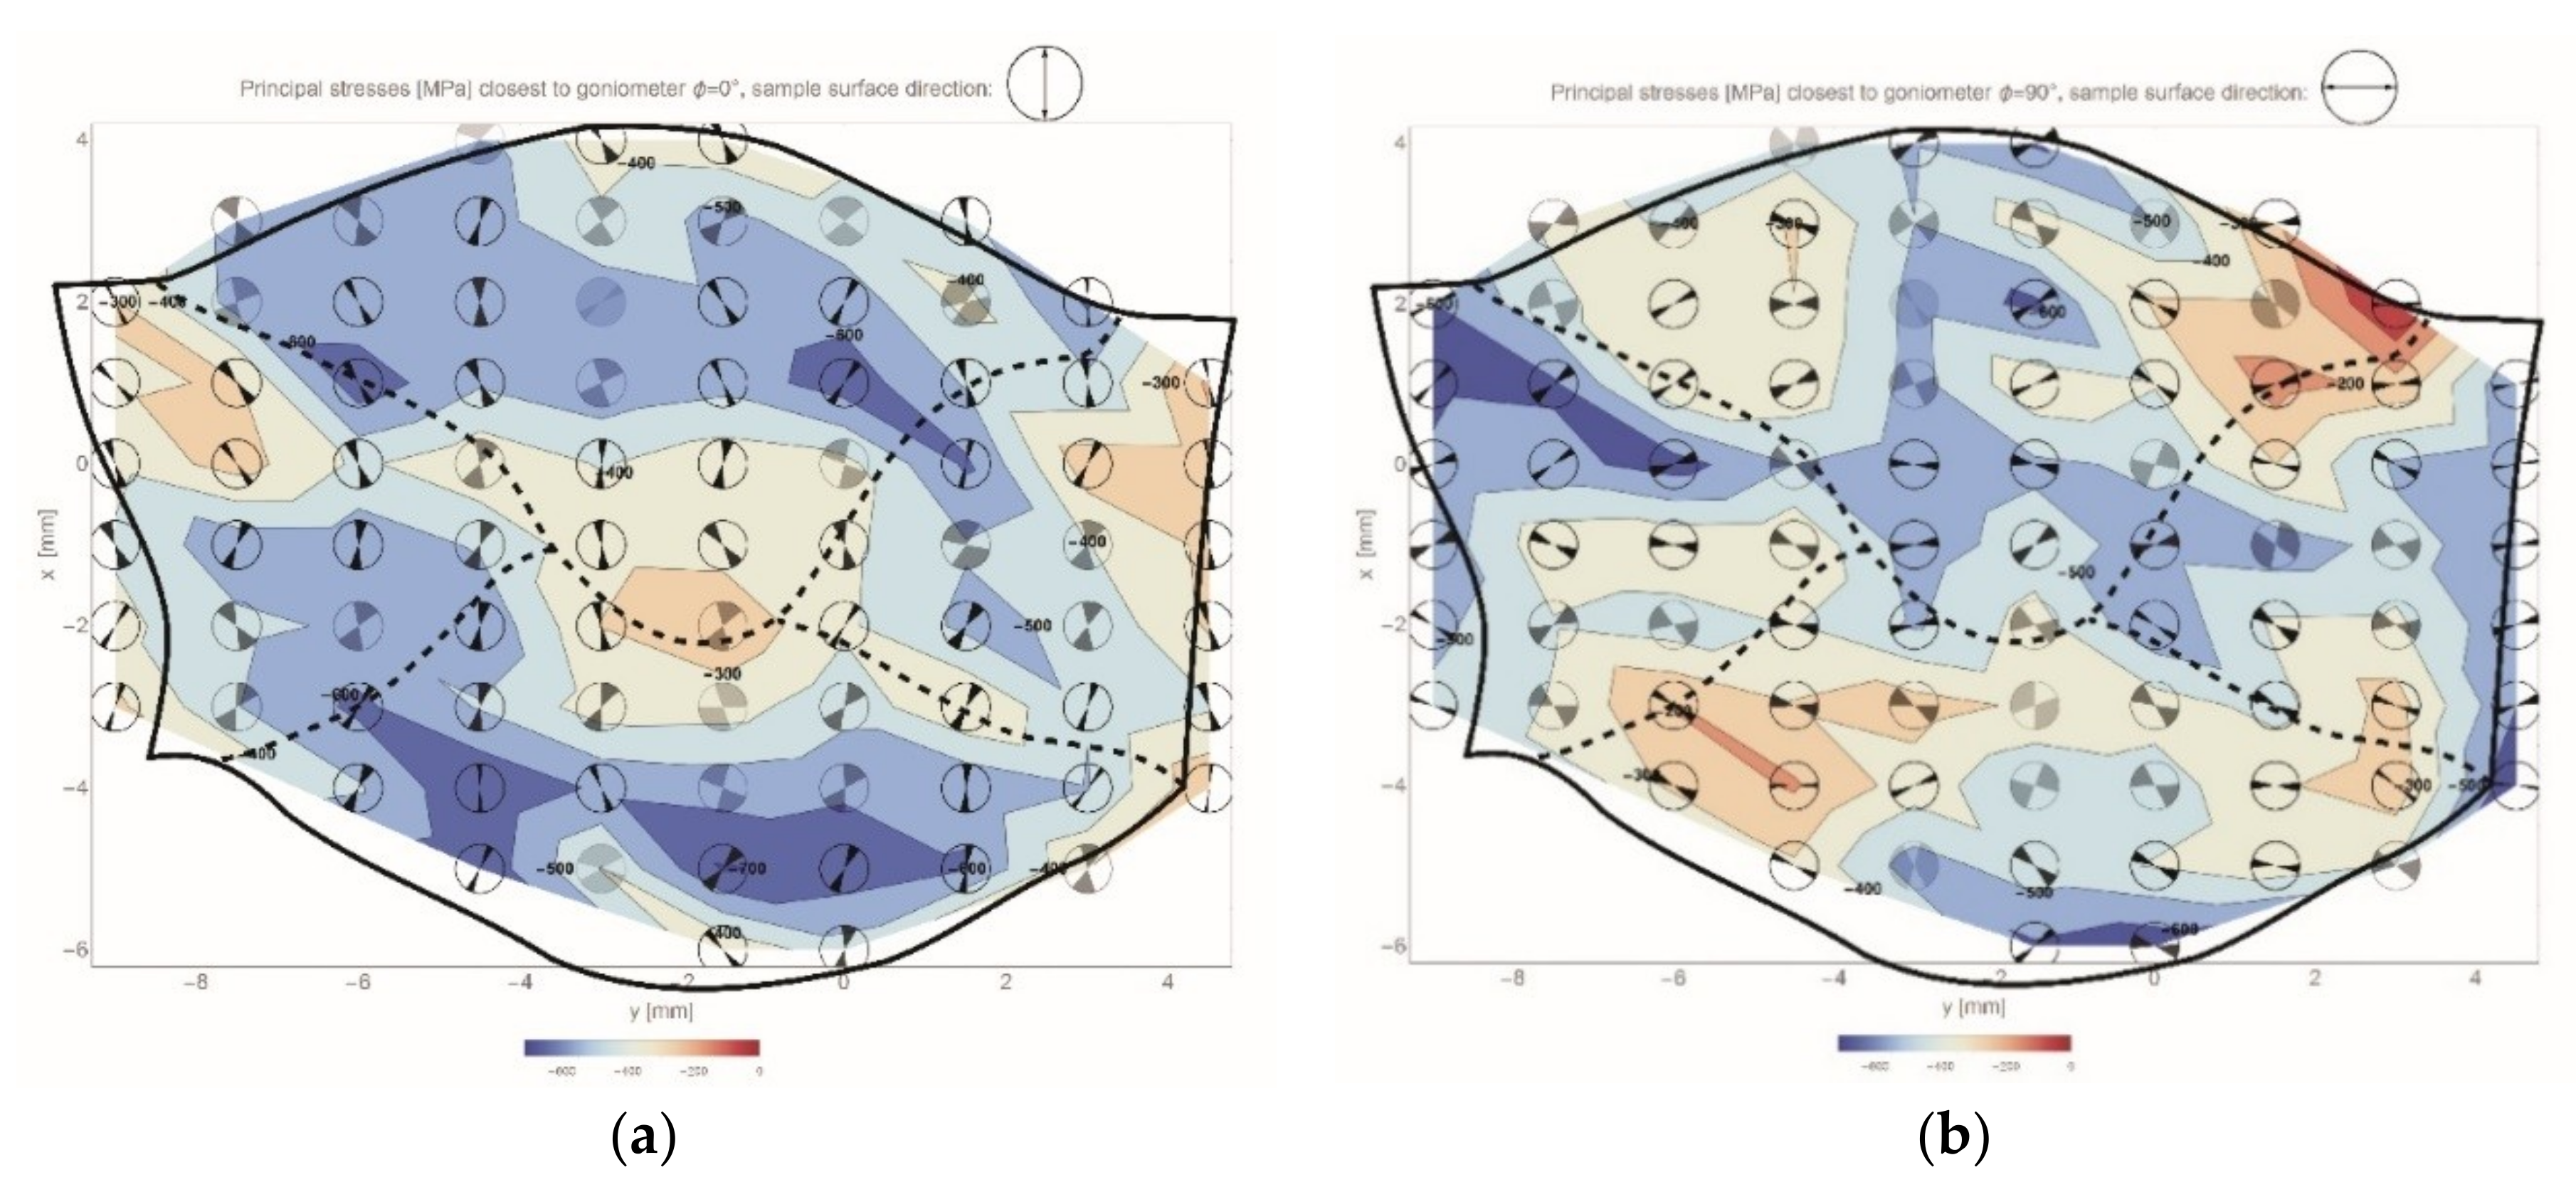
3.3. Residual Stresses Analysis

A measurement grid was established on the cross section of the weld WJ-S with the distance between the measuring points of 1 mm. Almost one hundred measurement points were defined and the received results has allowed for preparing maps of projection of the principal stress vector, closer to individual direction, in the vertical and horizontal direction. Obtained maps of residual stresses are shown in Figure 8.
The direction of the principal stress vector on the residual stresses maps is identified by pointing the directional marker located in individual circular areas. The value of the absolute uncertainty of this direction is specified by the opening angle of the marker, moreover its tone shows the uncertainty of determining the value (the brighter the greater uncertainty of measurement).
The obtained results clearly indicate that compressive stresses are present in the whole area of the weldment. However in the vicinity of the fusion line (near the surface) a reduction of compressive stresses in the horizontal direction can be noticed (Figure 8b). The stress reduction is also apparent in the vertical direction (Figure 8a) in the middle of the weld, which is directly related to the direction of heat flow resulting in the formation of temperature stresses. Furthermore, the directions of the principal stresses are characteristically oriented with respect to the fusion line, namely they are approximately perpendicular/parallel to this line.

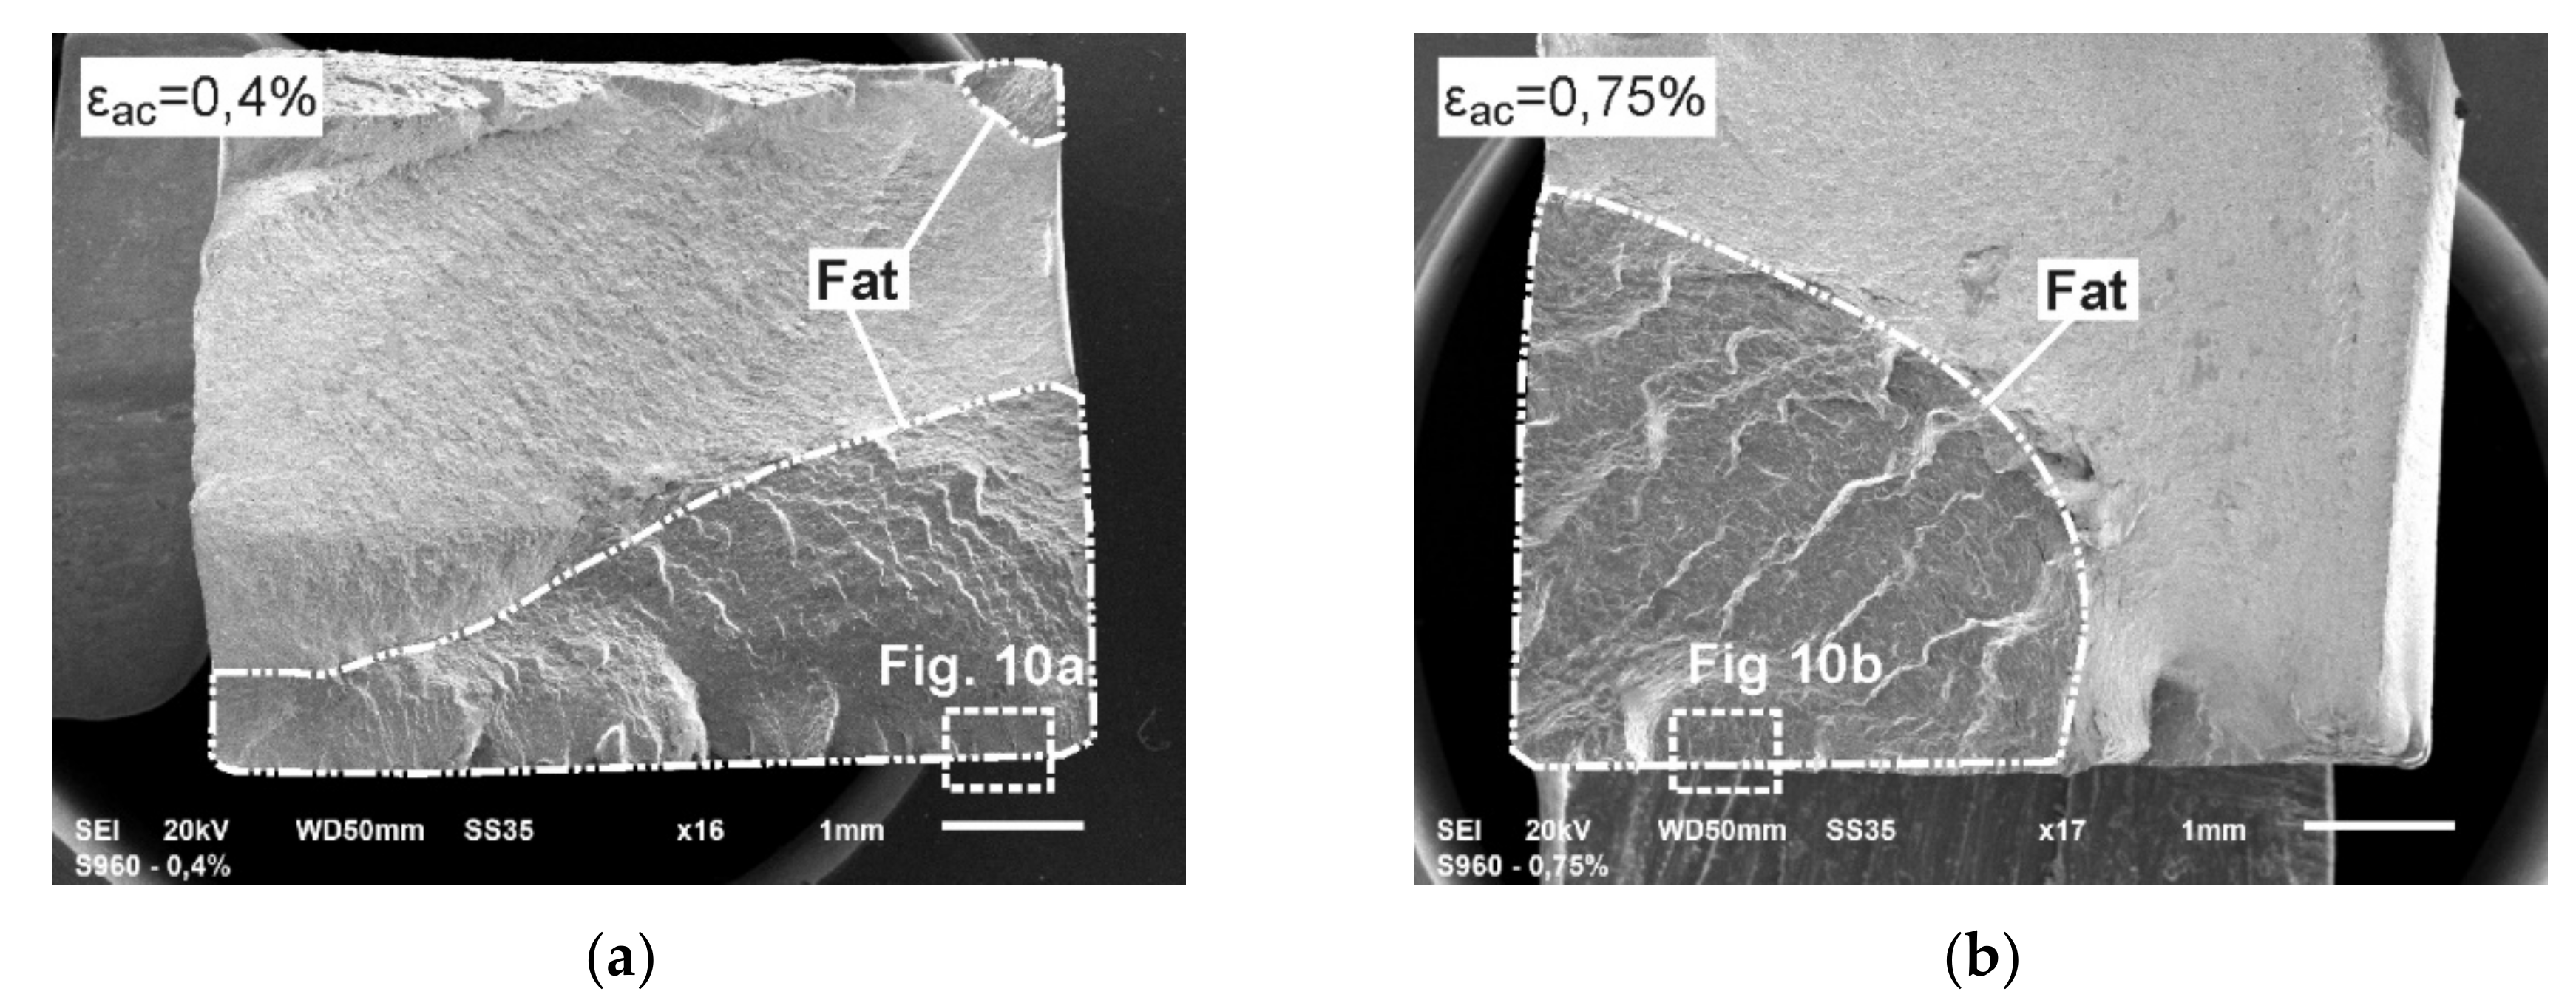
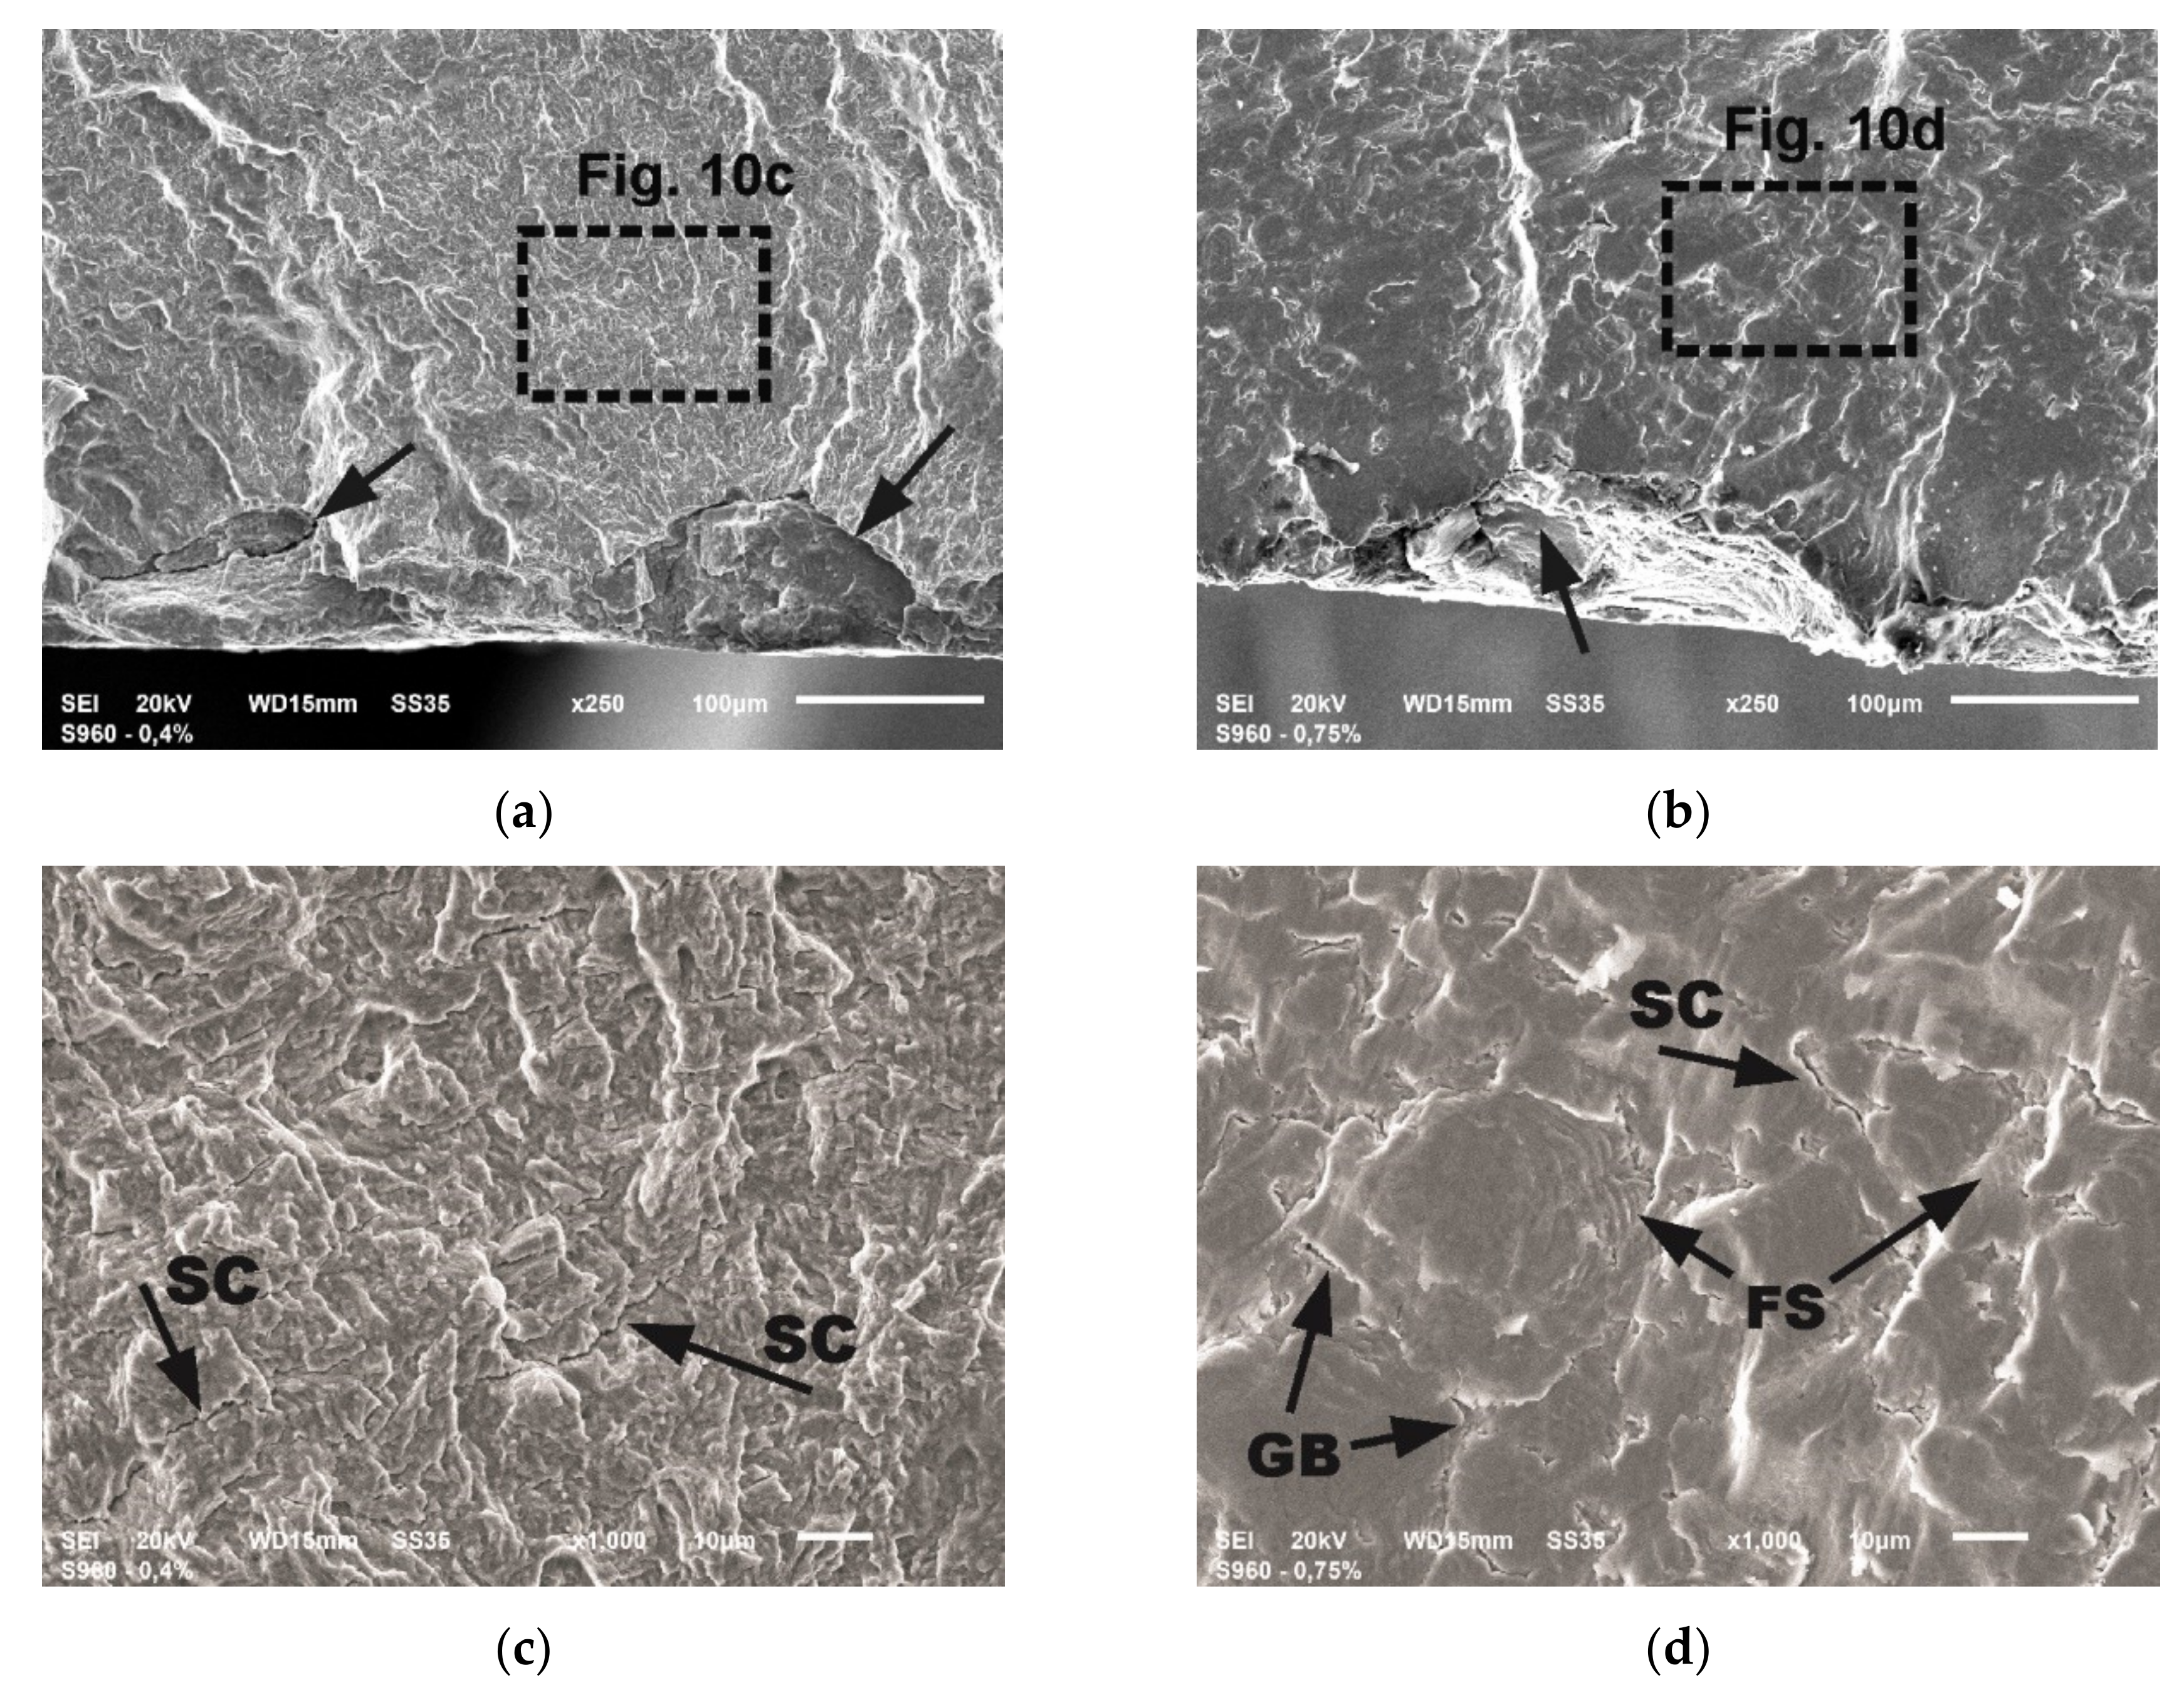
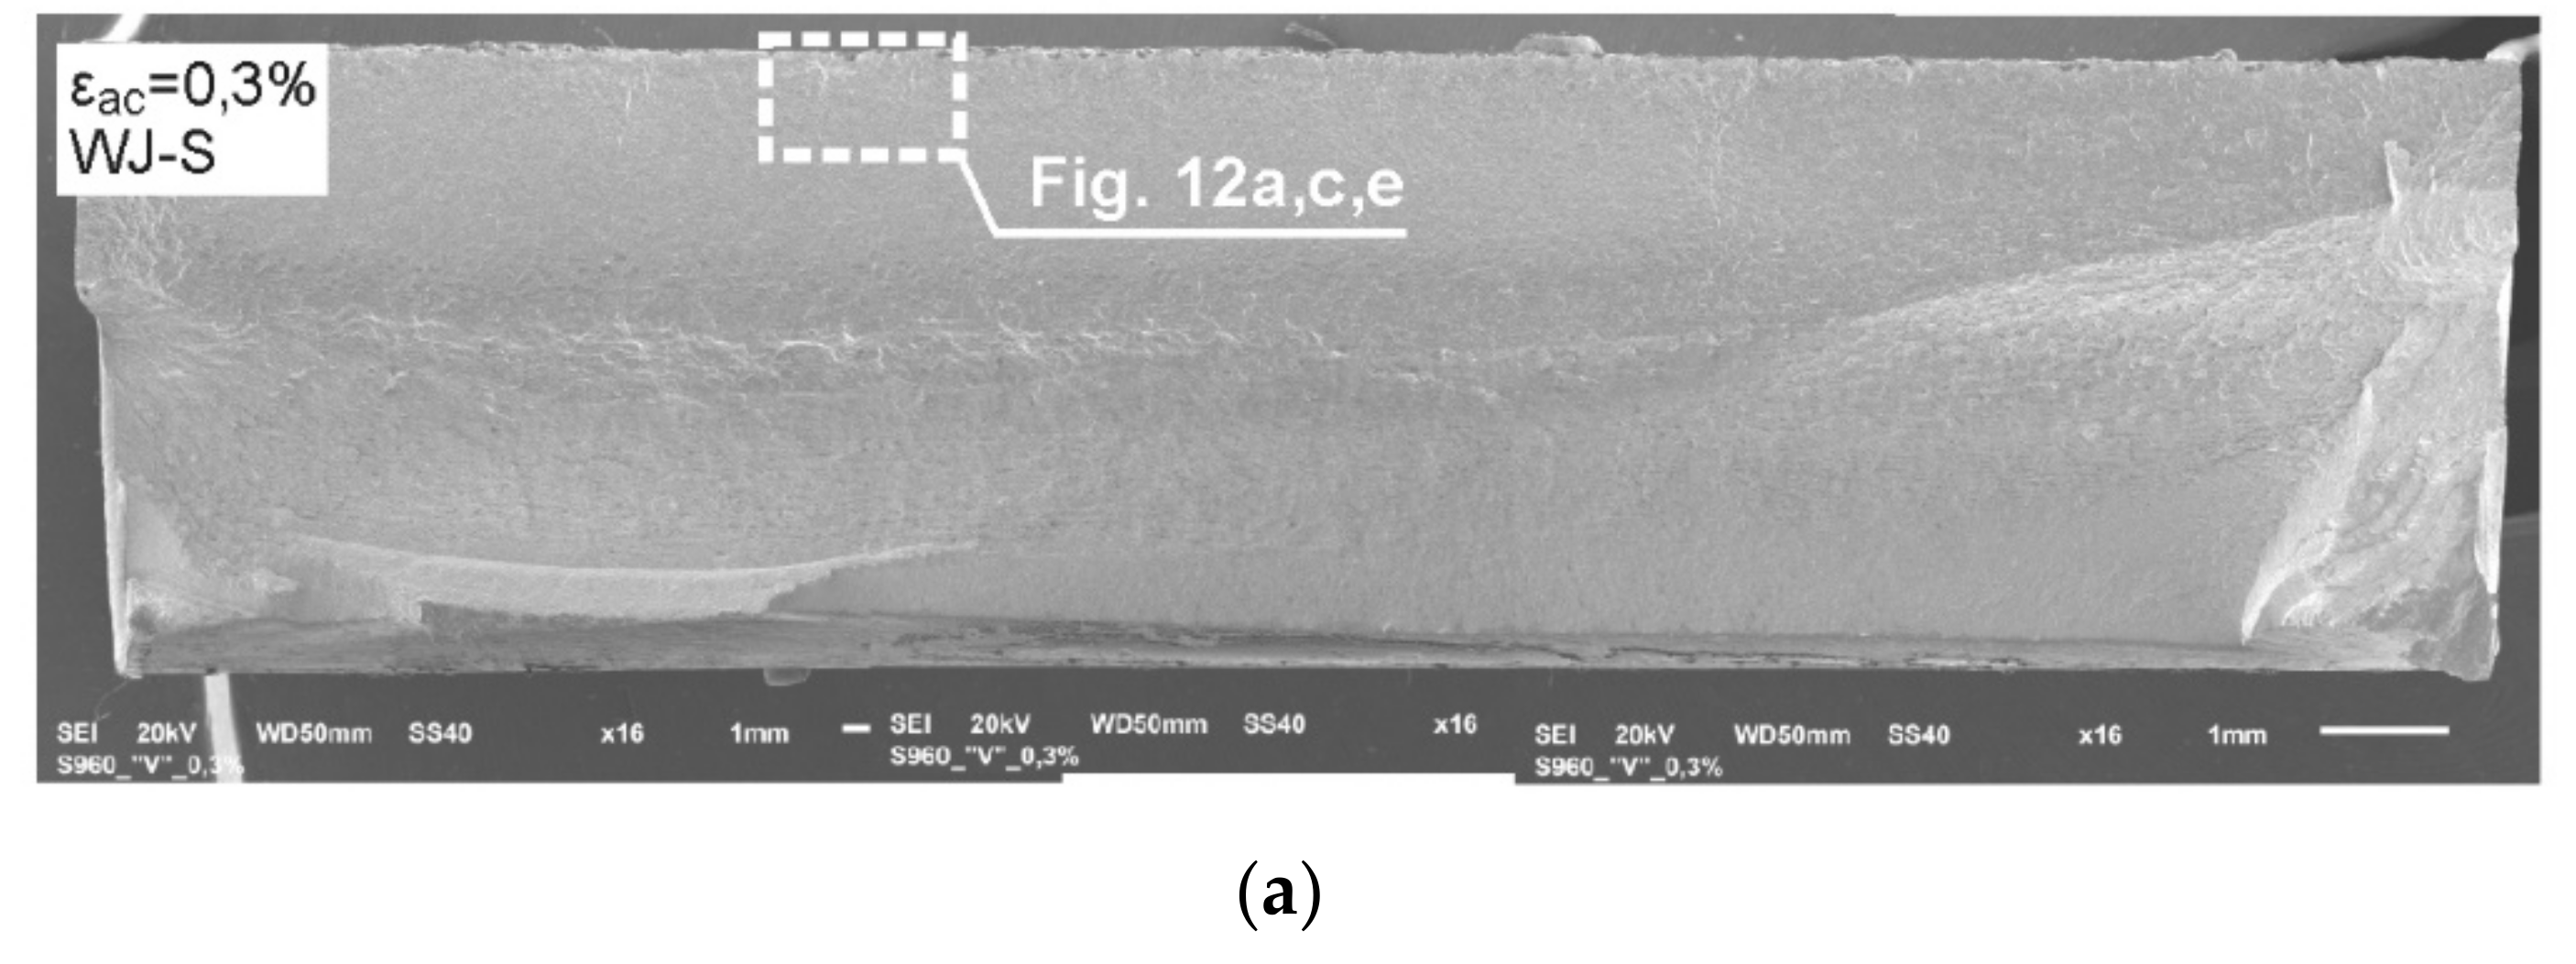
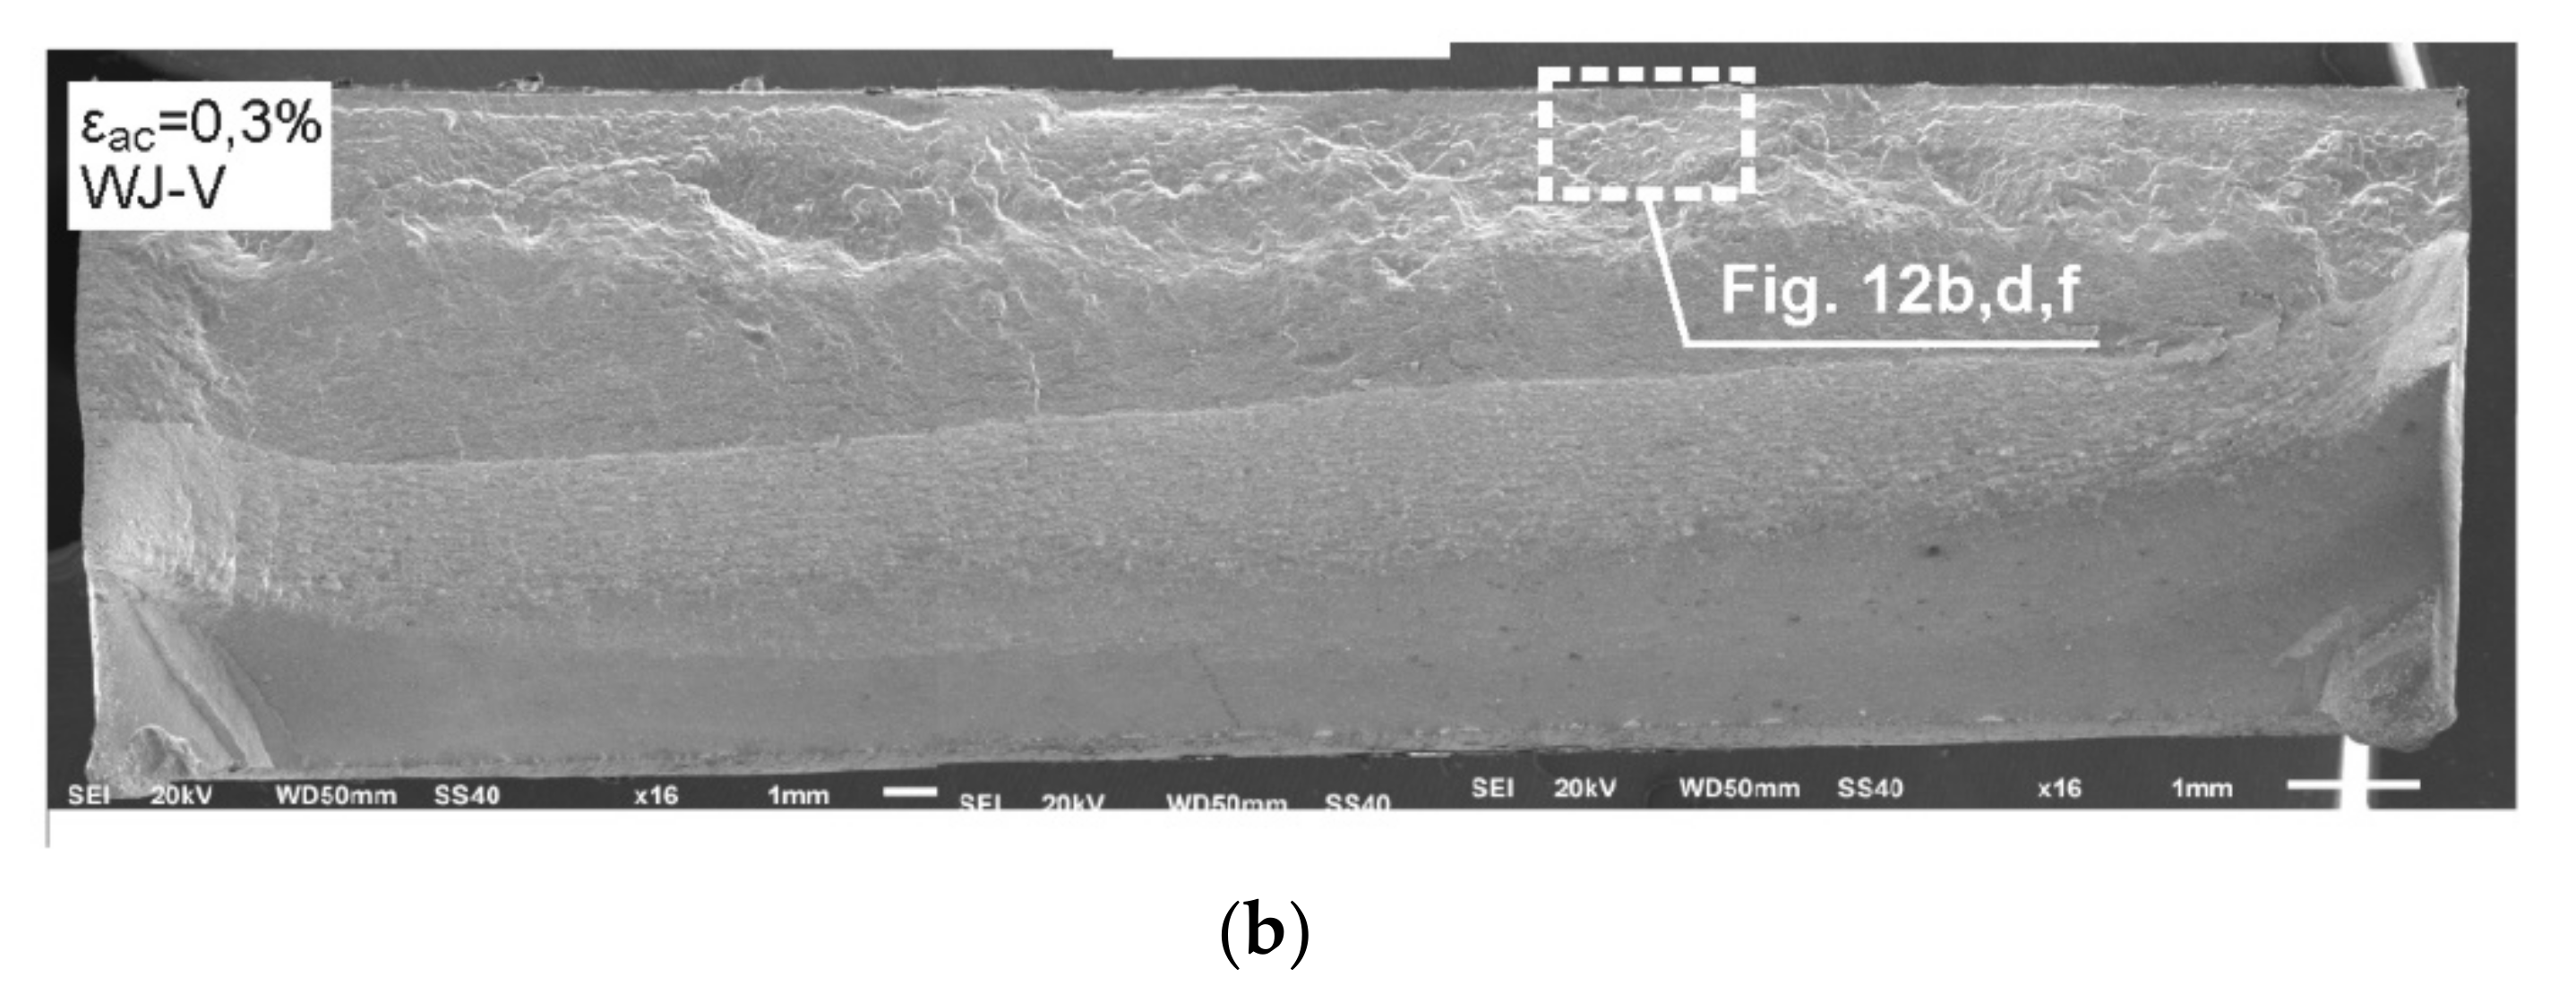
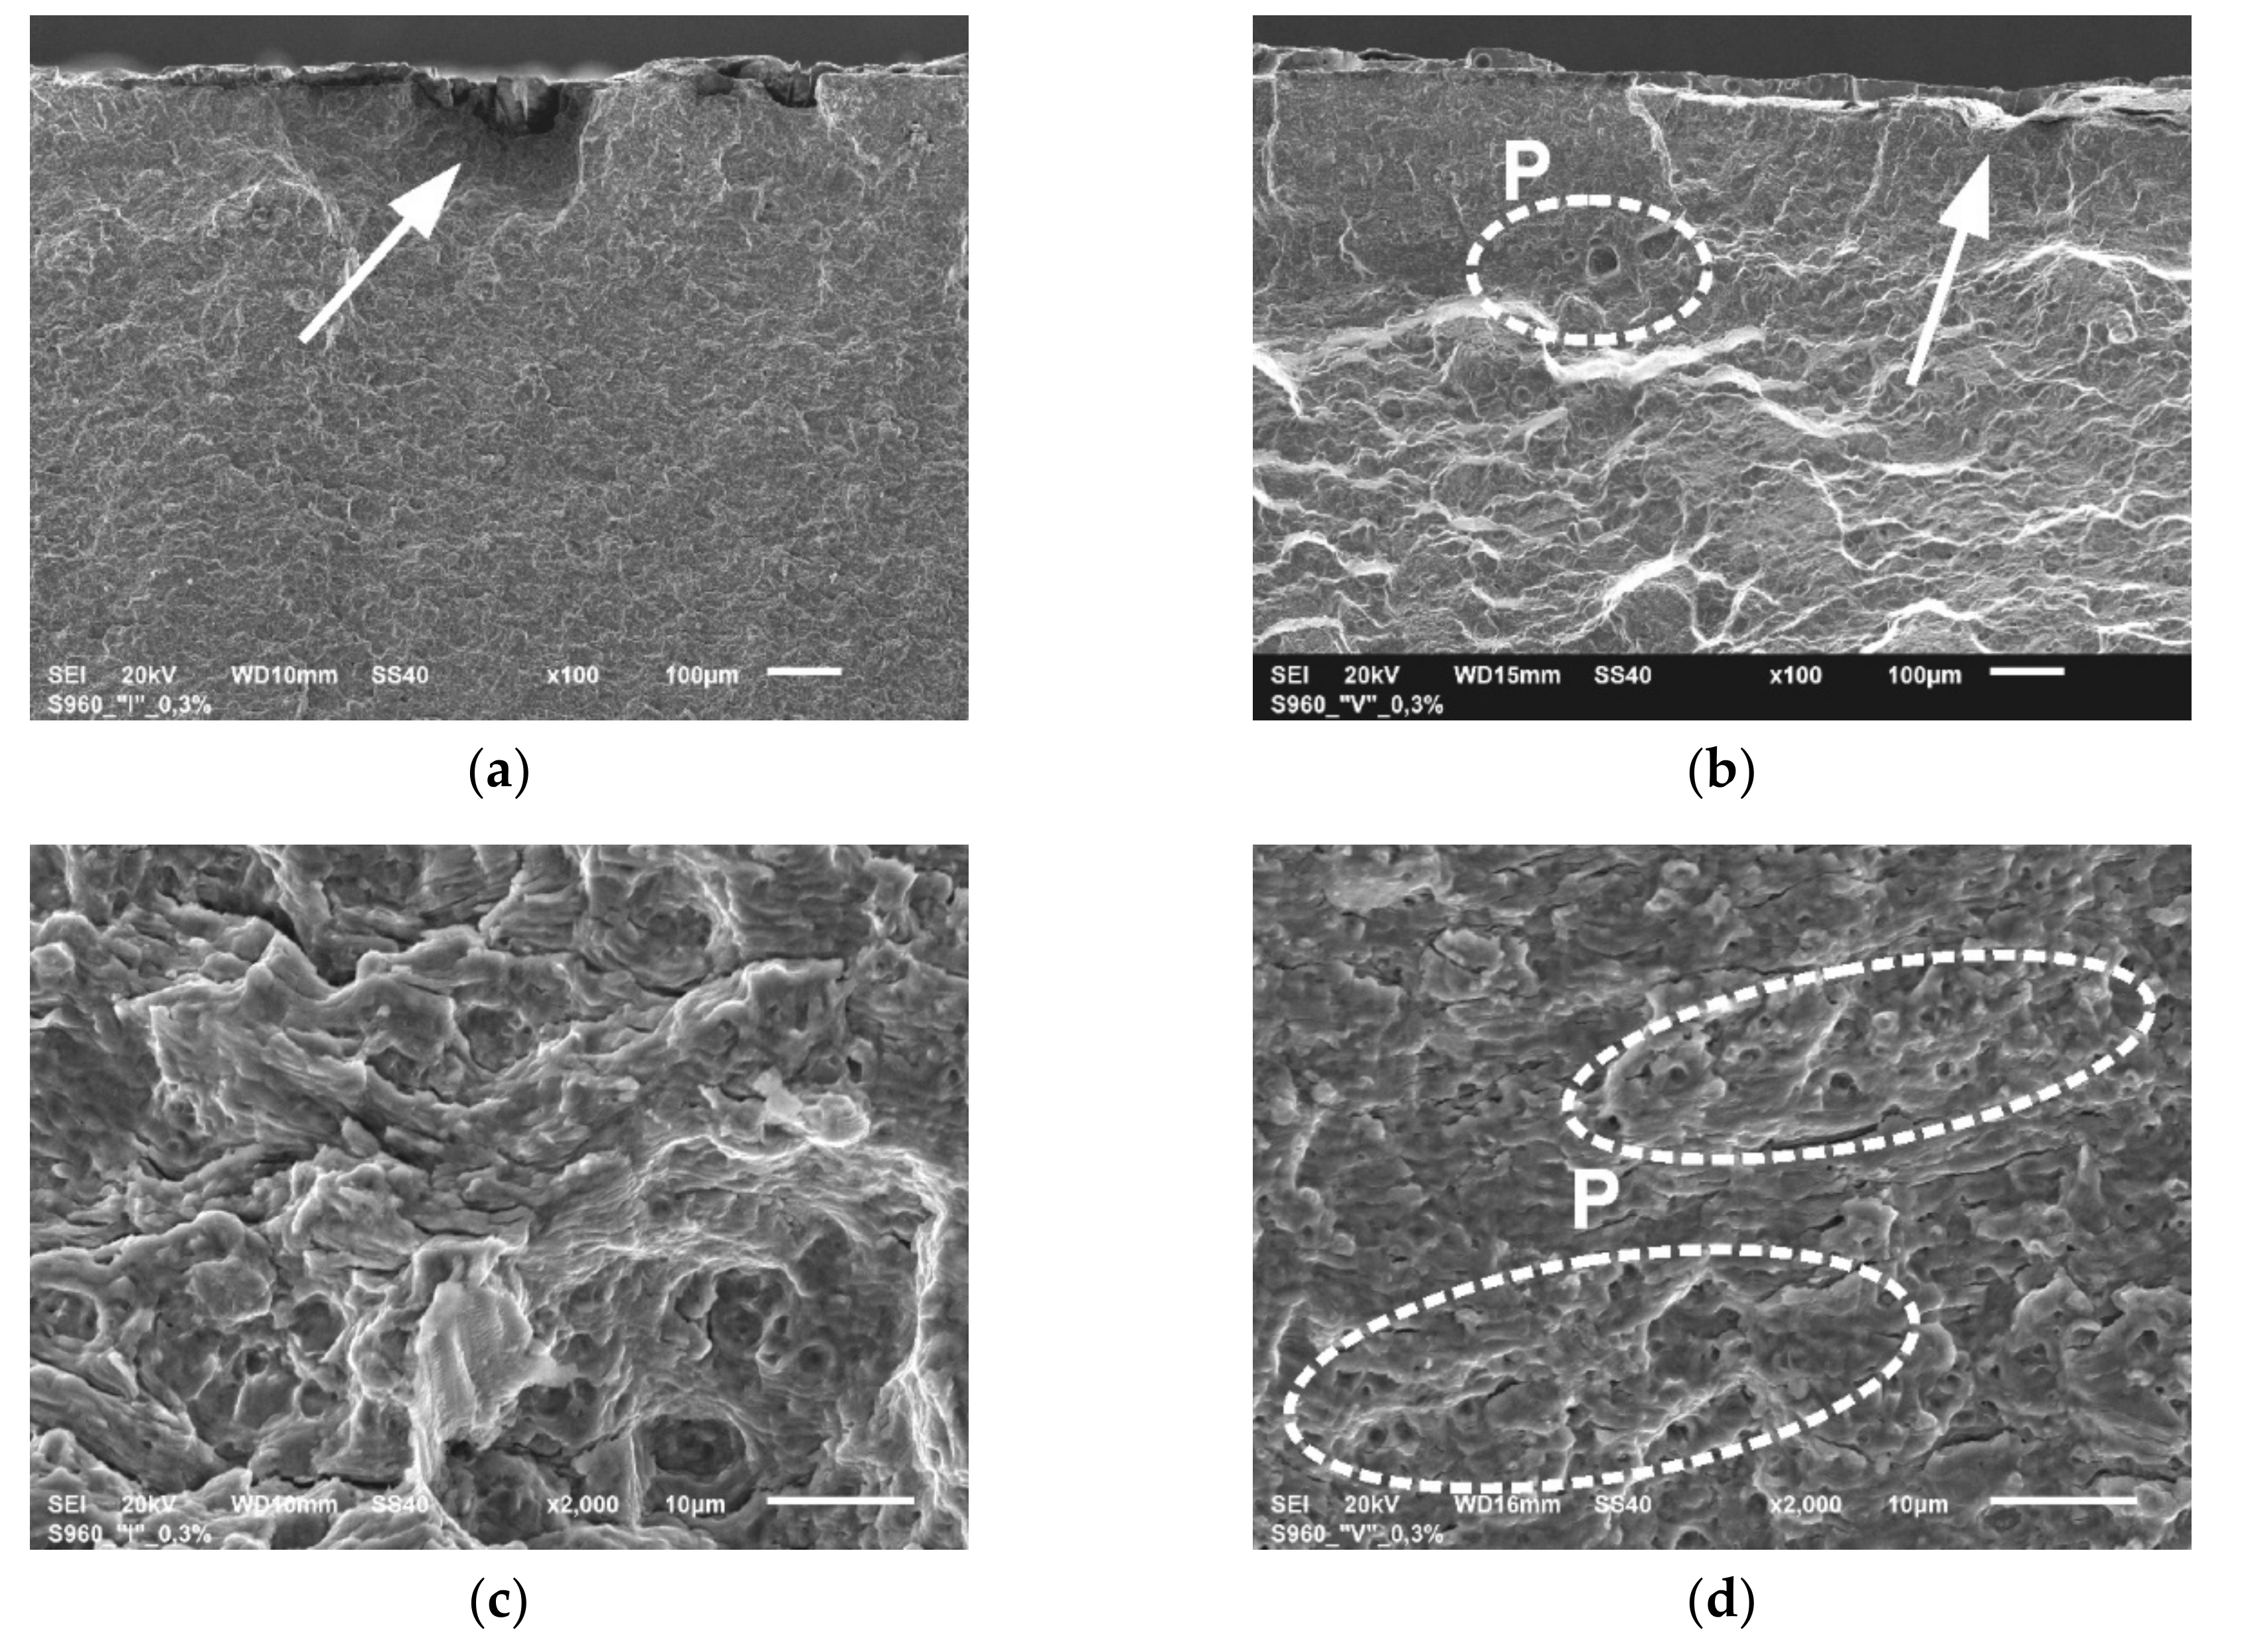
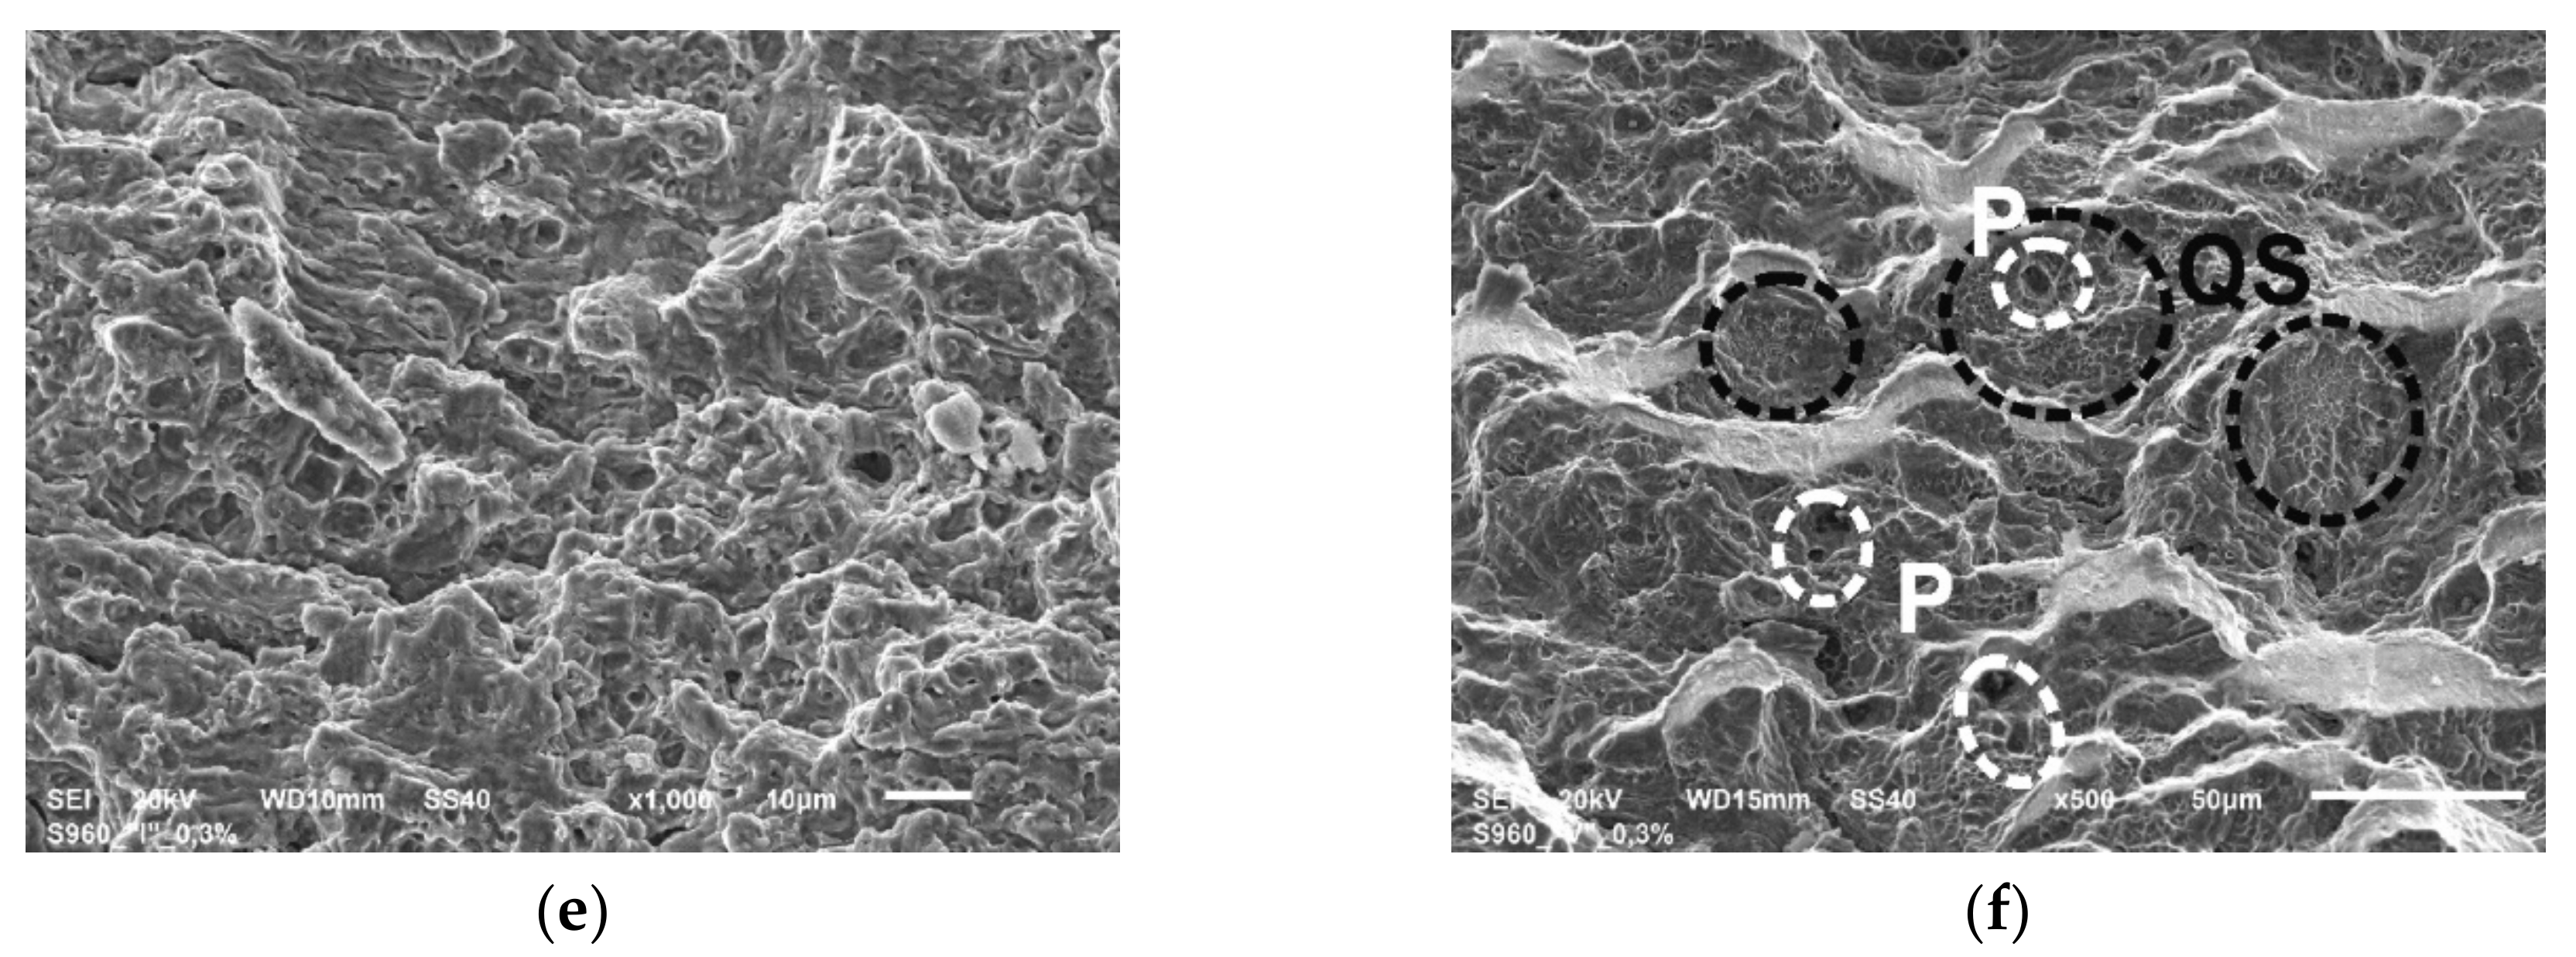
3.4. Fractographic Analysis of Fatigue Fractures

The results of the observation of fatigue fracture surfaces of the tested samples, both PM and WJ, are presented. Representative photos of PM fractures were taken on the samples tested at the load εac of 0.4% and 0.75% (Figure 9 and Figure 10). The fractographic analysis of fatigue fractures of the welded joints WJ-S and WJ-V was carried out on the samples loaded with an amplitude εac = 0.3% (shown in Figure 11 and Figure 12).
Envelopes marked in Figure 9 and named FAT indicate the areas of fatigue cracking. Both surfaces presented in Figure 9 are characterized by a very diverse morphology and system of numerous origins of fatigue cracking. A greater number of origins have occurred in the samples tested at lower value of εac (one origin was also created at the opposite surface of the sample—Figure 9a). This is associated with inhibition of subsequent crack initiation due to the rapid growth of cracks that had appeared first. The structure of the presented fractures indicates the high crack propagation rate and is characterized by numerous offsets. In the case of lower loads development of cracking is more gentle (Figure 9a).
The photographs in Figure 10a,b show the site of fatigue crack initiation, while in Figure 10c,d the areas of the stable crack growth in a distance of about 0.1 mm from the initiators.
The initiation of fatigue cracks proceeded in local concentration of stress within the hard and brittle rolled-in scale particles on the surface of the material, what is indicated by arrows in Figure 10a,b. The ductile character of cracking is preserved in the initial stage of cracking as well as during stable growth. The most visible differences in the images of the fracture surface are the squashed areas in the sample tested at 0.75% resulting from the presence of large surface strains in the compression phase of the load. In both presented cases, cracking is accompanied by numerous secondary cracks (SC)—Figure 10c,d. Moreover, at high strains SC cracks run mainly along the grain boundaries (GB) as marked in Figure 10d. Frequently occurring fatigue striations (FS) were also discovered, nevertheless in many cases they have been crushed (Figure 10d).
The fractographic analysis of the fatigue fractures tested welded joints WJ-S and WJ-V was begun from the evaluation of panoramic photos (Figure 11). The details of analyzed surfaces are shown in Figure 12.
Fractures shown in Figure 11 display a varied course of cracking. A more rapid course of cracking with complex morphology was observed in the case of the single-V joint (Figure 11b) contrary to the square joint where the crack propagation is more gentle (Figure 11a). There were no dominating origins of fatigue cracks. Initiation in both cases occurred over the entire length of the fusion line (in WJ-V only from the side of the root), hence generating a uniform cracking front already at an early stage. There were also minor, local offsets connecting the developing local cracks.
The photographs of the fracture areas shown in Figure 12 indicate also the regions of fatigue crack initiation (Figure 12a,b), the areas of the initial crack growth in a distance of about 0.15 mm from the sample surface (Figure 12c,d) and the areas of rapid crack growth in a distance of approximately 0.4 mm from the surface (Figure 12e,f) for samples WJ-S and WJ-V, respectively.
The mechanism of crack initiation in both cases is a little different. In the WJ-S the direct initiators are very small particles of mill scale (Figure 12a), while in WJ-V initiation is related to the discontinuity of the fusion line in the weld root, which was made manually. Furthermore, the occurrence of gas bubbles and numerous micropores (P) was found in the single-V joint (Figure 12b,d) affecting the crack propagation rate. Both at the initial stage of development of fatigue cracks (Figure 12c,d) as well as a further stage (Figure 12e,f) the ductile nature of cracking is preserved, what is evidenced by the structure of fractures presented with recognizable fatigue striations. The course of cracking in WJ-V at later stage is more rapid than in the WJ-S probably because it runs along the border of the weld and the HAZ. This is evidenced by the microstructure of the surface shown in Figure 12f with a varied topography and frequently occurring areas of quasi-static cracks (QS).

4. Discussion

The courses of microhardness values (Figure 6 and Figure 7) verify that zones of significantly increased hardness on the fusion line are present in both types of welded joints. It is worth stressing the favorable distribution of hardness in the case of WJ-S joints. It is characterized by a smaller gradient, a lower maximum value of micro-hardness in the area of the fusion line (approx. 445 HV0.1) and lower hardness of the weld itself. This is probably due to the fact that a larger quantity of heat was introduced in the first run, which led to a higher interpass temperature and consequently contributed to a reduction in the cooling rate. The greater gradient and higher values of hardness were measured in WJ-V weld which comparing with generally known fact indicate an increase in material strength, while local decreasing ductility and cracking resistance.
Residual stresses which arise in welded joint and their vicinity as a consequence of thermal strains caused during heating/cooling cycles, also effected the fatigue behavior of welded structures. The results of conducted measurements (Figure 8) show their not entirely positive influence, with the highest magnitude (red region) occurring in the vicinity of the fusion line. The local orientation of the principal stress vector in this region has negative influence on the fatigue life, because one of the component coincides with the direction of the stress resulted from external applied load. It results directly from the sum of post-welded residual stresses and stresses induced by external load.
LCF fatigue tests conducted in strain mode have allowed for the assessment of fatigue behavior of examined HSS S960QL steel and its welded joints. Moreover, it was possible to observe the influence on fatigue life due to weld type and automation of welding process while maintaining the same other welding conditions. The courses of plastic strains curves (Figure 3c, Figure 4a,b) state that this component of strain is substantially higher in WJ compared to PM. Additionally the plastic strains are slightly higher in WJ-V joint in comparison with WJ-S. The obtained results indicate slightly better fatigue properties of welded joints made of S960QL steel using WJ-S joints. It was observed that their fatigue life is on average higher by 20–50% than the fatigue life of WJ-V. Fatigue properties describing the elastic component (σ’f and b) are very similar in both types of welded joints, while those describing the plastic component (ε’f and c) how significant differences. This demonstrates similar fatigue characteristics in conditions of stress component dominance, i.e., at lower loads, and at the same time a higher fatigue life. A different character of fatigue occurs under significant influence of plastic component.
The fractographic investigation of fatigue fracture has revealed the mechanism of crack initiation, localization of the origins and the differences between concerned cases. In paternal material (PM) the initiators of fatigue cracks have occurred in the immediate vicinity of the brittle particles of mill scale rolled-in on the surface of material (Figure 10). They became notches inducing stress concentration caused by local permanent plastic strains, already at the production phase. Fractographic investigation of the fractures of welded joints has shown the absence of clear origins of fatigue cracking. Initiation occurred over the entire length of the fusion line, whereas in WJ-V initiation followed always on the side of the root (Figure 11b). It was caused by the presence of welding imperfections induced during manual welding of first pass from the root side. The structure of fracture surface exhibits the characteristics of ductile cracking, and faster development of cracks in the WJ-V resulted from the presence of gas bubbles and micro-pores. In WJ-S crack propagation is more stable which proves that mechanized welding allows to achieve much better quality of welds and improve fatigue behavior already at stage of execution of welding.
Summarizing the above discussion, we can state that the fatigue life of high strength steels can be extended by reducing the presence of crack initiators introduced during production process. It was disclosed that fully mechanized welding in the case of considered steel grade produces better results than partly mechanized thus it should point toward to introduce mechanized welding as widely as possible. Additionally, square welded joints show better properties than single-V joints what influence the fatigue properties.

5. Conclusions

The paper presents the results of fatigue tests of S960QL steel and its welded joints supplemented by the measurement of residual stresses in the cross-section of the weld, hardness measurements and fractographic examination of fatigue fractures. The analysis of the results leads to the following conclusions:
  • Increased resistance to fatigue cracks initiation of structural HSS steel is mishandled due to the presence of induced crack initiators in a form of rolled-in mill scale. Therefore fatigue behavior of S960QL steel in delivery state can be improved by refinement the production processes influencing the quality of surface.
  • Concerning the microhardness distribution in examined welded joints, the square joints show more favorable courses than single-V. The maximum value of HV0.1 in HAZ is clearly lower what influence the ductility of this zone and their fatigue properties, especially crack resistance.
  • In the low cycle fatigue regime, square joints show a higher fatigue life in comparison with single-V. The superior fatigue life corresponds to a more favorable microhardness distribution and less number of welding imperfections. Conducted fractographic investigation has revealed that the origins of crack initiation were the surface imperfections from the root side and the presence of gas pores additionally increase a cracking rate.
  • Higher quality of square joints was caused primarily by fully-mechanized execution of welds in contrast to the second type of considered joint. Reduction of imperfections amount and its magnitude is especially important in high strength steels sensitive to notches.

Funding

This research was funded by Faculty of Mechanical Engineering, Military University of Technology, Warsaw, internal grant number RMN 08-878 aimed to support scientific development of young scientists. The APC was funded by Faculty of Mechanical Engineering, Military University of Technology, Warsaw.

Acknowledgments

The author is grateful to Lucjan Śnieżek for advice and guidance during planning and realization of final research program and also to Janusz Torzewski, who have supported the technical realization of LCF tests.

Conflicts of Interest

The author declares no conflict of interest.

References

  1. Kocanda, D.; Hutsaylyuk, V.; Slezak, T.; Torzewski, J.; Nykyforchyn, H.; Kyryliv, V. Fatigue crack growth rates of S235 and S355 steels after friction stir processing. Mater. Sci. Forum 2012, 726, 203–210. [Google Scholar] [CrossRef]
  2. Weglowski, M.S.; Kopyscianski, M.; Dymek, S. Friction stir processing multi-run modification of cast aluminum alloy. Key Eng. Mat. 2014, 611–612, 1595–1600. [Google Scholar] [CrossRef]
  3. Zasimchuk, E.; Markashova, L.; Baskova, O.; Turchak, T.; Chausov, N.; Hutsaylyuk, V.; Berezin, V. Influence of Combined Loading on Microstructure and Properties of Aluminum Alloy 2024-T3. J. Mater. Eng. Perform. 2013, 22, 3421–3429. [Google Scholar] [CrossRef]
  4. Ray, P.K.; Ganguly, R.I.; Panda, A.K. Optimization of mechanical properties of an HSLA-100 steel through control of heat treatment variables. Mat. Sci. Eng. A 2003, 346, 122–131. [Google Scholar] [CrossRef]
  5. Show, B.K.; Veerababu, R.; Balamuralikrishnan, R.; Malakondaiah, G. Effect of vanadium and titanium modification on the microstructure and mechanical properties of a microalloyed HSLA steel. Mat. Sci. Eng. A 2010, 527, 1595–1604. [Google Scholar] [CrossRef]
  6. Hildebrand, J.; Werner, F. Change of structural condition of welded joints between high-strength fine-grained steels and structural steels. J. Civ. Eng. Manag. 2004, X, 87–95. [Google Scholar] [CrossRef]
  7. Günther, H.P. Use and Application of High-Performance Steels for Steel Structures (Structural Engineering Documents 8); IABSE: Zurich, Switzerland, 2005. [Google Scholar]
  8. Muller, T.; Straetmans, B. High strength seamless tubes and steel hollow sections for cranes and machine building applications—Production and properties. Stahlbau 2015, 84, 650–654. [Google Scholar] [CrossRef]
  9. High-Strength and Ultra-High-Strength Heavy Plates. Available online: https://www.voestalpine.com/alform/en/content/download/4494/file/voestalpine_heavy_plate_TTD_ALFORM_620-1100_E_0319.pdf (accessed on 12 December 2019).
  10. Gogou, E. Use of High Strength Steel Grades for Economical Bridge Design. Master’s Thesis, Delft University of Technology, Delft, The Netherlands, April 2012. Available online: https://www.scia.net/sites/default/files/thesis/reportgogou.pdf (accessed on 12 December 2019).
  11. Mosty. Available online: http://www.obrum.gliwice.pl/mosty (accessed on 12 December 2019).
  12. Lachowicz, M.; Nosko, W. Welding of Structural Steel Weldox 700. Prz. Spaw. 2010, 1, 13–18. (In Polish) [Google Scholar]
  13. Bjorhovde, R. Performance and Design Issues for High Strength Steel in Structures. Adv. Struct. Eng. 2010, 13, 403–411. [Google Scholar] [CrossRef]
  14. Shi, G.; Hu, F.; Shi, Y. Recent research advances of high strength steel structures and codification of design specification in China. Int. J. Steel Struct. 2014, 14, 873–887. [Google Scholar] [CrossRef]
  15. Björklund, O.; Larsson, R.; Nilsson, L. Failure of high strength steel sheets: Experiments and modelling. J. Mater. Process. Technol. 2013, 213, 1103–1117. [Google Scholar] [CrossRef] [Green Version]
  16. Branco, R.; Berto, F. Mechanical Behavior of High-Strength, Low-Alloy Steels. Metals 2018, 8, 610. [Google Scholar] [CrossRef] [Green Version]
  17. Wei, D.Y.; Gu, J.L.; Fang, H.S.; Bai, B.Z.; Yang, Z.G. Fatigue behavior of 1500 MPa bainite/martensite duplex-phase high strength steel. Int. J. Fatigue 2004, 26, 437–442. [Google Scholar] [CrossRef]
  18. Neimitz, A. Ductile Fracture Mechanisms in the High-strength Steel Hardox-400. Microscopic Observations and Numerical Stress-strain Analysis. Procedia Mater. Sci. 2014, 3, 270–275. [Google Scholar] [CrossRef] [Green Version]
  19. Simunek, D.; Leitner, M.; Grün, F. In-situ crack propagation measurement of high-strength steels including overload effects. Procedia Eng. 2018, 213, 335–345. [Google Scholar] [CrossRef]
  20. Dunder, M.; Vuherer, T.; Samardzic, I. Weldability of microalloyed high strength steels TStE 420 and S960QL. Metalurgija 2014, 53, 335–338. [Google Scholar]
  21. Gałkiewicz, J. Simulation of Tensile Test of The 1/2Y Welded Joint Made of Ultra-High Strength Steel. Mater. Sci. Forum 2012, 726, 110–117. [Google Scholar] [CrossRef]
  22. Slezak, T.; Sniezek, L. Fatigue Properties and Cracking of High Strength Steel S1100QL Welded Joints. Key Eng. Mat. 2014, 598, 237–242. [Google Scholar] [CrossRef]
  23. Sołtysiak, R. Effect of Laser Welding Parameters of DUPLEX 2205 Steel Welds on Fatigue Life. Solid State Phenom. 2014, 223, 11–18. [Google Scholar] [CrossRef]
  24. Ślęzak, T.; Śnieżek, L. A Comparative LCF Study of S960QL High Strength Steel and S355J2 Mild Steel. Procedia Eng. 2015, 114, 78–85. [Google Scholar] [CrossRef] [Green Version]
  25. Ślęzak, T. Prediction of Fatigue Life of Welded Joints Made of Fine-Grained Martensite-Bainitic S960QL Steel and Determination of Crack Origins. Adv. Mater. Sci. Eng. 2019, 201, 9520801. [Google Scholar] [CrossRef] [Green Version]
  26. Lan, X.; Chan, T.-M. Recent research advances of high strength steel welded hollow section joints. Structures 2019, 17, 58–65. [Google Scholar] [CrossRef]
  27. Berdnikova, O.; Pozniakov, V.; Bernatskyi, A.; Alekseienko, T.; Sydorets, V. Effect of the structure on the mechanical properties and cracking resistance of welded joints of low-alloyed high-strength steels. Procedia Struct. Integr. 2019, 16, 89–96. [Google Scholar] [CrossRef]
  28. Ilić, A.; Ivanović, L.; Lazić, V.; Josifović, D. Welding method as influential factor of mechanical properties at high-strength low-alloyed steels. IOP Conf. Ser. Mater. Sci. Eng. 2019, 659, 012036. [Google Scholar] [CrossRef]
  29. Lahtinen, T.; Vilaça, P.; Peura, P.; Mehtonen, S. MAG Welding Tests of Modern High Strength Steels with Minimum Yield Strength of 700 MPa. Appl. Sci. 2019, 9, 1031. [Google Scholar] [CrossRef] [Green Version]
  30. Vimalraj, C.; Kah, P.; Layus, P.; Belinga, E.M.; Parshin, S. High-strength steel S960QC welded with rare earth nanoparticle coated filler wire. Int. J. Adv. Manuf. Technol. 2019, 102, 105–119. [Google Scholar] [CrossRef] [Green Version]
  31. ISO 6892-1. Metallic Materials—Tensile Testing—Part 1: Method of Test at Room Temperature; ISO: Geneva, Switzerland, 2019. [Google Scholar]
  32. SuperElso®960. A High Yield Strength Steel for Welded and Weight-Saving Structures. ArcelorMittal—Industeel. Available online: http://www.solid.cl (accessed on 3 July 2012).
  33. Ślęzak, T. Characteristics of MAG Welded Joints Made in Fine-Grained High-Strength Steel S960QL. Inst. Weld. Bull. 2018, 62, 45–53. [Google Scholar] [CrossRef] [Green Version]
  34. ASTM E606-04. Standard Practice for Strain-Controlled Fatigue Testing; ASTM: Philadelphia, PA, USA, 2005. [Google Scholar]
Figure 1. The microstructure of S960QL steel shown at two different magnifications: (a) view of fine grained structure; (b) selected grains with bainitic structure.
Metals 10 00228 g001
Figure 2. The dimensions of samples used during LCF tests of: (a) paternal material; (b) welded joints.
Metals 10 00228 g002
Figure 3. The results of LCF tests recorded for PM as the courses of: (a) maximum stress σmax; (b) stress amplitude σa; (c) amplitude of plastic strain component εap.
Metals 10 00228 g003
Figure 4. The results of LCF tests recorded for WJ as the courses of: (a) εap recorded for WJ-S; (b) εap recorded for WJ-V; (c) σmax recorded for WJ-S; (d) σmax recorded for WJ-V.
Metals 10 00228 g004
Figure 5. The strain-life curves obtained for PM and their welded joints: WJ-V and WJ-S.
Metals 10 00228 g005
Figure 6. Distribution of micro-hardness measured in the WJ-S joint on: (a) the side of first welding run; (b) the side of second welding run.
Metals 10 00228 g006
Figure 7. Distribution of micro-hardness measured in the WJ-V joint on: (a) root side; (b) face side.
Metals 10 00228 g007
Figure 8. Residual stresses in WJ-S joint cross section in the form of projections of the principal stress vector in two directions: (a) vertical; (b) horizontal. The fusion lines are located by dashed lines.
Metals 10 00228 g008
Figure 9. The fatigue fractures of PM tested at load εac: (a) 0.4%; (b) 0.75%.
Metals 10 00228 g009
Figure 10. The details of fatigue fractures: (a) the origins in sample tested at εac = 0.4%; (b) the origin in sample tested at εac = 0.75%; (c) the stage of stable crack growth in sample tested at εac = 0.4%; (d) the stage of stable crack growth in sample tested at εac = 0.75%.
Metals 10 00228 g010
Figure 11. The panoramic photographs of fatigue fractures of the welded samples tested at εac = 0.3%: (a) WJ-S joint; (b) WJ-V joint.
Metals 10 00228 g011aMetals 10 00228 g011b
Figure 12. The details of fatigue fractures of WJ tested at εac = 0.3%: (a) the region of initiation in sample WJ-S; (b) the region of initiation in sample WJ-V; (c) the stage of stable crack growth in sample WJ-S; (d) the stage of stable crack growth in sample WJ-V; (e) the stage of rapid crack growth in sample WJ-S; (f) the stage of rapid crack growth in sample WJ-V.
Metals 10 00228 g012aMetals 10 00228 g012b
Table 1. Chemical composition of used steel S960QL; wt [%].
CSiMnCrMoNiAlVCuTiNbB
Measurement0.180.361.190.230.660.0520.110.0320.190.0120.0020.0028
Certificate0.180.281.130.220.670.0770.080.0270.180.004n.d.n.d.
n.d.—not detected.
Table 2. Mechanical properties of used steel S960QL.
E [MPa]σY [MPa]σU [MPa]EL 1 [%]RA 2 [%]
Measurement2.2 × 105974107014.245.6
Certificate-997106913.0-
1 EL—elongation; 2 RA—reduction of area.
Table 3. Fatigue properties of examined HSS steel and two types of welded joints.
σ’f [MPa]b [-]ε’f [-]c [-]
PM1976−0.1070.542−0.782
R2 = 0.998R2 = 0.991
WJ-V4326−0.2630.264−1.073
R2 = 0.979R2 = 0.992
WJ-S4150−0.2674.408−1.523
R2 = 0.950R2 = 0.999

