Abstract
The preparation of a low-cost cellulose-based bioadsorbent from cellulosic material extracted from rose stems (CRS) was carried out; rose stems are considered agricultural waste. After the required pretreatment of this waste and further treatment with an acidic mixture of acetic and nitric acids, the CRS product was produced. The resulting bioadsorbent was characterized by several techniques, such as X-ray diffraction, which revealed diffraction maxima related to the cellulose structure, whose calculated crystallinity index (CrI) was 75%. In addition, Fourier Transform Infrared spectroscopy (FTIR), 13C Nuclear Magnetic Resonance (NMR), and X-ray Photoelectron Spectroscopy (XPS) showed signs of acetylation of the sample. The thermal properties of the solid were also evaluated through Thermogravimetric Analysis (TGA). Scanning Electron Microscopy (SEM) showed cellulose fibers before and after the adsorption process, and some particles with irregular shapes were also observed. The CRS bioadsorbent was used for the effective adsorption of valuable Tb(III) from an aqueous solution. The adsorption data showed a good fit to the Freundlich isotherm and pseudo-second-order kinetic models; however, chemisorption was not ruled out. Finally, desorption experiments revealed the recovery of terbium ions with an efficiency of 97% from the terbium-loaded bioadsorbent.
1. Introduction
Seventeen metals are considered rare earth elements (REEs), all presenting similar chemical characteristics that make them key components in the development of smart technologies and associated products. Due to these similarities, it is difficult to separate these elements. As China is the main producer of these REEs and also the country with almost all REE reserves, there is great concern among Western countries about the availability of these strategic elements, especially considering that China is cutting their exports of these elements. All of the above factors led the EU to consider these elements to be of the utmost necessity, increasing the demand for their recycling from different sources, which is currently known as urban mining.
After leaching, these REEs are recovered from the solutions via different separation technologies, including precipitation, liquid–liquid extraction, ion exchange resins, etc. Adsorption is one of the most popular methods [1,2], due to its ease of use, ability to treat dilute-metal solutions and/or unclarified solutions, etc. Moreover, there are several potential adsorbents; some of them produced at a cheap rate and from secondary wastes that can eliminate the dumping associated with these wastes and acquire further profit from them.
Some adsorbents associated with the recovery of terbium from solutions include 1-(2-pyridylazo)-2-naphthol (PAN) doped hybrid silica [3], nanoporous calcium alginate/carboxymethyl chitosan microbiocomposite powder containing Ni0.2Zn0.2Fe2.6O4 magnetic nanoparticles [4,5], magnetic CMC bionanocomposite containing a novel biodegradable nanoporous polyamide [6], lignocellulosic biomass [7], calcium alginate/poly(pyrimidine-thiophene-amide) [8], graphite nanoplatelets/magnetite [9], hydroxyapatite/NiFe2O4 composite [10], torrefied poplar-biomass [11], and nZVI-montmorillonite [12].
As mentioned above, one of the features of adsorption processes is the potential use of a variety of adsorbents for any particular role. One type of adsorbent is the biomass associated with agricultural wastes, which, after a convenient treatment, allows one to harness lignocellulosic material, thereby providing an interesting alternative to waste management because the costs of the raw materials are reduced. To develop biomass-based adsorbents to recover the elements present in aqueous solutions, which represent an ecological and environmentally friendly process, different studies have reported the exploitation of the most abundant natural biopolymer on earth, cellulose [13,14], which, along with lignin and hemicellulose, is found in the cell walls of plants [15]. The cellulose biopolymer consists of D-glucopyranose repeating units linked by β-1,4-glycosidic bonds [16] and is composed of amorphous and crystalline parts, the latter formed due to hydrogen bonds between the hydroxyl groups of the cellulose structure [17]. Different sources have been reported for cellulose extraction, such as wood, rice husks, pineapple leaves, kenaf, cane bagasse, etc. [18,19]; however, cellulose fibers extracted from rose stems have been rarely investigated as potential adsorbents for metals.
The purpose of this work is to synthesize a low-cost cellulose-based bioadsorbent (CRS) from the treatment of rose stems with a mixture of acetic–nitric acids. After characterizing the bioadsorbent with various techniques including XRD, FTIR, TGA, NMR, XPS, and EDS, we investigate the bioadsorbent’s adsorption efficiency against Tb(III), depending on pH, adsorbent dosage, and contact time, by performing a series of batch experiments. Various kinetic and isotherm models are tested for fitting the experimental data. The thermodynamic parameters (ΔS0, ΔG0, and ΔH0) are also estimated to find further characteristics related to the adsorption process. Metal desorption from the Tb(III)-loaded bioadsorbent is also investigated using acidic solutions. To the best of our knowledge, the use of a CRS bioadsorbent has not been investigated for Tb(III) adsorption.
2. Materials and Methods
2.1. From Rose Stems to a CRS Bioadsorbent
Rose stems were used as biomass sources to extract cellulose in this study. Initially, the stems were washed, cut into small pieces, and dried in the oven at 50 °C for 2 days. Then, the stems were ground and sieved to obtain the precursor. Of the different cellulose isolation methods proposed in the literature, the one that involves a mixture of acetic acid and nitric acid has the advantage of being chlorine-free and, therefore, reduces the associated environmental impact, in addition to being a method that can achieve a high degree of delignification and removal of polysaccharides other than cellulose under a one-step protocol [20]. Based on the method in [20], 5 g of the precursor was treated with a mixture of acetic acid/nitric acid (v/v, 10:1) and then mixed with a glass rod. Next, the beaker containing the mixture was placed in a sand bath at a temperature of 110–120 °C for 20 min. the beaker was allowed to cool at room temperature, and then it was filtered and washed with distilled water until reaching a neutral pH. Finally, the solid was dried at 60 °C to obtain the bioadsorbent, which was labeled as CRS.
2.2. Characterization of the Bioadsorbent
X-ray diffraction patterns were determined via a X-ray diffractometer (Rigaku Miniflex 600, Tokyo, Japan) using a monochromatic Cu Kα radiation source (λ = 0.1539 nm) at 40 kV and 20 mA, in a range from 10° to 40°, with a scanning time of 25 min. For the sample preparation, the powder was directly placed on the sample holder. The crystallinity index (CrI, %) was calculated according to the method proposed elsewhere [20] (Equation (1)):
where I002 is the maximum intensity corresponding to the (002) plane, and IAM represents the intensity of the diffraction peak at 2θ = 18° [21]. Thermogravimetric/Differential Thermal Analysis (TG/DTA) thermograms were obtained using a differential thermal analyzer from 20 to 500 °C at a 10 °C/min heating rate. In addition, as an inert medium, helium gas was used, and the reference material was aluminum oxide. Chemical and morphological characterizations were performed via Scanning Electron Microscopy (SEM) and different spectroscopic techniques, such as Fourier Transform Infrared (FTIR), Nuclear Magnetic Resonance (NMR), and X-ray Photoelectron Spectroscopy (XPS) techniques. SEM images were obtained using a JSM 6335F microscope (JEOL Ltd., Concord, MA, USA). For SEM observations, samples were previously placed on an adhesive conductive carbon disk and coated with gold. Energy-dispersive spectroscopy (EDS) analyses were carried out using an Oxford INCA instrument (EDS, Oxford, Concord, MA, USA). FTIR measurements were performed using a Varian 670-IR Spectrometer (Varian Inc., Palo Alto, CA, USA) with 32 scans in the range from 400 to 4000 cm−1 and a resolution of 4 cm−1. Measurements were carried out on pellets formed by a mixture of the ground solid and potassium bromide (KBr). NMR spectra were taken on a BRUKER NMR Spectrometer (Bruker, USA) (400 MHz) using Cross Polarization Magic Angle Spinning (CP-MAS) and High Power 1H Decoupling techniques. XPS measurements were carried out using a Fisons MT500 spectrometer (Fison Instrument, East Grinstead, UK) operating at 300 W equipped with a hemispherical electron analyzer (CLAM2) and a non-monochromatic Mg Kα X-ray source. Spectra were collected at a pass energy of 20 eV (typical for high-resolution conditions). The area under each peak was calculated by fitting the experimental curve to combinations with varying proportions of Lorentzian and Gaussian lines. Binding energies were calibrated to the C1s peak at 285.0 eV. Textural characteristics of the solid was analyzed by the physical adsorption of nitrogen at 77 K using a Micromeritics software (ASAP2020 V03.04, Norcross, GA, USA), and studying the resulting Brunauer–Emmett–Teller (BET) isotherm allowed us to determine the values of parameters such as the specific surface area, pore volume, and pore size.
2.3. Adsorption Experiments
The terbium adsorption by the CRS sample was carried out using batch experiments. Initially, the stock solution of 50 mg/L metal concentration was prepared by dissolving terbium nitrate hexahydrate (Tb(NO3)3·6H2O, Panreac) in MilliQ water. Then, the stock solution was diluted to obtain solutions with a 10 mg/L concentration. Different experiments were carried out in a Selecta Termotronic thermostat-controlled bath equipped with multiple Lab Companion MS-52M stirrers. To determine the adsorption capacity of both samples, different adsorption tests were performed, in which parameters such as contact time, temperature, pH, and amount of adsorbent were varied. Aliquots of 1 mL were collected at the elapsed times and filtered through a filter-provided syringe. The pH of the solutions was adjusted with HCl (0.12 M). Terbium concentrations in the solutions were determined by Inductively Coupled Plasma-Optical Emission Spectrometry (ICP-OES) (Agilent Technologies, Sana Clara, CA, USA) using an Agilent ICP-OES model 5100 VDV, with the associated analytical error being ±2%.
The adsorption capacity (qt (mg/g)) was defined using Equation (2):
where c0 and ct (mg/L) are the initial and elapsed times of the terbium concentrations in the solution, respectively; V (L) is the volume of the solution; and m (g) is the mass of the adsorbent used in each adsorption process.
The adsorption data were analyzed using the linear equations of the Langmuir, Freundlich, and Temkin models [22,23] (Equations (3), (4) and (5), respectively):
where ce (mg/L) represents the concentration of terbium in the solution at equilibrium; qe (mg/g) is the adsorbed terbium amount by mass of the adsorbent; qm (mg/g) is the maximum terbium adsorbed amount by mass of the adsorbent; and b (L/mg) is the Langmuir constant; KF (mg/g)·(L/mg) and n (dimensionless) are the Freundlich constants, which are indicative of the adsorption capacity and adsorption intensity, respectively. AT (L/g) and B (J/mol) are the Temkin isotherm equilibrium binding and Temkin isotherm constants, respectively.
Adsorption kinetics were determined using the pseudo-first [24], pseudo-second [25], Elovich [25], and Bangham [26] models (Equations (6)–(9)):
where k1 (min−1) and k2 (g/min·mg) correspond to the first-order and second-order adsorption constants, respectively, and α and β are related to the rate and activation energy for chemisorption.
To analyze the rate law governing the adsorption process, three different possible adsorption mechanisms were studied [27]: the particle diffusion model (intraparticle or internal diffusion; the diffusion of Tb(III) within the bioadsorbent); the film diffusion model (bulk diffusion and external film diffusion; the diffusion of Tb(III) ions from the aqueous solution to the bioadsorbent surface); and the moving boundary process (Equations (10), (11) and (12) respectively):
where k (min−1) is the corresponding constant, and F (dimensionless) is calculated according to Equation (13):
where [Tb3+]t and [Tb3+]eq (mg/L) represent the concentrations of metal adsorbed after an elapsed time and at equilibrium, respectively.
The activation energy (Ea) was calculated from the Arrhenius equation (Equation (14)):
where R (kJ/mol·K) is the universal gas constant, and T (K) is the absolute temperature.
2.4. Desorption Experiments
Desorption experiments were carried out using filtered solids (designated as CRS-Tb) previously subjected to the adsorption process. The desorption solution (the type of eluent and its concentration) and the ratio of the volume of the solution/CRS-Tb dosage were investigated. CRS-Tb solids were put into contact with different desorption solutions (HCl 0.2 M, HCl 0.5 M, and H2SO4 0.2 M) at different ratios of eluent volume to CRS-Tb dosage (1250, 2500, and 5000 mL/g) at 25 °C for 4 h.
3. Results
3.1. Characterization of the Bioadsorbent
Structural, chemical, and morphological characterizations of the CRS sample were carried out using several techniques.
Some broad diffraction maxima were registered in the XRD patterns of the obtained sample (Figure 1) at 2θ values of 15°, 16°, 22°, and 34° and can be attributed to the crystalline planes (hkl) (101), (10-1), (002), and (040), respectively [21,28,29]. In addition, several bands were observed between ranges of 4000 cm−1 and 500 cm−1 in the FTIR spectrum (Figure 2).
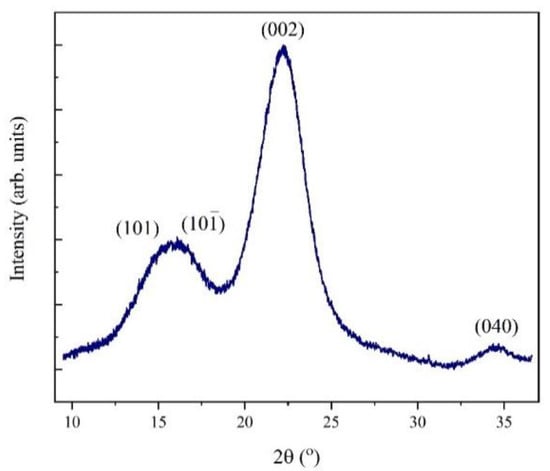
Figure 1.
XRD pattern for the cellulosic material extracted from rose stems (CRS) sample, indicating the different associated crystalline planes.
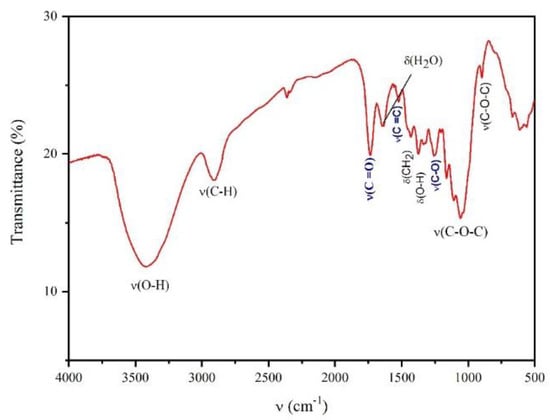
Figure 2.
FTIR spectrum of the CRS sample obtained, indicating the assignment of the different peaks.
To obtain information about the surface features of the adsorbent, the experimental data of textural characterization was fitted using the BET model Figure 3a. At higher relative pressures (p/p0), hysteresis loops were found.
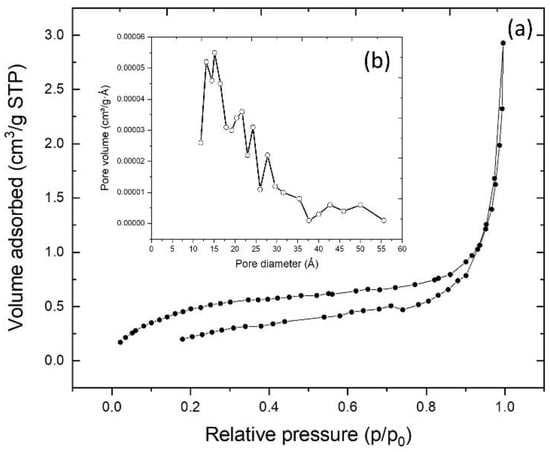
Figure 3.
(a) experimental plot for the adsorption–desorption Brunauer–Emmett–Teller (BET) isotherm obtained for the CRS sample; in the inset (b), the pore size distribution is shown.
A thermogravimetric analysis was carried out to evaluate the thermal stability of the obtained bioadsorbent. Figure 4 shows the TG and DTG curves between 20 °C and 500 °C, where three bands can be observed in the analysis.
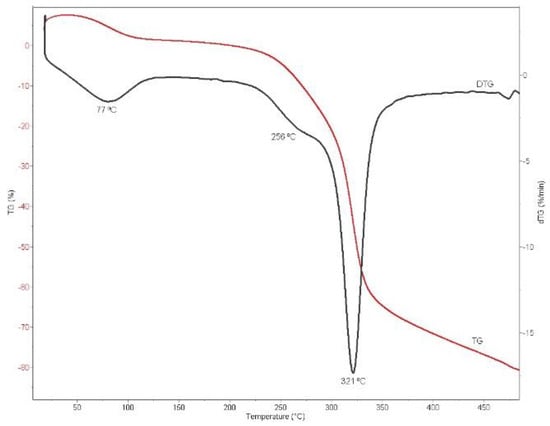
Figure 4.
Differential thermal analysis (DTG) curve obtained for the CRS sample.
13C NMR was also investigated, where several peaks attributed to the cellulose structure were found in the obtained spectrum (Figure 5). The C 1s, O 1s, and N 1s XPS spectra for the obtained sample are shown in Figure 6.

Figure 5.
Cross-Polarization Magic Angle Spinning 13C Nuclear Magnetic Resonance (CP-MAS/13C NMR) spectrum for the CRS sample, indicating the different carbon types present in the CRS structure.
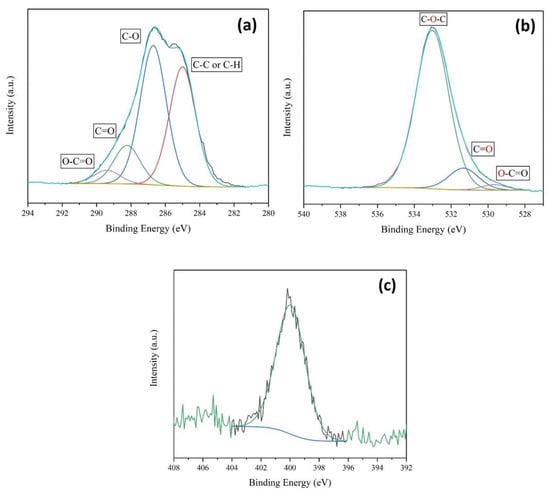
Figure 6.
(a) C1s, (b) O1s, and (c) N1s XPS spectra of the CRS sample, also showing the respective deconvolution curves.
Finally, the bioadsorbent surface before adsorption (CRS) and after terbium adsorption (CRS-Tb) was studied via SEM. Figure 7a,b shows the SEM micrographs of both samples, in which the characteristic fibers of cellulose can be observed; the corresponding EDS spectra are also shown (Figure 7c,d).
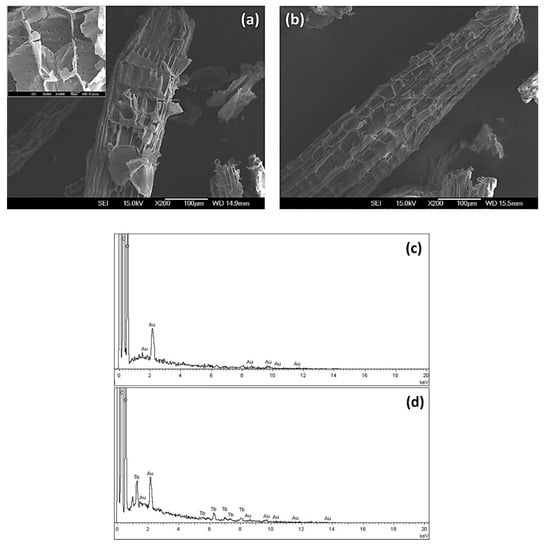
Figure 7.
SEM images of the CRS bioadsorbent (a) before and (b) after terbium adsorption. (c) EDS spectra of the unmodified sample (CRS) and (d) sample after the adsorption of terbium (CRS-Tb).
3.2. Adsorption Experiments
3.2.1. pH Influence
To analyze the influence of the solution pH on Tb(III) adsorption with the prepared bioadsorbent, different experiments were carried out at 25 °C using terbium solutions of 10 mg/L concentration with 500 mg/L of the adsorbent. The evaluation of the effect of pH in the adsorption tests has great importance because pH has an influence not only on the surface charge of the adsorbent but also on the degree of ionization and the kind of species that the adsorbate will form in the solution [30]. However, only Tb3+ exists under acidic and near neutral pH values conditions (Figure 8). Figure 9 shows the adsorption capacity as a function of contact time for the different pH values studied, where an increase in the adsorption capacity was found along with the pH of the solution.
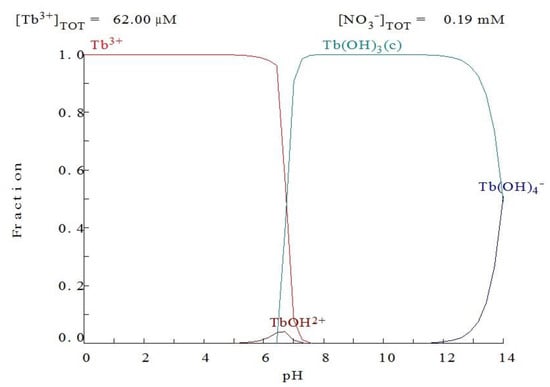
Figure 8.
Terbium(III) speciation as a function of the pH values using the Medusa program [31].
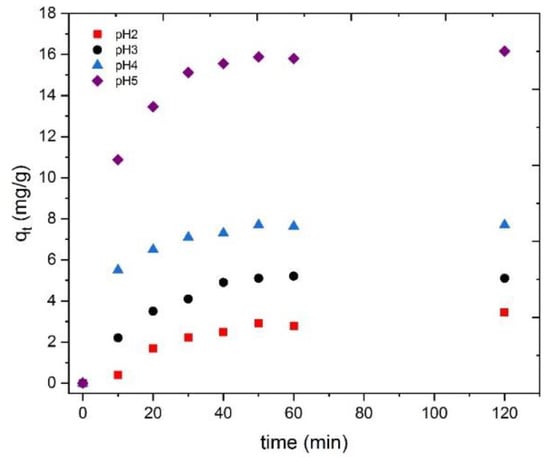
Figure 9.
Influence of the solution pH in Tb(III) adsorbed onto the CRS at the different times tested.
3.2.2. Influence of the Adsorbent Dosage
The effect of different adsorbent dosages on Tb(III) adsorption was investigated using 250, 500, 750, and 1000 mg/L of the CRS at 25 °C using terbium solutions with 10 mg/L concentrations. Figure 10 shows the effect of this variation on the adsorption process. It is clearly seen that the Tb(III) concentration loaded onto the bioadsorbent decreased with an increase in the amount of the adsorbent.
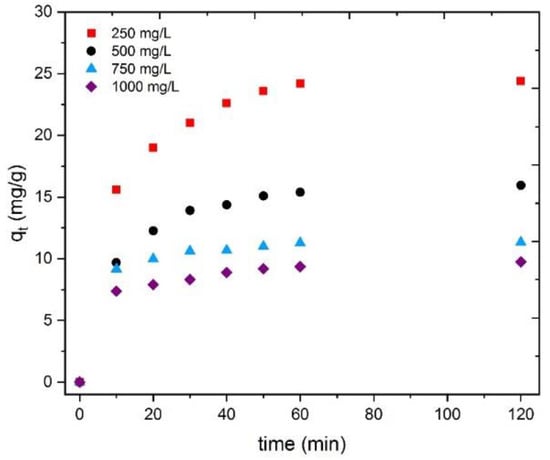
Figure 10.
Tb(III) adsorption as a function of time for the different CRS dosages tested.
3.2.3. Influence of the Temperature
The effect of the temperature on terbium adsorption was also investigated using aqueous solutions with 10 mg/L of terbium at a pH value of 5 with 500 mg/L of the CRS. The results of this study are shown in Figure 11. As can be seen, an increase in temperature slightly improved the terbium adsorption capacity.
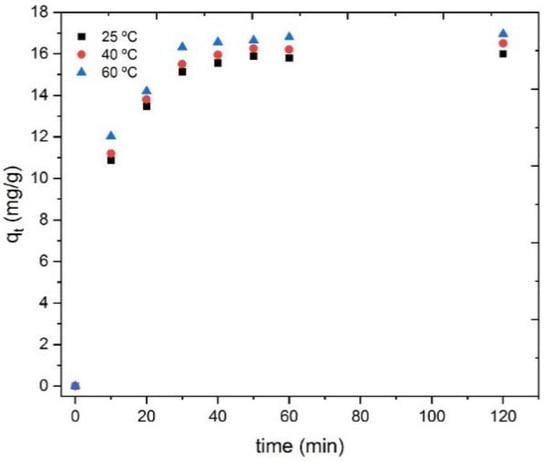
Figure 11.
Influence of the temperature on Tb(III) uptake onto the adsorbent at the different times tested.
4. Discussion
4.1. Characterization of the Bioadsorbent
In the XRD patterns, all obtained diffraction maxima are characteristic of the cellulose structure. Furthermore, the crystallinity index (CrI) was calculated using Equation (1), resulting in 75% for the obtained sample. The obtained % CrI is lower than the value for standard cellulose reported in the literature [32], likely due to the contribution of the amorphous part associated with the cellulose structure or with other lignocellulosic structures.
The recorded FTIR spectrum shows characteristic bands of a cellulose structure, such as a peak located at 3401 cm−1 that corresponds to the stretching of the O-H groups and a peak at 2902 cm−1 due to C-H stretching [30]. Furthermore, the bending mode of the CH2 groups is found at 1430 cm−1, and the peak located at 1372 cm−1 indicates O-H bending. The peak at 1162 cm−1 is associated with antisymmetric bridge vibrations, while the peaks that appear in the region at 1076–1023 cm−1 and the peak at 897 cm−1 indicate the C-O-C pyranose ring’s skeletal vibrations and β-glycosidic bonds [20,33], respectively. Moreover, at 1640 cm−1, one can see the bending mode of the absorbed water [34]. The spectrum for the CRS sample shows additional peaks from those associated with pure cellulose, which are indicated in blue. The peak located at 1735 cm−1 corresponds to the C=O vibration associated with the ester group. This peak is related to the bioadsorbent yielded after treatment under the acidic conditions to which the precursor is subjected, indicating acetylation of the cellulose. Moreover, two other peaks appearing at 1505 cm−1 and 1256 cm−1 suggest that lignin and hemicellulose are still present in the structure of the obtained cellulose sample [35,36]. The chemical modification of cellulose by means of the simple synthetic method used, achieving an in situ activation of cellulose with carboxylic acid and thus partial acetylation/esterification, is a convenient approach that compensates for the limited chemical functionality associated with the structure of pure cellulose, giving it more versatile properties to satisfy the demands related to the technological applications of interest.
As can be seen in Figure 3a, the resulting adsorption–desorption isotherm corresponds to the Type IV BET isotherm [37]. This type of isotherm is characteristic of mesoporous solids (i.e., those with diameters between 2–50 nm). In addition, the formation of multilayers and a hysteresis loop was observed [15,38]. Using the BET model, the values for the total specific surface area (SBET), pore-volume (VT), and pore diameter distribution (Dp) were determined. The value obtained for SBET was 1.83 m2·g−1, that for VT was 0.0036 cm3·g−1, and that for Dp distribution ranged between 12 and 55 Å (1.2–5.5 nm), as shown in Figure 3b.
As previously described, three peaks were observed in the DGT curve. The first one, occurring between 50 and 120 °C, corresponds to the elimination of the adsorbed water and the solvents used for obtaining the bioadsorbent [39,40]. The next step of degradation is attributed to the decomposition of hemicellulose structures, which usually occurs in the 220–315 °C range [41]. Finally, the main stage of degradation corresponds to the depolymerization of cellulose. According to the literature, the decomposition of cellulose is found in the 315–400 °C range, with a maximum peak at 355 °C [41,42]. In the present case, this maximum was established at 321 °C. This slight shift could be related to the variation in the crystallinity of the evaluated sample compared to that reported in the literature [41,42].
The two peaks appearing at 62.56 and 64.89 ppm in the NMR spectra are attributed to carbon six (C6) and correspond to the amorphous and crystalline parts in the cellulose structure, respectively [20,43]. The group of peaks from 72.09 to 74.74 ppm is due to C2, C3, and C5, and the two peaks at 83.54 and 88.74 ppm correspond to C4 due to the crystalline and amorphous parts of the cellulose, respectively [44,45]. Moreover, C1 has an associated peak appearing at 104.89 ppm [20,45]. The two additional signals at 171.93 ppm (C7) and 21.13 ppm (C8) are related to the acetylation of cellulose during the extraction process, which is consistent with the information provided by FTIR analysis. Notably, the OH group on C6 in cellulose is a primary carbon and is considered the most reactive with less steric hindrance compared to the OH groups located on C2 and C3, which are secondary carbons. Therefore, most reactions are more likely to occur through C6 [46,47].
The C1s XPS spectrum exhibited four signals corresponding to the chemical bonding state of the carbon atoms with other atoms. The first signal located at a binding energy of 285 eV corresponds to the C-H or C-C groups, while the next signals appearing at 286.9 and 288.1 eV are attributed to the C-O group. The next signal is attributed to the O-C-O/C=O bonds, and the last one is due to O-C=O at 289.1 eV in an ester group. Thus, according to the FTIR and NMR measurements, the acetylation of cellulose occurred in the extraction process. In addition, the higher intensity of the first peak compared to that occurring in the spectrum of pure cellulose (previously reported) could be associated with the presence of impurities such as lignin or hemicellulose [48]. On the other hand, the O1s spectrum presents three signals. The one located at 533 eV is associated with the C-O group of the structure of the cellulose itself, while the other two signals at 531.3 and 529.6 eV correspond to the C=O and O-C=O groups [49,50], respectively. This information is in accordance with the signals specified in the C1s spectrum. In addition, CRS shows a signal in the nitrogen region at 400 eV because traces of the nitric acid used in the extraction process may still be present.
The esterification process of the cellulose is consistent with the Fischer esterification reaction that, according to the literature, occurs between a carboxylic acid and an alcohol in the presence of a catalyst to form an ester [51,52]. In this work, a reaction occurring between acetic acid and the hydroxyl groups of cellulose is proposed (Figure 12), in which HNO3 acts as the catalyst to obtain the esterified cellulose along with water as a side product.
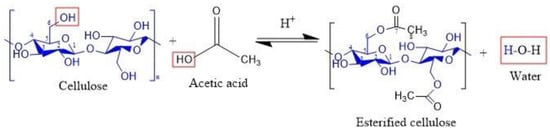
Figure 12.
Representation of esterified cellulose obtained by a Fischer esterification reaction.
During the isolation of cellulose using the acid mixture, the carboxylic groups reacted with the surface hydroxyl groups via an esterification process, allowing the introduction of anionic ester groups [53,54]. The esterification degree depends strongly on diverse parameters, including temperature, acid concentration, reaction time, and the ratio of acid to cellulose. This process can also lead to structural modifications of the system, such as changes in crystallinity (evidenced qualitatively by XRD) and changes in morphology.
Finally, the fibrous structure observed in the SEM micrographs (Figure 8) is attributed to the hydrogen bonds that hold together the cellulose chains [55]. The presence of particles with different sizes and shapes can be attributed to lignin and hemicellulose structures that persist in the fibers [45]. In addition, no significant differences were observed on the surfaces of the fibers in the SEM images before and after the adsorption process. However, as shown in Figure 8c,d, the EDS spectra for both samples exhibit some compositional differences. Nevertheless, as expected, the presence of carbon and oxygen elements was found in both samples, and the EDS spectra registered for the CRS-Tb sample exhibited the presence of the terbium element. This result indicates that the terbium was satisfactorily adsorbed onto the obtained CRS bioadsorbent.
4.2. Adsorption Experiments
4.2.1. pH Influence
Figure 9 shows that the percentage of Tb(III) adsorption decreases as the pH value decreases, reaching a minimum value of 4 mg/g (corresponding to 16% of adsorption) at pH 2, as the interactions increase between H+ and Tb3+ to bind the active sites. The scarce protonation of the functional groups presented in the bioadsorbent also inhibits the reaction between the bioadsorbent and Tb3+ species, which could be of great importance, indicating a lower value of adsorption efficiency as the pH of the solution decreases [56]. The influence of solution pH on Tb(III) adsorption was not investigated for pH values greater than 5 to prevent terbium ions from precipitating as hydroxides. Therefore, pH 5 was applied as the optimum value for further adsorption studies.
4.2.2. Influence of the Adsorbent Dosage
Figure 11 indicates that for adsorbent doses of 250, 500, 750, and 1000 mg/L, the adsorption percentages were 62% (25 mg/g), 80% (16 mg/g), 84% (11 mg/g), and 92% (9 mg/g), respectively. The values in parentheses correspond to the maximum amount (mg) of Tb(III) adsorbed per gram of adsorbent. These results can be attributed to the following process: As the adsorbent concentration increased, the available adsorbent sites also increased; then, the percentage of metal adsorption increased. In addition, the adsorption significantly varied with an increase in the adsorbent dosage in the range of 250–500 mg/L, while at a range of 750–1000 mg/L for CRS, the metal concentrations on the bioadsorbent were only slightly modified. This decrease in adsorption capacity might be due to the interference between the binding sites and adsorbate or the insufficiency of Tb(III) in the solution with respect to the available binding sites [57].
4.2.3. Influence of the Temperature
As previously mentioned in Section 3.2.3. the adsorption capacity slightly increased with the temperature, reaching around 16.0 mg/g at 25 °C, 16.5 mg/g at 40 °C, and 16.9 mg/g at 60 °C. The equilibrium was also reached slightly earlier when the temperature increased (i.e., the adsorption capacity remained constant after 60 min at 25 °C, 50 min at 40 °C, and 40 min at 60 °C). Thus, the obtained results indicate that a temperature increase slightly improves the terbium adsorption process.
4.2.4. Adsorption Isotherms
The experimental results of the adsorption process were fitted to various isotherm models using Equations (3)–(5). Linear equations adjusted are shown in Figure 13. The Langmuir model assumes that on the surface of the adsorbent, all sites are equally active. Thus, the surface is energetically homogeneous. As a result, a monolayer surface is formed without any interactions between the adsorbed molecules of the adsorbate [58,59]. The Freundlich model is valid for heterogeneous surfaces, which indicates that the adsorption energy exponentially decreases at the finishing points of the adsorption centers of adsorbents [22,60]. The Temkin isotherm model takes into account adsorbent–adsorbate interactions. This model assumes that, due to these interactions, the heat of adsorption will decrease with coverage on the surface [58].
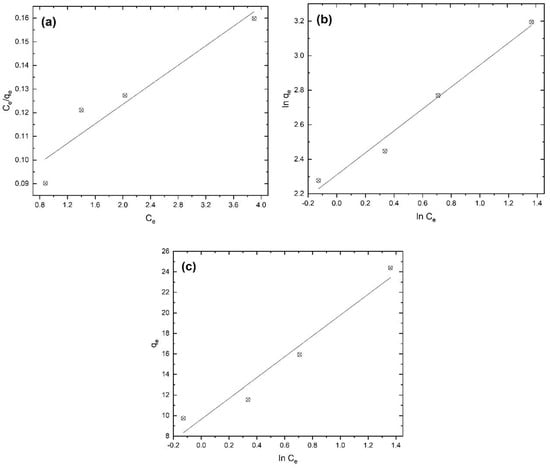
Figure 13.
Linearized adsorption isotherms for (a) Langmuir, (b) Freundlich, and (c) Temkin at 25 °C.
The correlation coefficients associated with fitting to the above-mentioned models shown in Table 1 suggest that the Freundlich isotherm betters describe terbium’s adsorption onto the CRS bioadsorbent. The calculated values of KF and n were 10.1 (mg/g)·(L/mg) and 1.5, respectively. The positive value of n indicates that the adsorption process is favorable [22].

Table 1.
Parameters and correlation coefficients obtained from fits of the isotherm models to the experimental data.
Table 2 shows the information reported on metal adsorption for several bioadsorbents prepared from different cellulose precursors under optimal conditions. Notably, most of the data presented in Table 2 were obtained at a pH of 6 and above, at which point the metal was precipitated. Thus, the adsorption data given by the respective authors do not reflect a true cation adsorption process but rather a precipitation process. Thus, the present work describes a one-step process to obtain a low-cost cellulose-based bioadsorbent obtained from rose stems, a precursor considered to be agricultural waste, which is effective for terbium adsorption from aqueous solutions.
Table 2.
Metal adsorption under optimal conditions for the different cellulose precursors used.
4.2.5. Kinetics Studies
To analyze the kinetics of the adsorption process, the experimental data obtained under the different temperatures tested were plotted using different models (Equations (6)–(9)): pseudo-first-order, pseudo-second-order, Elovich, and Bangham. The obtained correlation coefficients are summarized in Table 3. Experimental data in the temperature range of 25–60 °C fit well with the pseudo-second order kinetic model [65], with k2 values of 0.021 ± 0.002 g/min·mg. In the model data, the value of qe,calc is about 16.9 mg/g, which matches closely with the experimental values near 16.5 mg/g.
Table 3.
Summary of the correlation coefficients corresponding to different kinetic models evaluated.
From these obtained results, the Arrhenius equation parameters can be fitted using the kinetic constants. The plot of ln k versus 1/T yields a straight line with a slope of −Ea/R. The magnitude of the activation energy is commonly used as the basis for differentiating between physisorption and chemisorption processes. In the case of a physical adsorption process, the processes are reversible, equilibrium is rapidly achieved, and the energy required is small (between the range of 5 and 40 kJ/mol). The chemical adsorption process is irreversible and involves stronger forces. For this, the activation energies are larger (between 40 and 800 kJ/mol) [66]. The calculated activation energy was 5.71 kJ/mol, which suggests that terbium adsorption is a physical adsorption process.
The obtained adsorption results at 25 °C were analyzed to determine the possible rate law governing the adsorption of Tb(III) onto the adsorbent. Figure 14 shows the fit obtained from Equations (10)–(12). The best fit (R2 = 0.9957) was found for the particle diffusion-controlled process (Equation (10)) in the present system [65], with a rate constant of 0.044 min−1.
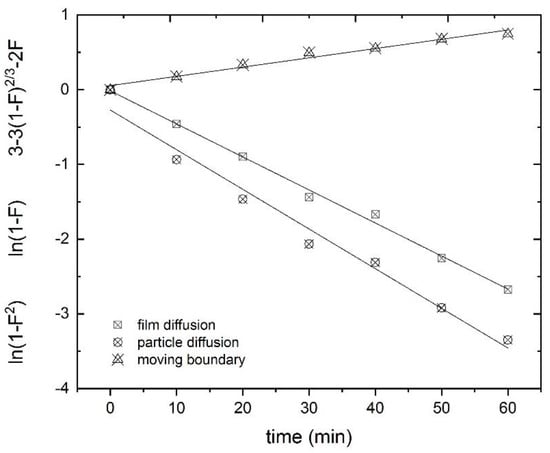
Figure 14.
Rate laws fitted for the different adsorption mechanisms.
4.2.6. Desorption Experiments
Desorption experiments were performed using CRS-Tb solids loaded with 16 mg Tb(III) per gram of bioadsorbent over 120 min. Table 4 summarizes the results obtained under the different experimental conditions used in this work. The influence of different preparation conditions for the desorption solutions on terbium desorption was investigated using 0.2 M H2SO4 and HCl solutions at ratios of 1250, 2500, and 5000 mL per gram of bioadsorbent. For a fixed concentration of the solution (0.2 M), a higher desorption percentage with the use of HCl was found. The maximum percentages were 63–75% and 72–81% for H2SO4 and HCl, respectively.
Table 4.
Terbium concentration in the eluent solution and the desorption percentages for the different solutions tested.
The effect of the HCl concentration (0.2 M and 0.5 M) was also investigated under the same experimental conditions. Here, the higher the acid concentration was, the higher the desorption percentage was, achieving yields as high as 79–97%. Finally, regardless of the type of solution and the acid concentration used in the experiments, the desorption percentage increased with the volume of the eluent/bioadsorbent amount (mL/g) ratio. The obtained results indicate the effective recovery of terbium ions from Tb-loaded CRS is possible and offers interesting yields.
5. Conclusions
A low-cost cellulose-based bioadsorbent (CRS) was obtained using cellulosic material extracted from rose stems as the source of the biomass. Several techniques were used to characterize the obtained sample. XRD measurements exhibited peaks attributed to the cellulose structure, with a crystallinity index of 75%. FTIR, 13C NMR, and XPS analyses showed signals of acetylation in the sample related to the extraction of cellulose from rose stems. The adsorption process for terbium removal from liquid effluents was also investigated. An optimal pH of 5 with 80% terbium removal was observed. The increase in the adsorbent dosage improved the adsorption process, leading to 92% adsorption when 1000 mg/L of the CRS sample was added. The adsorption kinetic isotherms showed that terbium adsorption is best described by the pseudo-second-order kinetic model and the Freundlich isotherm. The obtained activation energy value was 5.71 kJ/mol, which suggests that the terbium adsorption onto the CRS sample could be attributed to a physical adsorption process. Thus, the results obtained in the present work revealed that the obtained low-cost cellulose-based adsorbent is useful for terbium adsorption from aqueous solutions. Finally, using acidic solutions, the rate of terbium desorption was in the 80–97% range.
Author Contributions
L.A., D.N.S., F.L., L.D.L., and F.J.A. methodology, validation, formal analysis, investigation, writing—original draft preparation, writing—review and editing; E.E., formal analysis; F.A.L., conceptualization; methodology investigation, writing—review and editing; funding acquisition; supervision; project administration. All authors have read and agreed to the published version of the manuscript.
Funding
This research has received funding from the European Union’s Horizon 2020 research and innovation program under Grant No. 776851 (Car-E Service).
Acknowledgments
The authors thank the agreement between Yachay Tech University (Ecuador) and the CSIC for doctoral student residencies at the CSIC. The authors from the National Center for Metallurgical Research, Spanish National Research Council (CENIM-CSIC), would like to thank Irene Llorente for the XPS measurements carried out. The authors from Yachay Tech University are thankful for the support from the project CHEM19-16. We acknowledge the support for the publication fee from the CSIC Open Access Publication Support Initiative through its Unit of Information Resources for Research (URICI).
Conflicts of Interest
The authors declare no conflict of interest.
References
- Abdel Maksoud, M.I.A.; Elgarahy, A.M.; Farrell, C.; Al-Muhtaseb, A.H.; Rooney, D.W.; Osman, A.I. Insight on water remediation application using magnetic nanomaterials and biosorbents. Coord. Chem. Rev. 2020, 403, 213096. [Google Scholar] [CrossRef]
- Alguacil, F.J.; López, F.A. Adsorption Processing for the Removal of Toxic Hg(II) from Liquid Effluents: Advances in the 2019 Year. Metals (Basel) 2020, 10, 412. [Google Scholar] [CrossRef]
- Ahmad, R.; Ali, Z.; Khan, A.A.; Rehman, N.U. Terbium extraction by functionalized surface: Experimental and DFT approach. Adsorption 2020, 26, 117–125. [Google Scholar] [CrossRef]
- Javadian, H.; Ruiz, M.; Saleh, T.A.; Sastre, A.M. Ca-alginate/carboxymethyl chitosan/Ni0.2Zn0.2Fe2.6O4 magnetic bionanocomposite: Synthesis, characterization and application for single adsorption of Nd+3, Tb+3, and Dy+3 rare earth elements from aqueous media. J. Mol. Liq. 2020, 306, 112760. [Google Scholar] [CrossRef]
- Javadian, H.; Ruiz, M.; Sastre, A.M. Response surface methodology based on central composite design for simultaneous adsorption of rare earth elements using nanoporous calcium alginate/carboxymethyl chitosan microbiocomposite powder containing Ni0.2Zn0.2Fe2.6O4 magnetic nanoparticles: Batch. Int. J. Biol. Macromol. 2020, 154, 937–953. [Google Scholar] [CrossRef]
- Javadian, H.; Ruiz, M.; Taghavi, M.; Sastre, A.M. Synthesis of magnetic CMC bionanocomposite containing a novel biodegradable nanoporous polyamide selectively synthesized in ionic liquid as green media: Investigation on Nd+3, Tb+3, and Dy+3 rare earth elements adsorption. J. Mol. Liq. 2020, 308, 113017. [Google Scholar] [CrossRef]
- Lapo, B.; Bou, J.J.; Hoyo, J.; Carrillo, M.; Peña, K.; Tzanov, T.; Sastre, A.M. A potential lignocellulosic biomass based on banana waste for critical rare earths recovery from aqueous solutions. Environ. Pollut. 2020, 264, 114409. [Google Scholar] [CrossRef]
- Javadian, H.; Ruiz, M.; Taghvai, M.; Sastre, A.M. Novel magnetic nanocomposite of calcium alginate carrying poly(pyrimidine-thiophene-amide) as a novel green synthesized polyamide for adsorption study of neodymium, terbium, and dysprosium rare-earth ions. Colloids Surf. A Physicochem. Eng. Asp. 2020, 603, 125252. [Google Scholar] [CrossRef]
- Afonso, E.L.; Carvalho, L.; Fateixa, S.; Amorim, C.O.; Amaral, V.S.; Vale, C.; Pereira, E.; Silva, C.M.; Trindade, T.; Lopes, C.B. Can contaminated waters or wastewater be alternative sources for technology-critical elements? The case of removal and recovery of lanthanides. J. Hazard. Mater. 2019, 380, 120845. [Google Scholar] [CrossRef]
- Attia, M.A.; Moussa, S.I.; Sheha, R.R.; Someda, H.H.; Saad, E.A. Hydroxyapatite/NiFe2O4 superparamagnetic composite: Facile synthesis and adsorption of rare elements. Appl. Radiat. Isot. 2019, 145, 85–94. [Google Scholar] [CrossRef]
- Demey, H.; Melkior, T.; Chatroux, A.; Attar, K.; Thiery, S.; Miller, H.; Grateau, M.; Sastre, A.M.; Marchand, M. Evaluation of torrefied poplar-biomass as a low-cost sorbent for lead and terbium removal from aqueous solutions and energy co-generation. Chem. Eng. J. 2019, 361, 839–852. [Google Scholar] [CrossRef]
- Wang, J. Adsorption of aqueous neodymium, europium, gadolinium, terbium, and yttrium ions onto nZVI-montmorillonite: Kinetics, thermodynamic mechanism, and the influence of coexisting ions. Environ. Sci. Pollut. Res. 2018, 25, 33521–33537. [Google Scholar] [CrossRef] [PubMed]
- O’Connell, D.W.; Birkinshaw, C.; Francis, T.; O’Dwyer, T.F. Heavy metal adsorbents prepared from the modification of cellulose: A review. Bioresour. Technol. 2008, 99, 6709–6724. [Google Scholar]
- Kosheleva, A.; Atamaniuk, I.; Politaeva, N.; Kuchta, K. Adsorption of rare earth elements using bio-based sorbents. MATEC Web Conf. 2018, 245, 18001. [Google Scholar] [CrossRef]
- Negrea, A.; Gabor, A.; Davidescu, C.M.; Ciopec, M.; Negrea, P.; Duteanu, N.; Barbulescu, A. Rare Earth Elements Removal from Water Using Natural Polymers. Sci. Rep. 2018, 8, 316. [Google Scholar] [CrossRef]
- Berg, J.M.; Tymoczko, J.L.; Gatto Jr, G.J.; Stryer, L. Biochemistry, 8th ed.; W.H. Freeman & Co.: New York, NY, USA, 2015. [Google Scholar]
- Kayra, N.; Aytekin, A.Ö. Synthesis of Cellulose-Based Hydrogels: Preparation, Formation, Mixture, and Modification. In Cellulose-Based Superabsorbent Hydrogels; Ibrahim, M.d., Mondal, H., Eds.; Springer Science and Business Media LLC: Berlin/Heidelberg, Germany, 2018; pp. 407–434. [Google Scholar]
- Reghunadhan, A.; Sivan, N.G.; Shibina, S.K.; Mary, S.K.; Koshy, R.R.; Datta, J.; Thomas, S. New-fangled sources of cellulose extraction: Comparative study of the effectiveness of Cissus latifolia and Ficus benghalensis cellulose as a filler. Mater. Chem. Front. 2019, 3, 2025–2031. [Google Scholar] [CrossRef]
- Kabir, S.M.F.; Sikdar, P.P.; Haque, B.; Bhuiyan, M.A.R.; Ali, A.; Islam, M.N. Cellulose-based hydrogel materials: Chemistry, properties and their prospective applications. Prog. Biomater. 2018, 7, 153–174. [Google Scholar] [CrossRef]
- Sun, J.X.; Sun, X.F.; Zhao, H.; Sun, R.C. Isolation and characterization of cellulose from sugarcane bagasse. Polym. Degrad. Stab. 2004, 84, 331–339. [Google Scholar] [CrossRef]
- Segal, L.; Creely, J.J.; Martin, A.E.; Conrad, C.M. An Empirical Method for Estimating the Degree of Crystallinity of Native Cellulose Using the X-Ray Diffractometer. Text. Res. J. 1959, 29, 786–794. [Google Scholar] [CrossRef]
- Araújo, C.S.T.; Almeida, I.L.S.; Rezende, H.C.; Marcionilio, S.M.L.O.; Léon, J.J.L.; de Matos, T.N. Elucidation of mechanism involved in adsorption of Pb(II) onto lobeira fruit (Solanum lycocarpum) using Langmuir, Freundlich and Temkin isotherms. Microchem. J. 2018, 137, 348–354. [Google Scholar] [CrossRef]
- Aljeboree, A.M.; Alshirifi, A.N.; Alkaim, A.F. Kinetics and equilibrium study for the adsorption of textile dyes on coconut shell activated carbon. Arab. J. Chem. 2017, 10, S3381–S3393. [Google Scholar] [CrossRef]
- Langergren, S. Zur Theorie der sogenannten Adsorption gelöster Stoffe. Z. Chem. Ind. Kolloide 1907, 2, 15. [Google Scholar]
- Ho, Y.; McKay, G. Pseudo-second order model for sorption processes. Process Biochem. 1999, 34, 451–465. [Google Scholar] [CrossRef]
- Inyinbor, A.A.; Adekola, F.A.; Olatunji, G.A. Kinetics, isotherms and thermodynamic modeling of liquid phase adsorption of Rhodamine B dye onto Raphia hookerie fruit epicarp. Water Resour. Ind. 2016, 15, 14–27. [Google Scholar] [CrossRef]
- Alguacil, F.J.; Lopez, F.A.; Rodriguez, O.; Martinez-Ramirez, S.; Garcia-Diaz, I. Sorption of indium (III) onto carbon nanotubes. Ecotoxicol. Environ. Saf. 2016, 130, 81–86. [Google Scholar] [CrossRef] [PubMed]
- Mert, H.H.; Moghbeli, M.R.; Sajad, S.; Mert, E.H. Functionalized cellulose nanocrytals (fCNCs) reinforced PolyHIPEs: Tailoring morphological, mechanical and thermal properties. React. Funct. Polym. 2020, 151, 104572. [Google Scholar] [CrossRef]
- Jiao, C.; Zhang, Z.; Tao, J.; Zhang, D.; Chen, Y.; Lin, H. Synthesis of a poly(amidoxime-hydroxamic acid) cellulose derivative and its application in heavy metal ion removal. RSC Adv. 2017, 7, 27787–27795. [Google Scholar] [CrossRef]
- Yue, X.; Huang, J.; Jiang, F.; Lin, H.; Chen, Y. Synthesis and characterization of cellulose-based adsorbent for removal of anionic and cationic dyes. J. Eng. Fiber. Fabr. 2019, 14, 1–10. [Google Scholar] [CrossRef]
- Puigdomenech, I. Medusa Program. Available online: www.kth.se/che/medusa (accessed on 2 April 2020).
- Park, S.; Baker, J.O.; Himmel, M.E.; Parilla, P.A.; Johnson, D.K. Cellulose crystallinity index: Measurement techniques and their impact on interpreting cellulase performance. Biotechnol. Biofuels 2010, 3, 10. [Google Scholar] [CrossRef]
- Bian, J.; Peng, F.; Peng, X.-P.; Peng, P.; Xu, F.; Sun, R.-C. Acetic acid enhanced purification of crude cellulose from sugarcane bagasse: Structural and morphological characterization. BioResources 2012, 7, 4626–4639. [Google Scholar] [CrossRef]
- Johar, N.; Ahmad, I.; Dufresne, A. Extraction, preparation and characterization of cellulose fibres and nanocrystals from rice husk. Ind. Crops Prod. 2012, 37, 93–99. [Google Scholar] [CrossRef]
- Sasikala, M.; Umapathy, M.J. Preparation and characterization of pineapple leaf cellulose nanocrystal reinforced gelatin bio-nanocomposite with antibacterial banana leaf extract for application in food packaging. New J. Chem. 2018, 42, 19979–19986. [Google Scholar] [CrossRef]
- Watkins, D.; Nuruddin, M.; Hosur, M.; Tcherbi-Narteh, A.; Jeelani, S. Extraction and characterization of lignin from different biomass resources. J. Mater. Res. Technol. 2015, 4, 26–32. [Google Scholar] [CrossRef]
- Buttersack, C. Modeling of type IV and V sigmoidal adsorption isotherms. Phys. Chem. Chem. Phys. 2019, 21, 5614–5626. [Google Scholar] [CrossRef] [PubMed]
- Cychosz, K.A.; Thommes, M. Progress in the Physisorption Characterization of Nanoporous Gas Storage Materials. Engineering 2018, 4, 559–566. [Google Scholar] [CrossRef]
- Dorez, G.; Ferry, L.; Sonnier, R.; Taguet, A.; Lopez-Cuesta, J.-M. Effect of cellulose, hemicellulose and lignin contents on pyrolysis and combustion of natural fibers. J. Anal. Appl. Pyrolysis 2014, 107, 323–331. [Google Scholar] [CrossRef]
- Kok, M.V.; Ozgur, E. Characterization of lignocellulose biomass and model compounds by thermogravimetry. Energy Sources Part A Recover. Util. Environ. Eff. 2017, 39, 134–139. [Google Scholar] [CrossRef]
- Liu, C.; Wang, H.; Karim, A.M.; Sun, J.; Wang, Y. Catalytic fast pyrolysis of lignocellulosic biomass. Chem. Soc. Rev. 2014, 43, 7594–7623. [Google Scholar] [CrossRef]
- Yang, H.; Yan, R.; Chen, H.; Lee, D.H.; Zheng, C. Characteristics of hemicellulose, cellulose and lignin pyrolysis. Fuel 2007, 86, 1781–1788. [Google Scholar] [CrossRef]
- Prasad Reddy, J.; Rhim, J.-W. Isolation and characterization of cellulose nanocrystals from garlic skin. Mater. Lett. 2014, 129, 20–23. [Google Scholar] [CrossRef]
- Liu, C.-F.; Sun, R.-C. Cellulose. In Cereal Straw as a Resource for Sustainable Biomaterials and Biofuels; Elsevier: Amsterdam, The Netherlands, 2010; pp. 131–167. ISBN 9780444532343. [Google Scholar]
- Mohtar, S.S.; Busu, T.N.Z.T.M.; Noor, A.M.M.; Shaari, N.; Mat, H. An ionic liquid treatment and fractionation of cellulose, hemicellulose and lignin from oil palm empty fruit bunch. Carbohydr. Polym. 2017, 166, 291–299. [Google Scholar] [CrossRef] [PubMed]
- Gan, S.; Zakaria, S.; Chia, C.H.; Chen, R.S.; Ellis, A.V.; Kaco, H. Highly porous regenerated cellulose hydrogel and aerogel prepared from hydrothermal synthesized cellulose carbamate. PLoS ONE 2017, 12, e0173743. [Google Scholar] [CrossRef] [PubMed]
- Fu, Y.; Li, G.; Wang, R.; Zhang, F.; Qin, M. Effect of the Molecular Structure of Acylating Agents on the Regioselectivity of Cellulosic Hydroxyl Groups in Ionic Liquid. BioResources 2016, 12, 992–1006. [Google Scholar] [CrossRef]
- Tran, T.N.; Paul, U.; Heredia-Guerrero, J.A.; Liakos, I.; Marras, S.; Scarpellini, A.; Ayadi, F.; Athanassiou, A.; Bayer, I.S. Transparent and flexible amorphous cellulose-acrylic hybrids. Chem. Eng. J. 2016, 287, 196–204. [Google Scholar] [CrossRef]
- Ahammad, A.J.S.; Odhikari, N.; Shah, S.S.; Hasan, M.M.; Islam, T.; Pal, P.R.; Ahmed Qasem, M.A.; Aziz, M.A. Porous tal palm carbon nanosheets: Preparation, characterization and application for the simultaneous determination of dopamine and uric acid. Nanoscale Adv. 2019, 1, 613–626. [Google Scholar] [CrossRef]
- Zhang, F.; Dou, J.; Zhang, H. Mixed membranes comprising carboxymethyl cellulose (as capping agent and gas barrier matrix) and nanoporous ZIF-L nanosheets for gas separation applications. Polymers (Basel) 2018, 10, 1340. [Google Scholar] [CrossRef]
- Wade, L.G. Wade Organic Chemistry 8e.PDF, 8th ed.; Pearson: New York, NY, USA, 2013; ISBN 0: 0-321-76841-8. [Google Scholar]
- Braun, B.; Dorgan, J.R. Single-Step Method for the Isolation and Surface Functionalization of Cellulosic Nanowhiskers. Biomacromolecules 2009, 10, 334–341. [Google Scholar] [CrossRef]
- Brendel, O.; Iannetta, P.P.M.; Stewart, D. A Rapid and Simple Method to Isolate Pure Alpha-cellulose. Phytochem. Anal. 2000, 10, 7–10. [Google Scholar] [CrossRef]
- Wang, Y.; Wang, X.; Xie, Y.; Zhang, K. Functional nanomaterials through esterification of cellulose: A review of chemistry and application. Cellulose 2018, 25, 3703–3731. [Google Scholar] [CrossRef]
- Xiang, Q.; Lee, Y.Y.; Pettersson, P.O.; Torget, R.W. Heterogeneous Aspects of Acid Hydrolysis of α-Cellulose. In Biotechnology for Fuels and Chemicals; Humana Press: Totowa, NJ, USA, 2003; pp. 505–514. [Google Scholar]
- Kampalanonwat, P.; Supaphol, P. The Study of Competitive Adsorption of Heavy Metal Ions from Aqueous Solution by Aminated Polyacrylonitrile Nanofiber Mats. Energy Procedia 2014, 56, 142–151. [Google Scholar] [CrossRef]
- Javadian, H.; Asadollahpour, S.; Ruiz, M.; Sastre, A.M.; Ghasemi, M.; Asl, S.M.H.; Masomi, M. Using fuzzy inference system to predict Pb (II) removal from aqueous solutions by magnetic Fe3O4/H2SO4-activated Myrtus Communis leaves carbon nanocomposite. J. Taiwan Inst. Chem. Eng. 2018, 91, 186–199. [Google Scholar] [CrossRef]
- Abdelnaeim, M.Y.; El Sherif, I.Y.; Attia, A.A.; Fathy, N.A.; El-Shahat, M.F. Impact of chemical activation on the adsorption performance of common reed towards Cu(II) and Cd(II). Int. J. Miner. Process. 2016, 157, 80–88. [Google Scholar] [CrossRef]
- Malekbala, M.R.; Khan, M.A.; Hosseini, S.; Abdullah, L.C.; Choong, T.S.Y. Adsorption/desorption of cationic dye on surfactant modified mesoporous carbon coated monolith: Equilibrium, kinetic and thermodynamic studies. J. Ind. Eng. Chem. 2015, 21, 369–377. [Google Scholar] [CrossRef]
- Rangabhashiyam, S.; Anu, N.; Giri Nandagopal, M.S.; Selvaraju, N. Relevance of isotherm models in biosorption of pollutants by agricultural byproducts. J. Environ. Chem. Eng. 2014, 2, 398–414. [Google Scholar] [CrossRef]
- Zhuang, Y.; Liu, J.; Chen, J.; Fei, P. Modified pineapple bran cellulose by potassium permanganate as a copper ion adsorbent and its adsorption kinetic and adsorption thermodynamic. Food Bioprod. Process. 2020, 122, 82–88. [Google Scholar] [CrossRef]
- Choi, H.Y.; Bae, J.H.; Hasegawa, Y.; An, S.; Kim, I.S.; Lee, H.; Kim, M. Thiol-functionalized cellulose nanofiber membranes for the effective adsorption of heavy metal ions in water. Carbohydr. Polym. 2020, 234, 115881. [Google Scholar] [CrossRef]
- Madivoli, E.; Kareru, P.; Gachanja, A.; Mugo, S.; Murigi, M.; Kairigo, P.; Kipyegon, C.; Mutembei, J.; Njonge, F. Adsorption of Selected Heavy Metals on Modified Nano Cellulose. Int. Res. J. Pure Appl. Chem. 2016, 12, 1–9. [Google Scholar] [CrossRef]
- Zhu, H.-X.; Cao, X.-J.; He, Y.-C.; Kong, Q.-P.; He, H.; Wang, J. Removal of Cu2+ from aqueous solutions by the novel modified bagasse pulp cellulose: Kinetics, isotherm and mechanism. Carbohydr. Polym. 2015, 129, 115–126. [Google Scholar] [CrossRef]
- Hubbe, M.A.; Azizian, S.; Douven, S. Implications of apparent pseudo-second-order adsorption kinetics onto cellulosic materials: A review. BioResources 2019, 14, 7582–7626. [Google Scholar] [CrossRef]
- Boparai, H.K.; Joseph, M.; O’Carroll, D.M. Kinetics and thermodynamics of cadmium ion removal by adsorption onto nano zerovalent iron particles. J. Hazard. Mater. 2011, 186, 458–465. [Google Scholar] [CrossRef]
Publisher’s Note: MDPI stays neutral with regard to jurisdictional claims in published maps and institutional affiliations. |
© 2020 by the authors. Licensee MDPI, Basel, Switzerland. This article is an open access article distributed under the terms and conditions of the Creative Commons Attribution (CC BY) license (http://creativecommons.org/licenses/by/4.0/).