Article

Effect of Heat Treatment and Drawing on High-Manganese Steel Pipe Welded by Gas Tungsten Arc

1
Department of Materials Science and Engineering, Ulsan National Institute of Science and Technology, Ulsan 44919, Korea
2
Energy Materials and Components R&D Group, Korea Institute of Industrial Technology, Busan 46938, Korea
3
Department of Materials Science and Engineering, Pukyong National University, Busan 46241, Korea
*
Authors to whom correspondence should be addressed.
Metals 2020, 10(10), 1366; https://doi.org/10.3390/met10101366
Submission received: 3 September 2020 / Revised: 7 October 2020 / Accepted: 12 October 2020 / Published: 13 October 2020
(This article belongs to the Special Issue Heat Treatment and Mechanical Properties of Metals and Alloys)

Abstract

:
This study investigated the effect of post-weld processes including annealing and drawing on the microstructure and mechanical properties of high-Mn steel pipes welded by gas tungsten arc welding. The weld metal showed a solidified microstructure having coarse and elongated grains due to coalescence of columnar dendrite into welding heat direction. After post-annealing, the solidified microstructure changed into equiaxed grains due to recrystallization and grain growth. Mn segregation occurred during welding solidification and caused lower stacking fault energy (SFE) in the Mn-depleted region. Although ε-martensite formation in the as-welded state and during deformation was expected due to decreased SFE of the Mn-depleted zone, all regions showed a fully austenitic phase. The annealing process decreased strength due to grain coarsening but increased ductility. The drawing process increased strength of weld metal through work hardening. All pipes showed decreasing strain rate sensitivity (SRS) with deformation and negative SRS after certain strain levels. It was confirmed that negative SRS is related to less formation of mechanical twinning at a higher strain rate. This work provides fundamental insights into manufacturing a high-Mn steel pipe and manipulating its properties with annealing and drawing processes.

1. Introduction

High-manganese (high-Mn) steels have excellent tensile strength, ductility, formability, and low temperature toughness [1,2,3]. This combination of high strength and ductility is caused by twinning-induced plasticity (TWIP), which occurs during plastic deformation. When deformation twins are formed by TWIP, a “dynamic Hall–Petch” effect occurs in a way that effective grain size decreases by increasing deformation twin density. As the dynamic Hall–Petch effect occurs, twin boundaries impede dislocation movement, so the mean free path of dislocation glide decreases, and consequently the work-hardening rate increases. If plastic deformation continues, then multiple slip and twinning systems operate and further increase the work-hardening rate [1,4,5]. This high work-hardening rate of high-Mn steel is related to the deformation mechanism, which depends on stacking fault energy (SFE). At room temperature, the TWIP effect activates at 20 ≤ SFE ≤ 50 mJ/m2, whereas deformation-induced epsilon martensite transformation is predominant at SFE < 20 mJ/m2. In contrast, high SFE > 50 mJ/m2 suppressed the TWIP effect and leads to dislocation glide [6,7,8].
High-Mn steel shows austenitic phase at low temperature due to high content of Mn and shows excellent mechanical properties at cryogenic temperature [9,10,11,12]. High-Mn steel has thus recently gained attention to be used as pipe material in cryogenic industries such as liquefied natrual gas (LNG) ships and offshore plants. For this reason, several papers have reported the welding process and properties of high-Mn steels [13,14,15].
Common issues found in high-Mn steel welding are as follows: (1) Mn content in the weld zone may decrease during welding due to the high vapor pressure of liquid Mn; (2) Mn depletion zone may be formed by Mn segregation during welding solidification; and (3) welding heat input may degrade mechanical properties of the heat-affected zone (HAZ).
First, for the case of Mn evaporation during welding, several studies have been reported that high weld heat generally induces Mn evaporation during welding and may lead to undesirable phases such as epsilon martensite in the as-welded microstructure [13,16,17]. Evaporation tended to be greater with higher energy density, controlled by welding parameters like power and welding speed [17,18]. Mn evaporation may cause a decrease of SFE and possibly leads to undesirable effects on the weld zone. In other words, the resultant initial phase may contain brittle epsilon martensite, and the deformation mechanism of the weld zone may be accompanied by epsilon martensite as well [3,19,20].
Second, Mn solubility of austenite is lower than the solubility of the liquid phase, and the different solubilities between the phases causes Mn segregation during welding solidification [17,21]. Accordingly, the interdendritic region has higher Mn and C content than the dendrite [14,17,22]. The resultant SFE difference between the dendrite and interdendritic region may induce a difference in deformation behaviors and could be attributed to initiation of microcracks in the weld zone [23]. Additionally, chemical inhomogeneity by Mn and C segregation may increase hot cracking susceptibility [24].
Third, grain coarsening and liquation cracking by welding heat input may degrade mechanical properties in HAZ. Grains in HAZ do not melt during the welding process, but the grains are prone to be coarser due to the heat input. Therefore, mechanical properties of HAZ with coarse grains may degrade according to the “Hall–Petch” relation [2,15]. Moreover, segregation of Mn and C in HAZ may induce liquation cracking during the welding process [25].
However, most of the previous works have mainly focused on fundamental welding properties in the butt-welding process in which flat plates of high-Mn steels were joined together [15,17,25,26]. However, it is required to research welding processes not only on flat plate but also on pipe for industrial applications. Furthermore, for wide application in those LNG-related industries, it is necessary to diversify the diameters of the high-Mn steel pipe for its purpose. For this reason, it is necessary to apply drawing processes on manipulating diameters of the welded high-Mn steel pipes, but related research including drawing and accompanying heat treatment have rarely been conducted.
Therefore, the present study investigated the properties of high-Mn steel (Fe-24Mn-3.4Cr-0.44C wt.%) pipe manufactured by gas tungsten arc welding (GTAW) and the properties of drawn weld pipes manufactured by subsequent drawing processes and heat treatments. The present work is novel in that it deals with properties of welded pipe itself, not butt-welded plate, and investigates the effect of each step of conventional industrial processes for manufacturing drawn pipe. This study mainly focused on the effect of those processes such as welding, drawing, and heat treatments on the microstructure and mechanical properties of the pipe. In addition, effort was made on composition analysis, SFE calculation, and phase analysis to clarify the aforementioned possibility of Mn depletion and segregation, which may lead to a change in the deformation mechanism. Furthermore, strain rate sensitivity was measured to suggest the fundamental feedback on the drawing process.

2. Materials and Methods

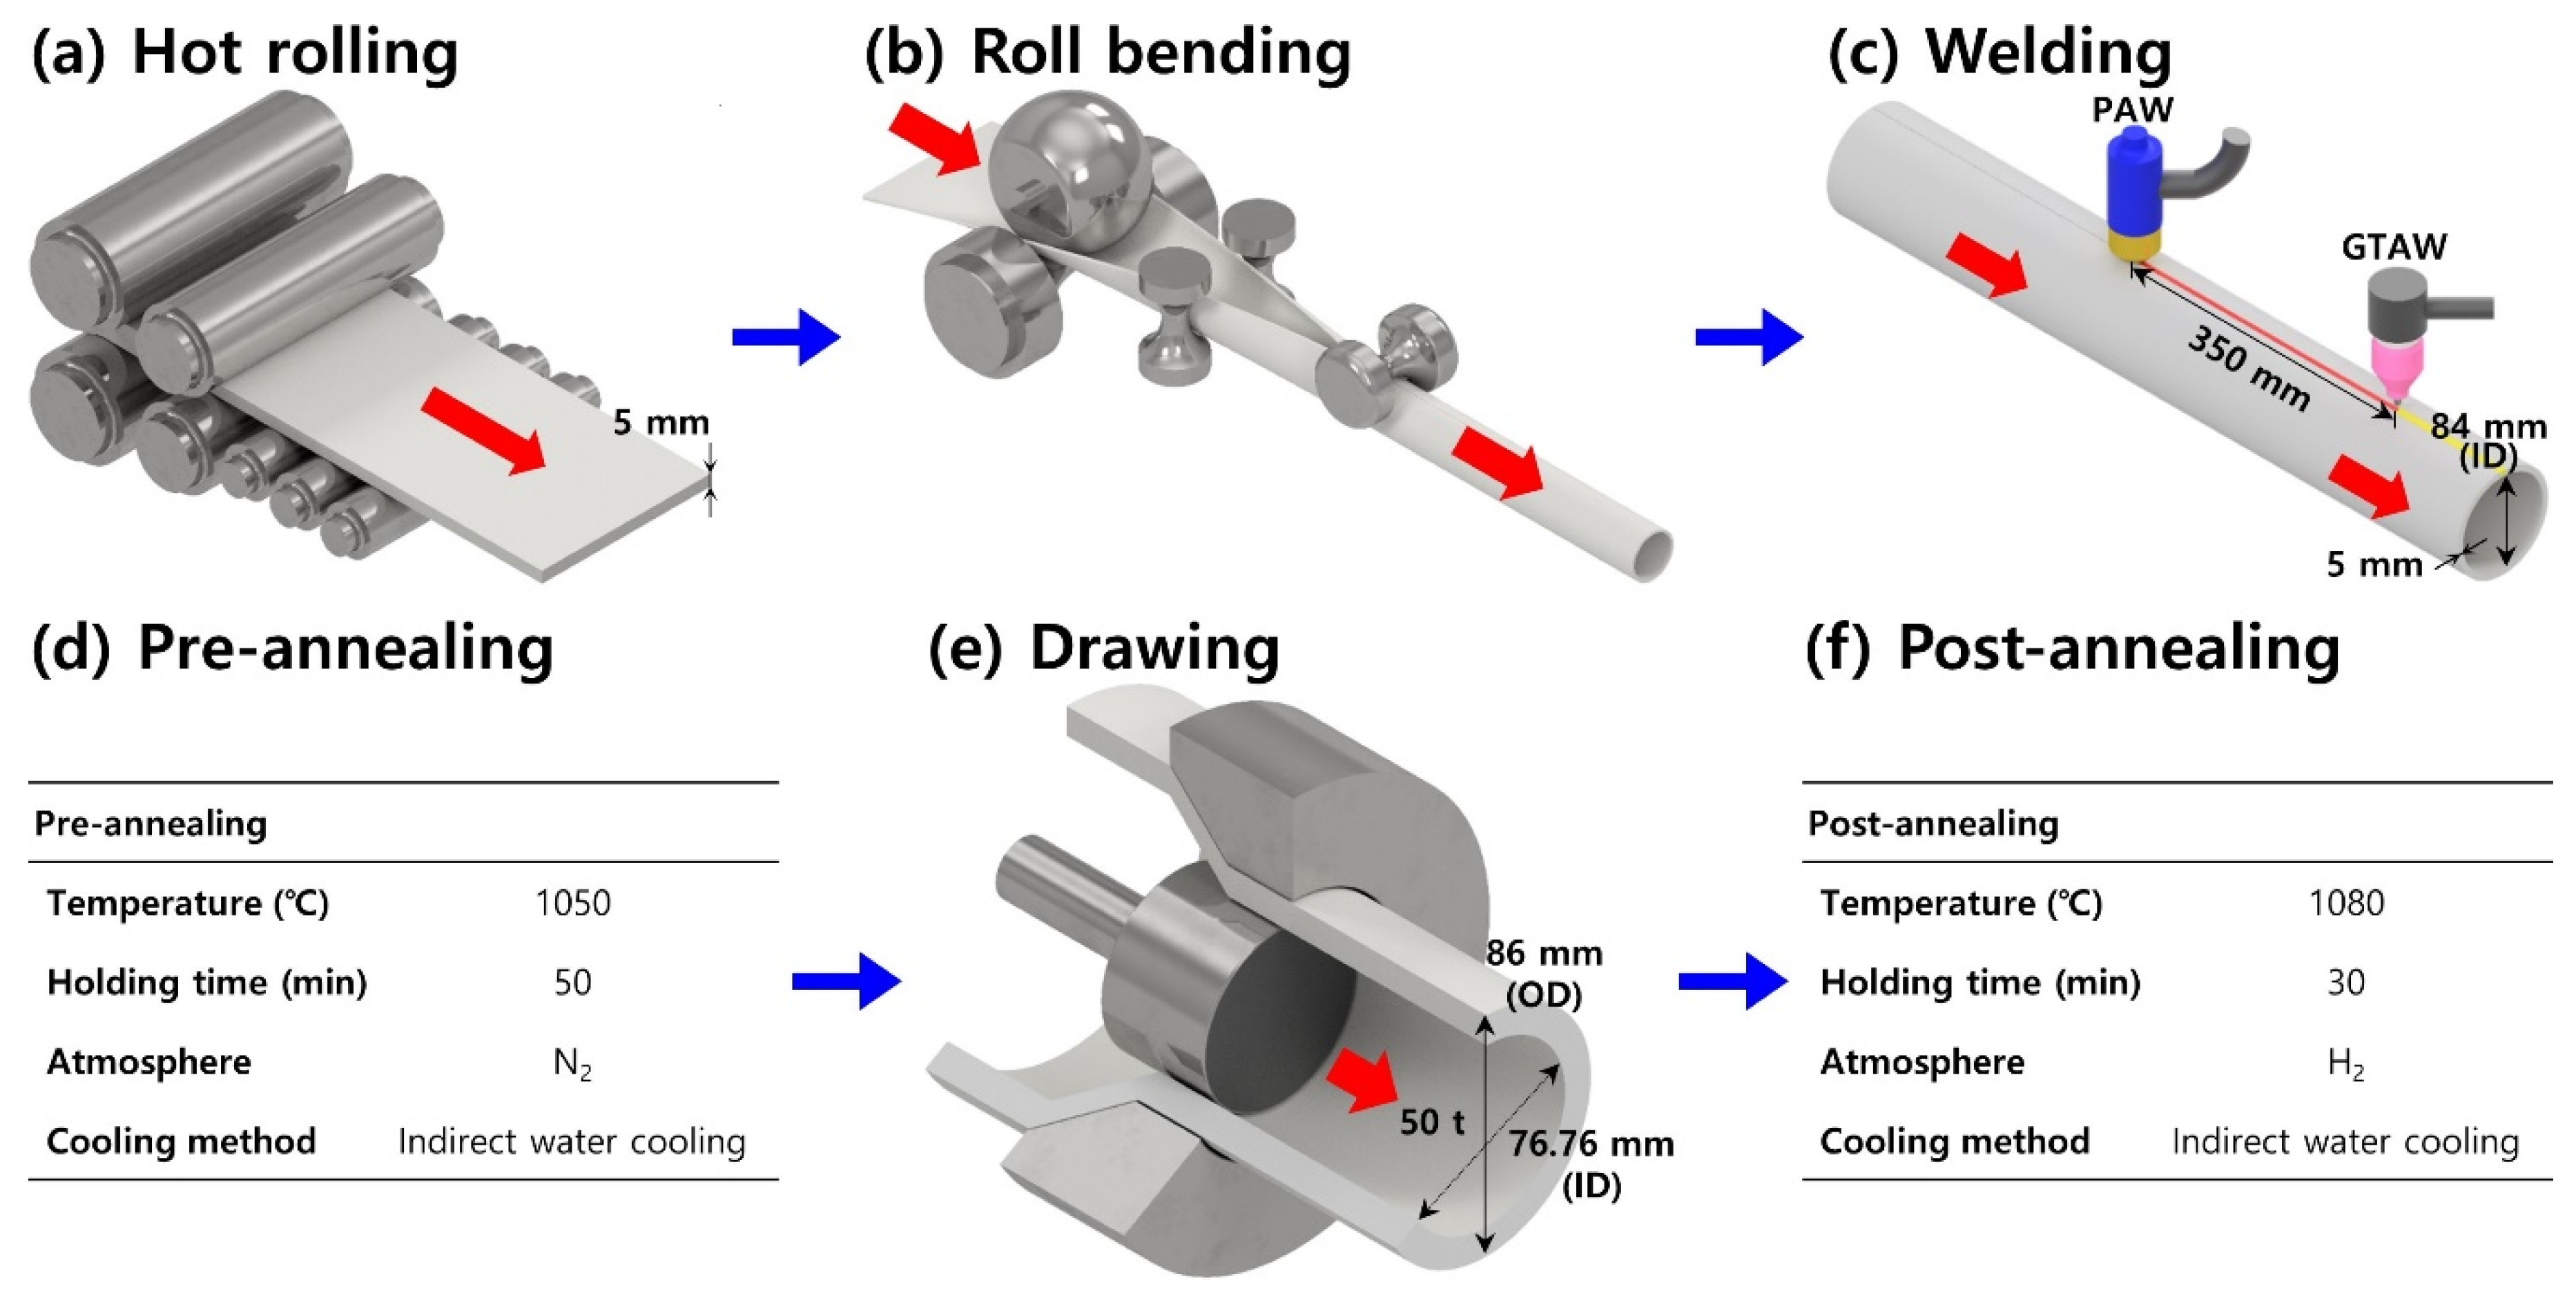
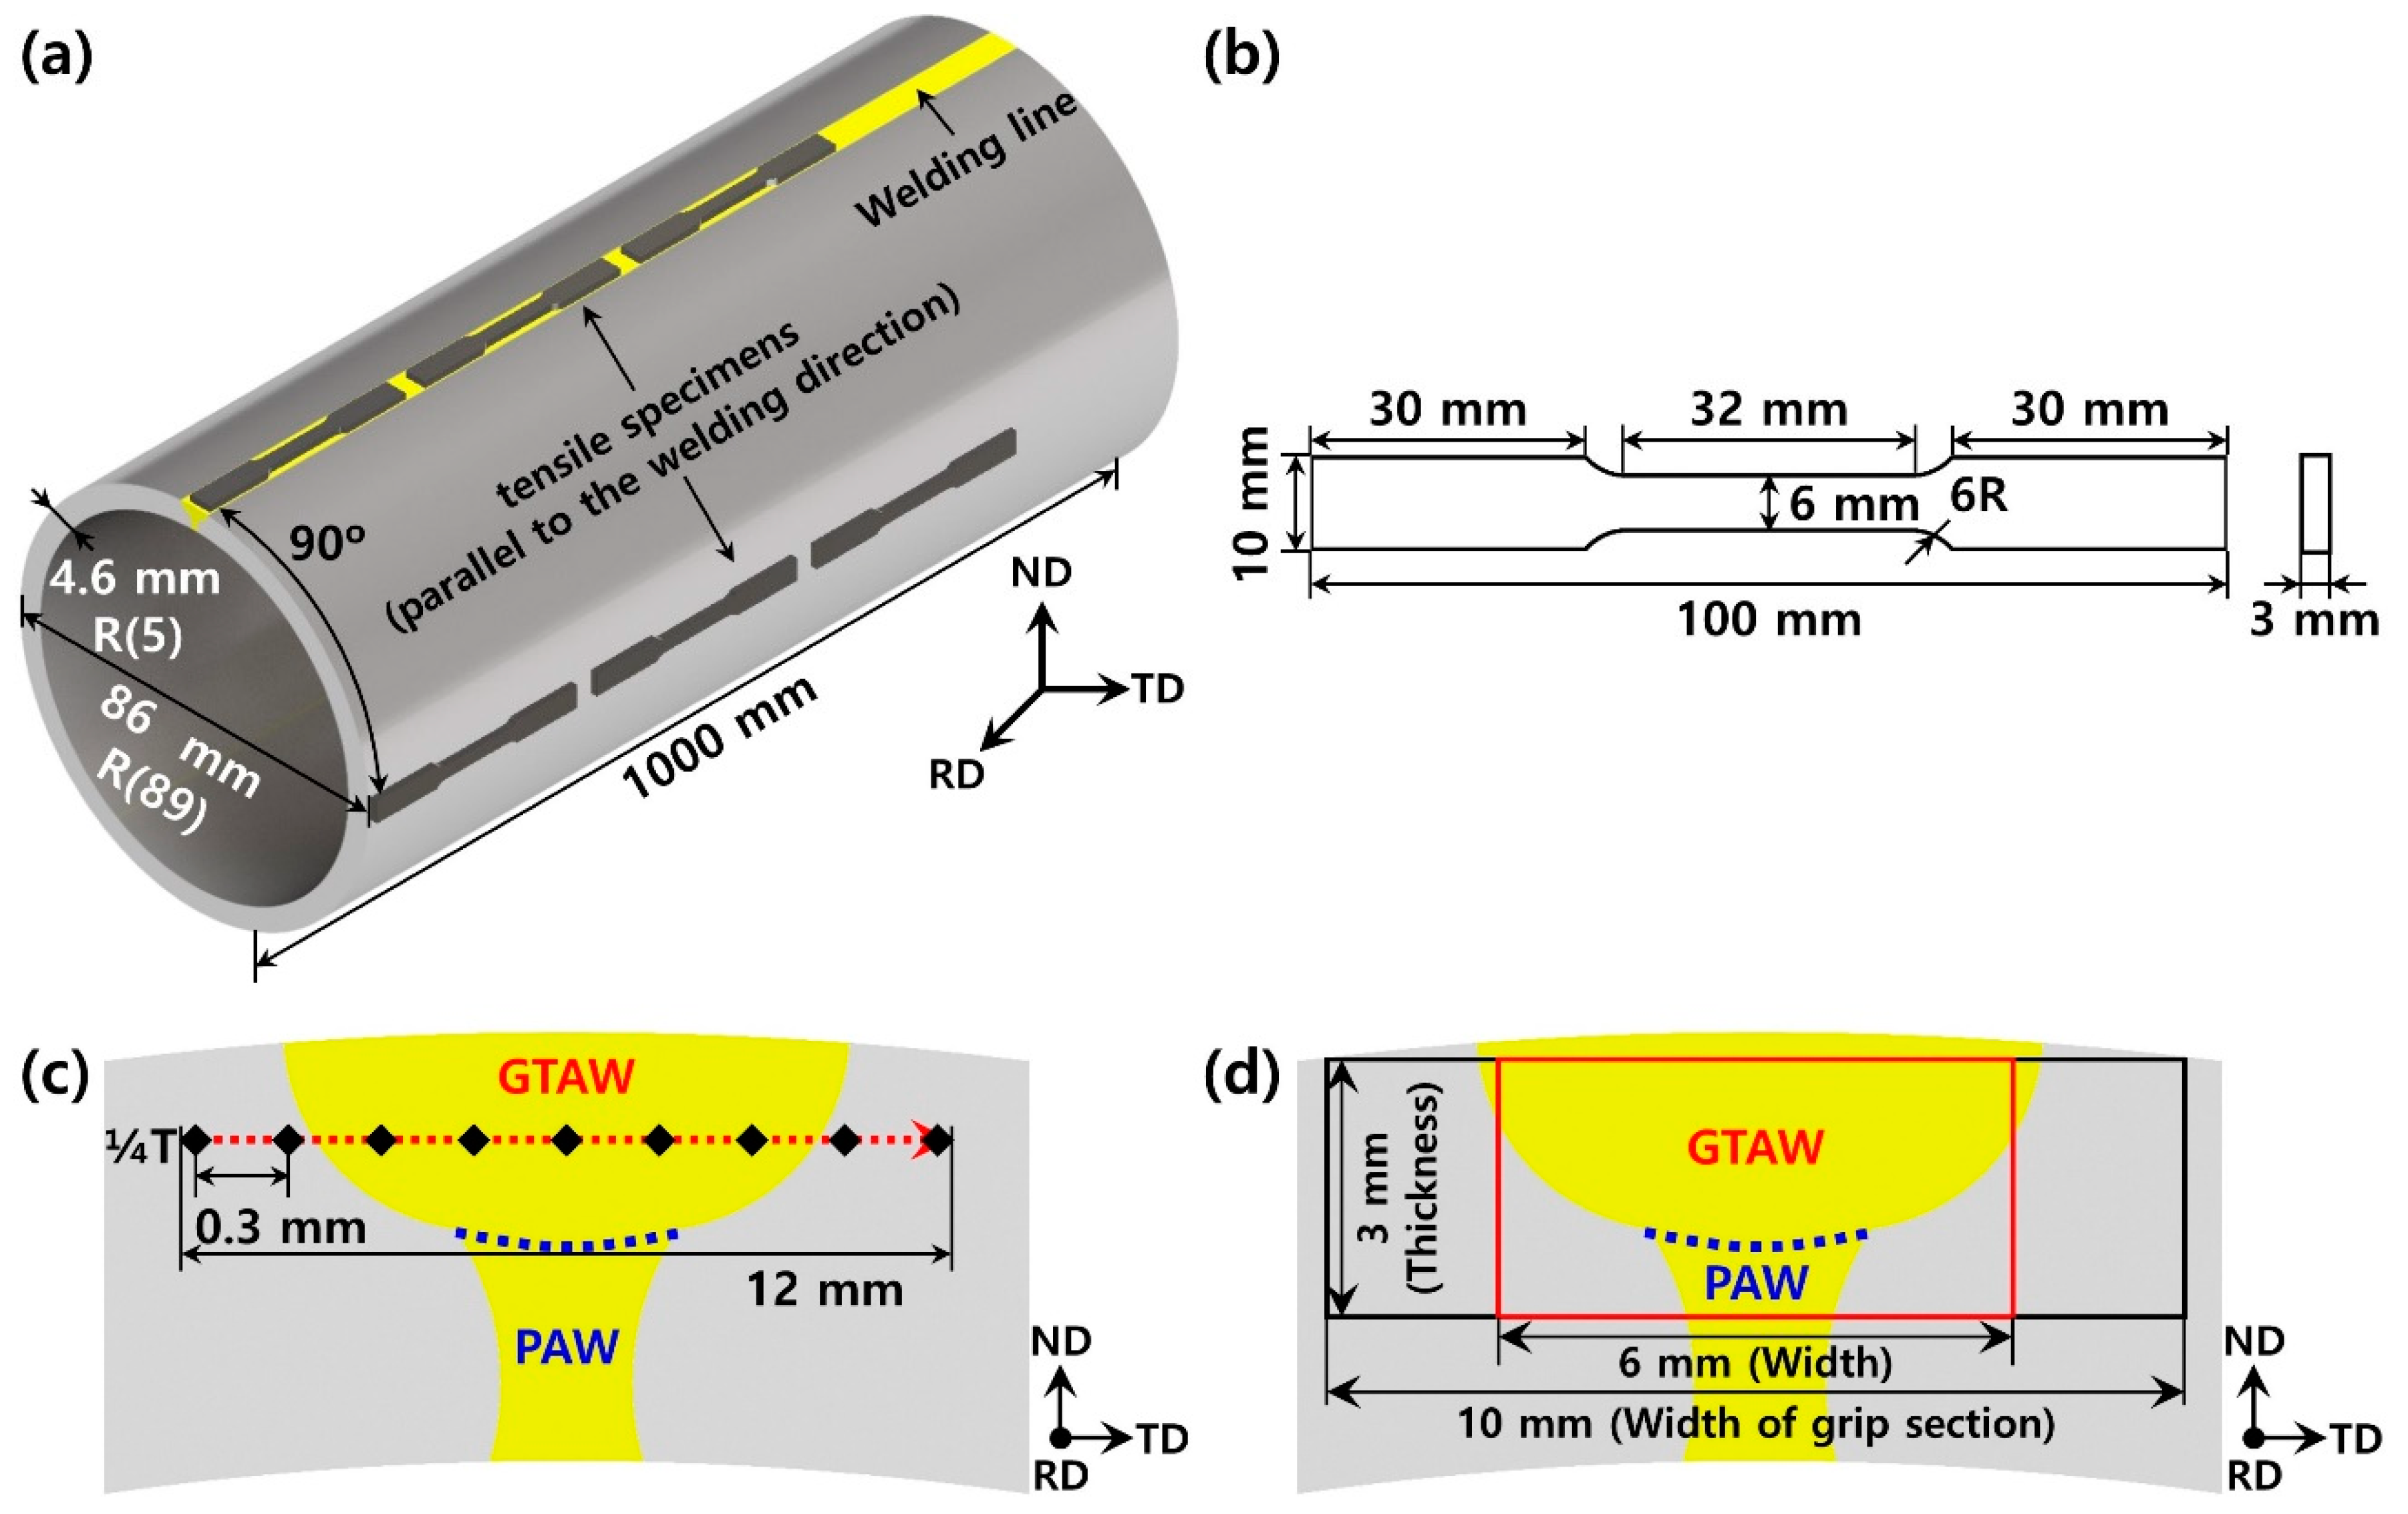
2.1. Material and Manufacturing of Welded Steel Pipe

The steel composition used in this study is shown in Table 1. Whole manufacturing processes of the steel pipe are summarized in Figure 1. Steel ingot was hot-rolled to a thickness of 5 mm, then roll-bended to form a steel pipe that had an inner diameter of 84 mm. Key-hole welding was performed as the root pass with plasma arc welding (PAW), and GTAW was performed as regular welding (Table 2) without using welding wire. Because welded volume by PAW was much smaller (10% that of GTAW), all characterizations on the weld metal and heat-affected zone (HAZ) were focused on the material volume welded by GTAW. The steel was then pre-annealed at 1050 °C for 50 min to reduce internal stress generated during roll forming, welding, and drawing (Table 3). Following this, the drawing process (Table 4) was implemented to make a drawn steel pipe that had an inner diameter of 76.76 mm. To control properties of the drawn steel pipe, post-annealing was performed at 1080 °C for 30 min (Table 3). To understand the effect of each process on evolution of the microstructure and mechanical properties, the specimens were taken from each of the manufacturing processes and were named as shown in Table 5.

2.2. Microstructural and Mechanical Analysis

To observe the microstructure of the weld zone, specimens were mechanically polished, then etched using 5% NHO3 + ethanol for 50 s. X-ray diffraction (XRD) measurements were performed using an X-ray diffractometer (ULTIMA4, Rigaku, Tokyo, Japan) with a Cu target, over a measurement range of 30° ≤ 2θ ≤ 110°. To determine how deformation affected equilibrium phase, orientation of grains, grain size and twinning behavior, electron backscattered diffraction (EBSD, Nanoanalysis, Oxford instrument, Oxford, UK) analysis were performed using a field emission scanning election microscope (FE-SEM, JEOL 7200F, Tokyo, Japan). Here, average grain diameter was calculated from grain area which is the sum of all pixels within the grain by using post-processing software (Channel 5, version 5.12, Oxford instrument, Oxford, UK). Segregation of Mn was analyzed using energy-dispersive X-ray spectroscopy (EDS, NanoAnalysis, Oxford instrument, Oxford, UK). According to ASTM E92-17, a Vickers hardness test was conducted at a load of 2.94 N with an indentation spacing of 300 μm, which is wider than 2.5 times the diagonal indentation length (Figure 2c). The uniaxial tensile test applied strain rates ε ˙ = 10−3 or 10−1 /s on a tensile specimen with a gauge length of 25 mm and a thickness of 3 mm (Figure 2b) and was prepared according to ASTM E8-Subsize.

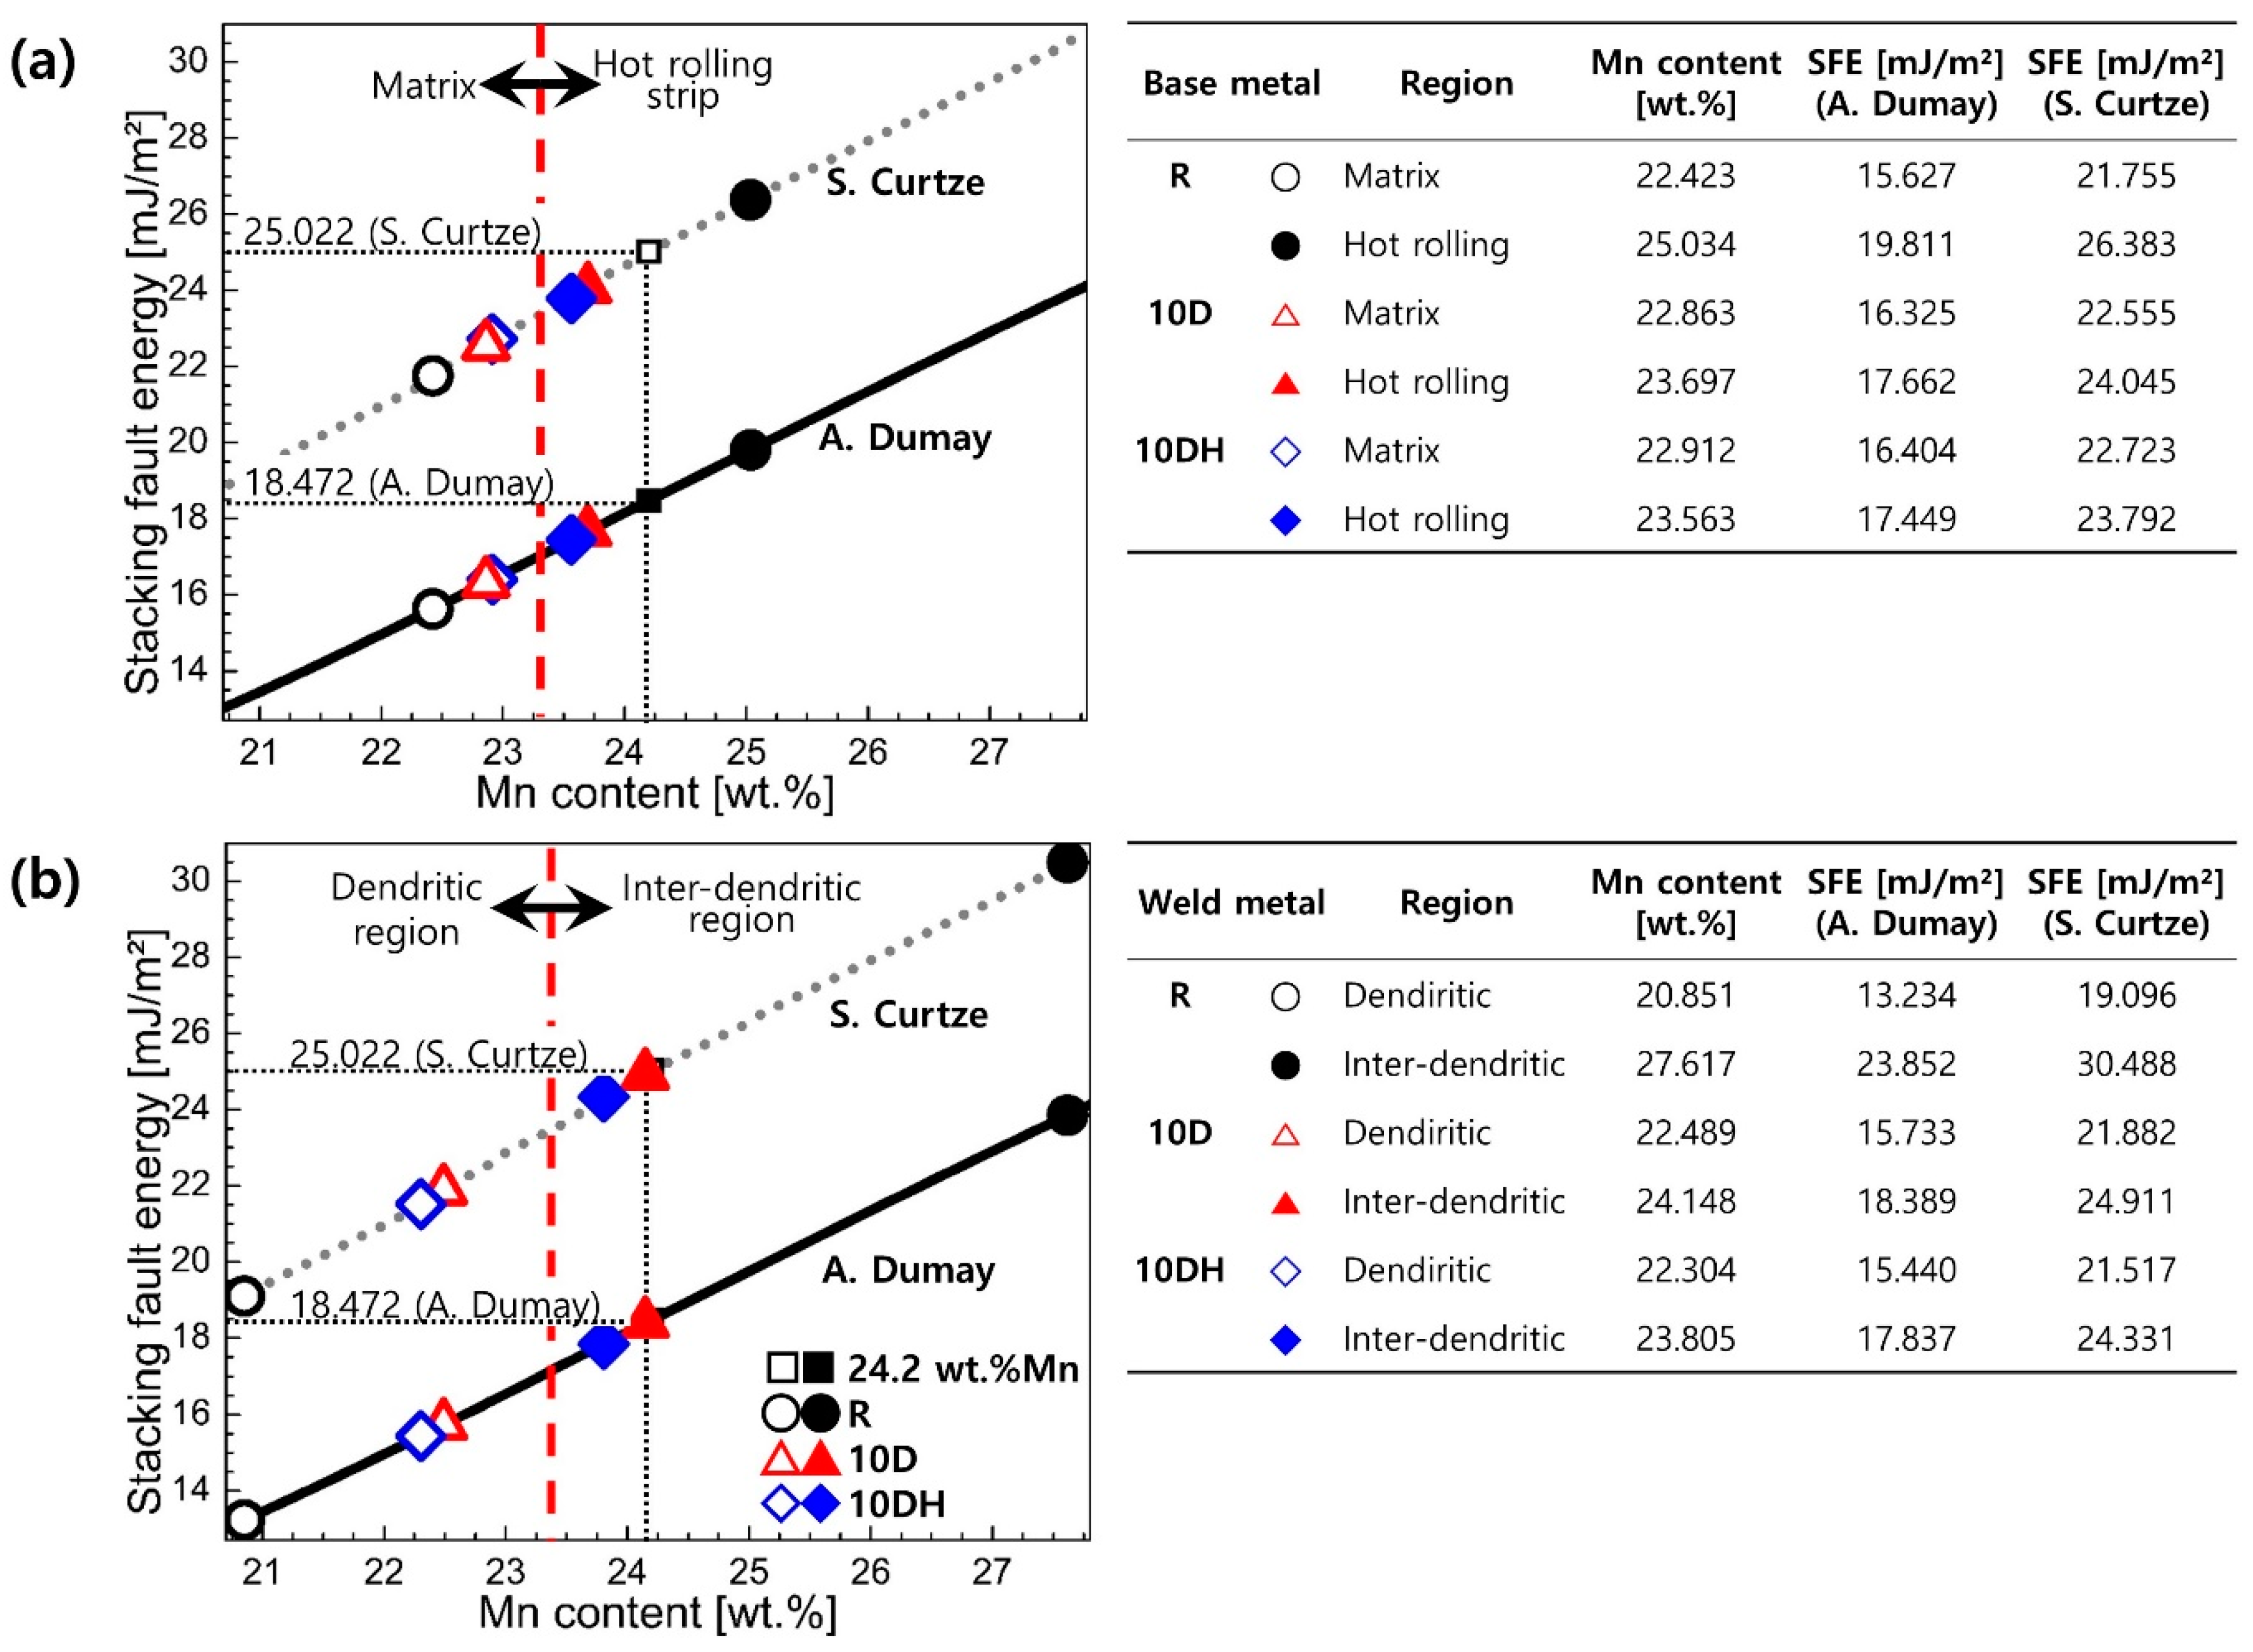
2.3. Stacking Fault Energy Calculation

Thermodynamic calculation of stacking fault energy (SFE) was performed as in [27]. The stacking fault can be modeled as two atomic layers of ε-martensite within the dense planes [28]:
S F E = 2 ρ Δ G γ ε + 2 σ γ / ε ,
where Δ G γ ε is the free molar enthalpy of transformation from austenite ( γ ) to ε-martensite ( ε ), ρ is the molar surface density of atoms in the [29] plane, and σ γ / ε is the interfacial energy per unit area of the phase boundary. Various thermodynamic methods have been used to calculate Δ G γ ε and in this study two equations [29,30] were applied because they use different methods to calculate the chemical contribution of alloy elements to phase transformation in Δ G γ ε . Dumay et al. [29] defined
Δ G γ ε = Δ G F e M n X γ ε + x C Δ G F e M n X / C γ ε + Δ G m g γ ε ,
and Curtze et al. [30] defined
Δ G γ ε = i x i Δ G i γ ε + i j x i x j Ω i j γ ε + Δ G m g γ ε + Δ G s e g ( i n t ) γ ε ,
where x C Δ G F e M n X / C γ ε , and i j x i x j Ω i j γ ε are empirical laws of carbon effect. Δ G s e g ( i n t ) γ ε , which is the bulk and segregation contribution by N, was not considered.

3. Results and Discussion
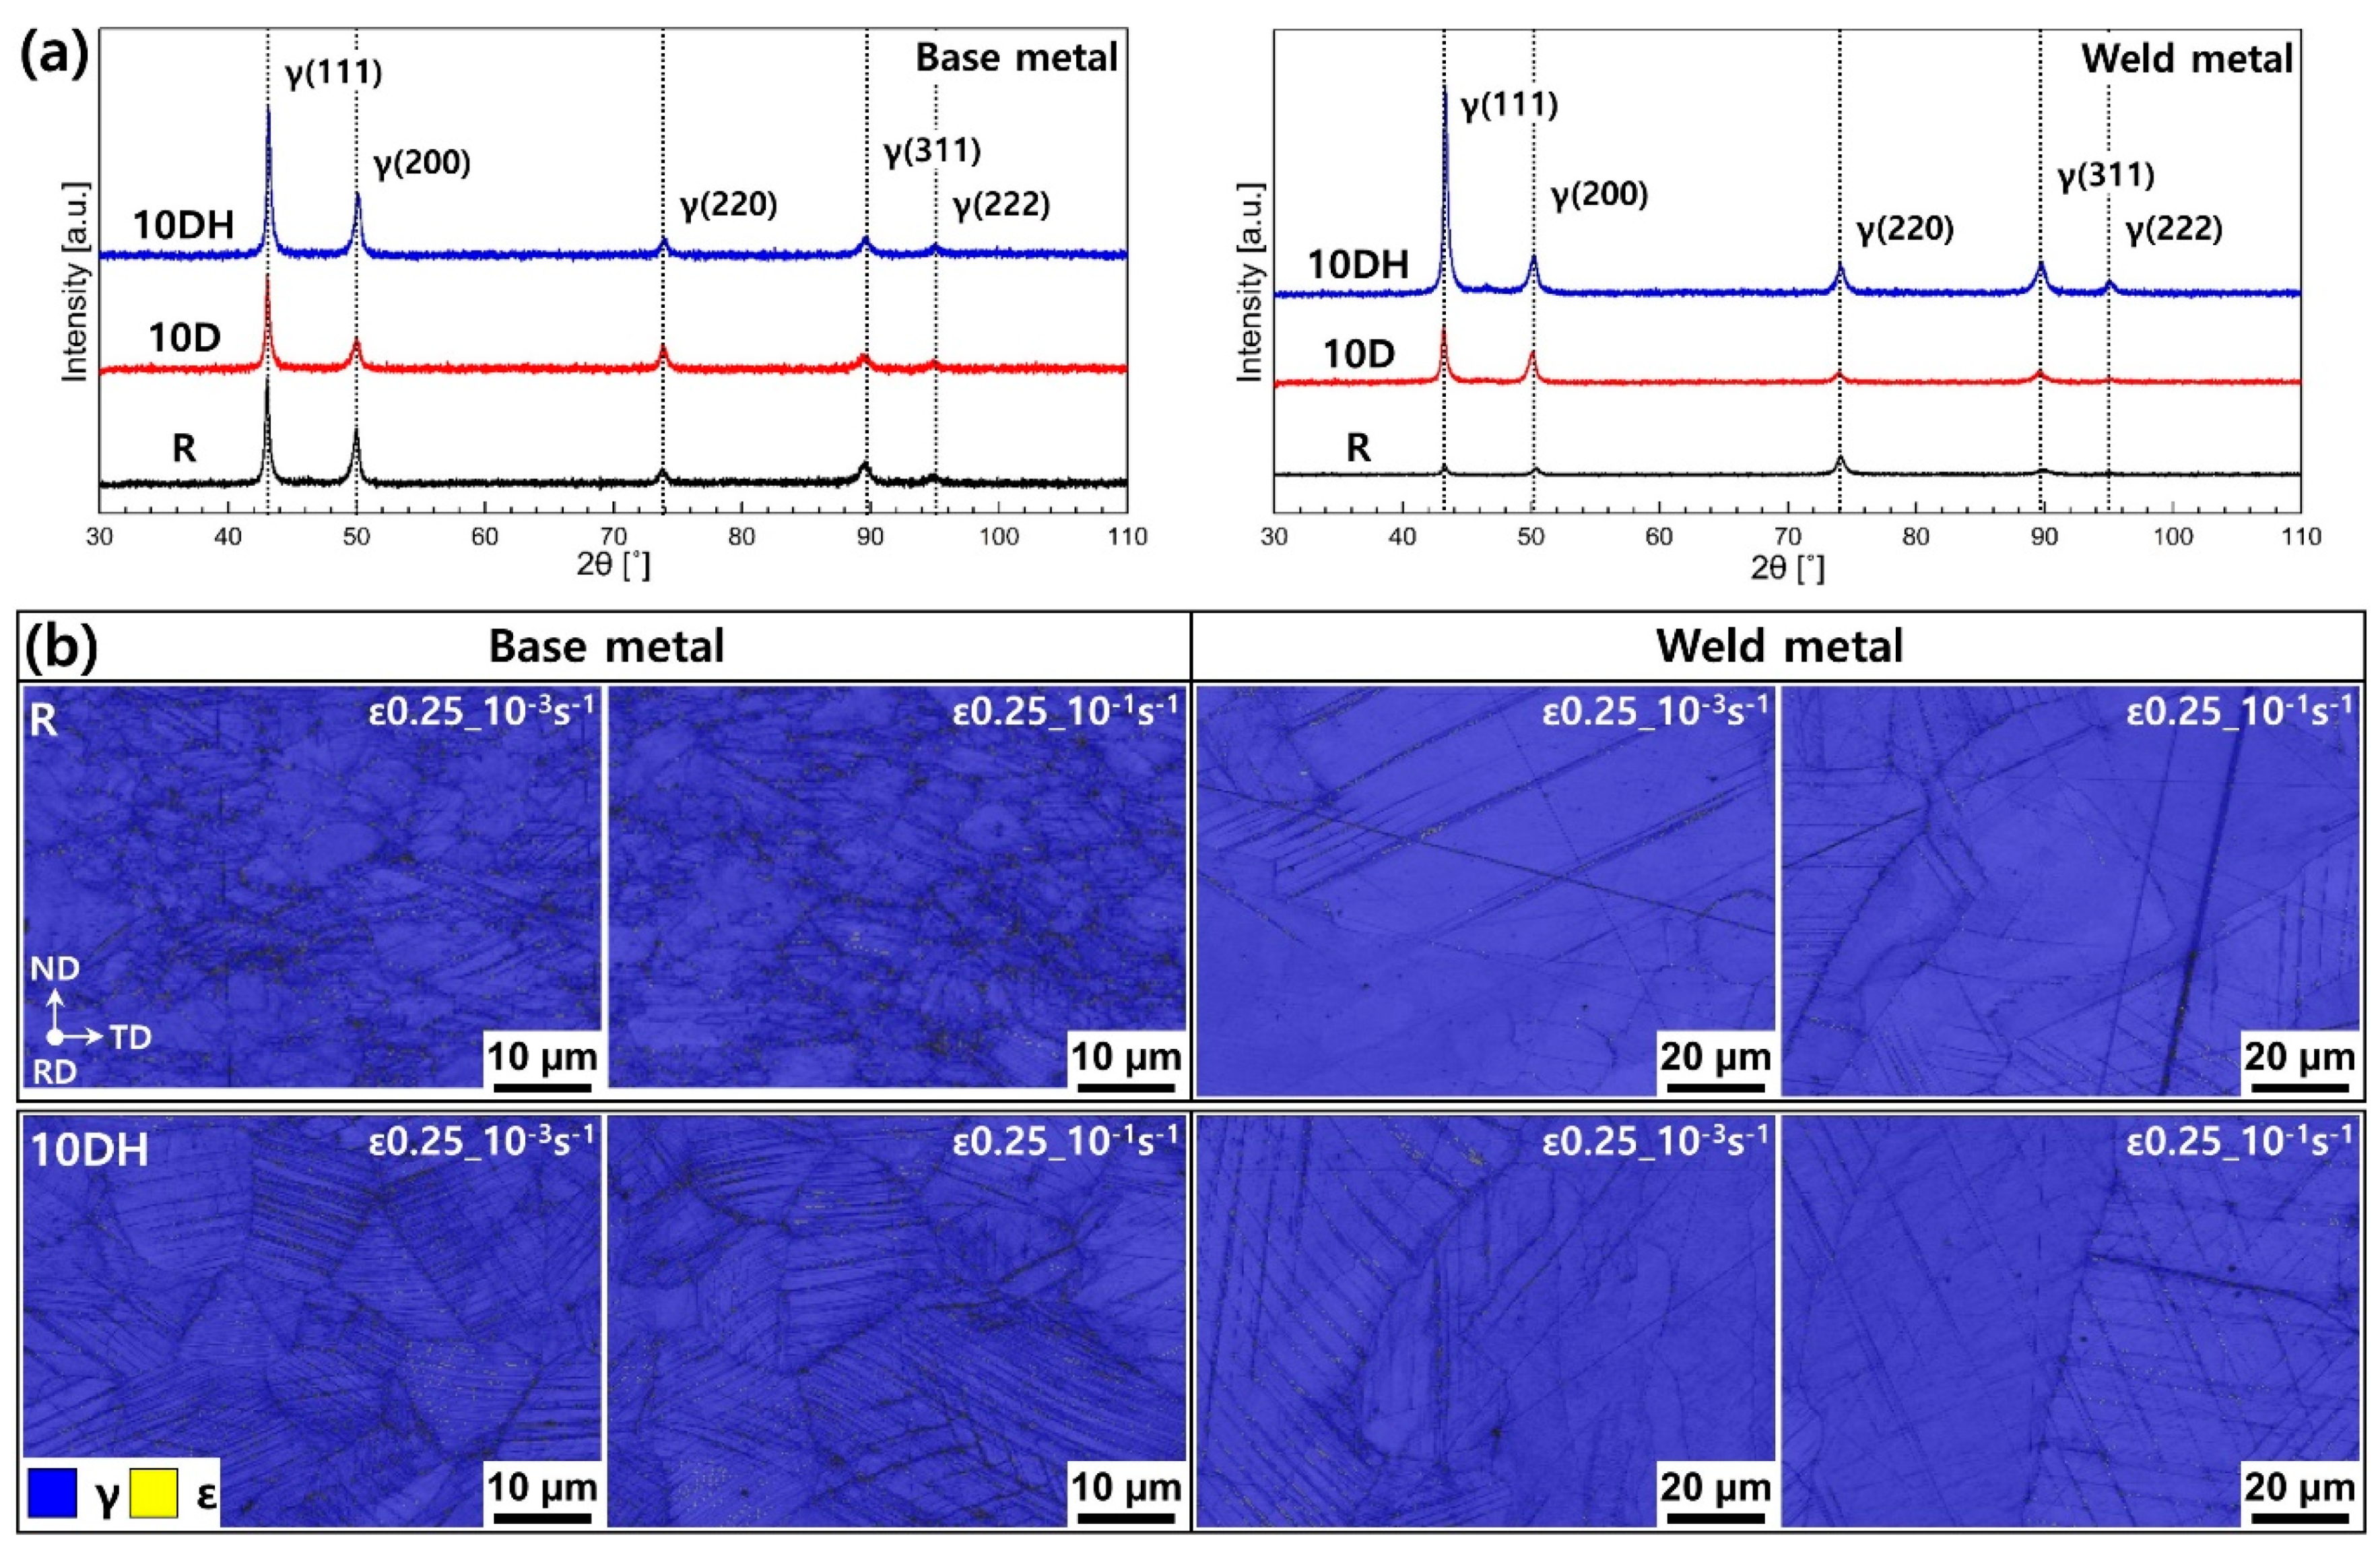
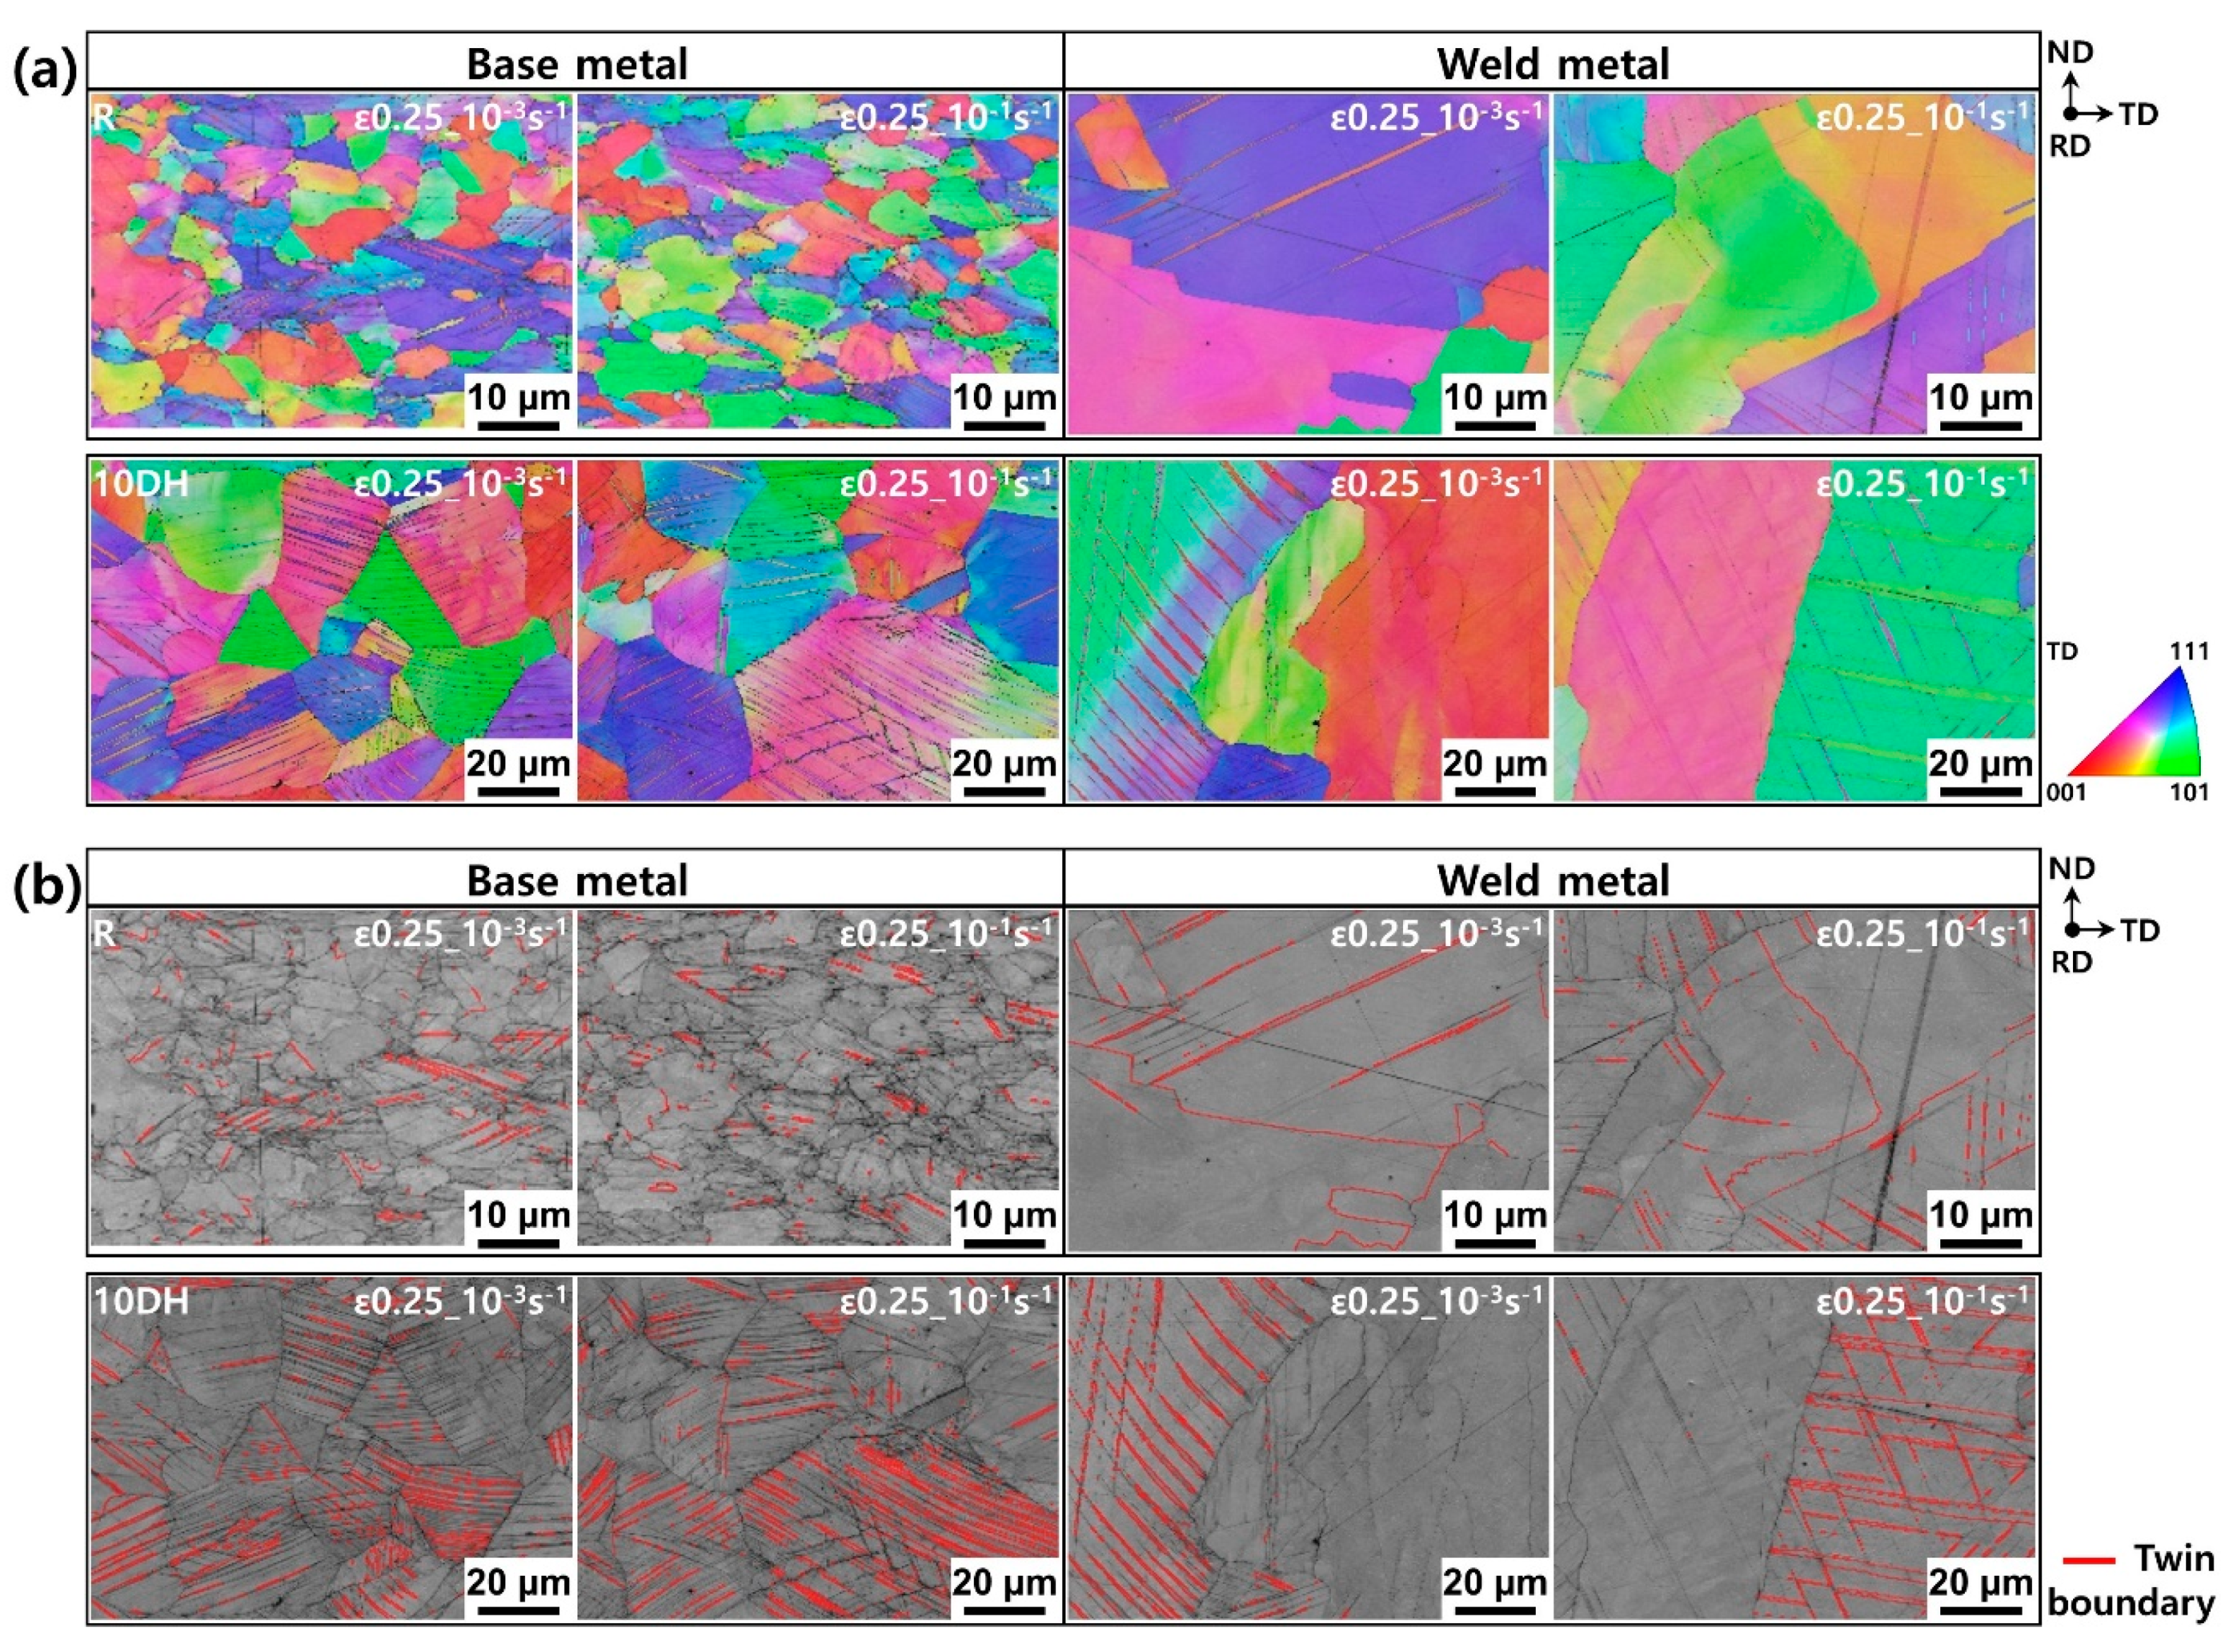
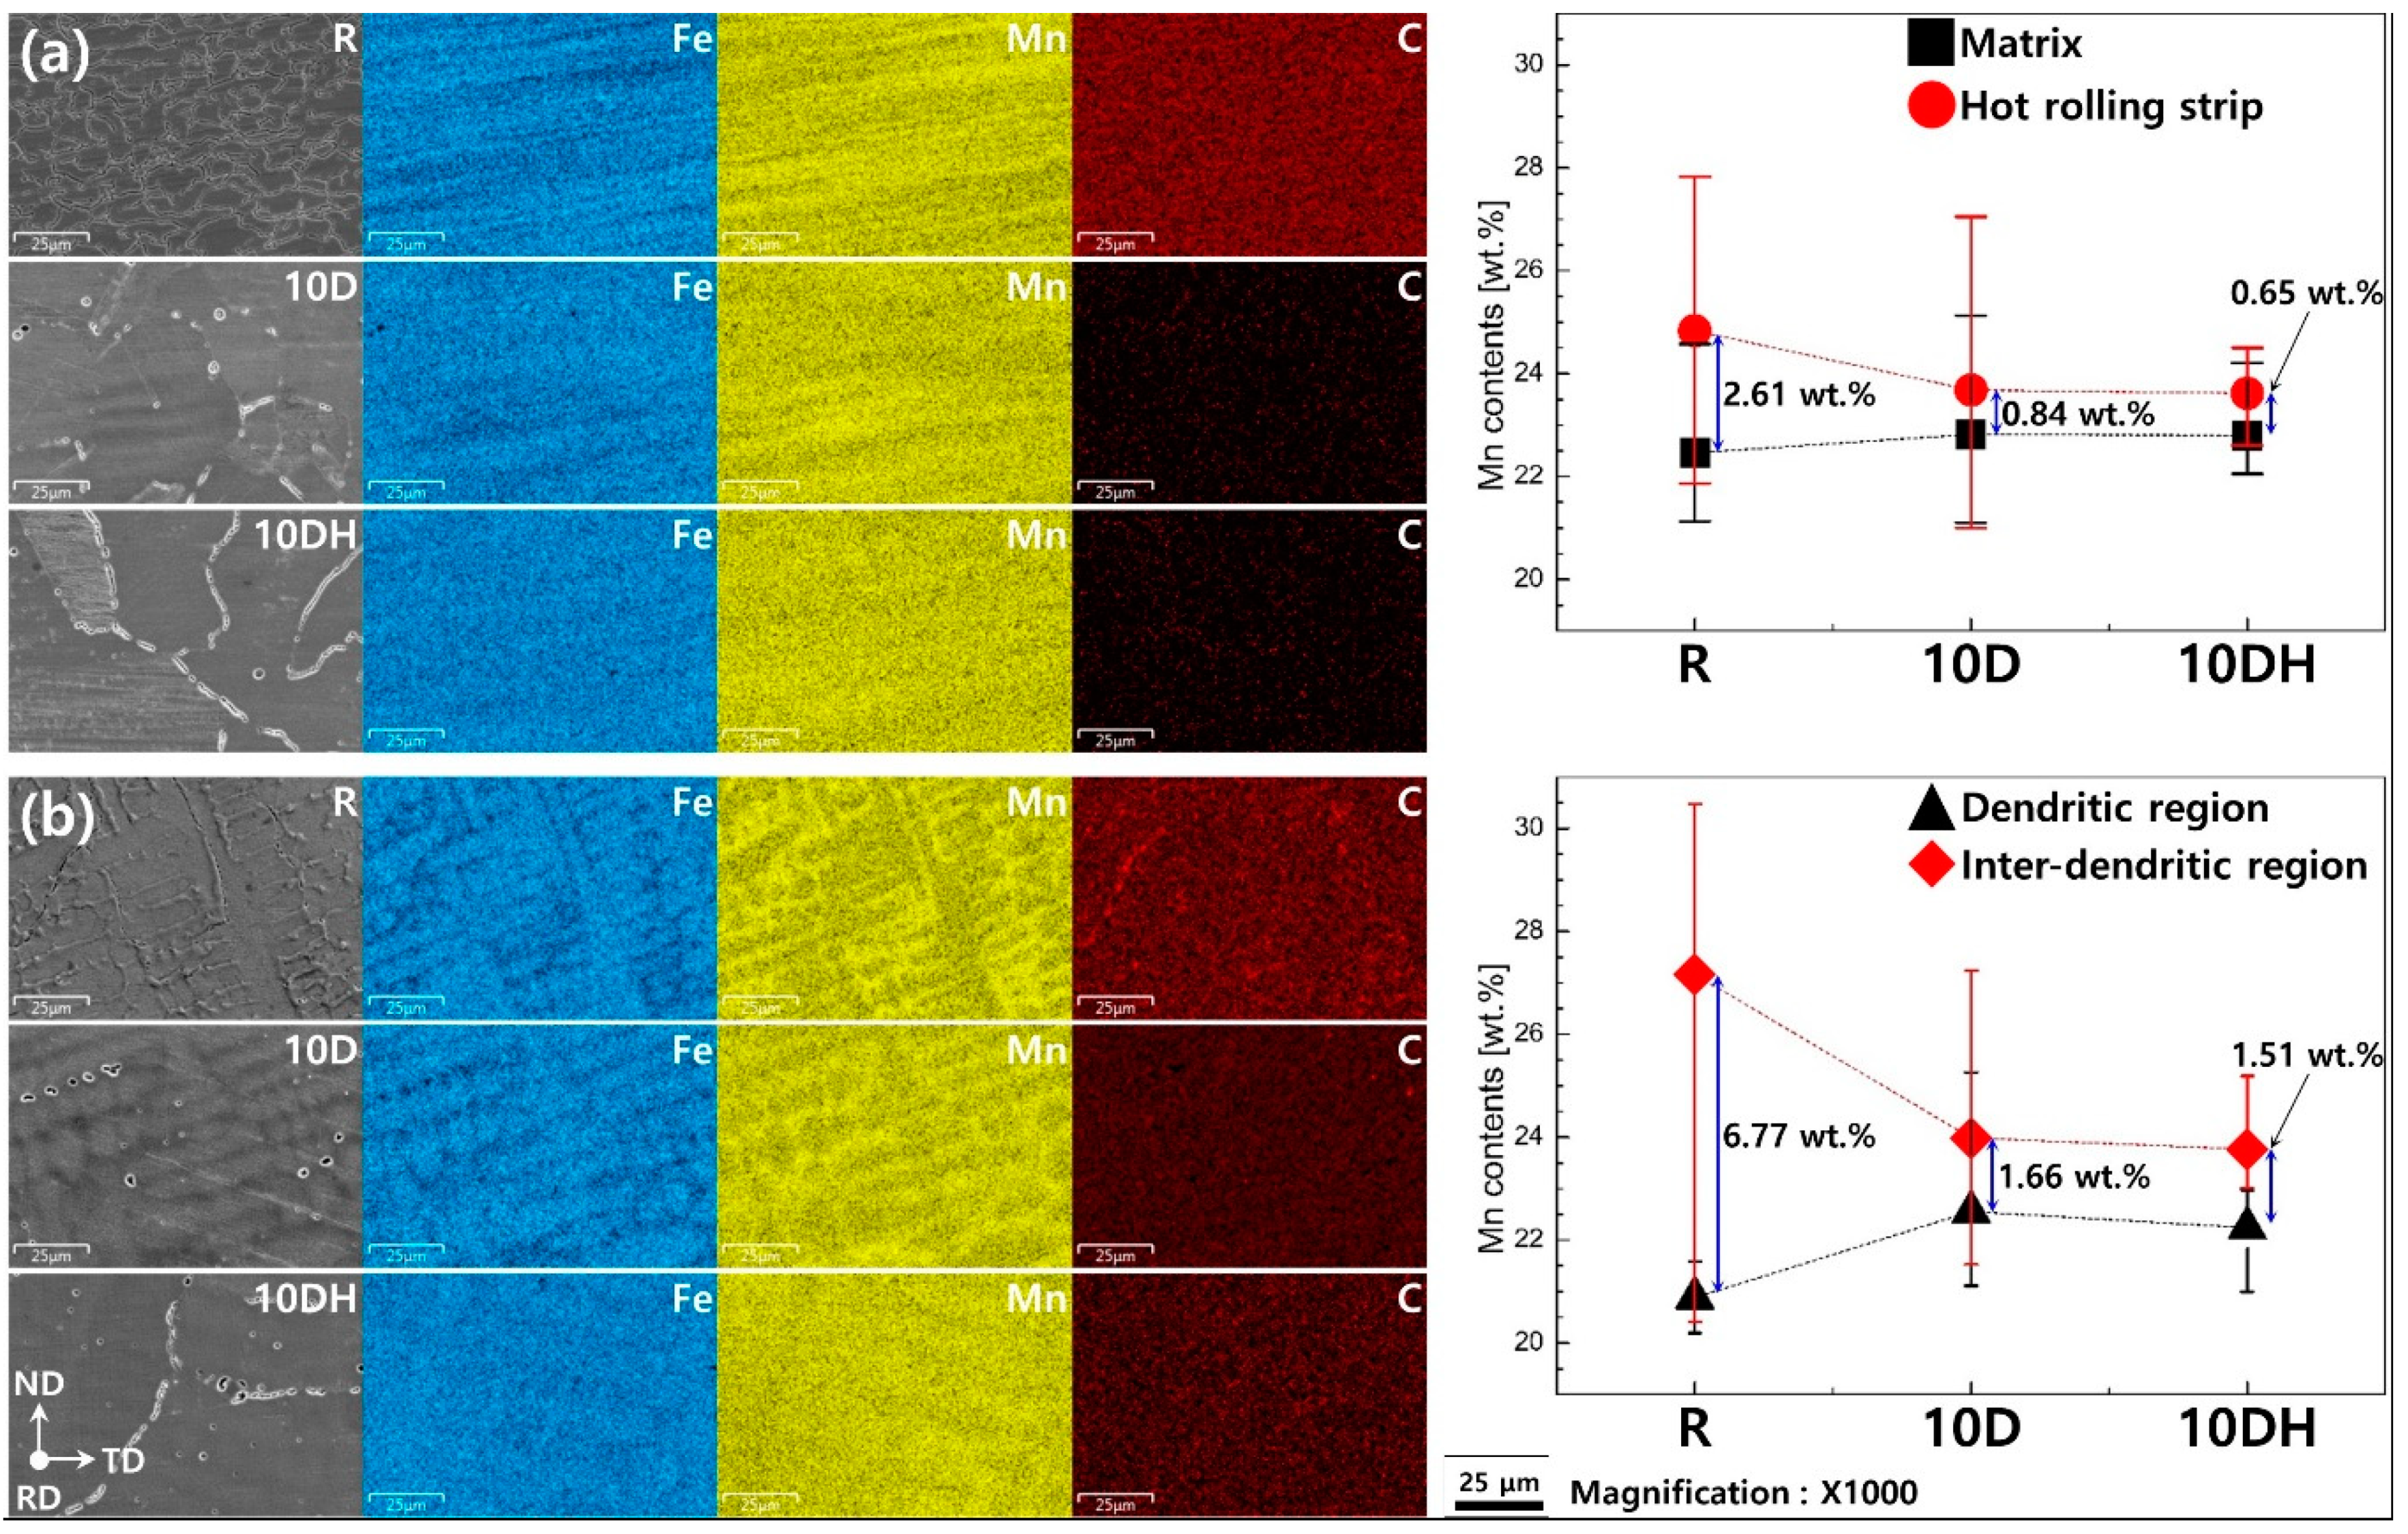
3.1. Microstructure

The three samples of pipes R, 10D, and 10DH had distinct microstructures of base metal and weld metal (Figure 3). Pipe R had an average grain size of 7.1 μm in base metal and had hot-rolling strips parallel to the rolling direction formed during the hot-rolling process. Welding heat induced grain growth in the heat-affected zone to a maximum of 66.8 μm. The weld metal had coarse dendrite heading to the heat source direction as marked as black arrows in Figure 3a. In pipe 10D, pre-annealing at 1050 °C induced recrystallization in the base metal, and the average grain size increased to 33.8 μm, whereas no feasible recrystallization and grain growth were observed in the weld metal. This may have occurred because the recrystallization temperature was lower in the base metal, due to accumulated plastic strains during the roll-bending process, than in the weld metal. The following drawing process induced deformation twins in all regions. In contrast to pipe 10D, pipe 10DH showed fully recrystallized microstructures in the weld zone, in a way that columnar dendritic grains were clearly recrystallized into equiaxed grains and showed an average grain size of 112.7 μm. The base metal and HAZ also had coarse grains due to grain growth driven by post-heat treatment. Additionally, the deformed microstructure, such as deformation twins already observed in the pipe 10D, was removed by a recovery process.
Microsegregation occurs on solidification during welding and leads to Mn enrichment of the liquid phase [17]. Moreover, Mn depletion may occur during welding because vapor pressure of Mn increases significantly at high temperatures. In other words, Mn composition in the weld zone may differ from the nominal composition of the present alloy. EDS analysis indicated that segregation of Mn occurred in the interdendritic region of the weld metal and in hot-rolled strips of the base metal (Figure 4). Mn segregation was more severe in the weld metal than in the base metal, and segregation was decreased by heat treatment.
In the base metal of pipe R, the EDS result revealed that Mn content of the hot-rolling strip, 25.03 wt.%, was 2.61 wt.% higher than that of the matrix, 22.42 wt.%. After pre-annealing (pipe 10D), the corresponding difference of Mn content between the matrix and hot-rolling strip diminished to 0.84 wt.%, caused by thermally driven Mn diffusion. Moreover, after further post-annealing (pipe 10DH), the difference became smaller, 0.65 wt.% (Figure 4a). Likewise, Mn content of the dendrite and interdendritic region in the weld metal showed a smaller difference after pre- and post-annealing. The difference of Mn content in the weld metal of pipe R was 6.77 wt.% and was reduced to 1.66 wt.% (pipe 10D) and 1.51 wt.% (pipe 10DH) through pre-annealing and post-annealing, respectively.
By successive heat treatments, Mn segregation in the base and the weld metal was weakened, and compositional homogeneity of Mn was improved. However, Mn was not completely homogenized after heat treatments, and the difference of Mn content in the weld metal was almost twice higher than that of the base metal regardless of heat treatments. It indicates that Mn-segregated regions in the weld metal would have different SFE. It can be further inferred that the difference of SFE may change the stable phase in the as-welded state and the mechanism during deformation. It is thus worth calculating the effect of Mn segregation on SFE difference in the weld metal [1,3,19].
Figure 5 shows the calculated SFE in Mn-enriched and depleted regions. SFE was calculated using Dumay’s and Curtze’s models, and both models have been developed to account for all substitutional alloying elements such as Fe, Mn, Cr, Ni, etc. in the high-Mn steel [29,30]. In this study, Mn content, required from the models, was experimentally obtained by EDS analyzes and the contents of other alloying elements remained fixed as depicted in Table 1.
Mn-enriched regions had higher SFE than SFE of Mn-depleted regions, and the difference of SFE between those regions in the weld metal was higher than that of the base metal. The weld metal of pipe R showed the highest difference of SFE between those regions, and the difference decreased through successive pre- and post-annealing processes.
Based on Dumay’s model, SFE of the matrix and the hot-rolling strip in base metal were 15.627 and 19.811 mJ/m2, respectively, as shown in Figure 5. The difference of SFE between both regions was 4.184 mJ/m2. With pre- and post-annealing processes, the difference of SFE decreased to 1.045 mJ/m2. Similarly, Curtze’s model also predicted higher SFE in the hot-rolling strip than in the matrix. On the other hand, the weld metal showed a larger difference in SFE between the Mn-enriched region and Mn-depleted region than that of the base metal. Based on Dumay’s model, SFE of dendrite and interdendritic region were 13.234 and 23.852 mJ/m2, respectively, and the difference between both regions was 10.618 mJ/m2. This is the largest SFE difference in the Mn-enriched and depleted region among all specimens. The difference was reduced by Mn diffusion through pre- and post-annealing, but the difference in SFE of the weld metal was about twice that of the base metal. Likewise, Curtze’s model predicted higher SFEs of the Mn-enriched regions in the weld metal than those of the base metal due to stronger Mn segregation during the welding process as already shown in EDS analyzes. It can be inferred from both models’ predictions that lower SFE in the depleted region may induce ε-martensite during deformation, so phase analysis was required.
To identify formation of α’- or ε-martensite in the as-welded state and during deformation, XRD and EBSD analysis were performed, as shown in Figure 6. The base and weld metal in pipe R showed a full austenite single phase. The austenite phase remained unchanged with pre-annealing and drawing processes (pipe 10D) and the post-annealing process (10DH), as depicted in Figure 6a. To identify deformation-induced phase transformation, all pipes were deformed to 0.25 e with strain rates of 10−3 and 10−1 /s, and the EBSD phase analyzes revealed that no feasible phase transformation happened during deformation. These results were well matched with previous reports, which showed ε-martensite was not formed during deformation in high-Mn steels of 0.4C–22Mn [31] and 0.4C–25Mn [32]. Due to the aforementioned SFE decrease in the Mn-depleted zone, as shown in Figure 5, formation of ε-martensite during welding or deformation was a concern, but all pipes showed a full austenite single phase. It means that the presently employed welding process was properly chosen to avoid feasible Mn depletion for harmful ε-martensite formation in the weld metal.

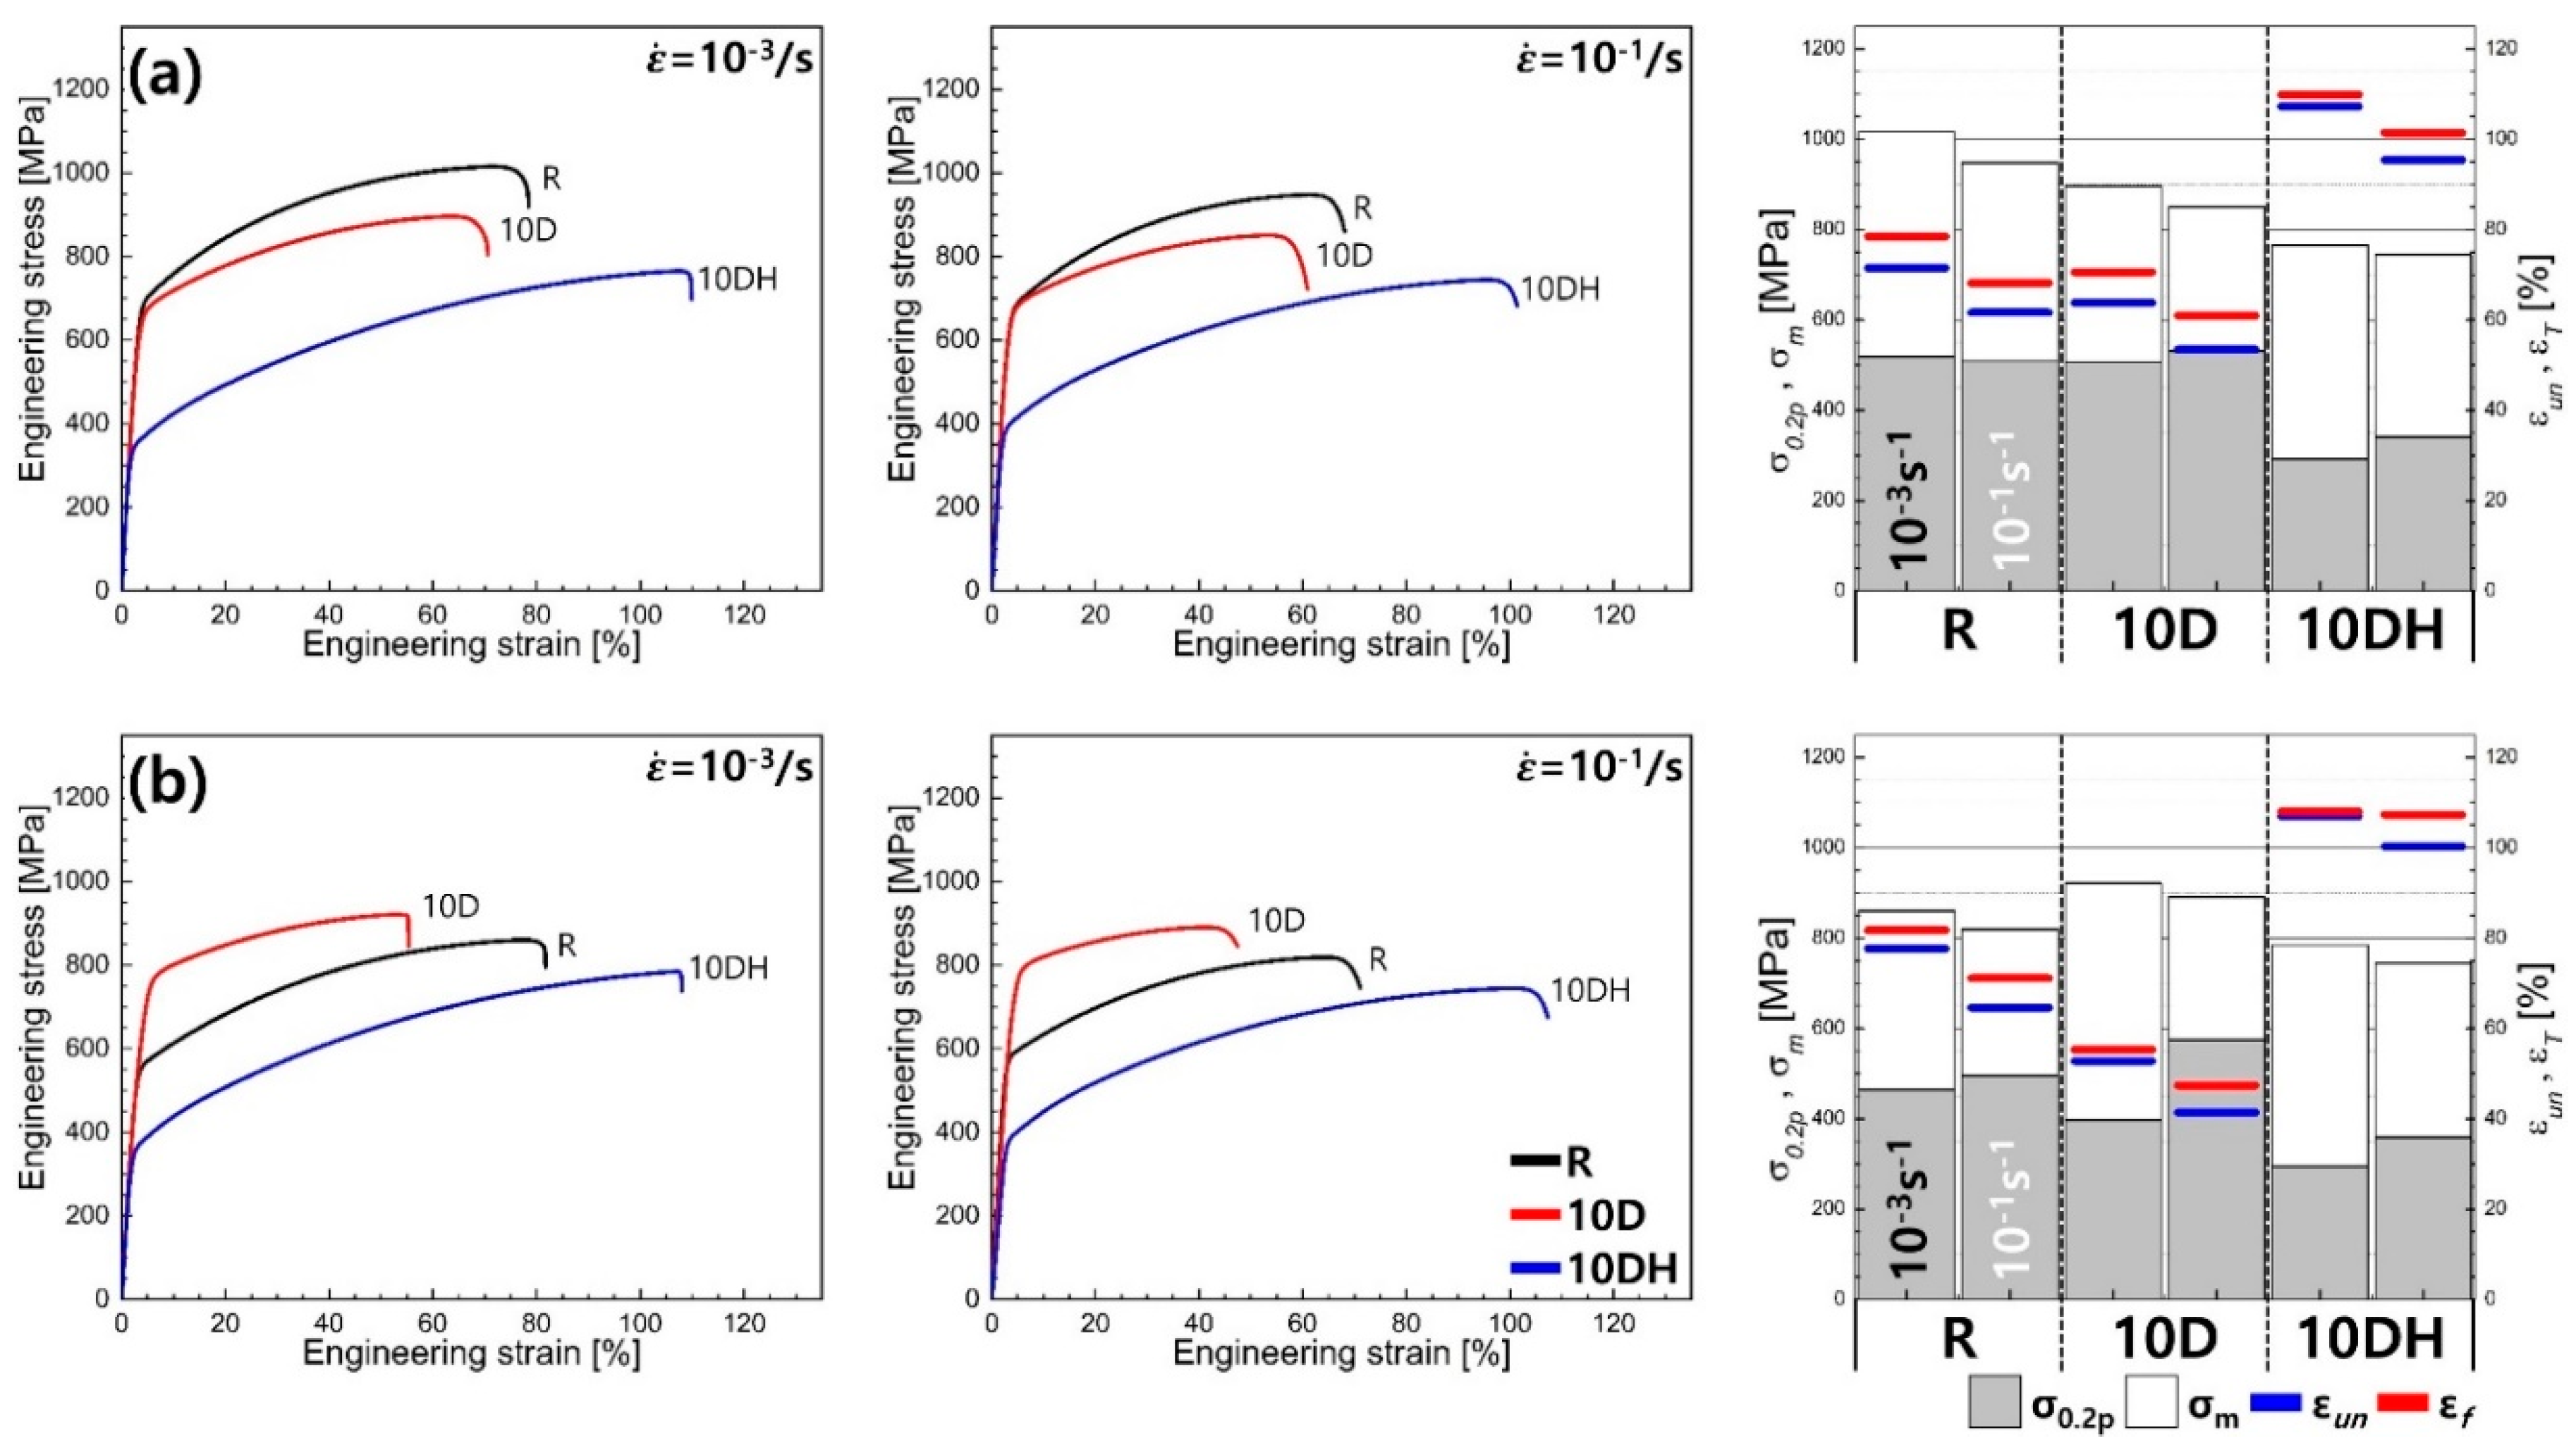
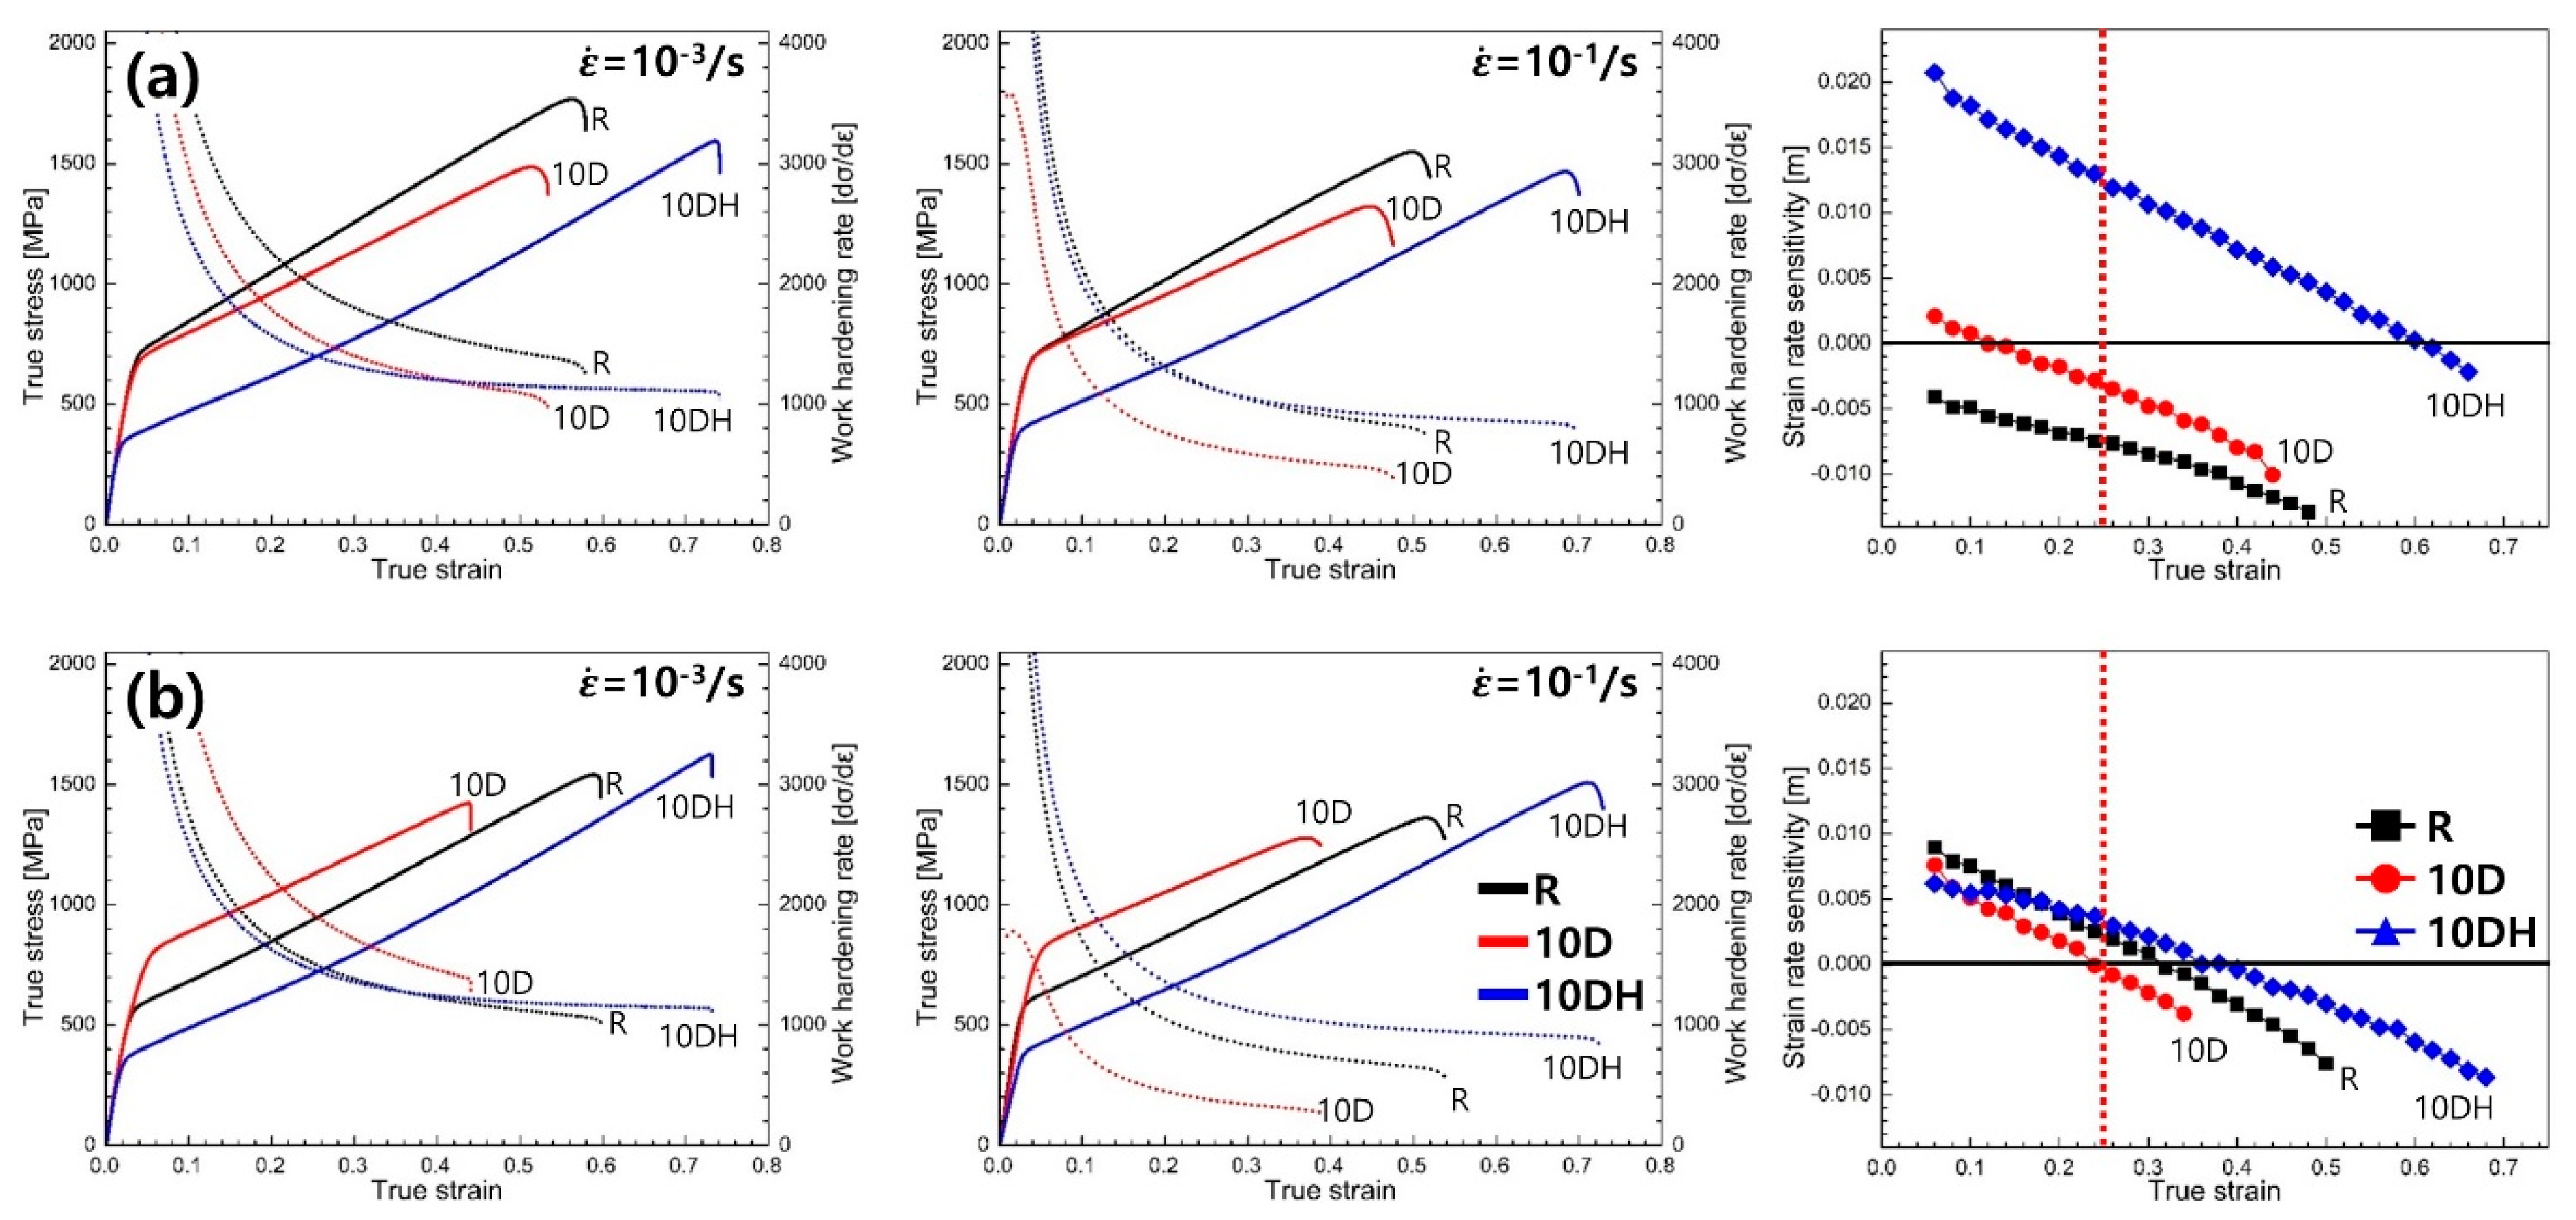
3.2. Mechanical Tests

Figure 7 shows Vickers hardness profiles measured along the base, HAZ, and weld metal. In pipe R, the hardness was found to be highest, 305 Hv, in the base metal and was attributed to its smallest grain size as shown in Figure 3a. The hardness was then decreased to 295 Hv in HAZ due to coarsened grains that were grown by welding heat affection. The weld metal showed lowest hardness, 260 Hv, owing to its largest grains that formed during solidification. In pipe 10D, on the other hand, the hardness was increased to about 300 Hv due to work-hardened grains formed by the drawing process. After post-heat treatment, the hardness in all regions reduced under 200 Hv because of stress relieving by recrystallization and grain coarsening, as depicted in Figure 3c.
Vickers hardness of pipes 10D and 10DH remained almost the same along the base, HAZ, and weld zone, while those of pipe R showed monotonic decrease of hardness along the direction. Despite the distinct grain size difference in the base, HAZ, and the weld zone in pipe 10D, as shown in Figure 3, hardness maintained almost the same because of work-hardening effects during the drawing process. In high-manganese steel, it is known that twinning stress decreases with increasing grain size, so the larger the grain size, the more work hardening may occur [2]. In pipe 10D, work hardening occurred during the drawing process, and the weld metal showed a higher work-hardening rate than that of the base metal, as shown in Figure 9. Therefore, the weld metal in pipe 10D showed similar hardness with the base metal due to work hardening by deformation twinning. In pipe 10DH, on the other hand, recrystallization and grain coarsening occurred due to post-annealing, leading to a similar grain size in the base, HAZ, and weld zone, as shown in Figure 3 (insets in bottom-left indicating grain size). Therefore, 10DH showed the lowest hardness, and the weld metal showed similar hardness to the base and HAZ due to the similar grain size.
Figure 8 shows engineering stress–strain curves of uniaxial tensile test performed at two different strain rates of 10−3 and 10−1 /s. At the strain rate of 10−3 /s, the base metal of pipe R showed a higher tensile strength of 1015 MPa than pipe 10D that went through pre-annealing and drawing. Pipe 10DH that was annealed after drawing showed a significant reduction of strength to 784 MPa. This tendency was not changed with a higher strain rate of 10−1 /s. Grain coarsening that happened during pre- and post-annealing can explain this decrease of strength in pipes 10D and 10DH. In the weld metal, on the other hand, tensile strength was found to be highest in pipe 10D. As shown in Figure 3, the grains of 10D remained as coarse as those of pipe R, but they were work hardened by the drawing process, which led to a higher strength than pipe R. Post-annealing after drawing-induced stress relieving and recrystallization meant that the lowest tensile strength was obtained in pipe 10DH. With a higher strain rate of 10−1 /s, this trend remained unchanged.
Figure 9 shows true stress–true strain curves and strain rate sensitivity (SRS) in the base metal and weld metal of the pipes. SRS parameters (m) were calculated from stress–strain curves of two independent uniaxial tensile tests performed at strain rates of 10−3 and 10−1 /s, respectively; m is equated as follows [33]:
m = log ( σ 2 / σ 1 ) log ( ε ˙ 2 / ε ˙ 1 )
where ε ˙ 1 and ε ˙ 2 are the strain rates, and σ 1 and σ 2 are the flow stresses of the corresponding strain rate.
As the strain rate increased from 10−3 to 10−1 /s, all pipes showed decreasing m during plastic deformation, which means a work-hardening rate of the faster strain rate, 10−1 /s, which was smaller than that of the slower strain rate, 10−3 /s. Additionally, m was positive at initial plastic deformation in most of pipes, except for pipe R, but this changed to negative at a certain strain level due to the aforementioned decrease of m.
Generally, an austenitic alloy like Al and Cu alloys showed positive SRS, which increases mechanical properties as the strain rate increases [2,34,35]. The negative SRS of the present alloy is related to mechanical twinning, and the possible mechanisms for negative SRS are as follows: first, the effect of dynamic strain aging (DSA) on mechanical twinning; second, negative strain rate dependence of twin nucleation and twin growth. DSA effect is the main contributor to negative SRS on high-Mn steel. The DSA effect impedes trailing partial dislocations while it aids twinning nucleation, but this effect is suppressed in deformation as the strain rate increases [36,37,38]. Accordingly, with increasing strain rate, twinning nucleation sites are limited, and the average energy for twinning nucleation increases [39,40].
From this viewpoint, EBSD analysis was performed to investigate the strain rate effect on twinning behavior, as shown in Figure 10. All specimens were deformed by 0.25 true strain at strain rates of 10−3 and 10−1 /s. In the base metal, SRS parameters of the base and the weld metal of the pipe R were –0.008 and 0.002, respectively. As depicted in Figure 10b, the base metals of negative SRS showed less formation of mechanical twinning at a higher strain rate, in comparison to the weld metal which had nearly zero m where no clear effect of strain rate on twin density was found. This observation could be well explained by the above-mentioned mechanisms in which negative SRS is strongly related to limited formation of mechanical twins.
On the other hand, the effect of post-weld processes applied to pipes was also investigated. As depicted in Figure 9a, in the base metal, m showed an increasing tendency along with pre-annealing, drawing (10D), and post-annealing (10DH). This was attributed to increasing grain size of the base metal due to annealing processes, as shown in Figure 3. Several papers have reported that twinning nucleation stress and growth stress in face-centered cubic alloys [34] and TWIP steels [41,42,43] decreases with increasing grain size. Therefore, it is regarded that reduction of twinning stress and twin nucleation stress due to grain coarsening increases the SRS parameter, promoting work hardening by deformation twins at a higher strain rate.
However, in the weld metal (Figure 9a), the effect of the processes on SRS was not as evident as the base metal. By comparing pipes R and 10DH of similar m, comparable density of mechanical twinning was also found, as shown in Figure 10b. The relationship between m and twin formation could be thus understood in terms of twin density, likely as the base metal. However, the weaker effect of post-weld processes on twin density shown in the weld metal could hardly be explained by grain size effect on twin formation. As shown in Figure 3, the grain size of pipe R was larger than pipe 10DH on average, and it was expected that twinning formation would be more pronounced in pipe R than pipe 10DH. However, it was shown that similar densities of mechanical twins were found in both pipes, and it could be postulated that differences other than grain size could be affecting twin formation. There was indeed differences in both pipes in a way that grain shape and orientation of the as-solidified pipe R was more anisotropic than pipe 10DH. Accordingly, it is regarded that this difference possibly affected twin formation and caused an obsecured relationship between grain size and twin density.

4. Conclusions

In this study, the effects of heat treatment and drawing processes for manufacturing a high-Mn steel pipe were investigated by analyzing the microstructure and mechanical properties. The results are summarized as followings:
(a) Compared to the base metal having equiaxed grains, the weld zone had coarse and elongated grains by coalescence of columnar dendrite during welding solidification. Application of the post-annealing process induced recrystallization and grain growth, resulting in equaxed grains in the weld zone. Due to accumulated strain energy during the hot-rolling process prior to welding, the base metal was recrystallized in the pre-annealing process, while the weld metal was recrystallized in the post-annealing process.
(b) Microsegregation of Mn occurred during welding solidification, and as a result the stacking fault energy (SFE) differed between the dendritic region and the interdendritic region. Microsegregation also occurred in the base metal as a result of hot-rolling, so SFE differed between the matrix and hot-rolling strips. Formation of ε-martensite in the as-welded state and during deformation was a concern due to decreased SFE in Mn-depleted regions, but all regions showed a fully austenitic phase in all conditions considered in the present work.
(c) The effect of processes applied to the as-welded pipe R mainly led to decrease of strength in both the base and weld metal. This was attributed to grain coarsening due to pre- and post-annealing processes. Pipe 10D, in particular, showed higher strength in the weld metal and was explained by work hardening during cold drawing process after pre-annealing.
(d) As strain rate increased, all pipes showed decreasing strain rate sensitivity (SRS) with plastic deformation. The negative SRS was eventually observed and strongly related to less density of mechanical twinnings at a higher strain rate, as confirmed by EBSD analysis. In the base metal, the effect of annealing processes was clearly reflected on SRS behaviors in a way that the coarser grains formed by the annealing process promoted mechanical twins and increased SRS. In the weld metal, however, the process of the effect on SRS was not clearly understood only by grain size, and this is because other factors such as grain shape and orientation may affect twin formation.

Author Contributions

Conceptualization, J.B.J., Y.-S.A. and S.S.P.; methodology, G.-W.P. and S.S.; validation, J.B.J., B.-J.K., W.L. and Y.-S.A.; investigation and analysis, G.-W.P., H.J., M.P. and S.S.; draft preparation, G.-W.P. and J.B.J.; review and editing, J.B.J., S.S.P. and Y.-S.A. All authors have read and agreed to the manuscript.

Funding

This study was supported by the R&D Program of Korea Evaluation Institute of Industrial Technology (KEIT) as “Development of Sub-merged-Arc-Welded Pipe and Extruded Pipe made of High Manganese Steel for Cryogenic Usage in LNG Ship and Offshore Plant (10080728)” and also partly supported by the R&D Program of “World Class 300 Project (R&D) (S2641289, Development of high value-added forged flanges for extreme environments based on intelligent forging systems) of the SMBA (Korea)”.

Conflicts of Interest

The authors declare no conflict of interest.

References

  1. De Cooman, B.C.; Chen, L.; Kim, H.S.; Estrin, Y.; Kim, S.K.; Voswinckel, H. State-of-the-Science of High Manganese TWIP Steels for Automotive Applications. In Microstructure and Texture in Steels; Springer: London, UK, 2009; pp. 165–183. [Google Scholar] [CrossRef]
  2. Gutierrez-Urrutia, I.; Zaefferer, S.; Raabe, D. The effect of grain size and grain orientation on deformation twinning in a Fe–22 wt.% Mn–0.6 wt.% C TWIP steel. Mater. Sci. Eng. A 2010, 527, 3552–3560. [Google Scholar] [CrossRef]
  3. Frommeyer, G.; Brüx, U.; Neumann, P. Supra-Ductile and High-Strength Manganese-TRIP/TWIP Steels for High Energy Absorption Purposes. ISIJ Int. 2003, 43, 438–446. [Google Scholar] [CrossRef] [Green Version]
  4. Barbier, D.; Gey, N.; Allain, S.; Bozzolo, N.; Humbert, M. Analysis of the tensile behavior of a TWIP steel based on the texture and microstructure evolutions. Mater. Sci. Eng. A 2009, 500, 196–206. [Google Scholar] [CrossRef] [Green Version]
  5. De Cooman, B.C.; Estrin, Y.; Kim, S.K. Twinning-induced plasticity (TWIP) steels. Acta Mater. 2018, 142, 283–362. [Google Scholar] [CrossRef]
  6. Rémy, L.; Pineau, A. Twinning and strain-induced f.c.c. → h.c.p. transformation on the mechanical properties of Co Ni Cr Mo alloys. Mater. Sci. Eng. 1976, 26, 123–132. [Google Scholar] [CrossRef]
  7. Allain, S.; Chateau, J.P.; Bouaziz, O. A physical model of the twinning-induced plasticity effect in a high manganese austenitic steel. Mater. Sci. Eng. A 2004, 387–389, 143–147. [Google Scholar] [CrossRef]
  8. Kim, J.-K.; De Cooman, B.C. Stacking fault energy and deformation mechanisms in Fe-xMn-0.6C-yAl TWIP steel. Mater. Sci. Eng. A 2016, 676, 216–231. [Google Scholar] [CrossRef]
  9. Vinogradov, A.; Lazarev, A.; Linderov, M.; Weidner, A.; Biermann, H. Kinetics of deformation processes in high-alloyed cast transformation-induced plasticity/twinning-induced plasticity steels determined by acoustic emission and scanning electron microscopy: Influence of austenite stability on deformation mechanisms. Acta Mater. 2013, 61, 2434–2449. [Google Scholar] [CrossRef]
  10. Sohn, S.S.; Hong, S.; Lee, J.; Suh, B.-C.; Kim, S.-K.; Lee, B.-J.; Kim, N.J.; Lee, S. Effects of Mn and Al contents on cryogenic-temperature tensile and Charpy impact properties in four austenitic high-Mn steels. Acta Mater. 2015, 100, 39–52. [Google Scholar] [CrossRef]
  11. Jeong, D.-H.; Lee, S.-G.; Jang, W.-K.; Choi, J.-K.; Kim, Y.-J.; Kim, S. Cryogenic S–N Fatigue and Fatigue Crack Propagation Behaviors of High Manganese Austenitic Steels. Met. Mater. Trans. 2013, 44, 4601–4612. [Google Scholar] [CrossRef]
  12. Kim, Y.G.; Han, J.M.; Lee, J.S. Composition and temperature dependence of tensile properties of austenitic Fe Mn Al C alloys. Mater. Sci. Eng. A 1989, 114, 51–59. [Google Scholar] [CrossRef]
  13. Mujica, L.; Weber, S.; Pinto, H.; Thomy, C.; Vollertsen, F. Microstructure and mechanical properties of laser-welded joints of TWIP and TRIP steels. Mater. Sci. Eng. A 2010, 527, 2071–2078. [Google Scholar] [CrossRef]
  14. Saha, D.C.; Cho, Y.; Park, Y.D. Metallographic and fracture characteristics of resistance spot welded TWIP steels. Sci. Technol. Weld. Join. 2013, 18, 711–720. [Google Scholar] [CrossRef]
  15. Ma, L.-L.; Wei, Y.-H.; Hou, L.-F.; Yan, B. Microstructure and Mechanical Properties of TWIP Steel Joints. J. Iron Steel Res. Int. 2014, 21, 749–756. [Google Scholar] [CrossRef]
  16. Vahiddastjerdi, H.; Rezaeian, A.; Toroghinejad, M.R.; Dini, G.; Ghassemali, E. Optimizing pulsed Nd: YAG laser welding of high-Mn TWIP steel using response surface methodology technique. Opt. Laser Technol. 2019, 120, 105721. [Google Scholar] [CrossRef]
  17. Mújica Roncery, L.; Weber, S.; Theisen, W. Welding of twinning-induced plasticity steels. Scr. Mater. 2012, 66, 997–1001. [Google Scholar] [CrossRef]
  18. Mujica, L. Development of High-Strength Corrosion-Resistant Austenitic TWIP Steels with C+ N. Ph.D. Thesis, Ruhr-Universitaet Bochum, Bochum, Germany, 2010. [Google Scholar]
  19. Allain, S.; Chateau, J.P.; Bouaziz, O.; Migot, S.; Guelton, N. Correlations between the calculated stacking fault energy and the plasticity mechanisms in Fe–Mn–C alloys. Mater. Sci. Eng. A 2004, 387–389, 158–162. [Google Scholar] [CrossRef]
  20. Grässel, O.; Krüger, L.; Frommeyer, G.; Meyer, L.W. High strength Fe–Mn–(Al, Si) TRIP/TWIP steels development—properties—application. Int. J. Plast. 2000, 16, 1391–1409. [Google Scholar] [CrossRef]
  21. Mújica Roncery, L.; Weber, S.; Theisen, W. Development of Mn-Cr-(C-N) Corrosion Resistant Twinning Induced Plasticity Steels: Thermodynamic and Diffusion Calculations, Production, and Characterization. Met. Mater. Trans. A 2010, 41, 2471–2479. [Google Scholar] [CrossRef]
  22. Park, G.-W.; Jo, H.; Park, M.; Shin, S.; Ko, W.-S.; Park, N.; Kim, B.-J.; Ahn, Y.-S.; Jeon, J.B. Microstructure and Mechanical Properties of Gas Tungsten Arc Welded High Manganese Steel Sheet. Metals 2019, 9, 1167. [Google Scholar] [CrossRef] [Green Version]
  23. Wang, T.; Zhang, M.; Xiong, W.; Liu, R.; Shi, W.; Li, L. Microstructure and tensile properties of the laser welded TWIP steel and the deformation behavior of the fusion zone. Mater. Des. 2015, 83, 103–111. [Google Scholar] [CrossRef]
  24. Yoo, J.; Han, K.; Park, Y.; Choi, J.; Lee, C. Evaluation of solidification cracking susceptibility of Fe–18Mn–0·6C steel welds. Sci. Technol. Weld. Join. 2014, 19, 514–520. [Google Scholar] [CrossRef]
  25. Saha, D.C.; Chang, I.; Park, Y.-D. Heat-affected zone liquation crack on resistance spot welded TWIP steels. Mater. Charact. 2014, 93, 40–51. [Google Scholar] [CrossRef]
  26. Razmpoosh, M.H.; Shamanian, M.; Esmailzadeh, M. The microstructural evolution and mechanical properties of resistance spot welded Fe–31Mn–3Al–3Si TWIP steel. Mater. Des. 2015, 67, 571–576. [Google Scholar] [CrossRef]
  27. Olson, G.B.; Cohen, M. A general mechanism of martensitic nucleation: Part I. General concepts and the FCC → HCP transformation. Met. Mater. Trans. A 1976, 7, 1897–1904. [Google Scholar] [CrossRef]
  28. Hirth, J.P. Thermodynamics of stacking faults. Metall. Trans. 1970, 1, 2367. [Google Scholar] [CrossRef]
  29. Dumay, A.; Chateau, J.P.; Allain, S.; Migot, S.; Bouaziz, O. Influence of addition elements on the stacking-fault energy and mechanical properties of an austenitic Fe–Mn–C steel. Mater. Sci. Eng. A 2008, 483–484, 184–187. [Google Scholar] [CrossRef]
  30. Curtze, S.; Kuokkala, V.T.; Oikari, A.; Talonen, J.; Hänninen, H. Thermodynamic modeling of the stacking fault energy of austenitic steels. Acta Mater. 2011, 59, 1068–1076. [Google Scholar] [CrossRef]
  31. Lan, P.; Zhang, J. Serrated Flow and Dynamic Strain Aging in Fe-Mn-C TWIP Steel. Met. Mater. Trans. A 2018, 49, 147–161. [Google Scholar] [CrossRef]
  32. Kim, H.; Ha, Y.; Kwon, K.H.; Kang, M.; Kim, N.J.; Lee, S. Interpretation of cryogenic-temperature Charpy impact toughness by microstructural evolution of dynamically compressed specimens in austenitic 0.4C–(22–26)Mn steels. Acta Mater. 2015, 87, 332–343. [Google Scholar] [CrossRef]
  33. Bintu, A.; Vincze, G.; Picu, C.R.; Lopes, A.B.; Grácio, J.J.; Barlat, F. Strain hardening rate sensitivity and strain rate sensitivity in TWIP steels. Mater. Sci. Eng. A 2015, 629, 54–59. [Google Scholar] [CrossRef]
  34. Zhu, Y.T.; Liao, X.Z.; Wu, X.L.; Narayan, J. Grain size effect on deformation twinning and detwinning. J. Mater. Sci. 2013, 48, 4467–4475. [Google Scholar] [CrossRef]
  35. Rahman, K.M.; Vorontsov, V.A.; Dye, D. The effect of grain size on the twin initiation stress in a TWIP steel. Acta Mater. 2015, 89, 247–257. [Google Scholar] [CrossRef] [Green Version]
  36. Yan, S.L.; Yang, H.; Li, H.W.; Yao, X. Variation of strain rate sensitivity of an aluminum alloy in a wide strain rate range: Mechanism analysis and modeling. J. Alloys Compd. 2016, 688, 776–786. [Google Scholar] [CrossRef]
  37. Subramanya Sarma, V.; Sivaprasad, K.; Sturm, D.; Heilmaier, M. Microstructure and mechanical properties of ultra fine grained Cu–Zn and Cu–Al alloys produced by cryorolling and annealing. Mater. Sci. Eng. A 2008, 489, 253–258. [Google Scholar] [CrossRef]
  38. Khan, A.S.; Liu, H. Variable strain rate sensitivity in an aluminum alloy: Response and constitutive modeling. Int. J. Plast. 2012, 36, 1–14. [Google Scholar] [CrossRef]
  39. Jung, I.-C.; De Cooman, B.C. Temperature dependence of the flow stress of Fe–18Mn–0.6C–xAl twinning-induced plasticity steel. Acta Mater. 2013, 61, 6724–6735. [Google Scholar] [CrossRef]
  40. Lan, P.; Zhang, J. Twinning and dynamic strain aging behavior during tensile deformation of Fe-Mn-C TWIP steel. Mater. Sci. Eng. A 2017, 700, 250–258. [Google Scholar] [CrossRef]
  41. Wu, S.Z.; Yen, H.W.; Huang, M.X.; Ngan, A.H.W. Deformation twinning in submicron and micron pillars of twinning-induced plasticity steel. Scr. Mater. 2012, 67, 641–644. [Google Scholar] [CrossRef]
  42. Yang, H.K.; Zhang, Z.J.; Dong, F.Y.; Duan, Q.Q.; Zhang, Z.F. Strain rate effects on tensile deformation behaviors for Fe–22Mn–0.6C–(1.5Al) twinning-induced plasticity steel. Mater. Sci. Eng. A 2014, 607, 551–558. [Google Scholar] [CrossRef]
  43. Yang, H.K.; Zhang, Z.J.; Tian, Y.Z.; Zhang, Z.F. Negative to positive transition of strain rate sensitivity in Fe-22Mn-0.6C-x(Al) twinning-induced plasticity steels. Mater. Sci. Eng. A 2017, 690, 146–157. [Google Scholar] [CrossRef]
Figure 1. Schematic diagrams of the pipe manufacturing process.
Metals 10 01366 g001
Figure 2. Schematic diagrams showing (a) location and direction of tensile specimens, (b) dimension of ASTM E8 Subsize tensile specimen, (c) location of Vickers hardness test, and (d) sampling location of tensile specimen.
Metals 10 01366 g002
Figure 3. Optical micrographs of high-Mn steel pipes etched by 5% nital for 50 s: (a) R, (b) 10D, and (c) 10DH. (*: Average grain size.)
Metals 10 01366 g003
Figure 4. EDS results of image map and quantitative analysis for Mn in each region: (a) base metal and (b) weld metal.
Metals 10 01366 g004
Figure 5. Stacking fault energy calculation in the (a) base metal and (b) weld metal of each pipe. The models were suggested by Dumay et al. [29] and Curtze et al. [30].
Metals 10 01366 g005
Figure 6. Phase analysis of high-Mn steel pipes before and after deformation: (a) XRD pattern of as-welded pipes. (b) EBSD analysis results of phase map deformed by 0.25 true strain at strain rates of 10−3 and 10−1 /s, respectively.
Metals 10 01366 g006
Figure 7. Vickers hardness profiles of high-Mn steel pipes ranging over welded joint regions: (a) R, (b) 10D, and (c) 10DH.
Metals 10 01366 g007
Figure 8. Engineering stress–strain curves and mechanical properties diagram of the (a) base metal and (b) weld metal. All specimens were strained along the welding direction.
Metals 10 01366 g008
Figure 9. True stress–strain curves and strain rate sensitivity of the (a) base metal and (b) weld metal. Strain rate sensitivity parameters were calculated from the true stress–strain curves (strain rate of 10−3 and 10−1 /s).
Metals 10 01366 g009
Figure 10. RD invers pole figure (RD-IPF) maps of the base metal and weld metal in pipes R and 10DH: (a) RD-IPF map and (b) twin boundary maps.
Metals 10 01366 g010
Table 1. Chemical composition of the present high-Mn steel sheet.
wt.%CMnSiPSCrCuFe
ASTM
A240XM-M
0.4424.20.30.0010.0013.40.4Bal.
Table 2. GTAW and plasma automatic welding process conditions.
Voltage (V)Current (A)Welding Speed (cm/min)Heat Input (kJ/cm)Shielding Gas
Plasma20025503.00N2
GTAW15018503.24N2
Table 3. Pre-annealing and post-annealing process conditions.
Temperature (°C)Heating Time (min)AtmosphereCooling Method
Pre-annealing105050N2Indirect water
Post-annealing108030H2Indirect water
Table 4. Drawing process conditions.
Drawing Power (ton)Die OD (mm)Plug ID (mm)Lubricant
50.086.076.76Bonedelube
Table 5. Heat treatment and drawing process conditions of welding pipes.
Pipe CodePre-Annealing
(1050 °C, 50 min)
DrawingPost-Annealing
(1080 °C, 30 min)
R×××
10D×
10DH

