Abstract
The microstructure evolution of Ni-based superalloys during heat treatment is of great significance for obtaining better service performance. However, heat treatment experimentation is costly and time-consuming, and sometimes fails to reveal physical mechanisms well. In the present study, a multiphase-field model coupled with an explicit nucleation algorithm was established to simulate the precipitation and growth of γ′ phase in DD6 superalloy, which can be applied to a multicomponent elastic-inhomogeneous system. The PanNickel© database was used to calculate thermodynamic and kinetic data in multicomponent superalloys. First, the coupling method of multiphase-field model and explicit nucleation algorithm was introduced. The coupled model was used to simulate the precipitation of γ′ phase under isothermal and non-isothermal conditions. It was found that a unimodal microstructure was formed under isothermal conditions and there was a “soft impingement” phenomenon, while a bimodal distribution composed of cuboidal γ′ precipitates and fine secondary γ′ precipitates was formed during a cooling process of 25–125 °C/min. The effect of cooling rate was studied. Then, the chemical and elastic driving forces were analyzed. It was found that Al and Ta contributed most to the chemical driving force, while Re and W gathered at the γ/γ′ interface and inhibited the growth of γ′ phase. γ′ precipitates had a cuboidal shape under the influence of elastic driving force. Finally, the growth and coarsening process of γ′ phase was studied and compared with the well-known Lifshitz−Slyosov−Wagner (LSW) theory. The growth of γ′ phase can be divided into rapid growth, coarsening and quasi-static coarsening stages according to the simulation results, among which the coarsening stage is basically consistent with the LSW theory. The current model can be used to simulate the precipitation and growth of single crystal superalloys where multicomponent and elastic effects are considered.
1. Introduction
Ni-based single crystal superalloys have been widely used in turbine blades, one of the most important hot section components of aero-engines and industrial gas turbines because of their excellent mechanical properties. DD6 is a typical second-generation single crystal superalloy developed by Beijing Institute of Aeronautical Materials [1], whose properties are similar to CMSX-4. The high creep strength of DD6 strongly depends on its microstructure, which is greatly influenced by its heat treatment process. Studying the elements distribution and microstructure evolution of DD6 during heat treatment is of great significance for improving its heat treatment process and obtaining better service performance.
Many factors such as alloy compositions, aging temperature and cooling rate can affect the volume fraction, size, shape or distribution of γ′ phase in Ni-based single crystal superalloys. Several numerical techniques have been proposed to study the influence of them. Su et al. [2] studied the effect of alloying composition on precipitation behavior based on thermodynamic calculation and compared it with experimental results. It was proposed that the mass fraction of γ′ precipitates is greatly enhanced with increase in Al, Ta and Nb content in DD6. Kitashima [3] developed a technique calculating Gibbs free energy in the CALPHAD method and combined it with phase-field model to simulate γ′ precipitations in an eight-element multicomponent Ni-based superalloy. The simulation considered anti-phase effects of γ′ precipitates and revealed the late-stage enrichments of Re and W elements in the γ phase during coalescence of the γ′ precipitates. However, these models mainly focus on elemental research and cannot consider the elastic inhomogeneity of γ/γ′ phases.
Thereafter, phase-field model considering elastic energy was proposed. Wen et al. [4] investigated the microstructural development of Ni-Al system during a continuous cooling under various cooling rate and reported two peaks of nucleation with elastic strain energy coupled into a phase-field method. Boussinot [5] simulated the precipitation of γ′ phase during continuous two-step aging and revealed the mechanisms responsible for the evolution of the finest γ′ precipitates (which are called tertiary precipitates in his study). Yang [6] studied the impact of cooling rate on secondary γ′ precipitates during two-step aging in Ni-Al system and found that the precipitation of secondary γ′ phase from the γ channel occurs only when the γ channel width is greater than a critical value. These studies considering influence of cooling rate suggested that the formation of γ′ precipitates is the result of diffusion and undercooling competition. Meanwhile, several studies discussed the effects of elastic inhomogeneity and anti-phase boundary. Cottura et al. [7] simulated the formation and coarsening of cuboidal microstructure in Ni-Al binary system with different elastic constants and compared it with the experimental data of AM1 superalloy. It was shown that the average aspect ratio of the cuboidal precipitates is very sensitive to the inhomogeneity ΔC′ of the C′ elastic constant with . Yang et al. [8] observed the merging-splitting phenomenon between two neighboring γ′ precipitates and analyzed the effects of elastic energy and anti-phase domain on the γ′ morphology evolution during the aging process.
However, these models considering elastic energy are established in a binaryNi-Al system and cannot take multicomponent and elastic inhomogeneity into account simultaneously. In view of the complexity of γ′ precipitation behavior, which involves the elastic inhomogeneity, transformation strain and multiple elements, it is highly desirable to combine phase-field and elastic energy in a multicomponent system. Steinbach et al. [9] presented a multiphase-field model considering the effects of elastic energy and transformation strain, then applied it to the simulation of γ/α transformation in an iron-carbon-manganese alloy successfully, which demonstrated the importance of elastic energy on the transformation kinetics. The model proposed by Steinbach will be applied to γ′ precipitation simulation in the present work. However, nucleation is achieved by adding a noise term in the field variables equations in Steinbach’s model, which cannot consider the mechanism of γ′ precipitation well.
The aim of the present work is to show how a multicomponent multiphase-field model can be coupled with a nucleation algorithm, where elastic energy is also taken into account, to study the nucleation and growth behavior of γ′ phase, and analyze the influence of element distribution and elastic energy during γ′ precipitating from Ni-based superalloys. In the following sections, the multiphase-field model, explicit nucleation algorithm and coupling method are introduced. Then, the coupled model is applied to study the nucleation law of γ′ phase by isothermal and non-isothermal simulation, respectively. Finally, the driving force of γ′ growth is discussed and the growth law is studied.
2. Modeling
The standard heat treatment regime of DD6 [1] is 1290 °C/1 h + 1300 °C/2 h + 1315 °C/4 h/AC + 1120 °C/4 h/AC + 870 °C/32 h/AC, where AC means air cooling. The sample is usually put into a quartz tube and vacuumed, then the quartz tube with the sample inside is put into the heating furnace at room temperature, and heated at a rate lower than 3 °C/min. The primary γ′ phase and γ/γ′ eutectic dissolve completely after the first three steps, γ′ phase precipitates from matrix during air cooling. Then, after the two-steps aging treatment, the cubical γ′ phase is aligned regularly along [100] direction and accounts for more than 60% of the volume fraction, which plays major role in precipitation hardening. In the present work, the precipitation of γ′ is the key research process and the multiphase-field model will be established according to the characteristics of this process. It was reported that secondary precipitation may occur within the γ matrix during heat treatment [10,11], which will be considered in nucleation algorithm.
2.1. Multiphase-Field Model
With the L12 structure γ′ precipitating from disordered f.c.c. γ phase, four types of antiphase domains (APDs) are produced [12]. If these APDs impinge each other during growth and coarsening, antiphase domain boundaries (APB) will be generated. Therefore, the scaled fields (α = 1, 2, 3, 4) which have values between 0 and 1 are defined to distinguish the four types of γ′ precipitates and represents γ matrix. The multiphase-field model defines concentration field and elastic parameters as a function of phase state, and applies the assumption of equal chemical potential and mechanical equilibrium in the interface, which solves the discontinuous problem in the interface of different phases:
where is the phase composition fields in γ′ or γ phase. is effective elastic modulus tensor and is the compliance matrix of phase α.
The multi-phase model simulates the microstructure evolution and elements diffusion in domain Ω by calculating the kinetic equations:
where is the interface mobility, ν means the local phase number, is the interdiffusion coefficient of component i and component j in phase and the interdiffusion between different components can usually be ignored for simplicity. The energy can be calculated by an integral of three energy density function: the interface energy density ; the chemical free energy density and the elastic energy density :
where , are, respectively, the interface energy and interface width between different phase α and β, . Due to the existence of APB between different γ′ precipitates, the APB energy is quite larger than the interface energy between γ′ and γ phase [8]. is set to for all interfaces for simplicity.
where is the bulk free energy of the individual phases and chemical potential is continuous in the interface.
where is elastic strain and is total strain. The transformation strain , where , is the Kronecker-delta function, and are lattice parameters. The local stress is continuous in the interface.
Substituting Equations (5)–(9) into Equation (3), the final form of kinetic equation is [9]
where and The chemical driving force [13,14] and elastic driving force [9,15] are, respectively, given as:
in which the equilibrium phase concentration and thermodynamic factor can be obtained from commercial thermodynamic database PanNickel©.
The stress and strain need to be calculated first before obtaining the elastic driving force. The mechanical equilibrium equation should be satisfied in domain Ω:
This problem can be solved by the classical fast Fourier transform (FFT)-based iterative method given by the book [16].
2.2. Explicit Nucleation Algorithm
The phase-field method does not focus too much on nucleation. Conventionally, nucleation is accomplished by adding a Gaussian noise term in the evolution rates of the field variables. This limits the conventional phase-field model to isothermal processes. In present study, an explicit nucleation phase-field method proposed by Simmons et al. [17,18] is used to simulate the cooling process. This approach explicitly introduces nuclei into individual grids by generating a uniform random variable and comparing its value to the probability :
If , then the grid is transformed; otherwise it is not. In Equation (15), is time step and is the nucleation rate, calculated by
where N is the number of atoms in each phase-field grid, Z is the Zeldovich factor, is the frequency factor (1/(characteristic time of atomic attachment)), is the activation free energy required to form a stable nucleus, k is Boltzman’s constant, T is absolute temperature, is an incubation time and t is time.
According to the Simmons’ discussion, the nucleation rate can be simplified as Equations (17) and (18) in isothermal and non-isothermal condition, respectively:
where is supersaturation and is undercooling. , reflecting the nucleation rate at the initial stage, , reflecting the influence of alloy composition on nucleation. Assuming as a constant, the change of with and is shown in Figure 1 in the isothermal case. It can be seen that the nucleation rate gradually decreases with decreasing when the transformation progress.
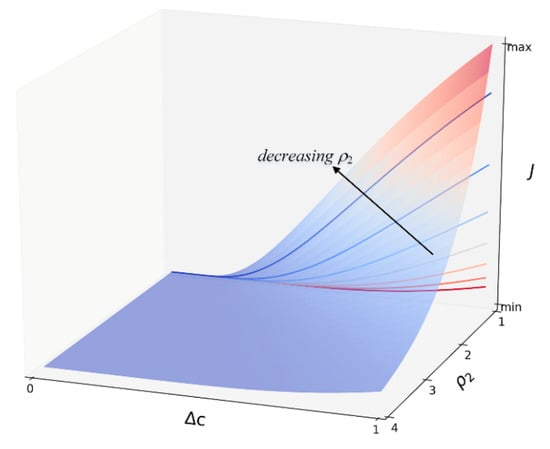
Figure 1.
Schematic diagram of the effects of undercooling Δc and parameter ρ2 on the nucleation rate.
In non-isothermal case, , reflecting the influence of temperature. and are the chemical potentials of the solvent and solute, and is the transformation entropy change. changes with temperature,
where R is the gas constant, and Q are parameters to be determined, which can be calculated according to the method mentioned in the paper [4]. In practice, , and are the parameters varied in the investigation.
The calculation processes of γ′ nucleation and growth are shown in Figure 2. In each time step, an explicit nucleation algorithm is applied to simulate nucleation first and multi-phase field method is applied to simulate the growth of γ′ subsequently.
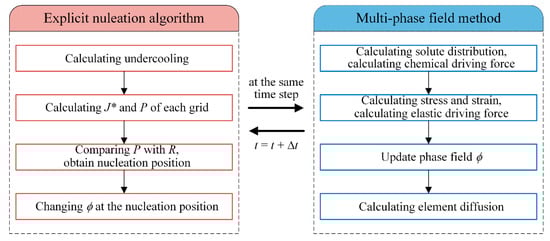
Figure 2.
Calculation flow chart.
2.3. Parameters
The nominal chemical compositions of DD6 superalloy is list in Table 1. The component Hf and Nb are removed for its low concentration. The precipitation behaviors of γ′ are studied at temperature T = 1120 °C and subsequent cooling progress. The equilibrium phase concentration and diffusion coefficient are obtained from commercial thermodynamic database PanNickel©, as shown in Table 2.

Table 1.
Chemical composition of DD6 superalloy.
Table 2.
Equilibrium phase concentration and diffusion coefficient of DD6 at 1120 °C.
The elastic modulus of DD6 superalloy is dependent on temperature. The equations describing the dependencies of elastic constants Cij on temperature T are present in Table 3, following Ardell’s paper. [19] The elastic constants are, respectively, , , , , and at T = 1120 °C.
Table 3.
Temperature-related elastic constants of DD6.
Besides, the diffusion of elements may have a non-negligible effect on the lattice parameters of γ′ and γ phase; the calculation method is shown as Equations (20) and (21). The nucleation and phase-field parameters are list in Table 4. All the simulations have periodic boundary conditions and the same meshing conditions. The 6 × 6 μm2 domain is discretized into 4002 grids.
Table 4.
Nucleation and phase-field parameters.
3. Results and Discussion
3.1. Nucleation Law of γ′ Phase
3.1.1. Isothermal Simulation
In this subsection, the isothermal precipitation of γ′ phase in DD6 superalloy was studied by a 1120 °C/4 h simulation. The simulation parameters are shown in Section 2.3. The precipitation process was shown in Figure 3a–c. It can be seen that precipitation almost has been completed in the process from (a) to (b), and there are only a few newly formed γ′ precipitates in the process from (b) to (c), such as the yellow rectangular area in (c). The microstructure evolution at t = 60, 120, 240 min was shown in Figure 3d–f. The four colors in the figure represent the different types of γ′ which cannot merge together due to the presence of APB. These four types γ′ precipitates differ only in atoms site and have no difference in other physical properties. There are no new γ′ precipitating from the matrix anymore and the γ′ phase gradually develops into a cuboidal shape.
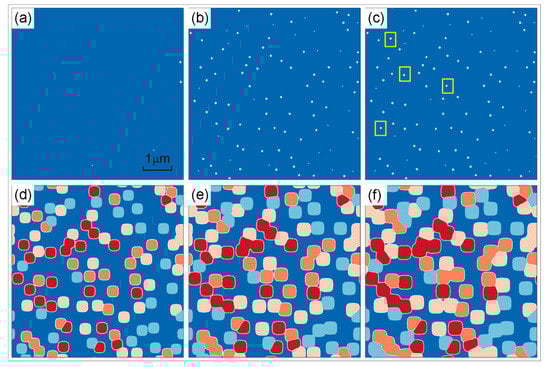
Figure 3.
Simulated microstructure evolution at t = 0 (a), 0.006 (b), 0.012 (c), 60 (d), 120 (e) and 240 min (f) of DD6 superalloy under 1120 °C/4 h.
The area fraction of γ′ phase during 1120 °C/4 h simulation was shown in Figure 4a. It can be seen that the growth rate of γ′ phase gradually slows down and stabilizes at about 200 min. The final area fraction of γ′ phase is 58.5%, which is close to the result 58.05% calculated by PanNickel. Many studies [22,23,24] have adopted the Johnson−Mehl−Avrami−Kolmogorov (JMAK) theory to describe the degree of transformation in the phase transition which involves nucleation and growth phenomena. The JMAK theory [25,26,27] proposes that the fraction of newly formed phase, namely γ′ phase, satisfies the relationship shown as Equation (22) under the premise of three assumptions that the nucleation is randomly distributed, the growth is isotropic and the nucleation and growth rate are constant.
where is the area fraction of γ′ phase at time t in 2-D simulation, is the equilibrium area fraction, k is a constant and n is the Avrami exponent. Equation (22) can be transformed into the Equation (23):
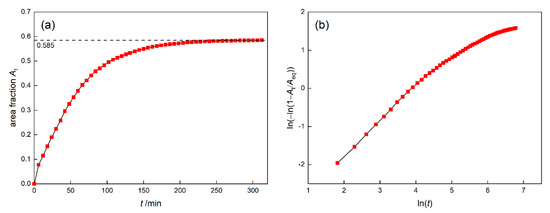
Figure 4.
The area fraction of γ′ phase (a) and Avrami plot (b) of DD6 superalloy at 1120 °C.
That is to say, has a linear relationship with , and the slope of the Avrami curve ~ represents the value of n. The Avrami plot of γ′ phase during 1120 °C/4 h was shown in Figure 4b. It can be seen that has a linear relationship with basically at the beginning, but the slope gradually decreases and no longer satisfies the JMAK theory.
In order to find the reason why the precipitation of γ′ no longer satisfies the JMAK theory, the nucleation rate was analyzed. The number of γ′ precipitates was depicted as Figure 5a, which reflects that γ′ phase has completed a large number of nucleation in a short time and then no new precipitates are formed. Define NR as the average nucleation rate of the simulated area, namely
where V is the area of calculated domain Ω. The change of logarithmic function ln(NR) was depicted as Figure 5b. It can be seen that ln(NR) gradually decreases and NR gradually approaches zero as the phase transition progresses. This situation deviates from the premise that the nucleation rate is constant, so that the Avrami curve does not satisfy the JMAK theory.
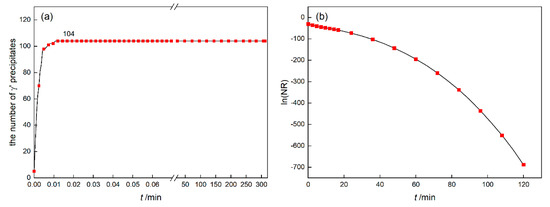
Figure 5.
The number of γ′ precipitates (a) and the average nucleation rate (b) of DD6 at 1120 °C.
In fact, the JMAK theory needs many ideal conditions. At isothermal conditions, the nucleation rate is greatly influenced by the alloy composition, as shown in Equation (17). Take the Al concentration as an example, define in γ matrix, which can indirectly reflect the supersaturation of Al element. The change of c(Al) and Δc(Al) are shown in Figure 6. As the precipitation and growth of γ′ phase progresses, c(Al) and Δc(Al) gradually decreases and approaches the equilibrium state. According to Figure 1, the decrease in supersaturation can lead to the decrease in nucleation rate, which illustrates the reason why the nucleation proceeds quickly in a short time and then slows down. The phenomenon that element diffusion leads to the decrease in supersaturation, then leads to the decrease in nucleation rate is called “soft impingement” [18,28,29,30]. Soft impingement will make the Avrami exponent n less than theoretical value.
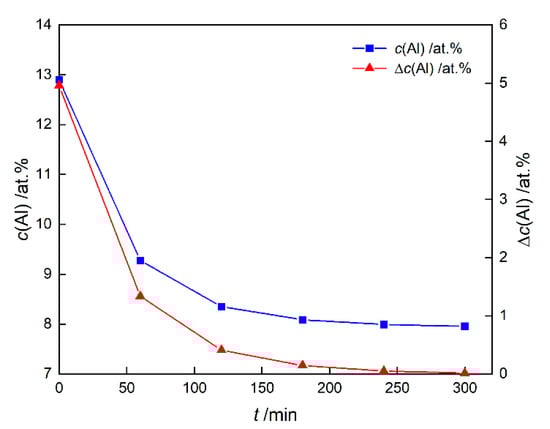
Figure 6.
The average concentration of Al element in the γ matrix c(Al) and the deviation curve of the Al concentration from the equilibrium state Δc(Al).
3.1.2. Non-Isothermal Simulation
In this subsection, the microstructure evolution of DD6 superalloy during 1120 °C/4 h and subsequent cooling process was studied. The cooling curve is depicted as Figure 7 and temperature is decreased from 1120 to 25 °C with different cooling rates Rc = 25, 50, 75, 100 and 125 °C/min, respectively. The nucleation rate is calculated by Equation (18) and other parameters are the same as those in the isothermal simulation.
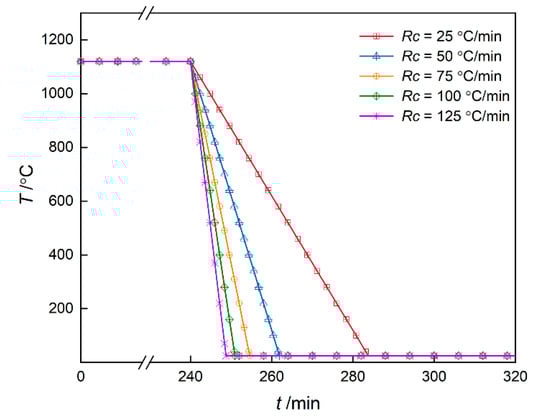
Figure 7.
The cooling curve of DD6 superalloy sketch diagram.
Take Rc = 50 °C/min as an example, the microstructure evolution is shown in Figure 8. The results in isothermal stage are the same as those in Figure 3. The temperature has been decreased to 25 °C and there are many fine γ′ particles precipitating from γ matrix in Figure 8d. Bimodal distribution which composed of cuboidal γ′ precipitates and fine secondary γ′ precipitates is formed during the cooling process.
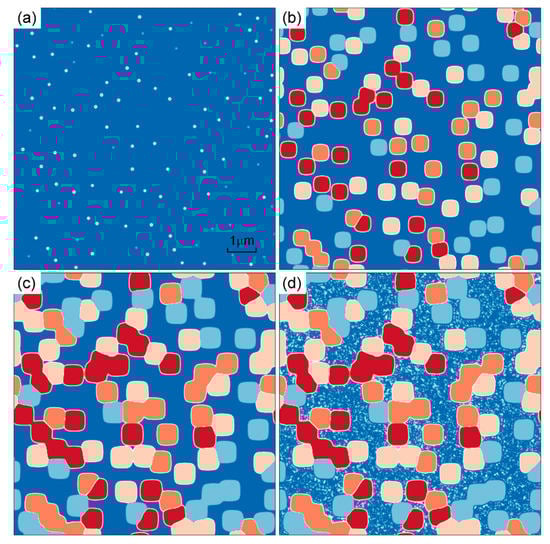
Figure 8.
Simulated microstructure evolution at t = 0.012 (a), 60 (b), 240 (c) and 261.9 min (d) of DD6 superalloy under 1120 °C/4 h and Rc = 50 °C/min continuous cooling.
Yu et al. [11] studied the influences of cooling rate on the microstructure of DD6 alloy by experiments with different cooling rates during the heat treatment process. The results show that there is no secondary γ′ precipitate in the furnace-cooled samples after the first aging treatment, while a large number of secondary γ′ particles precipitated in air-cooled samples. Mao et al. [31] did 11–800 °C/min continuous cooling experiments for U720LI superalloy and found that 11 °C/min cooling rate leads to single cuboidal γ′ phase while 11 °C/min cooling rate leads to bimodal microstructure. The authors also proposed a model describing the effects of cooling rate on microstructure, shown in Figure 9. Under isothermal conditions or at a very slow rate, there are no secondary γ′ precipitates and soft impingement phenomenon occurs with the supersaturation decreasing. Under intermediate cooling rate conditions, bimodal microstructure is formed and there is a competition between undercooling and diffusion. The simulation results of Rc = 25–125 °C/min in the present study are basically consistent with the experimental observations at intermediate cooling rates. At higher cooling rates, the microstructure again reverts to a unimodal microstructure because of the slow diffusion of elements and the nucleation rate is close to a large constant value.
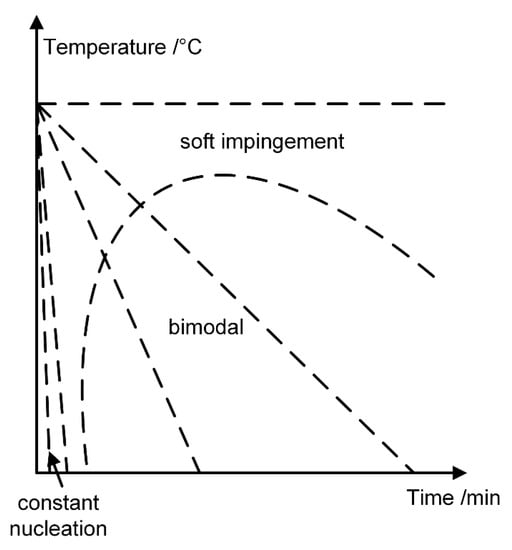
Figure 9.
The effect of cooling rate on the microstructure in Ni-based single crystal superalloy.
In order to study the effect of cooling rate on the nucleation in detail, the quantity of γ′ precipitates at different cooling rates is shown in Figure 10. It can be seen that the number of γ′ precipitates increases first and then decreases with the increase in Rc. The microstructure obtained at Rc = 75 °C/min has the largest number of γ′ precipitates, namely 4139, which reflects the competition of undercooling and diffusion.
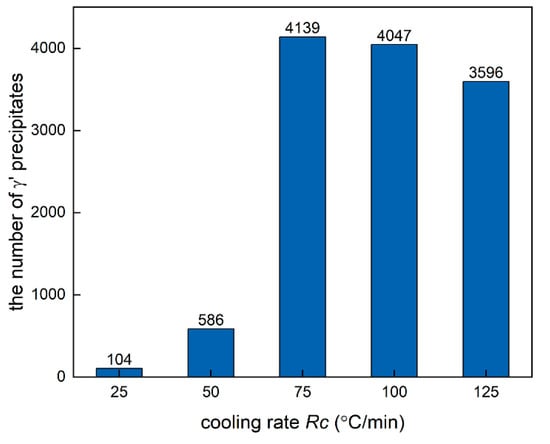
Figure 10.
The number of γ′ precipitates in DD6 at different cooling rates.
3.2. Driving Force of γ′ Growth
γ′ precipitates go through nucleation, growth and coarsening during the process of heat treatment, which is driven by chemical driving force and elastic driving force. This subsection studied the driving force of the γ′ growth by a regularly aligned microstructure, shown in Figure 11a, and tried to illustrate the reason why γ′ precipitates grow into cuboidal shape. The 1.2 × 1.2 μm2 domain was divided into 4002 grids with grid size of . The interface width was set to , the time step was Δt = 3.85 × 10⁻⁵ s, the interface mobility was and the distance between γ′ particles was 0.5 μm. Figure 11b shows the microstructure after 1120 °C/2 h simulation, and the average size of γ′ particles is about 0.27 μm at this time.
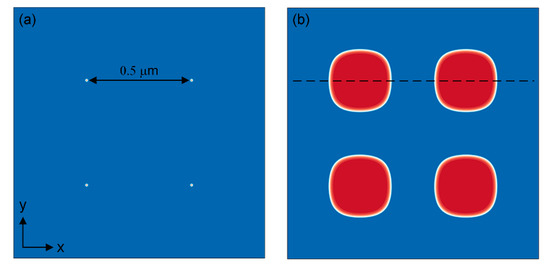
Figure 11.
The regular alignment of γ′ phase at t = 0 (a) and microstructure after 1120 °C/2 h (b).
3.2.1. Chemical Driving Force
There are many refractory elements such as Mo, W and Re in DD6, which can be used to increase the heat resistance of a superalloy, and can be divided into γ′-formers (Al, Ta, etc.) and γ-formers (Co, Cr, Mo, Re, etc.) [32]. These elements have great effects on the chemical driving force of γ′ growth, shown as Equation (11).
Figure 12a depicted the elements distribution at the dotted line in Figure 11b. It can be seen that Al and Ta elements are mainly distributed in γ′ phase, and Co, Cr and Mo elements are mainly distributed in the γ phase, consistent with the above classification. The concentration of Re and W are basically the same in the two phases, only slightly fluctuating in the γ/γ′ interface. The distribution of Re and W are shown in Figure 13. They were captured by the interface, which was probably caused by their slow diffusion rate.
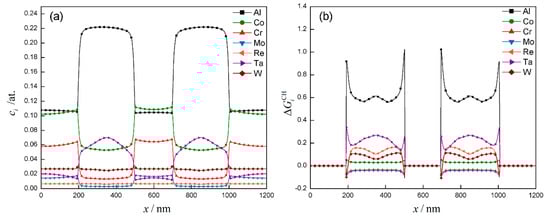
Figure 12.
The elements distribution (a) and chemical driving force distribution (b) of DD6 superalloy after 1120 °C/2 h.
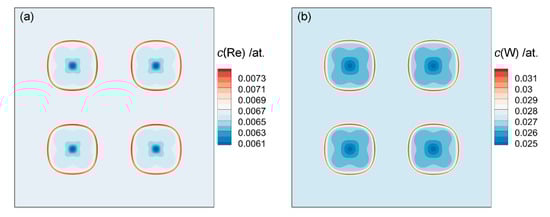
Figure 13.
The distribution of Re (a) and W (b) element in DD6 superalloy after 1120 °C/2 h.
Figure 12 depicted the distribution of chemical driving force. The chemical driving force contribution of each element is normalized by dividing it by the total chemical driving force. Positive means that the element i promotes the growth of γ′ phase, otherwise it inhibits the growth of γ′ phase. It can be seen that Al element contributes most of chemical driving force for the γ′ growth, with exceeding 0.6 in the γ′ phase and exceeding 0.9 in the γ/γ′ interface. Ta element follows with exceeding 0.2. Co, Cr and Mo elements contribute a relatively small chemical driving force. It is worth noting that is about 0.1 in the γ′ phase, but becomes negative in the γ/γ′ interface, which means the enrichment of Re and W will inhibit the growth of γ′ phase. Kundin et al. [33] conducted long-term aging experiments and phase-field simulation for CMSX-4 (containing Re, W) and CMSX-6 (not containing Re and W) alloys at 1000 °C. The results suggested that the coarsening rate of CMSX-6 is larger than that of CMSX-4, which proves that Re and W elements can slow the coarsening of γ′ phase. This is also one of the reasons why an appropriate amount of Re is added in high-generation Ni-based single crystal superalloy.
3.2.2. Elastic Driving Force
The elastic driving force also plays an important role in the growth of γ′ phase. Studies [8] have shown that elastic energy has little effect on the equilibrium area fraction of γ′ phase, but has great influence on the shape of γ′ phase. If elastic energy is considered in the simulation, the shape of γ′ phase will change from spherical to cuboidal. Therefore, this subsection will discuss the mechanism of the effect of elastic driving force on the shape of γ′ phase.
Figure 14a shows the distribution of the ratio of elastic driving force to chemical driving force after 1120 °C/2 h simulation, which can reflect the relative contribution of elastic driving force to the growth of γ′ phase. The result shows that is relatively larger at the corners, namely the <111> direction of γ′ particles. This uneven distribution of elastic driving force due to elastic anisotropy is discussed in more detail in the study of Cottura et al. [7]. Figure 14b shows the distribution of von Mises stress, , which can reflect the degree of stress concentration. Due to the elastic constants difference and the lattice misfit between γ′ and γ phase, is larger in the <111> direction of γ′ particles. According to Equation (13), the stress concentration here leads to larger elastic driving force, and makes γ′ precipitates grow into a cuboidal shape gradually.
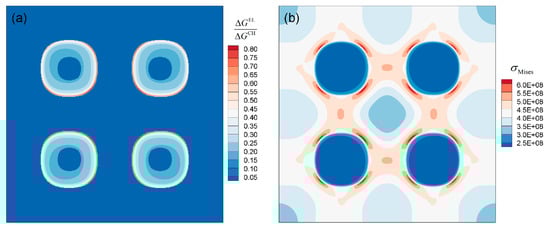
Figure 14.
The ratio of elastic driving force to chemical driving force (a) and von Mises stress distribution (b) of DD6 superalloy after 1120 °C/2 h.
3.3. Growth Law of γ′ Phase
The kinetics of multi-particle coarsening is quantitatively described by the well-known Lifshitz−Slyosov−Wagner (LSW) theory [34], which needs to satisfy the assumptions that spherical particles grow in an infinite matrix and there is no elastic stress between the particles and matrix initially. The theory suggests that in a diffusion-control-coarsening system, the average particle radius will satisfy the relationship:
where k is a constant, m is the coarsening exponent and usually equals 3. In Ni-based superalloys, the elastic stress caused by the difference in lattice and elastic constants of γ/γ′ phase may has effect on the growth of γ′ precipitates. Experimental and simulation studies [35] have confirmed that in the Ni−Al−Mo ternary alloy with small elastic effects, the classic LSW theory is still applicable. Other studies [36] have shown that when the elastic effect is more significant, the value of the coarsening exponent m will change.
The growth kinetics of the γ′ phase was studied by the isothermal simulation, shown as the Section 3.1.1. The average size of γ′ precipitates during simulation is plotted as Figure 15a. roughly goes through three stages. It increases rapidly at the beginning, then slows down, and finally remained at 449 nm. In more detail, the Equation (25) can be transformed into
where is time exponent and can be calculated by the slope of ~ curve, shown as Figure 15b. The linear fitting result shows that the value of n in three stages is 1.282, 0.353 and 0.081, respectively. There is obvious transition platform between the first and second stage and the second stage is basically in line with the law.
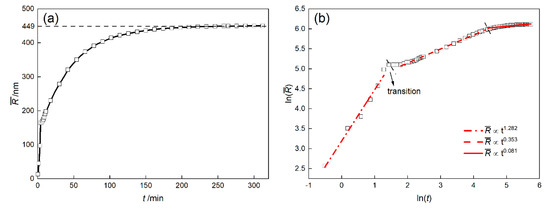
Figure 15.
The average size of γ′ precipitates curve (a) and (b) of DD6 superalloy at 1120 °C.
The research of Maebashi et al. [37] on the γ′ precipitation in a ternary Ni−Al−Ti system also shows that the relationship is satisfied at the initial stage and the growth rate of γ′ phase will slow down after entering the coarsening stage. Wu et al. [38] divides the process into three stages: nucleation and initial growth, growth and coarsening, and quasi-static coarsening, the time exponent n of which is 1.35, 0.42 and 0.22, respectively. In the research of Yang et al. [8], the change of γ′ phase can be divided into growth and coarsening. In the growth stage, the fine γ′ precipitates have a rapid growth process, which is controlled by the short-range diffusion of elements. In the coarsening stage, the growth of γ′ phase is controlled by long-range diffusion. Due to the elements diffusion, the concentration is close to the equilibrium state, and the driving force is decreased, so the growth of γ′ phase slows down.
All in all, the classical relationship cannot be simply applied to the growth of γ′ phase in Ni-based superalloys due to the effects of elasticity and element diffusion. According to the multi-phase field simulation results, the growth of γ′ phase is divided into rapid growth, coarsening and quasi-static coarsening stages, and a theory more suitable for Ni-based superalloys can be developed.
4. Conclusions
The nucleation and growth law of γ′ phase in DD6 superalloy during conditions at 1120 °C/4 h and a subsequent cooling process were studied in this paper. For this purpose, a multiphase-field model coupled with an explicit nucleation algorithm was proposed. The main conclusions are listed as follows.
- (1)
- The multicomponent multiphase-field model coupled with explicit nucleation algorithm in this paper provides a good method for studying the microstructure evolutions of precipitation and growth phenomena in multicomponent elastic-inhomogeneous systems.
- (2)
- At 1120 °C/4 h isothermal conditions, the Avrami exponent of γ′ nucleation will decrease gradually, which is affected by the “soft impingement” phenomenon.
- (3)
- During the 25–125 °C/min cooling process, bimodal distribution composed of cuboidal γ′ precipitates and fine secondary γ′ precipitates is formed. With the increase in cooling rate, the number of γ′ precipitates increases first and then decreases, which reflects the competition of undercooling and diffusion.
- (4)
- The element Al contributes most of the chemical driving force for the γ′ growth, followed by Ta, while Re and W gather at the γ/γ′ phase interface to inhibit the growth of γ′ phase. Due to the lattice misfit and the difference in elastic constants between γ and γ′ phases, the stress and elastic driving force are concentrated in <111> direction of the γ′ phase, which causes γ′ phases to have a cuboidal shape.
- (5)
- The well-known relationship cannot be simply applied to the growth of γ′ phase in Ni-based superalloys due to the effects of elasticity and element diffusion. According to the multi-phase field simulation results, the growth of γ′ phase can be divided into rapid growth, coarsening and quasi-static coarsening stages.
Author Contributions
Y.Z. wrote the program, completed the simulation work, post-processed the results and drafted the manuscript. Q.X. supervised all the simulation work and revised the manuscript. All the authors discussed the results and contributed to the final manuscript. All authors have read and agreed to the published version of the manuscript.
Funding
This research was funded by the National Science and Technology Major Project (2017-VI-0003-0073 and 2017-VII-0008-0101) and the National Key Research and Development Program of China (2017YFB0701503).
Conflicts of Interest
The authors declare no conflict of interest.
References
- Shi, Z.X.; Liu, S.Z.; Li, J.R. Rejuvenation Heat Treatment of the Second-Generation Single-Crystal Superalloy DD6. Acta Metall. Sin. 2015, 28, 1278–1285. [Google Scholar] [CrossRef]
- Su, X.; Sun, C.; Xu, Q.; Liu, B. Thermodynamic Simulation Calculation on Precipitation Behavior of Equilibrium Phases in a Low Re-bearing Nickel-based Single Crystal Superalloy. Rare Metal Mater. Eng. 2017, 46, 3699–3714. [Google Scholar]
- Kitashima, T.; Harada, H. A new phase-field method for simulating γ′ precipitation in multicomponent nickel-base superalloys. Acta Mater. 2009, 57, 2020–2028. [Google Scholar] [CrossRef]
- Wen, Y.H.; Simmons, J.P.; Shen, C.; Woodward, C.; Wang, Y. Phase-field modeling of bimodal particle size distributions during continuous cooling. Acta Mater. 2003, 51, 1123–1132. [Google Scholar] [CrossRef]
- Boussinot, G.; Finel, A.; Bouar, Y.L. Phase-field modeling of bimodal microstructures in nickel-based superalloys. Acta Mater. 2009, 57, 921–931. [Google Scholar] [CrossRef]
- Yang, M.; Zhang, J.; Wei, H.; Gui, W. Influence of cooling rate on the formation of bimodal microstructures in nickel-base superalloys during continuous two-step aging. Comput. Mater. Sci. 2018, 149, 14–20. [Google Scholar] [CrossRef]
- Cottura, M.; Le Bouar, Y.; Appolaire, B.; Finel, A. Rôle of elastic inhomogeneity in the development of cuboidal microstructures in Ni-based superalloys. Acta Mater. 2015, 94, 15–25. [Google Scholar] [CrossRef]
- Yang, M.; Wei, H.; Zhang, J.; Zhao, Y.; Jin, T.; Liu, L.; Sun, X.F. Phase-field study on effects of antiphase domain and elastic energy on evolution of γ′ precipitates in nickel-based superalloys. Comput. Mater. Sci. 2017, 129, 211–219. [Google Scholar] [CrossRef]
- Steinbach, I.; Apel, M. Multi phase field model for solid state transformation with elastic strain. Phys. D 2006, 217, 153–160. [Google Scholar] [CrossRef]
- Grosdidier, T.; Hazotte, A.; Simon, A. Precipitation and dissolution processes in γ/γ′ single crystal nickel-based superalloys. Mater. Sci. Eng. A 1998, 256, 183–196. [Google Scholar] [CrossRef]
- Yu, J.; Li, J.; Shi, Z.; Wang, X.; Liu, S.; Zhao, J. Precipitation of Secondary gamma’ Phase of DD6 Single Crystal Superalloy. Rare Metal Mater. Eng. 2013, 42, 1654–1658. [Google Scholar]
- Wang, Y.; Banerjee, D.; Su, C.C.; Khachaturyan, A.G. Field kinetic model and computer simulation of precipitation of L12 ordered intermetallics from f.c.c. solid solution. Acta Mater. 1998, 46, 2983–3001. [Google Scholar] [CrossRef]
- Eiken, J.; Böttger, B.; Steinbach, I. Multiphase-field approach for multicomponent alloys with extrapolation scheme for numerical application. Phys. Rev. E 2006, 73, 066–122. [Google Scholar] [CrossRef] [PubMed]
- Yang, C.; Xu, Q.; Liu, B. A high precision extrapolation method in multiphase-field model for simulating dendrite growth. J. Cryst. Growth 2018, 490, 25–34. [Google Scholar] [CrossRef]
- Guo, W.; Steinbach, I.; Somsen, C.; Eggeler, G. On the effect of superimposed external stresses on the nucleation and growth of Ni4Ti3 particles: A parametric phase field study. Acta Mater. 2011, 59, 3287–3296. [Google Scholar] [CrossRef]
- Biner, S.B. Solving Phase-Field Models with Fourier Spectral Methods. In Programming Phase-Field Modeling; Springer Cham: Idaho Falls, ID, USA, 2017; pp. 99–168. [Google Scholar]
- Simmons, J.P.; Shen, C.; Wang, Y. Phase field modeling of simultaneous nucleation and growth by explicitly incorporating nucleation events. Scr. Mater. 2000, 43, 935–942. [Google Scholar] [CrossRef]
- Simmons, J.P.; Wen, Y.H.; Shen, C.; Wang, Y.Z. Microstructural development involving nucleation and growth phenomena simulated with the Phase Field method. Mater. Sci. Eng. A 2004, 365, 136–143. [Google Scholar] [CrossRef]
- Ardell, A.J. The effects of elastic interactions on precipitate microstructural evolution in elastically inhomogeneous nickel-base alloys. Philos. Mag. 2014, 94, 2101–2130. [Google Scholar] [CrossRef]
- Zhu, J.Z.; Wang, T.; Zhou, S.H.; Liu, Z.K.; Chen, L.Q. Quantitative interface models for simulating microstructure evolution. Acta Mater. 2004, 52, 833–840. [Google Scholar] [CrossRef]
- Manga, V.R.; Shang, S.L.; Wang, W.Y.; Wang, Y.; Liang, J.; Crespi, V.H.; Liu, Z.K. Anomalous phonon stiffening associated with the (111) antiphase boundary in L12 Ni3Al. Acta Mater. 2015, 82, 287–294. [Google Scholar] [CrossRef]
- Zhang, Y.; Wang, J.; Yang, Y.; Yang, G.; Zhou, Y. Phase-field simulation of the effect of interactions between ordered domains on transformation kinetics in precipitation. Model. Simul. Mater. Sci. Eng. 2008, 16, 025004. [Google Scholar] [CrossRef]
- Jiang, X.W.; Wang, D.; Xie, G.; Li, H.; Lou, L.; Zhang, J. The Effect of Long-Term Thermal Exposure on the Microstructure and Stress Rupture Property of a Directionally Solidified Ni-Based Superalloy. Metall. Mater. Trans. A 2014, 45, 6016–6026. [Google Scholar] [CrossRef]
- Rafiei, M.; Mirzadeh, H.; Malekan, M.; Sohrabi, M.J. Homogenization kinetics of a typical nickel-based superalloy. J. Alloys Compd. 2019, 793, 277–282. [Google Scholar] [CrossRef]
- Avrami, M. Kinetics of Phase Change. I. General Theory. J. Chem. Phys. 1939, 7, 1103–1112. [Google Scholar] [CrossRef]
- Avrami, M. Kinetics of Phase Change. II Transformation-Time Relations for Random Distribution of Nuclei. J. Chem. Phys. 1940, 8, 212–224. [Google Scholar] [CrossRef]
- Avrami, M. Granulation, Phase Change, and Microstructure Kinetics of Phase Change. III. J. Chem. Phys. 1941, 9, 177–184. [Google Scholar] [CrossRef]
- Pradell, T.; Crespo, D.; Clavaguera, N.; Clavaguera-Mora, M.T. Diffusion controlled grain growth in primary crystallization: Avrami exponents revisited. J. Phys. Condens. Matter 1998, 10, 3833–3844. [Google Scholar] [CrossRef]
- Asta, M.; Beckermann, C.; Karma, A.; Kurz, W.; Napolitano, R.; Plapp, M.; Purdy, G.; Rappaz, M.; Trivedi, R. Solidification microstructures and solid-state parallels: Recent developments, future directions. Acta Mater. 2009, 57, 941–971. [Google Scholar] [CrossRef]
- Gránásy, L.; Rátkai, L.; Szállás, A.; Korbuly, B.; Tóth, G.I.; Környei, L.; Pusztai, T. Phase-Field Modeling of Polycrystalline Solidification: From Needle Crystals to Spherulites-A Review. Metall. Mater. Trans. A 2014, 45, 1694–1719. [Google Scholar] [CrossRef]
- Mao, J.; Chang, K.M.; Yang, W.H.; Ray, K.; Vaze, S.P.; Furrer, D.U. Cooling precipitation and strengthening study in powder metallurgy superalloy U720LI. Metall. Mater. Trans. A 2001, 32, 2441–2452. [Google Scholar] [CrossRef]
- Mushongera, L.T.; Fleck, M.; Kundin, J.; Wang, Y.; Emmerich, H. Effect of Re on directional γ′-coarsening in commercial single crystal Ni-base superalloys: A phase field study. Acta Mater. 2015, 93, 60–72. [Google Scholar] [CrossRef]
- Kundin, J.; Mushongera, L.; Goehler, T.; Emmerich, H. Phase-field modeling of the γ′-coarsening behavior in Ni-based superalloys. Acta Mater. 2012, 60, 3758–3772. [Google Scholar] [CrossRef]
- Slyozov, V.V.; Lifshitz, I.M.; Slyozov, V.V. The kinetics of precipitation from supersaturated solid solutions. J. Phys. Chem. Solids 1961, 19, 35–50. [Google Scholar] [CrossRef]
- Wang, T.; Sheng, G.; Liu, Z.K.; Chen, L.Q. Coarsening kinetics of γ′ precipitates in the Ni–Al–Mo system. Acta Mater. 2008, 56, 5544–5551. [Google Scholar] [CrossRef]
- Fratzl, P.; Penrose, O.; Lebowitz, J.L. Modelling of Phase Separation in Alloys with Coherent Elastic Misfit. J. Stat. Phys. 1999, 95, 1429–1503. [Google Scholar] [CrossRef]
- Maebashi, T.; Doi, M. Coarsening behaviours of coherent γ′ and γ precipitates in elastically constrained Ni–Al–Ti alloys. Mater. Sci. Eng. A 2004, 373, 72–79. [Google Scholar] [CrossRef]
- Wu, X.C.; Li, Y.S.; Huang, M.Q.; Liu, W.; Hou, Z.Y. Precipitation kinetics of ordered γ′ phase and microstructure evolution in a Ni-Al alloy. Mater. Chem. Phys. 2016, 182, 125–132. [Google Scholar] [CrossRef]
© 2020 by the authors. Licensee MDPI, Basel, Switzerland. This article is an open access article distributed under the terms and conditions of the Creative Commons Attribution (CC BY) license (http://creativecommons.org/licenses/by/4.0/).