Article

Stress–Corrosion Cracking of AISI 316L Stainless Steel in Seawater Environments: Effect of Surface Machining

1
Department of Materials Science and Engineering, Case Western Reserve University, 10900 Euclid Avenue, Cleveland, OH 44106, USA
2
FeNix Magnetics, Inc, Westlake, OH 44145-7212, USA
*
Author to whom correspondence should be addressed.
These authors contributed equally to this work.
Metals 2020, 10(10), 1324; https://doi.org/10.3390/met10101324
Submission received: 18 August 2020 / Revised: 23 September 2020 / Accepted: 1 October 2020 / Published: 3 October 2020

Abstract

:
To understand the effect of surface machining on the resistance of AISI 316L to SCC (stress–corrosion cracking) in marine environments, we tested AISI 316L nuts surface-machined by different methods in a seawater-spraying chamber. Two forms of cracks were observed: on the machined surface and underneath it. On the surface, cracks connected with the pitting sites were observed to propagate perpendicular to the hoop-stress direction, identifying them as stress–corrosion cracks. Under the surface, catastrophic transgranular cracks developed, likely driven by hydrogen embrittlement caused by the chloride-concentrating level of humidity in the testing environment. Under constant testing conditions, significantly different SCC resistance was observed depending on how the nuts had been machined. Statistical evaluation of the nut surface-crack density indicates that machining by a “form” tool yields a crack density one order of magnitude lower than machining by a “single-point” tool. Microstructural analysis of form-tool-machined nuts revealed a homogeneous deformed subsurface zone with nanosized grains, leading to enhanced surface hardness. Apparently, the reduced grain size and/or the associated mechanical hardening improve resistance to SCC. The nanograin subsurface zone was not observed on nuts machined by a single-point tool. Surface roughness measurements indicate that single-point-tool-machined nuts have a rougher surface than form-tool machined nuts. Apparently, surface roughness reduces SCC resistance by increasing the susceptibility to etch attack in Cl--rich solutions. The results of X-ray diffractometry and transmission electron microscopy diffractometry indicate that machining with either tool generates a small volume fraction (< 0.01) of strain-induced martensite. However, considering the small volume fraction and absence of martensite in regions of cracking, martensite is not primarily responsible for SCC in marine environments.

Graphical Abstract

1. Introduction

SCC, stress–corrosion cracking, a form of material degradation that is sensitive to the environment, happens under synergistic action of chemical attack from the environment and applied stress [1]. SCC has been recognized as one of the leading failure causes of 300-series austenitic stainless steels [2,3]. Within this series, AISI 316L possesses good mechanical properties and immunity to impingement attack [4]. Therefore, AISI 316L is widely used in marine applications, e.g., in compression tube-fitting and recirculation piping [2]. In contact with seawater, however, the corrosion resistance of AISI 316L is insufficient in many technical applications [4,5]. In particular, AISI 316L in seawater undergoes localized pitting corrosion. In the presence of tensile stress, pitting corrosion can become a precursor of crevice corrosion and SCC [6].
Previous studies indicate that certain environmental parameters have a cumulative effect on the degradation of AISI 316L. These parameters include temperature, Cl- concentration, pH value, and sea current [5,6,7,8]. Most prior tests were performed under accelerated conditions, in static salt spray, or submerged. In actual service environments, evaporation can produce local build-up of aggressive corrosive substances, such as chlorides and H+ ions, resulting in conditions that are substantially more aggressive. Under severe evaporative conditions, stainless steels can crack earlier and at lower stress levels than under conditions of full immersion.
Beyond the environmental factors, it has been realized that the surface and subsurface microstructure of materials is of critical importance for the onset of pitting corrosion and crack initiation. The integrity of the surface correlates with microscopic features introduced by surface machining and grinding operation [2], including surface roughness [9], microstructure evolution [10,11], phase transformation [10,11], and residual stress [3,12,13]. Malik et al. discuss the effect of surface finish of AISI 304L and AISI 316L stainless steel, prepared by grinding with different grades of SiC abrasive paper, on the susceptibility to crevice corrosion in seawater at 298K and 323K. While measurable crevice corrosion happened to the ground steels, no corrosive attack was found after the surfaces were cleaned and polished [6]. Zhang et al. investigated the effect of machining-induced residual stress on the SCC initiation in milled in boiling MgCl2. They reported that increased residual tensile stress remaining in the machining-affected layer can lead to higher microcrack initiation rate and microcrack density [3] under otherwise constant conditions. Zhong et al. noticed increased surface hardness on drilled and claimed that this increases the susceptibility to SCC [14].
Albeit many studies characterize and discuss machining-induced surface and subsurface property changes of AISI 316L and its susceptibility to SCC, no study systematically reports how different machining methods affect the SCC susceptibility of AISI 316L exposed in marine environment. Exploring the potential of increasing alloy performance and SCC-limited lifetime by proper surface machining is of great interest in manufacturing. From a scientific perspective, we want to understand how different surface machining procedures generate different surface morphologies and subsurface microstructures and how these microscopic features impact the material’s resistance to SCC.
In this work, we study the micromechanisms leading to different seawater SCC susceptibility of AISI 316L tube-fitting nuts surface machined by three different tools. To analyze the effect of salt concentration by water evaporation, we exposed the nuts to a new salt-spray test protocol including cyclic exposure to two levels of humidity. The following machining induced factors leading to SCC are investigated. (1) Surface and subsurface microstructure, spatial distribution of atom species, and stress state. (2) Phase transformation, e.g., from austenite to martensite. (3) Machining-induced change in surface roughness. Based on experimental observations under simulated off-shore conditions, we discuss how the SCC susceptibility of the AISI 316L nuts correlates with these machining-induced factors, rank them by importance, and propose a model on machining induced factors and their impact on SCC susceptibility.

2. Experimental Methods

The specimens were Swagelok® 3/8 (9.5mm) and 1/2 (12.7mm) tube-fitting nuts, made of AISI 316L austenitic stainless steel, as sketched in Figure 1. The standards used by Swagelok for procuring bar stock to machine AISI 316L nuts are ASTM A276 and ASTM A479. Table 1 indicates the atom fractions of the major elements, according to the manufacturer. The atom fractions of Cr and Ni in Swagelok® tube-fitting nuts are higher than those of industry-typical AISI 316L tube-fitting nuts, where X Cr = 0.170 and X Ni = 0.094 . For comparative experimental observations, the nuts were surface machined by three different types of tools: a single-point tool, “SPT”, and two different types form tools, “FT1” and “FT2”, respectively.
As a shorthand, we use the following specimen designations.
SPT:AISI 316L nuts machined by a single-point tool.
FT1:AISI 316L nuts machined by a form tool of the first type.
FT2:AISI 316L nuts machined by a form tool of the second type.
Figure 2 shows a testing protocol derived from SAE J2334 and ASTM B117 (co-developed by Swagelok and ExxonMobil) to evaluate the SCC susceptibility of assembled and pressurized AISI 316L tube fittings in a simulated offshore platform marine (seawater) environment. Four 3/8 (9.5mm) nuts machined by each method were assembled in tube fittings and pre-stressed with 0.10GPa tensile stress, which is at least 2.0 times the advertised maximum working pressure. Each assembly was pressurized with N2 to test pressure and monitored for leakage for 0.60ks prior to SCC testing.
For 2.6Ms (720h), the stressed nuts were placed in a saltwater-spraying chamber that utilized simulated seawater per ASTM D1141 at a constant temperature of 338K. During the exposure, the relative humidity ϕ was cycled between two distinct levels, ϕ 1 = 1.00 and ϕ 2 = 0.65 , with increasing exposure times t 1 , t 2 as shown in Figure 2. The relative humidity is defined as
ϕ = p H 2 O p H 2 O * .
p H 2 O and p H 2 O * denote the actual and the saturation partial pressure of water vapor, respectively. ϕ 1 was chosen to simulate full wetting of the installed tube fittings, e.g., by ocean storm or spray, while ϕ 2 was intended to simulate subsequent times of drying or evaporation, during which the chlorides concentrate on the tube fittings. To ensure constant stress levels, the assemblies were pressurized with water to the test pressure throughout the entire SCC test. After the stress–corrosion test, the nuts machined by different tools were disassembled and rinsed in deionized water for characterization.
To reveal the micromechanisms of SCC, comparative studies were performed on as-machined and stress–corrosion tested nuts. The defects and cracks of nuts were examined from annulus, chamfer, and cross-sectional surfaces perpendicular to the annulus surface (Figure 1). To investigate the machining effect on the subsurface microstructure, cross sections perpendicular to the annulus were prepared and polished down to a roughness <1. Near-surface microhardness–depth profiles were acquired from three locations on each nut using a Vickers hardness tester (Buehler 1600–4963). The hardness tests were performed with a constant load of 25gf for a dwell time of 10s. To eliminate the interference of surface corrosion products with the hardness testing, the hardness–depth profiles were recorded on the as-machined nuts. After the hardness test, the microstructure on the cross sections was revealed by metallographic etching with a mixture of HNO3 (assay: 0.68) and HCl (assay: 0.36) with a volume ratio of 1:3. The etched cross sections were studied using a light-optical microscope with a digital sensor (Keyence VHX 5000).
The near-surface phase composition was studied by XRD (X-ray diffractometry), using an X-ray diffractometer (Discover D8, Bruker) operating with monochromatic Co-K1 radiation (= 0.179nm). To depict the resulting diffractograms independent of the X-ray wavelength λ , they are plotted as a function of spatial frequency q : = 2 [ θ ] / λ , where θ denotes the angle the incident beam makes with the surface plane. To gain insight into the phase morphology and spatial distribution of phases, the polished cross sections of specimens were characterized by a dual- (scanning electron-/scanning focused ion) beam instrument (Nova NanoLab 200, FEI), equipped with an XEDS (X-ray energy-dispersive spectrometry) system operating with a silicon drift detector (XFlash 4010, Bruker).
To collect orientation maps by TEM (transmission electron microscopy) and analyze phase compositions at a sub-micrometer length scale, we employed an ASTAR system (nanoMEGAS), i.e. a TEM-based high-spatial-resolution orientation mapping tool. It acquires electron diffraction patterns while precessing the primary electron beam and determines local crystal orientation by comparing the digitized experimental diffraction pattern with a library of simulated patterns. The patterns we evaluated for the current work were acquired with a precession angle of 0.5.
To study the effect of surface roughness on the susceptibility to SCC, we analyzed the surface roughness of the annulus region of as-machined nuts using an optical profilometer (Zygo, NewView™ 7300). For a set of N heights z i measured at equi-spaced points x i along the x axis, a common single-number expression to describe the roughness is
R α : = 1 N i = 1 N | z i z ¯ | α 1 / α
Depending on the choice of α , deviations from the mean height z ¯ are weighed less or more aggressively. Choosing α = 1 corresponds to the arithmetical mean deviation from z ¯ , often denoted as R a . Choosing α = 2 yields the standard deviation of the z i from z ¯ (with weight N). For z ¯ = 0 , this is known as R q or RMS (root mean square), meaning the root of mean of the squares of the z i . R q is influenced more than R a by large deviations from the mean.
Roughness data were acquired from 8 areas of each nut, each area with a length of 2.8mm and a width of 2.1mm. This choice of the measured area is motivated by capturing the length scale that reflects the general surface topography of the nuts as well as microscopic differences in roughness caused by different methods of surface machining. To eliminate the effect of the nut shape on the surface roughness, the height data z i were numerically corrected for the actual cylinder profile of the nut to imitate a virtually flat surface.

3. Results

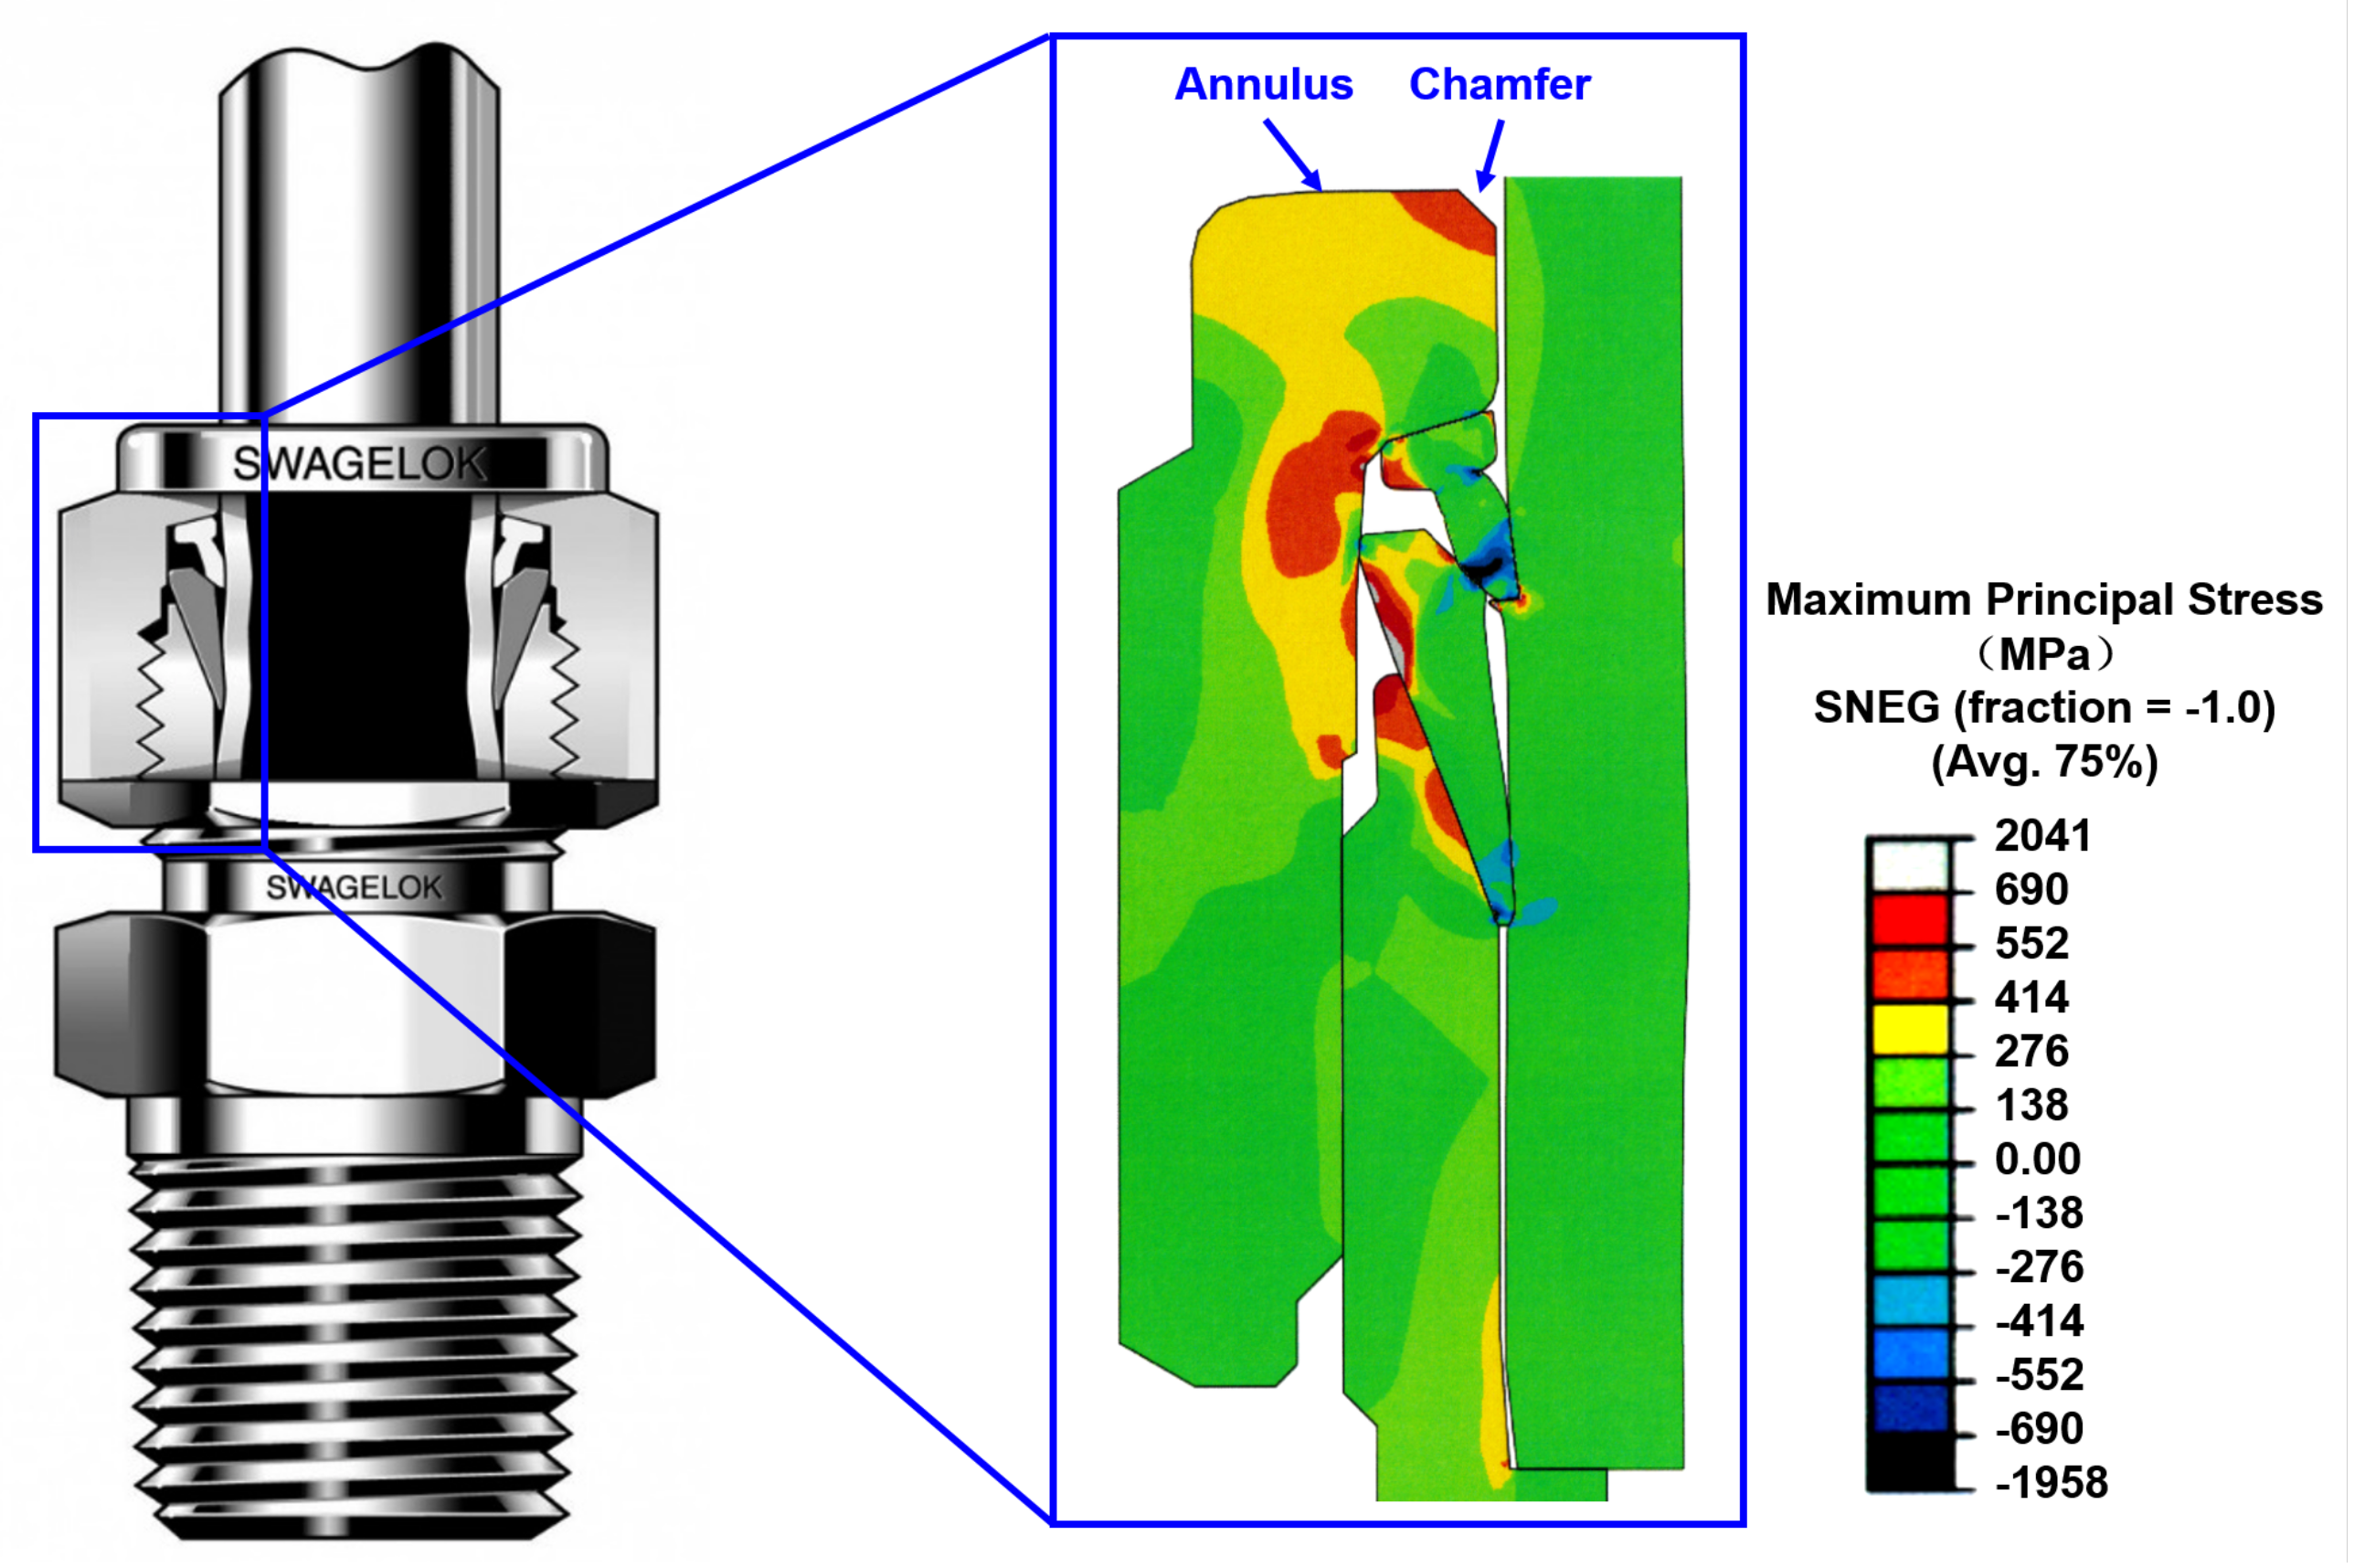
3.1. Stress Distribution

Figure 1 exhibits a nut in an assembled tube-fitting system. The diagram on the right presents the spatial variation of the maximum principal stress level during service. These data were obtained by finite-element analysis (courtesy of Swagelok). Accordingly, highly stressed regions (red) are conspicuous around the nut’s top annulus, chamfer, and the nut region in contact with the ferrule. Considering the nut’s top annulus and chamfer are frequently exposed to the environment, these locations may have the highest susceptibility to SCC in a corrosive environment. In the following, therefore, we focus on the test and characterization results of the annulus and chamfer.

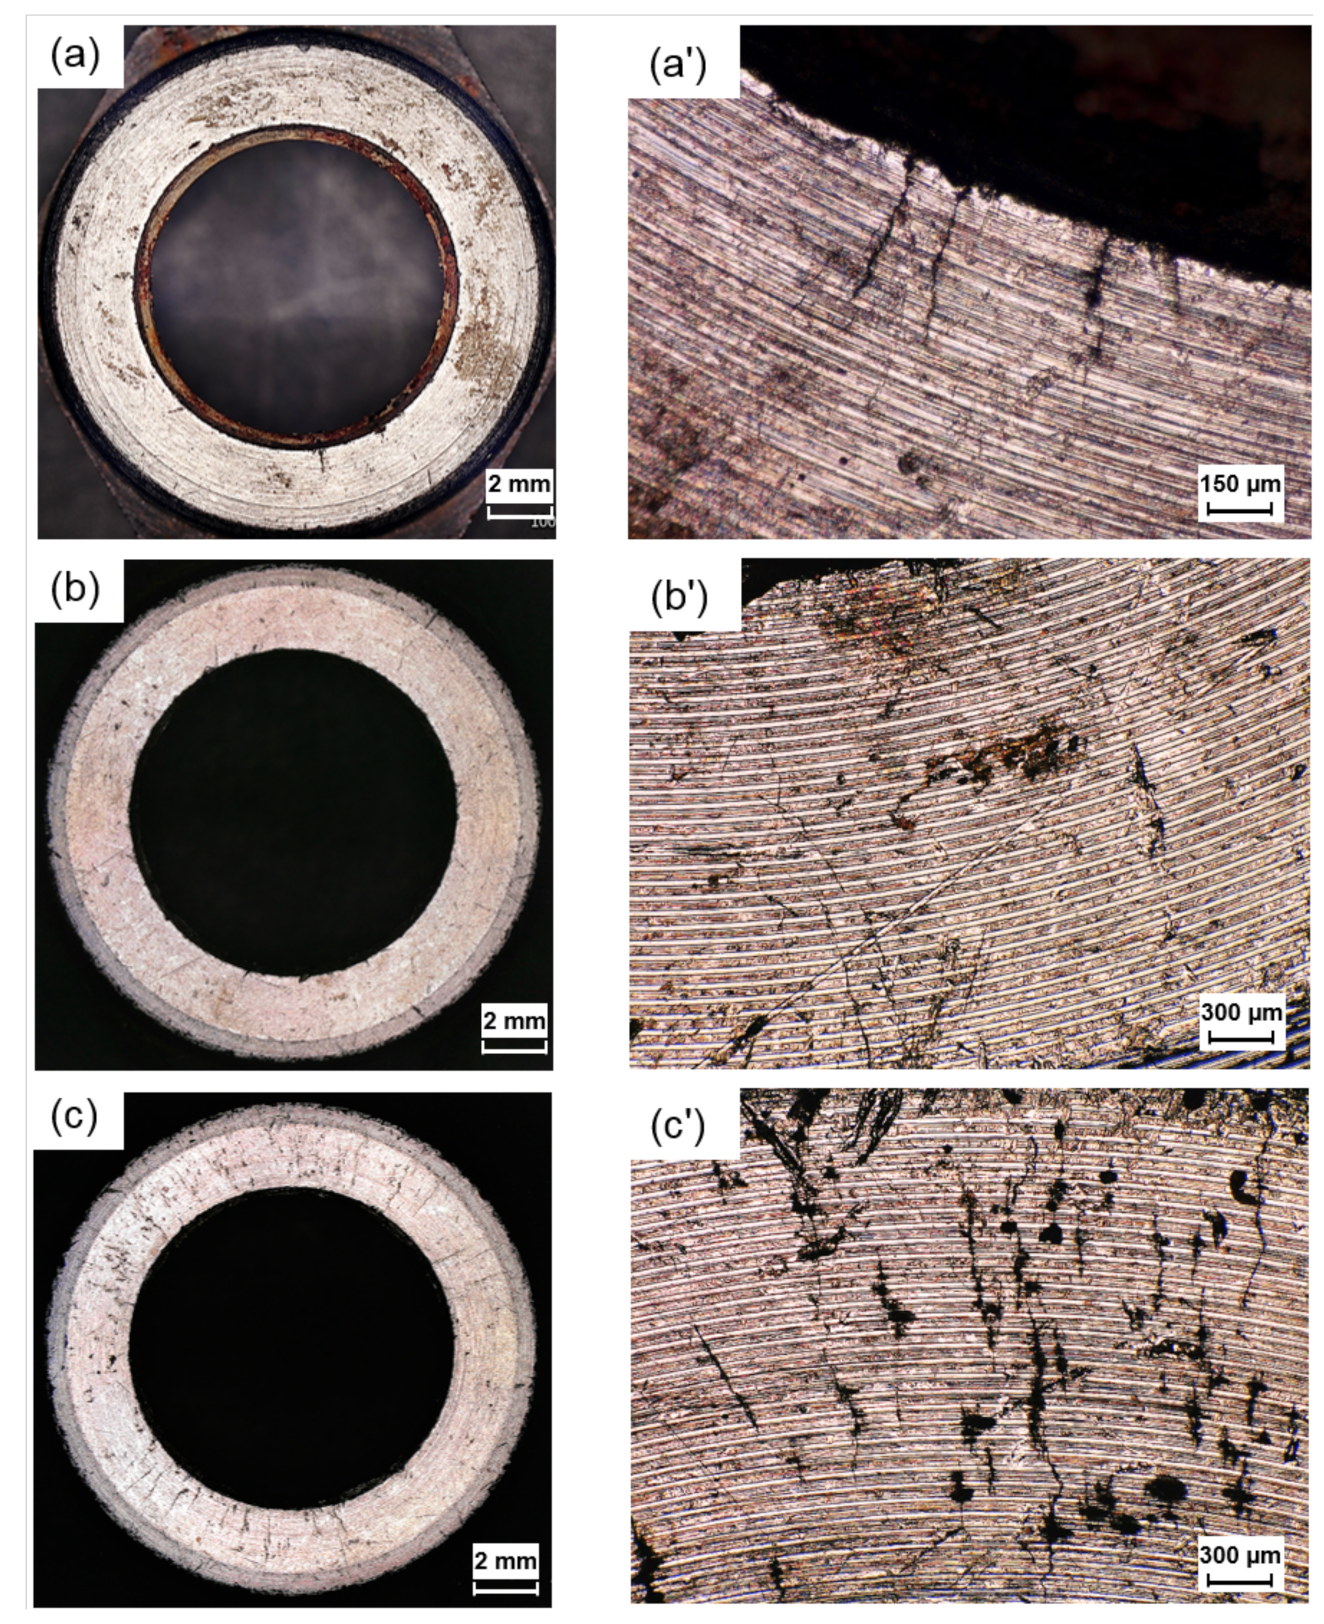
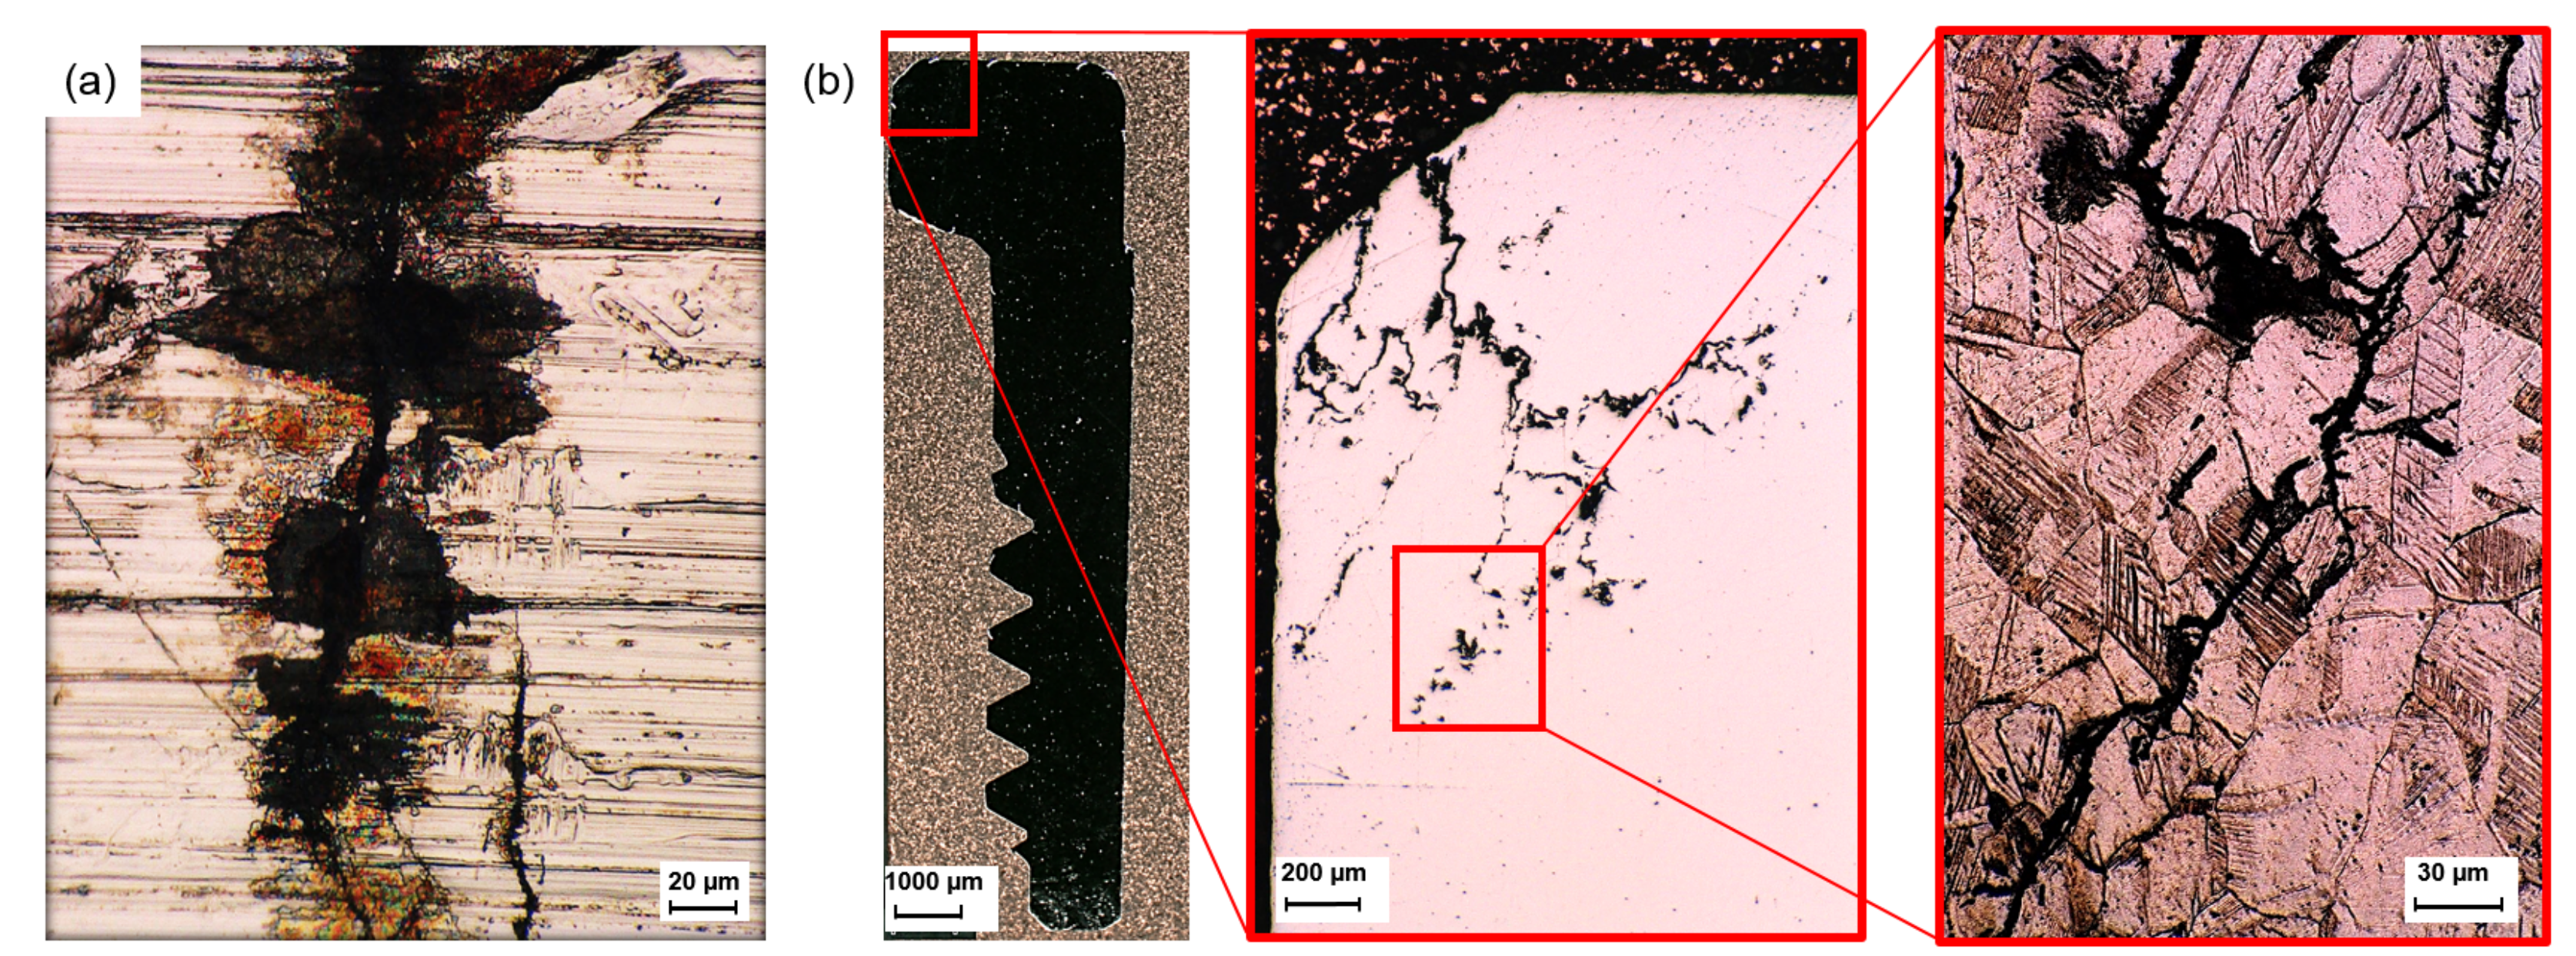
3.2. Crack Morphology

To detect SCC on the stress–corrosion tested nuts, we recorded light-optical micrographs at global and microscopic length scale, exhibited in Figure 3. From the global appearance, FT2 (Figure 3b) shows the highest resistance to SCC. FT1 (Figure 3a) features corrosion products and cracks radiating from the chamfer. SPT (Figure 3c) suffered the most severe SCC. From the global-scale micrographs (Figure 3a–c), we obtained quantitative numerical data for the crack distribution on the nut annulus surface and the crack density, i.e., crack length per area. For FT1, FT2, and SPT, respectively, the crack length per area is (13010)m-1, (255)m-1, and (1500100)m-1, respectively. Microscale investigation of the tested nut surfaces also yielded a ranking by SCC density ρ : ρ FT 2 < ρ FT 1 < ρ SPT (Figure 3a’–c’). Microscale images reveal that FT2 is not fully immune to the stress–corrosion test, as corrosion products also formed on the surface of this specimen. The radial propagation of the cracks reflects hoop stress acting on the nut top annulus and chamfer.
The results shown here are representative of all other nuts surface-machined and tested by the same respective methods.
Cracks with dissimilar morphology appear on and underneath the surface, indicating different formation micromechanisms. Almost every crack appearing on the annulus, shown in Figure 3c’, is connected with pitting corrosion sites. The pit sizes range from tens to hundreds of micrometers. Figure 4a shows a magnified individual stress—corrosion crack on the annulus of SPT. The crack originated from—and propagated through—several pitting sites. Even after rinsing, the brownish corrosion products, confirmed to be a combination of oxides and hydroxides [15,16], are visible around the pitting sites. This evidence indicates that pitting sites serve as precursors for SCC. Besides, analysis around the chamfer cross section of FT1 (Figure 4b) reveals catastrophic cracks with a length of several millimeters and branched out under the surface. Unlike the hoop stress-induced SCC radiating from the center of the annulus surface, the cracks developed underneath the surface exhibit crack branching and deflection. Microstructural analysis around the crack region shows that the cracks propagated transgranularly.

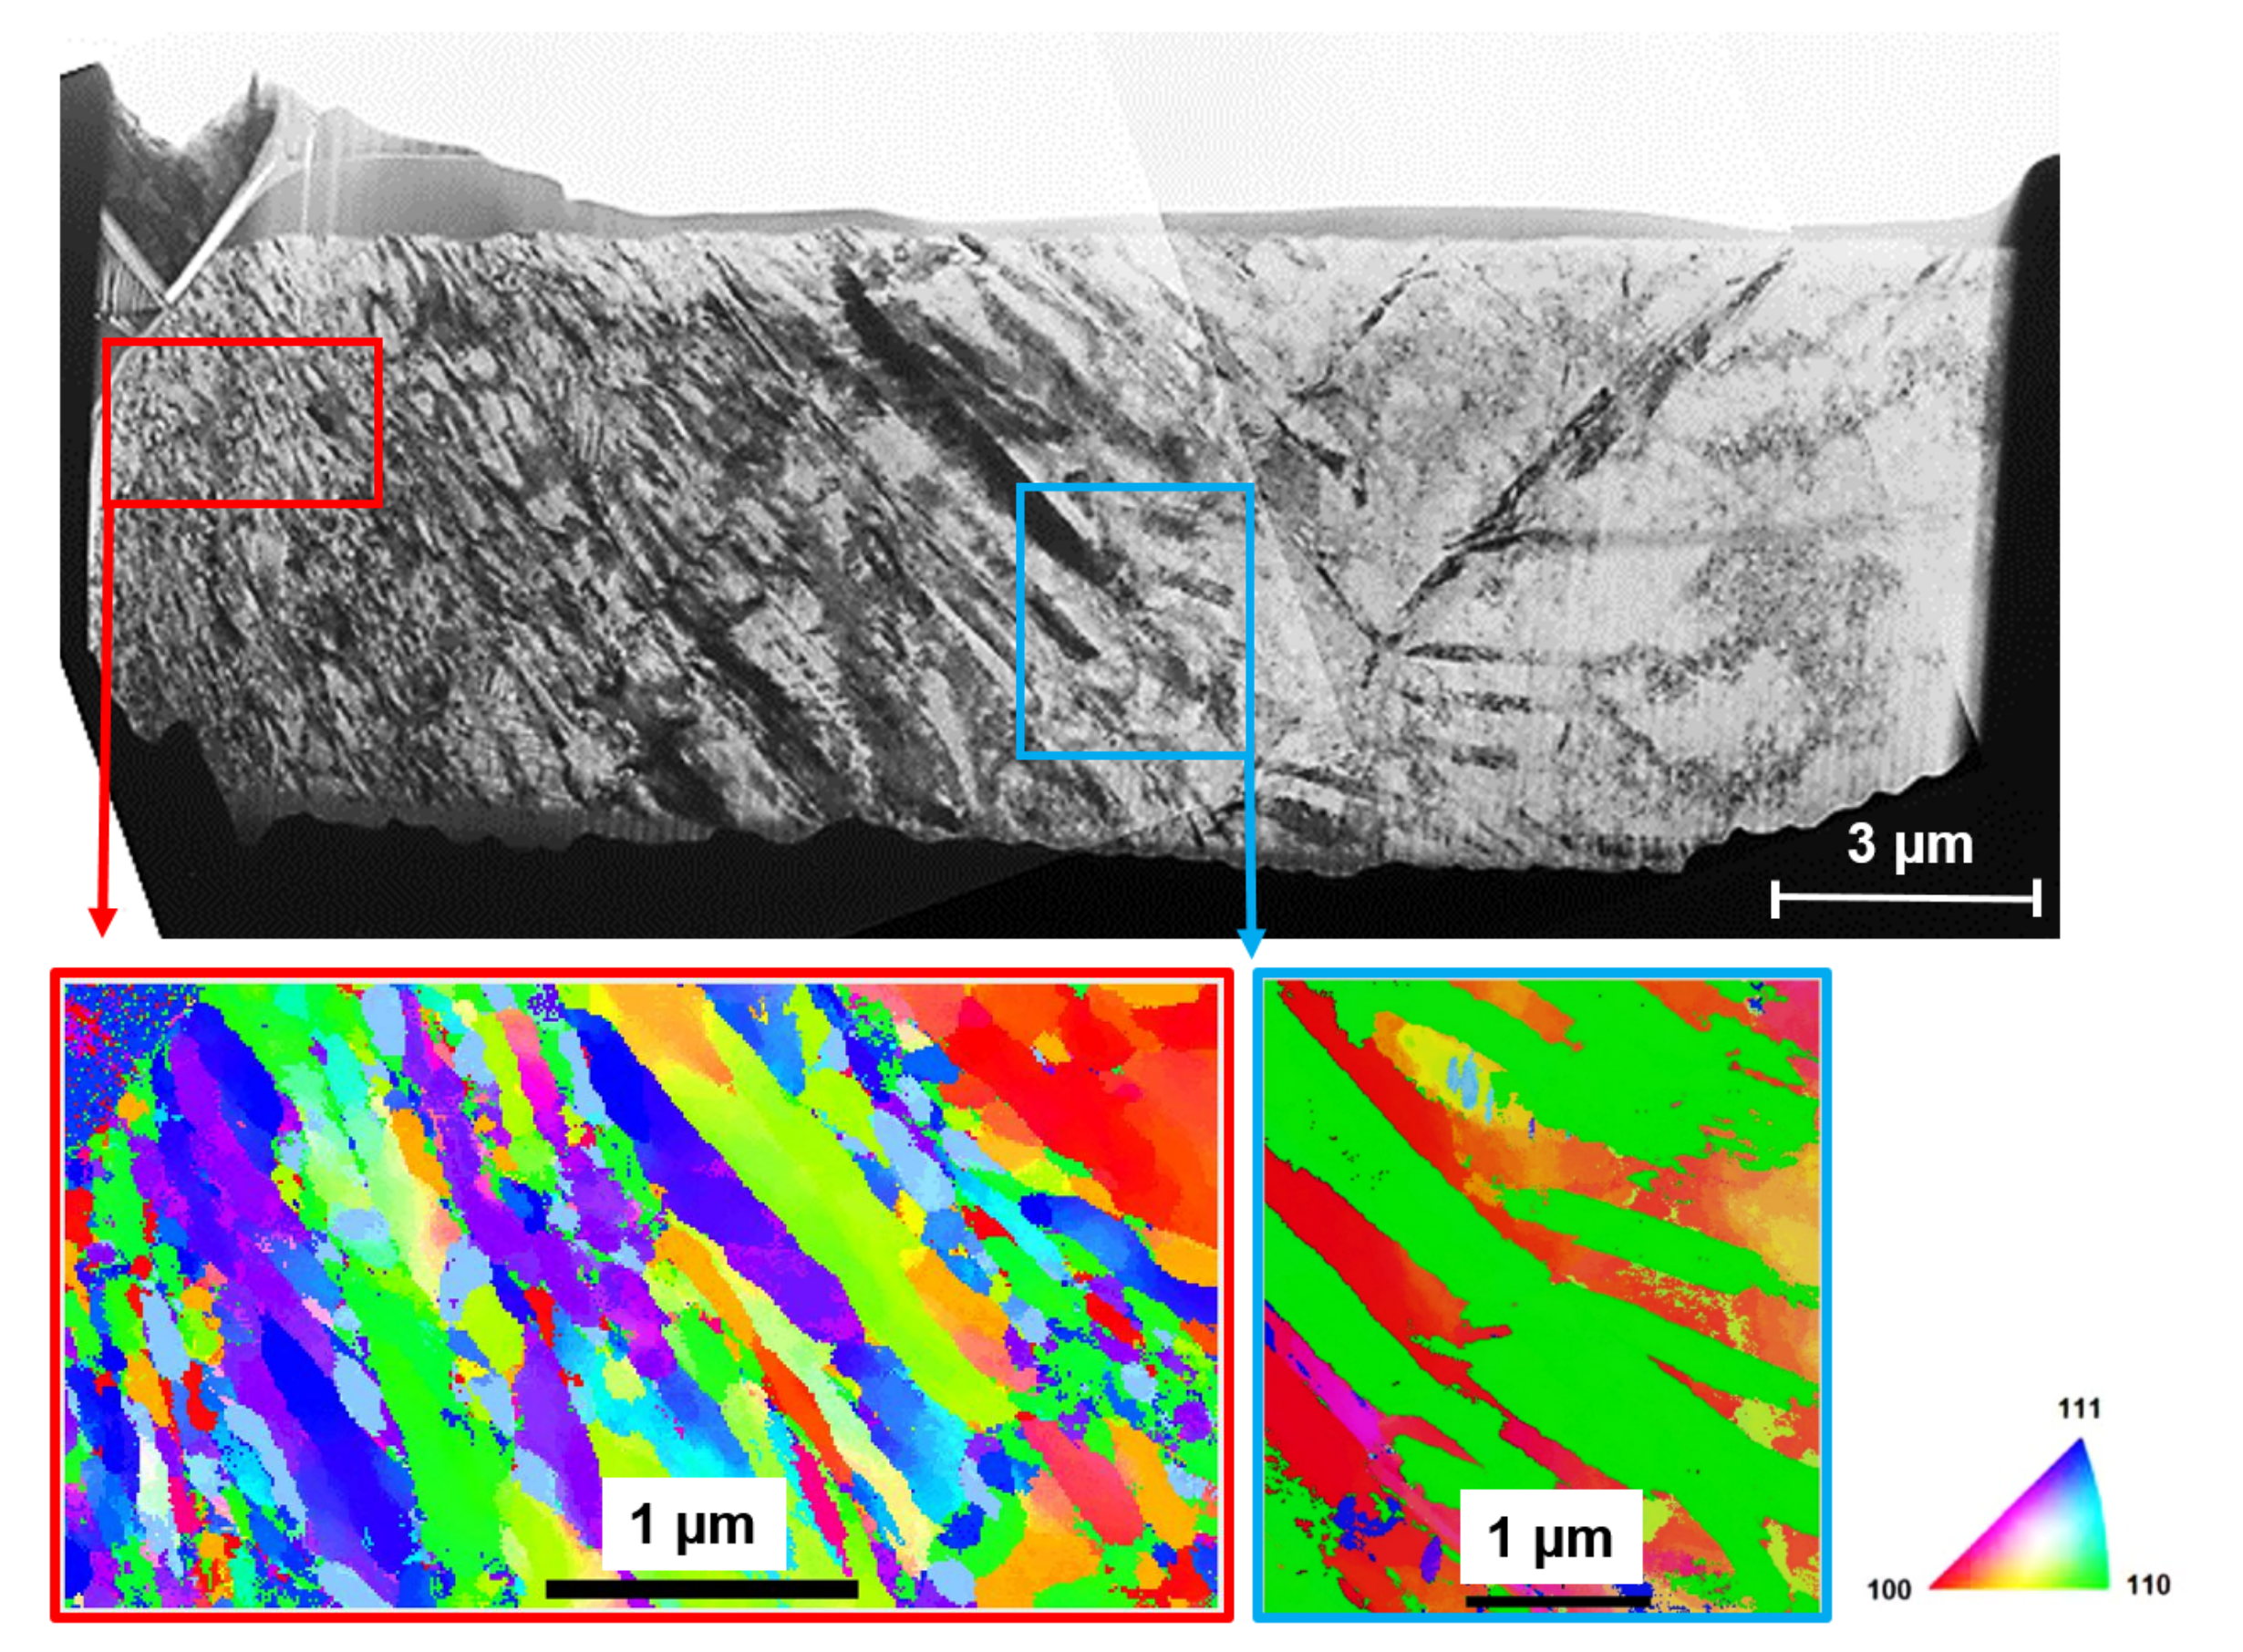
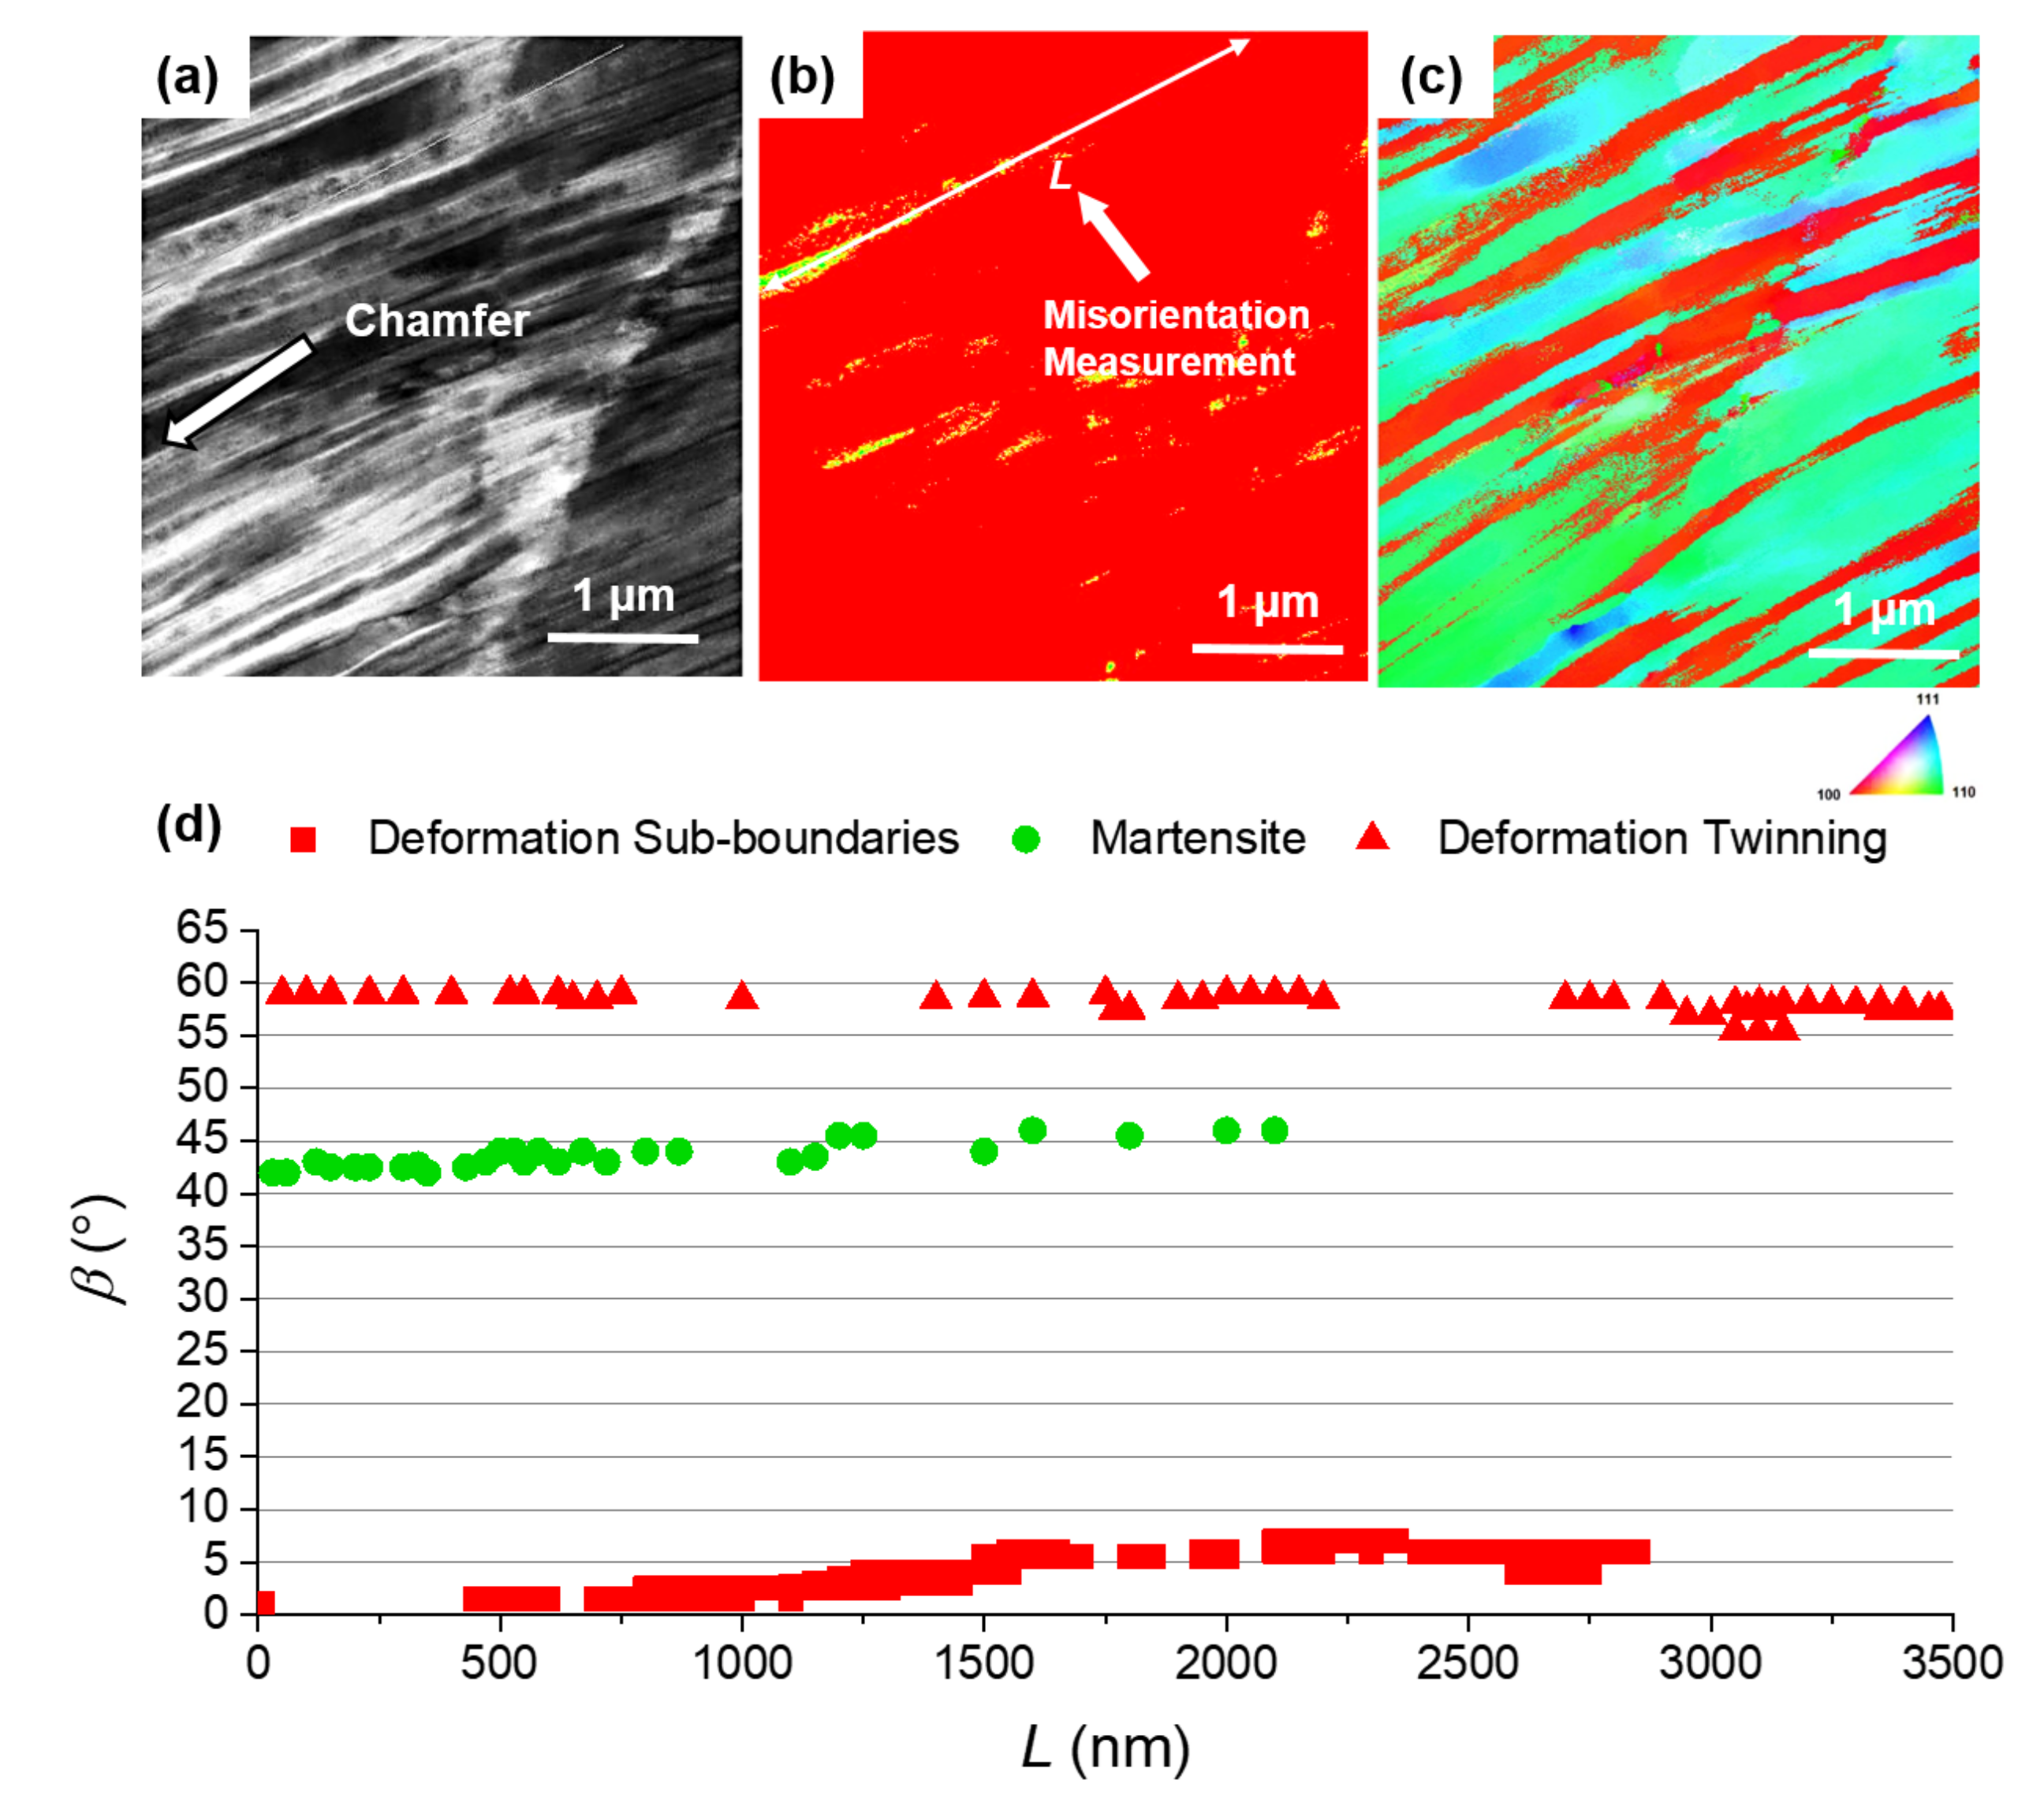
3.3. Microstructure Evolution

The etched cross sections in Figure 5a–c reveal the effects of surface machining on the subsurface microstructure. The nuts were mounted in epoxy, with the surface normals of the annulus and the chamfer oriented toward the left of the figures for comparison with the microhardness–depth profiles. For FT1 (Figure 55a) and FT2 (Figure 5b), a bright deformed layer is visible below the surface, as indicated by the red arrow in the figures. For FT1 and FT2, the thickness of the deformed layer is (203) and (153), respectively. For SPT (Figure 5c), however, no deformed layer is observed at this level of resolution.
Microhardness–depth profiles, measured from the nut annulus and chamfer subsurface toward the core, provide information consistent with the observed microstructure. While FT1, FT2, and SPT exhibit similar core hardness of (33030)HV25, the surface hardness varies considerably. FT1 (Figure 5a’) exhibits a surface hardness of (40030)HV25, significantly higher than the core hardness. With increasing depth below the surface, the hardness gradually decreases and returns to the core hardness at a depth of 20. Similarly, an increased surface hardness, (40030)HV25, is detected for FT2 (Figure 5b’). In this case, the hardness–depth profile smoothly decreases to the core hardness within 15. In contrast to FT1 and FT2, SPT does not exhibit any increase in surface hardness.
To reveal the microstructure of the machining-induced deformed layer on FT1 (Figure 5a), we prepared a TEM specimen from the immediate-subsurface zone in a region of the annulus. The TEM bright-field image and orientation maps in Figure 6 exhibit the microstructure from the surface (left side) to the core (right side). The orientation maps refer to the x axis. The color indicates the local crystallographic orientation of the surface normal. Accordingly, the spatial distribution of pixel colors in the maps indicates texture and orientation relationships between juxtaposed grains. The subsurface zone features elongated grains with aspect ratios from 3:1 to 10:1 with a clearly non-random distribution of surface normal orientations, reflecting the plastic deformation introduced by surface machining. The map also indicates a pronounced gradient of the grain size from the surface toward the core. Within 1 below the surface, nanosized grains appear with short axis lengths ranging from 50nm to 100nm. Below a surface zone with a depth in the range from 1 to 15, the grain size gradually increases from hundreds of nanometers to several micrometers. Below the (diffuse) interface between the deformed layer and the core, the grain size is independent of the depth below the surface.

3.4. Phase Composition

The phase composition of the as-machined nuts was studied in an immediate-subsurface zone d | z | ( d ζ Co ) , where Co5 is the penetration depth of Co-K X-rays, as shown in Figure 7. The patterns are plotted as a function of spatial frequency q, where q is the corresponding reciprocal space vector. Thus, the abscissa is independent of the X-ray wavelength. Within the recorded range, the nuts exhibit four characteristic peaks of austenite, corresponding to the reciprocals of the plane spacings d 111 , d 200 , d 220 , d 311 . Beyond austenite peaks, no other peaks are observed, indicating that the volume fraction of hypothetical martensite is below the detection limit of XRD under the conditions employed (estimated to a volume fraction of 0.01 ). A small fraction of martensite within the depth range effectively sampled by XRD, between 0 and 5, cannot be excluded, e.g., if martensite only forms in a very shallow zone below the surface.
Figure 8 exhibits the result of our cross-sectional ASTAR subsurface analysis in the chamfer region of FT1. The image in Figure 8a is “correlation index” map, generated by the ASTAR software to quantify the similarity between the experimental and the best-matching simulated diffraction patterns. Better than an ordinary TEM image, Figure 8a reveals details of the microstructure, e.g., grain boundaries, phase boundaries, and refined grains.
Figure 8a shows grains in the surface-machined zone. Figure 8b maps the phase (FCC or BCC/BCT) in the same field of view, Figure 8c the crystallographic orientation of the surface normal (regardless of the phase). According to Figure 8b, the dominant phase in the field of view of Figure 8a is austenite (FCC) matrix. However, a certain, small fraction of scan points indicate either ferrite (BCC) or martensite (BCT). The respective locations can be characterized by the misorientation angle β of the crystal lattice to that of the austenite matrix. For the non-matrix austenite scan points only, whether from BCC (ferrite) or BCT (martensite), Figure 2d shows a diagram of misorientation angles β to the matrix austenite as a function of the spatial coordinate l along the straight scan line of length L marked in Figure 8b. Three major misorientation angles are observed in Figure 8d: t=60, m45, and s10. The misorientation of t=60 indicates twins of the matrix austenite, characterized by a 60111 orientation relationship. The misorientation m45, in contrast, indicates martensite: the known preferred orientation relationships (ORs) between austenite and martensite in stainless steels are (i) the Kurdjumov–Sachs OR with =42.9 [17] and (ii) the Nishiyama–Wasserman OR with =46.0 [18]. In addition to twins and martensite, Figure 8c reveals a fraction of low-angle misorientations, of order s10. This fraction can be explained as strain-induced subgrains that formed close to the machined surface. The misorientation of deformation-induced subgrains increases with deformation strain [19].
The volume fractions of martensite and austenite were also evaluated in different regions of the nut by ASTAR analysis. The volume fraction of martensite was determined to be < 0.01 . This low martensite fraction accounts for the absence of obvious martensitic peaks in the X-ray diffractograms in Figure 7. Similar to FT1, the martensite fractions in FT2 and SPT are < 0.01 .

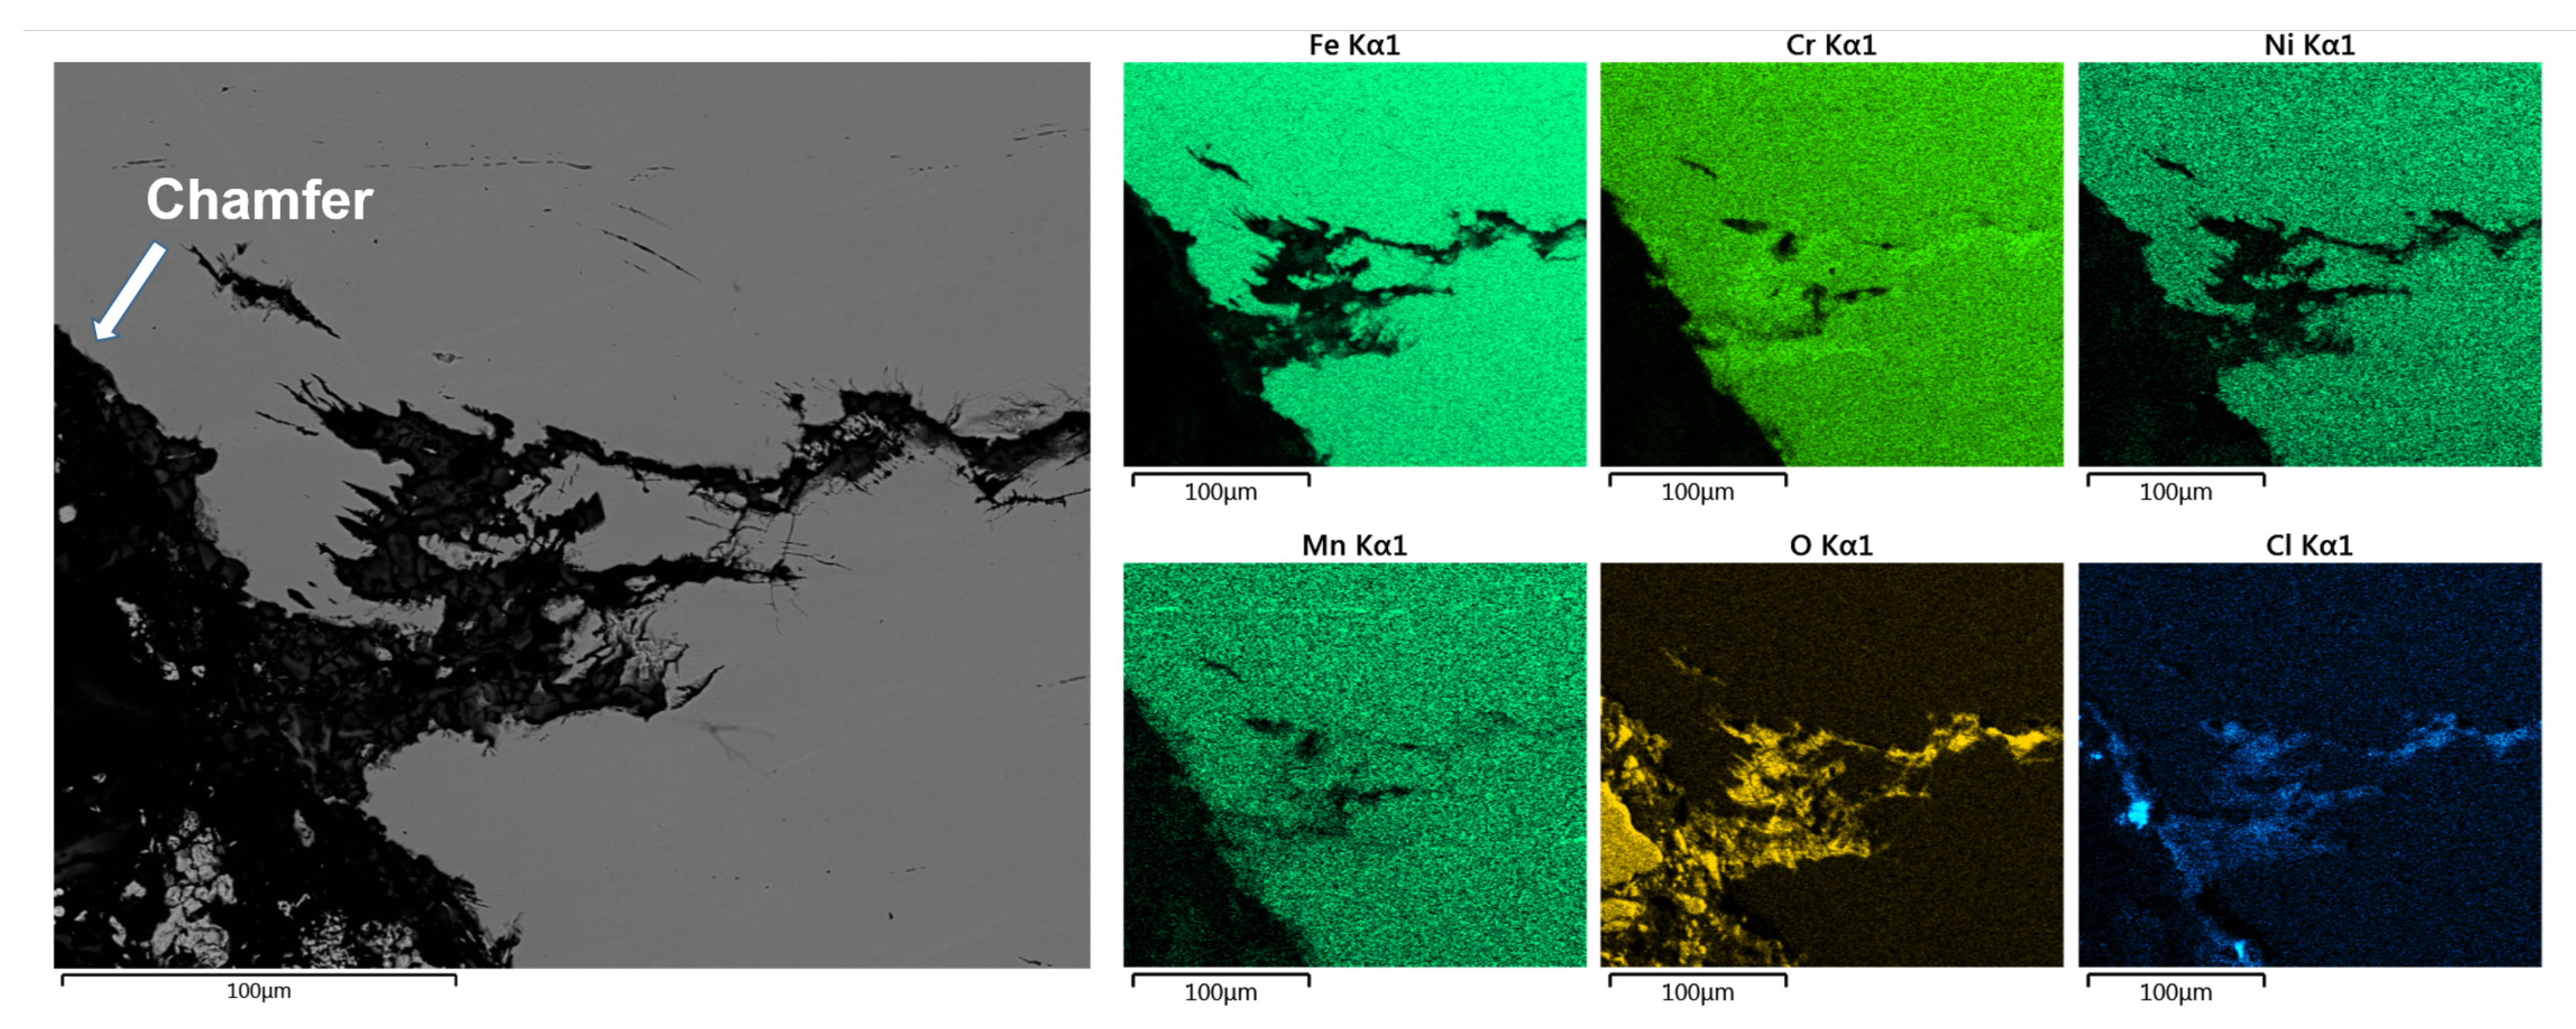
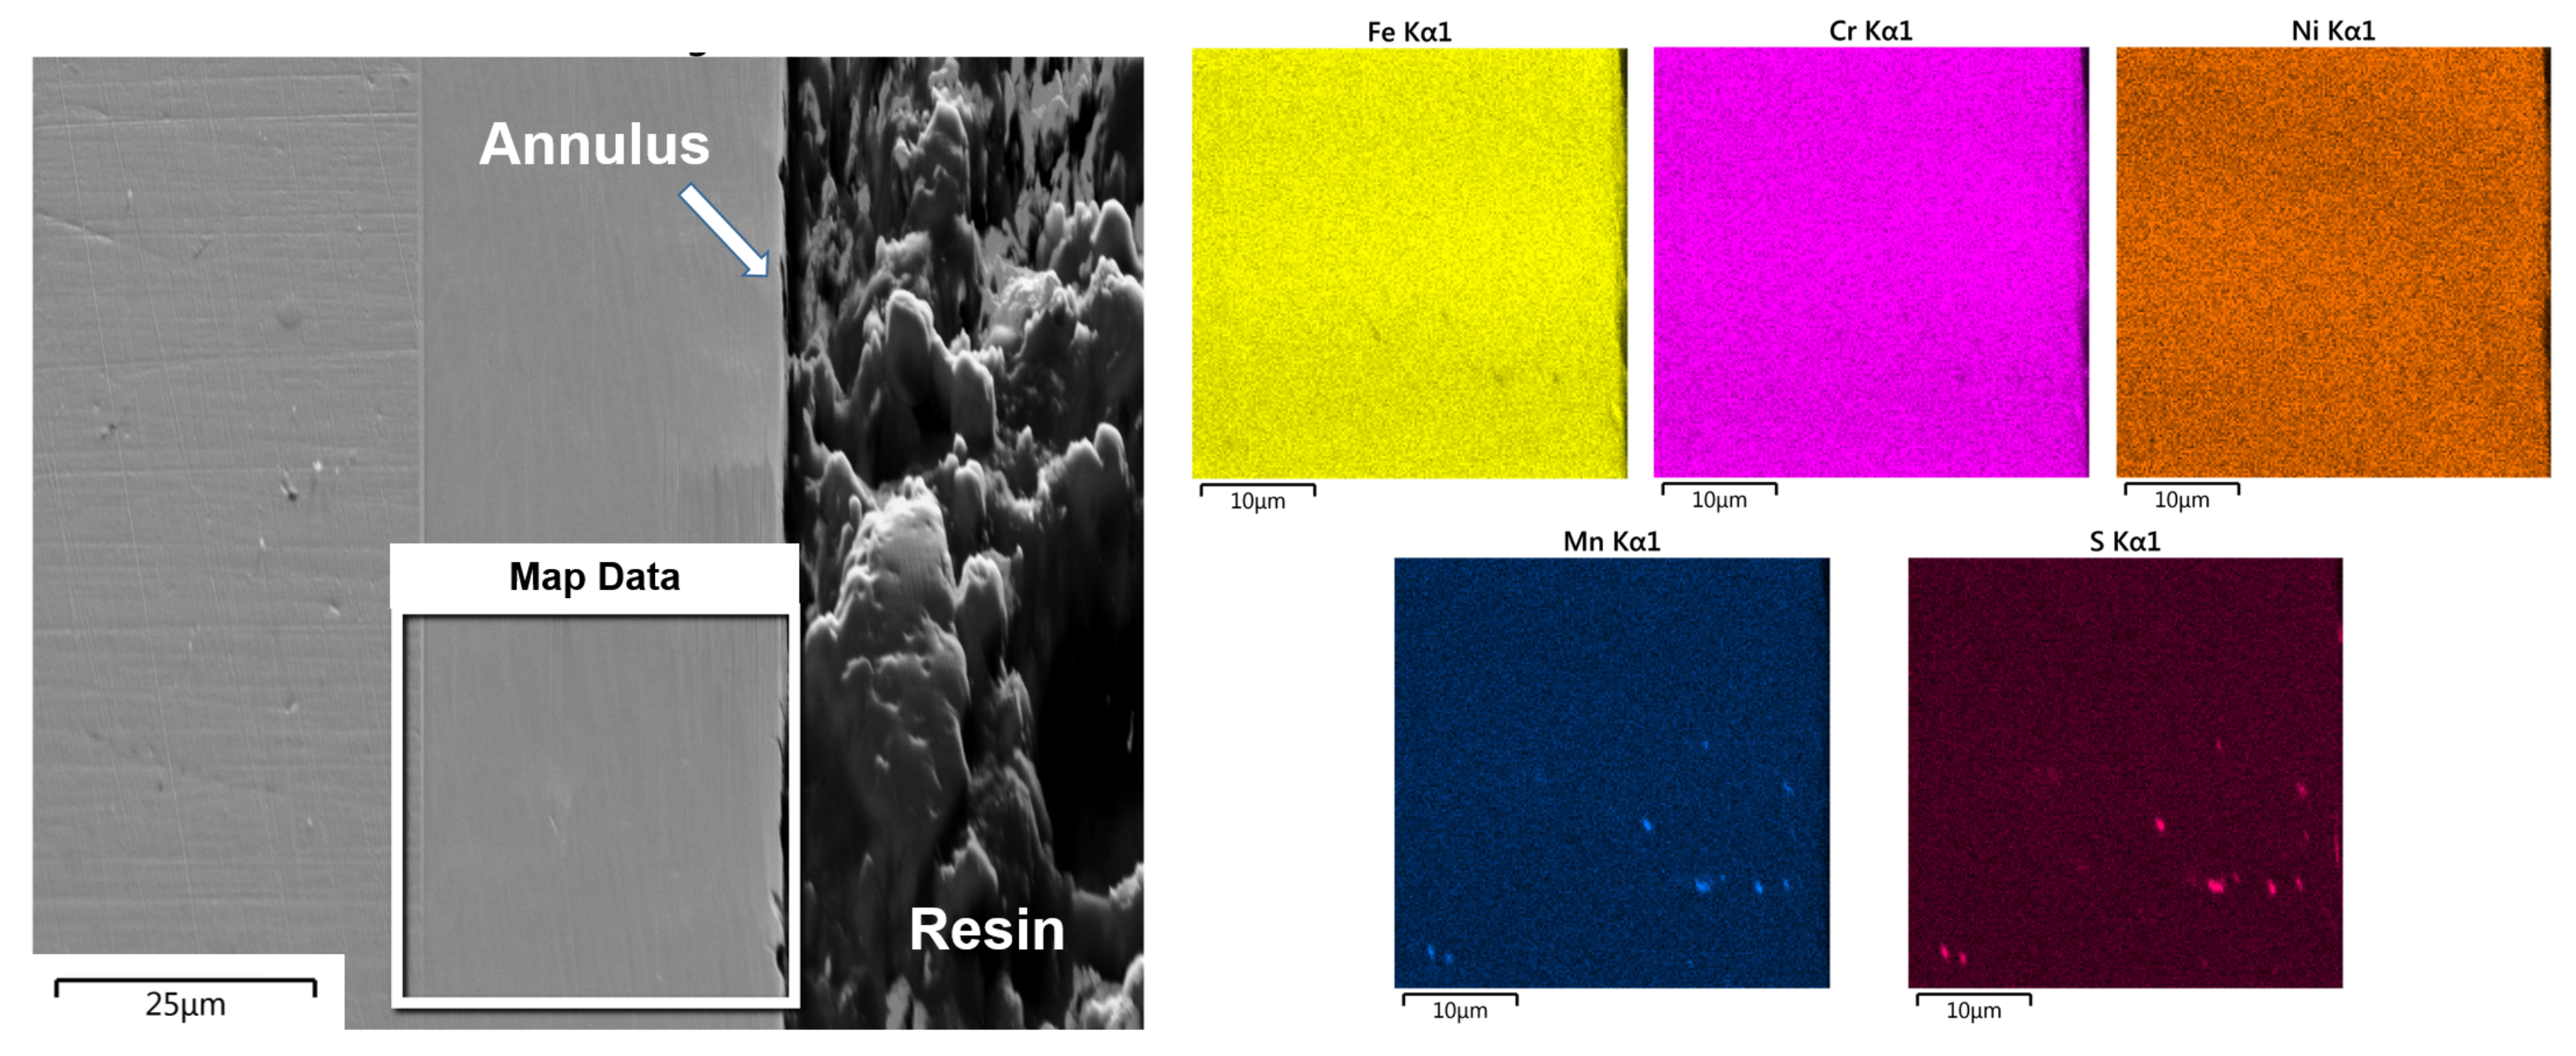
3.5. Element-Distribution Analysis

To study the microscopic mechanism by which (simulated) seawater attacks the nuts and how SCC nucleates and propagates during stress–corrosion testing, we examined a cross section near the stress–corrosion-cracked chamfer of FT1. Figure 9 presents XEDS maps from this region. Except near the crack, the map exhibits a uniform spatial distribution of the alloy-base elements (Fe, Cr, and Ni) from the surface to the core. Near the crack, however, the maps indicate increased levels of Cr, O, and Cl.
Similarly, we performed cross-sectional element distribution analysis of as-machined FT1 at the annulus in the region where the deformed layer was observed in Figure 5(a,a’). Again, the XEDS maps reveal a homogeneous distribution of the alloy-base elements. Close to the surface, Mn-rich sulfides are discovered, as shown in Figure 10.

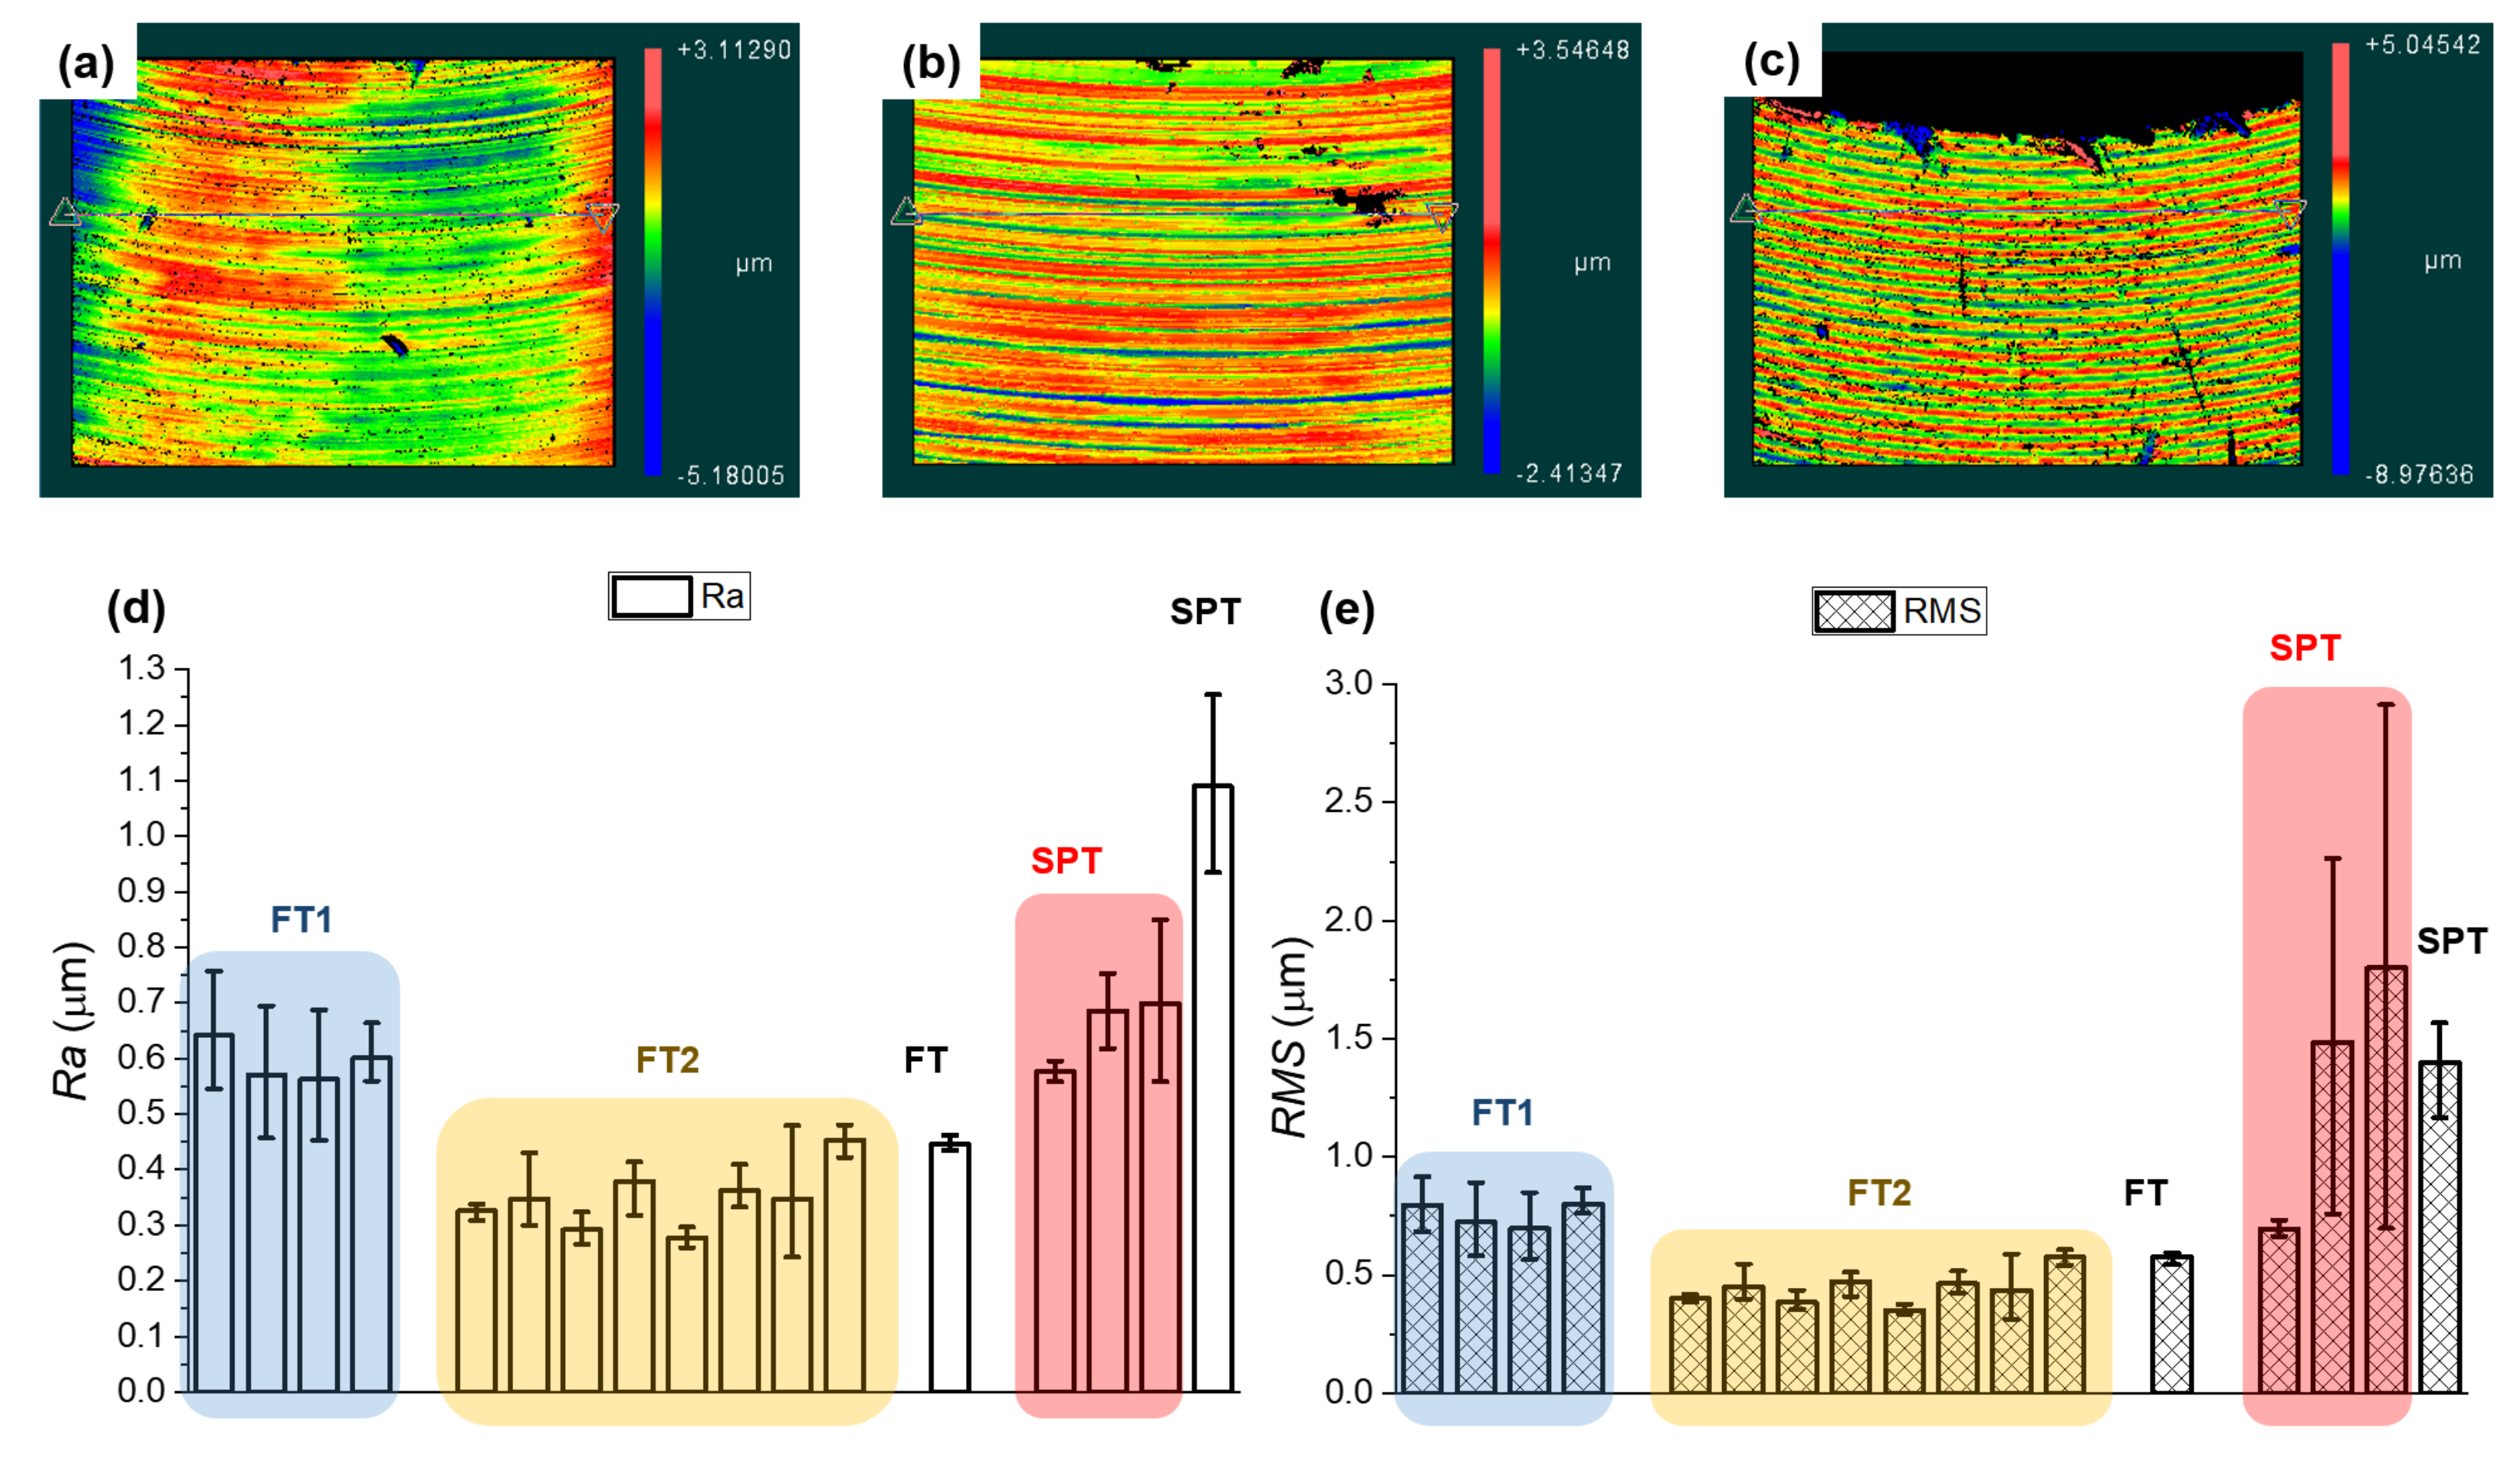
3.6. Surface Roughness

Figure 11a–c shows the surface topographies of the machined nuts. Compared to FT1 (Figure 11a) and FT2 (Figure 11b), SPT (Figure 11c) exhibits deeper machining-induced grooves, thus a rougher surface. Accordingly, just analyzing the surface morphology can help identify certain machining methods. For all specimens, we determined R a (Figure 11d) and R q (Figure 11e) for the annulus surface. The average roughness values for FT1, FT2, and SPT are compiled in Table 2. In Figure 11d,e, the columns grouped by same color represent Swagelok nuts machined by same tool. The non-grouped data were obtained from other commercially available nuts for comparison. The measurements indicate that nuts machined with same tool, regardless of the manufacturer, exhibit similar surface roughness. Statistically, FT2 exhibits the smoothest surface, FT1 medium roughness, and SPT the roughest surface with pronounced and closely spaced peaks and valleys.

4. Discussion

4.1. Catastrophic Transgranular Cracking

In theory, crack propagation should follow a path of highest crack-opening stress intensity and minimal fracture energy. Correspondingly, cracks should be attracted to regions under tensile stress [20]. However, as also observed here, failure of stainless steel serving in Cl--rich stress–corrosion environments typically occurs by branched transgranular cracking. The reasons for this behavior and the underlying microscopic failure mechanism are still subject to research. For example, Ghosh et al. attribute failure to crack nucleation at the surface and residual tensile stress driving the crack into the alloy core [2] (up to 0.1mm deep). Applied stress combined with chemical attack promotes nucleation of transgranular cracks by (i) plastic deformation generating glide steps at the alloy surface, (ii) preferred chemical dissolution of material around glide steps, leading to local stress concentration, and (iii) crack nucleation and the resulting highly peaked stress field [21]. Apparently, cracks propagate by separation along low-indexed crystallographic planes, with branching and deflection following local fluctuations of residual crack-opening tensile stresses within the grain. This is supported by Figure 4b, revealing catastrophic transgranular cracks beneath the machined surface with pronounced branching and deflection.
According to the literature, SCC can be significantly promoted by hydrogen embrittlement—a known phenomenon for which a detailed mechanistic understanding is still lacking [22,23,24]. Our model is the following. After stress–corrosion crack nucleation at the surface (Figure 4a), hydrogen, provided by the chloride-concentrating humidity level of the ambient, diffuses into the alloy and is attracted to the region of high tensile stress around the crack tip. This may decrease the cohesive strength of the solid by chemical bonding of hydrogen with metal atoms and precipitation of metal hydrides. Therefore, the presence of hydrogen promotes crack propagation, rather than dislocation activity, as a microscopic stress relaxation mechanism.
During the pitting corrosion stage, copious evolution of hydrogen is commonly observed at the tip of advancing stress–corrosion cracks. The resulting fracture surfaces can be cleavage-like, similar in appearance to those reported for hydrogen embrittlement. In our work, martensite plays no role in hydrogen embrittlement, considering martensite volume fractions < 0.01 in the deformed layer of as-machined nuts and crack region of tested nuts. In agreement with this observation, Eliezer et al. found that austenite can be embrittled by hydrogen in the absence of martensite [23] in AISI 304 and AISI 310 austenitic stainless steel exposed to a stress–corrosion environment. A further characteristic feature of hydrogen embrittlement—differentiating it from SCC—is that hydrogen-induced cracks can nucleate in anodic and cathodic sites, whereas the chloride-driven stress–corrosion cracks can only form in anodic sites, as often confirmed for pitting sites [22].

4.2. Factors Impacting SCC Resistance

The characterization results reveal the impact and their relative importance of machining-induced factors on SCC susceptibility of AISI 316L nuts—at least qualitatively. Major impacting factors include (i) machining-induced immediate subsurface grain refinement and (ii) a modification of the alloy surface roughness. Strain-induced formation of martensite, in contrast, is no significant factor. In addition to factors related to surface machining, susceptibility to SCC can also result from compositional impurities, e.g. sulfides.
For nuts exhibiting low SCC susceptibility, machining-induced grain refinement in the immediate subsurface zone was observed at the annulus and chamfer, shown in Figure 5 and Figure 6. This particular grain refinement caused by surface machining has been reported previously. For example, Ghosh et al. investigated the microstructural changes in AISI 304L due to surface machining and observed that grains near the surface were refined from 60 to <0.5 [25]. They observed that martensitic transformation near the surface caused substantial work-hardening, which further led to increased SCC susceptibility of machined AISI 304L in chloride environment. However, different from their observations, we observed a martensite volume fraction < 0.01 , as shown in Figure 8. Without martensite formation, grain refinement is expected to impede crack propagation. A corresponding effect of grain refinement on crack growth resistance has been observed before. Masanobu et al. compared the fatigue properties of austenite stainless steels with ultra-fine grain size and coarse grain size. They found grain refinement significantly reduces the crack tip opening displacement (CTOD), which is proportional to the crack growth rate [26]. This may be because nanosized grains impede crack propagation by crack deflection along grain boundaries, increasing the fracture toughness through increased fractality of the crack surface. The increased subsurface hardness (Figure 5) can be understood from the Hall–Petch relation Equation (3) between the yield strength y and the average grain diameter d:
σ y = σ 0 + k y d ,
where σ 0 is the stress at which dislocations begin to move and k y the strengthening coefficient (Hall–Petch slope).
Another major impact factor on SCC susceptibility is the alloy surface roughness. As apparent from Figure 11, the nuts machined by different tools exhibit substantial quantitative differences in R a and R q . The positive correlation between SCC susceptibility and surface roughness of as-machined nuts indicates that machining-induced increases of surface increase the susceptibility to pitting corrosion and SCC susceptibility. Kentish investigated the effect of surface roughness on the SCC of API X-70 gas pipeline and concluded that time-to-failure ratios decrease with increasing surface roughness. This effect was predominantly associated with stress concentration effects related to the surface roughness [27].
In our work, we detected manganese sulfide (MnS) particles near the nut annulus and chamfer (Figure 10). Common in, MnS particles are known to act as initiation sites of pitting corrosion [28,29,30]. Considering that pitting sites have a high potential to develop into SCC nucleation sites under tensile stress, the sulfides appearing on the surface will inevitably increase the SCC susceptibility of nuts.

4.3. Element Distribution in Cracks

Elemental analyses uncovered that some elements are enriched in the cracks, e.g., Cr, oxygen, and Cl (Figure 9). In our experiments, the only possible source of Cl was the spraying of simulated seawater. During the stress–corrosion tests, accordingly, FeCl2, CrCl2, and CrCl3 may have been produced in the pitting sites, where metal dissolves in its role as anode. As crack propagation proceeds, simulated seawater and chlorides produced earlier can diffuse into the branches of cracks, leading to local enrichment of Cl. Roffey et al. also observed branched transgranular cracks. From cracks nucleated at the surface, they propagated into the alloy into depths ranging on the scale of millimeters. Roffey et al. also noticed that the crack nucleation sites were rich in Cl and sulfur [31]. Regarding oxygen enrichment along cracks, this may either originate from mounting powder that aggregated in the cracked region during polishing or from Cr-rich oxides forming along in the crack. Cr-rich oxides forming along cracks was also reported before [14]. In that study, crack nucleation has actually been attributed to damage in the oxide film.

4.4. SCC Model

Based on the stress–corrosion testing and characterization results, we propose a model to understand impacts of machining-induced factors on SCC susceptibility of AISI 316L as illustrated in Figure 12. As presented in Figure 5 and Figure 6, machining can greatly influence the surface roughness of as-machined AISI 316L and its subsurface microstructure. For form-tool-machined specimens (316–FT1 and 316–FT2), the surface roughness ( R a and R q ) is relatively low. Besides, machining-induced grain refinement was observed in a deformed subsurface zone with a thickness of between 15 and 20, resulting in surface hardness increase. In contrast, comparatively high surface roughness was measured on the single point tool machined specimens. Here, neither increased plastic deformation nor grain refinement were noted in the immediate-subsurface zone. During stress–corrosion testing in the simulated seawater, a rough surface with deep grooves and other machining defects can provide effective reservoirs for Cl--rich solution, leading to severe pitting corrosion at the surface (marked by red ellipses). Under tensile stress, these pitting sites can develop into SCC nucleation sites, which can propagate perpendicular to the main stress direction at the surface and penetrate the alloy as branched transgranular cracks. Refined grains can enhance fracture toughness by diverting cracks along grain boundaries, increasing the fractality of the crack surface. In a chloride-concentrating humid environment, however, catastrophic crack propagation can still happen by hydrogen-induced embrittlement—regardless of surface roughness and existence of a plastically deformed and grain-refined subsurface layer.

5. Conclusions

This research has revealed a significant impact of surface machining on SCC susceptibility of AISI 316L stainless steel tube fitting nuts. The key conclusions are as follows.
  • The new seawater spray protocol we used, and especially its cyclic exposure to two distinct levels of relative humidity, allows seawater to concentrate on stressed alloy parts, temporarily generating a solution of mobile Cl- ions with concentrations considerably higher than in the original (simulated) seawater. These conditions of concentrated salt solution are particularly detrimental to alloy parts prone to SCC.
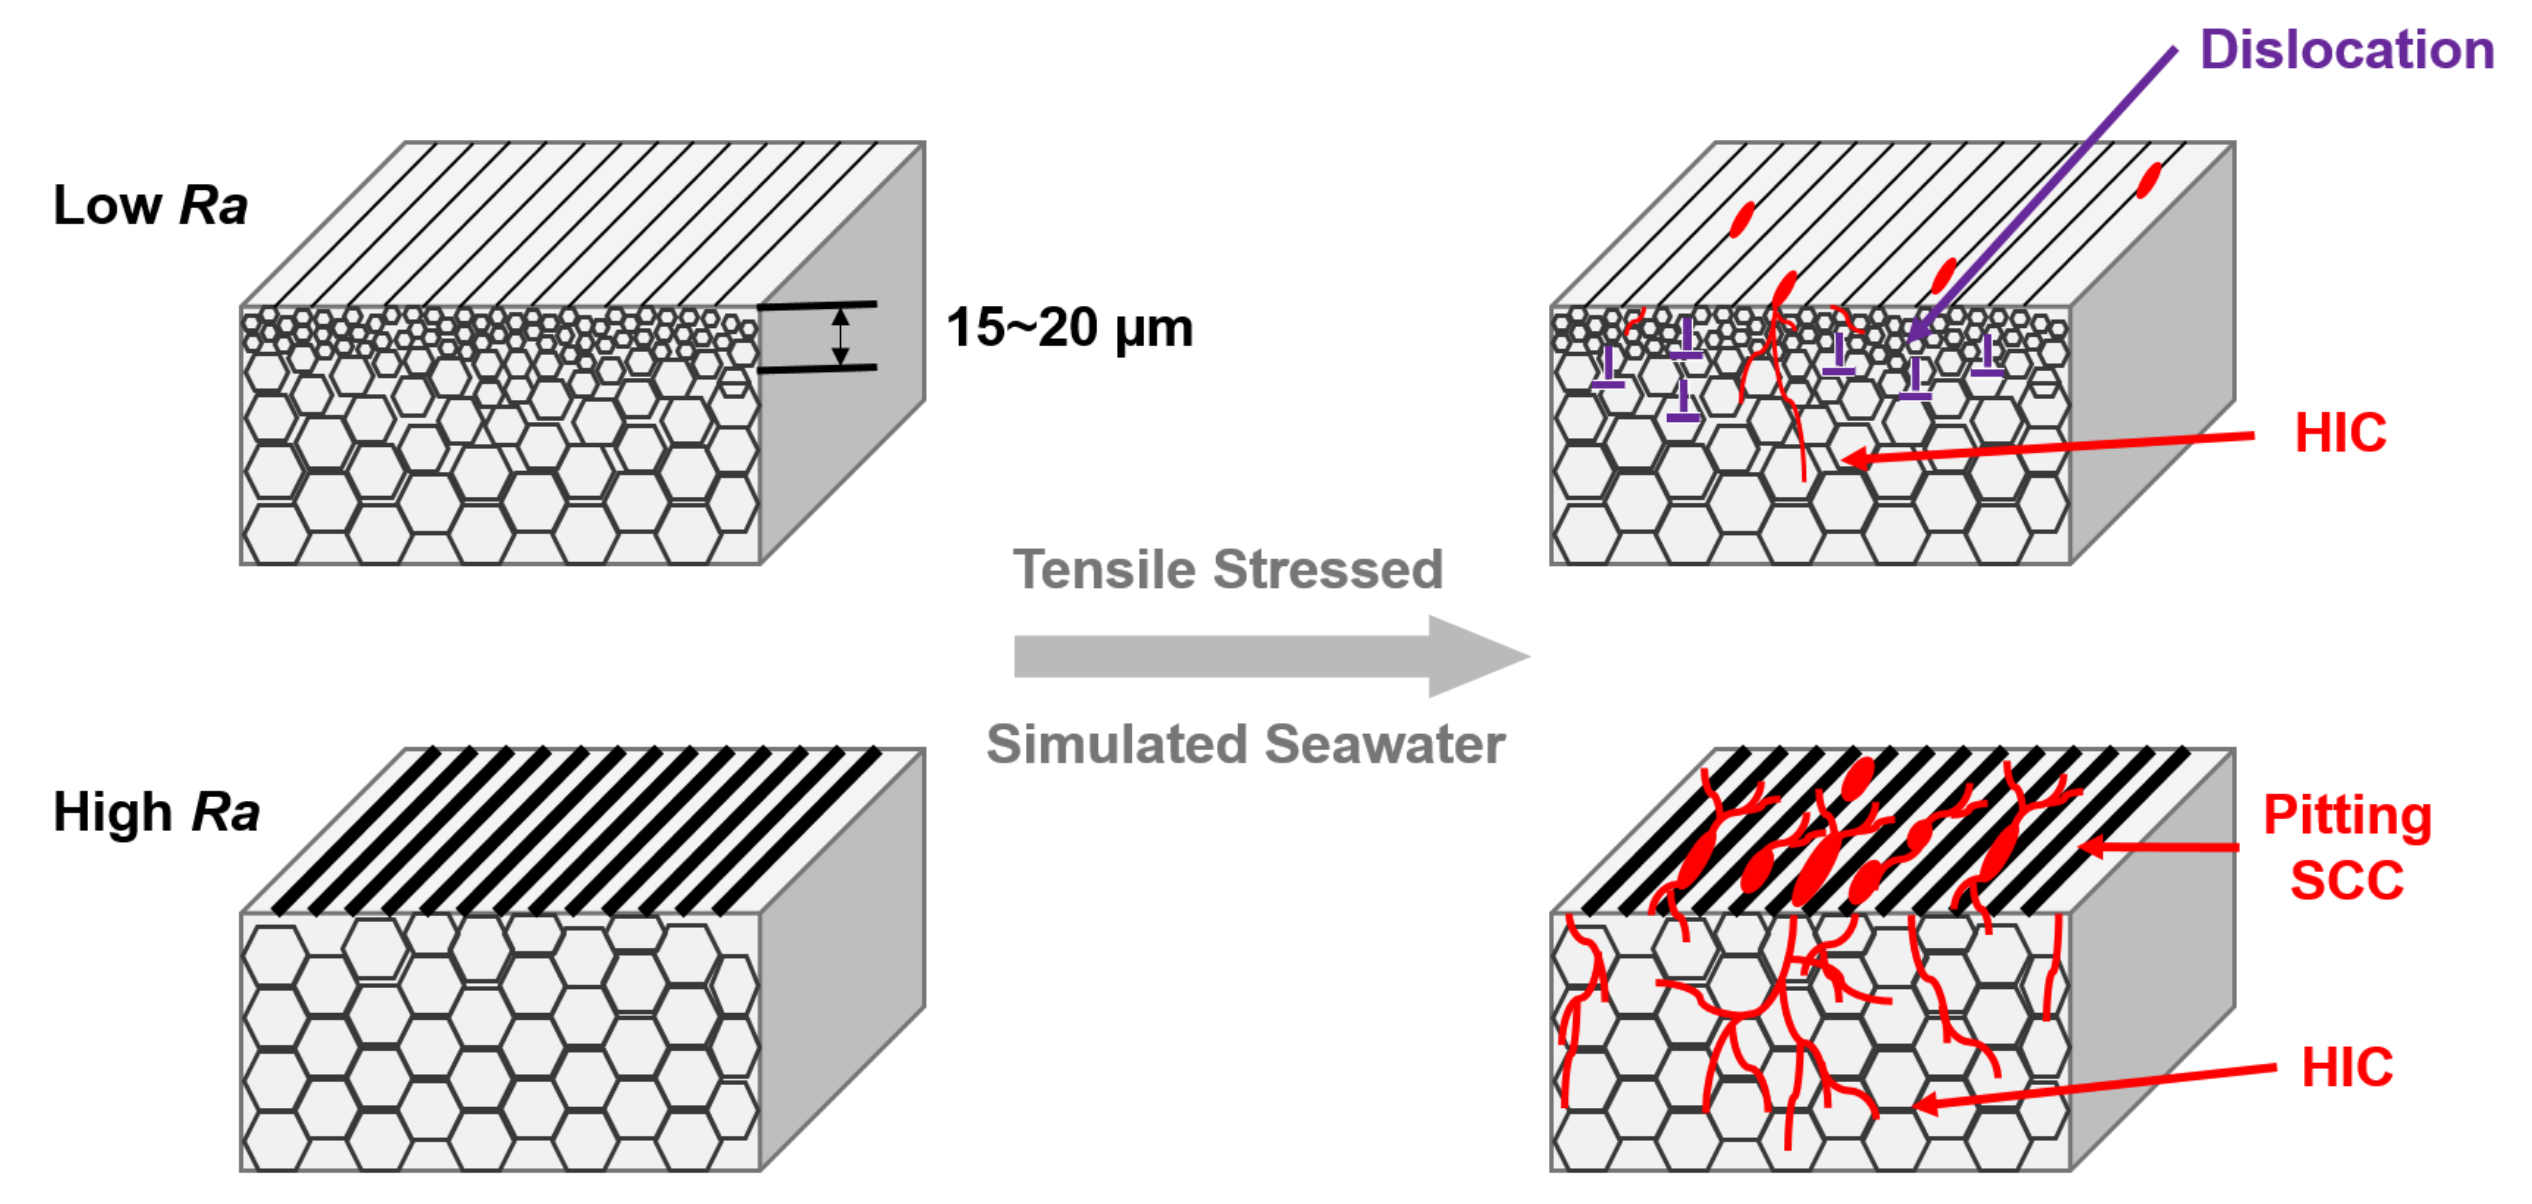
  • Different methods of alloy surface machining can change the susceptibility to SCC—inferred from the crack density (crack length per area)—by at least one order of magnitude. Particularly, the use of a single-point tool dramatically increases susceptibility to SCC compared to using form tools. This can be explained by differences in the resulting immediate-subsurface microstructure. Specifically, a plastically deformed subsurface zone with refined grain size, reaching to a depth of 15 to 20, as introduced by form tools, increases the resistance to SCC. This can be explained by increased crack deflection along grain boundaries between refined (nanometer-sized) grains, thus increased fracture energy because of increased fractured surfaces. Obviously, this mechanism does not depend on the formation of deformation-induced martensite.
  • In addition to the subsurface microstructure, machining-induced surface roughness has a significant negative effect on susceptibility to SCC. High surface roughness increases susceptibility to SCC. The reason is that increased surface roughness increases surface-relief-based stress concentration and promotes nucleation of pitting corrosion by providing pre-formed pits and corresponding attracting interaction with surface-attacking solutions.
  • Cracks with dissimilar morphology at- and underneath the surface indicate two distinct failure mechanisms. At the alloy surface, cracks form connected with pitting corrosion sites. They propagate perpendicular to the main direction of tensile stress. These are stress–corrosion cracks. Under the surface, in contrast, catastrophic cracks form with lengths of several millimeters. These cracks exhibit pronounced branching, deflection, and transgranular propagation. Apparently, these cracks are induced by hydrogen, released by chemical reactions between the alloy, the solution and the chloride-concentrating humid atmosphere.
  • The behavior observed here for surface-machined AISI 316L nuts is generally expected for other AISI 316L parts and components exposed to tensile stress in seawater environments.

Author Contributions

Conceptualization, F.E. and Z.R.; methodology, Z.R. and F.E.; software, Z.R.; validation, Z.R. and F.E.; formal analysis, Z.R. and F.E.; investigation, Z.R.; resources, F.E.; data curation, Z.R.; writing—original draft preparation, Z.R.; writing—review and editing, F.E. and Z.R.; visualization, Z.R. and F.E.; supervision, F.E.; project administration, F.E. and Z.R.; funding acquisition, F.E. All authors have read and agreed to the published version of the manuscript.

Funding

This research was funded by Swagelok Company.

Acknowledgments

This work would not have been possible without many helpful discussions with P Williams, G Shaw, J Gress (Swagelok), A Heuer, and S Collins (CWRU). We also appreciate the help of N Lu and assistance with microcharacterization by D Wang, N Avishai, and K Abbasi in the Swagelok Center for Surface Analysis of Materials at CWRU.

Conflicts of Interest

The authors declare no conflict of interest. Swagelok, as the only funder, participated in the design of the study, interpretation of data, and the decision to publish the results.

References

  1. Zhang, Z.L.; Xia, S.; Bai, Q.; Liu, T.G.; Li, H.; Zhou, B.X.; Wang, L.J.; Ma, W.J. Effects of 3-D grain boundary geometrical angles and the net normal stress on intergranular stress corrosion cracking initiation in a 316 stainless steel. Mater. Sci. Eng. 2019, 765, 138277. [Google Scholar] [CrossRef]
  2. Ghosh, S.; Kain, V. Effect of surface machining and cold working on the ambient temperature chloride stress corrosion cracking susceptibility of AISI 304L stainless steel. Mater. Sci. Eng. Struct. Mater. Prop. Microstruct. Process. 2010, 527, 679–683. [Google Scholar] [CrossRef]
  3. Zhang, W.Q.; Fang, K.W.; Hu, Y.J.; Wang, S.Y.; Wang, X.L. Effect of machining-induced surface residual stress on initiation of stress corrosion cracking in 316 austenitic stainless steel. Corros. Sci. 2016, 108, 173–184. [Google Scholar] [CrossRef]
  4. Atashin, S.; Pakshir, M.; Yazdani, A. Synergistic investigation into the marine parameters’ effect on the corrosion rate of AISI 316 stainless steel. Mater. Des. 2011, 32, 1315–1324. [Google Scholar] [CrossRef]
  5. Wyllie, W.E.; Duquette, D.J. Effect of dissolved ozone on corrosion behavior of stainless steels in artificial seawater. Corrosion 1998, 54, 781–799. [Google Scholar] [CrossRef]
  6. Malik, A.U.; Ahmad, S.; Andijani, I.; Al-Fouzan, S. Corrosion behavior of steels in Gulf seawater environment. Desalination 1999, 123, 205–213. [Google Scholar] [CrossRef]
  7. Sridhar, N.; Brossia, C.S.; Dunn, D.S.; Anderko, A. Predicting localized corrosion in seawater. Corrosion 2004, 60, 915–936. [Google Scholar] [CrossRef]
  8. Malik, A.U.; Siddiqi, N.A.; Ahmad, S.; Andijani, I.N. The Effect of Dominant Alloy Additions on the Corrosion Behavior of Some Conventional and High-Alloy Stainless-Steels in Seawater. Corros. Sci. 1995, 37, 1521–1535. [Google Scholar] [CrossRef]
  9. Zhang, C.H.; Rong, H.; Song, G.D.; Hu, K. Effect of Surface Roughness by Shot Peening on Stress Corrosion Cracking Behavior of Pure Titanium Welded Joints in HCl Solution. Acta Metall. Sin. 2019, 55, 1282–1290. [Google Scholar]
  10. Zeman, A.; Novotny, R.; Uca, O.; Krsjak, V.; Macak, J.; Debarberis, L. Behavior of cold-worked AISI-304 steel in stress-corrosion cracking process: Microstructural aspects. Appl. Surf. Sci. 2008, 255, 160–163. [Google Scholar] [CrossRef]
  11. Scatigno, G.G.; Ryan, M.P.; Giuliani, F.; Wenman, M.R. The effect of prior cold work on the chloride stress corrosion cracking of 304L austenitic stainless steel under atmospheric conditions. Mater. Sci. Eng. Struct. Mater. Prop. Microstruct. Process. 2016, 668, 20–29. [Google Scholar] [CrossRef]
  12. Sundar, R.; Ganesh, P.; Kumar, B.S.; Gupta, R.K.; Nagpure, D.C.; Kaul, R.; Ranganathan, K.; Bindra, K.S.; Kain, V.; Oak, S.M.; et al. Mitigation of Stress Corrosion Cracking Susceptibility of Machined 304L Stainless Steel Through Laser Peening. J. Mater. Eng. Perform. 2016, 25, 3710–3724. [Google Scholar] [CrossRef]
  13. Rajaguru, J.; Arunachalam, N. Investigation on machining induced surface and subsurface modifications on the stress corrosion crack growth behaviour of super duplex stainless steel. Corros. Sci. 2018, 141, 230–242. [Google Scholar] [CrossRef]
  14. Zhong, X.Y.; Bali, S.C.; Shoji, T. Effects of dissolved hydrogen and surface condition on the intergranular stress corrosion cracking initiation and short crack growth behavior of non-sensitized 316 stainless steel in simulated PWR primary water. Corros. Sci. 2017, 118, 143–157. [Google Scholar] [CrossRef]
  15. Toppo, A.; Pujar, M.G.; Sreevidya, N.; Philip, J. Pitting and stress corrosion cracking studies on AISI type 316N stainless steel weldments. Def. Technol. 2018, 14, 226–237. [Google Scholar] [CrossRef]
  16. Veleva, L.; Alpuche-Aviles, M.A.; Graves-Brook, M.K.; Wipf, D.O. Voltammetry and surface analysis of AISI 316 stainless steel in chloride-containing simulated concrete pore environment. J. Electroanal. Chem. 2005, 578, 45–53. [Google Scholar] [CrossRef]
  17. Odnobokova, M.; Belyakov, A.; Kaibyshev, R. Development of Nanocrystalline 304L Stainless Steel by Large Strain Cold Working. Metals 2015, 5, 656–668. [Google Scholar] [CrossRef]
  18. Shakhova, I.; Dudko, V.; Belyakov, A.; Tsuzaki, K.; Kaibyshev, R. Effect of large strain cold rolling and subsequent annealing on microstructure and mechanical properties of an austenitic stainless steel. Mater. Sci. Eng. Struct. Mater. Prop. Microstruct. Process. 2012, 545, 176–186. [Google Scholar] [CrossRef]
  19. Sakai, T.; Belyakov, A.; Kaibyshev, R.; Miura, H.; Jonas, J.J. Dynamic and post-dynamic recrystallization under hot, cold and severe plastic deformation conditions. Prog. Mater. Sci. 2014, 60, 130–207. [Google Scholar] [CrossRef] [Green Version]
  20. Wu, H. Understanding residual stresses and fracture toughness in ceramic nanocomposites. In Residual Stresses in Composite Materials; Woodhead Publishing: Cambridge, UK, 2014; pp. 256–292. [Google Scholar] [CrossRef]
  21. Alyousif, O.; Nishimura, R. On the Stress Corrosion Cracking and Hydrogen Embrittlement Behavior of Austenitic Stainless Steels in Boiling Saturated Magnesium Chloride Solutions. Int. J. Corros. 2012, 2012, 1–11. [Google Scholar] [CrossRef] [Green Version]
  22. Ornek, C. Stress Corrosion Cracking and Hydrogen Embrittlement of Type 316L Austenitic Stainless Steel Beneath MgCl2 and MgCl2: FeCl3 Droplets. Corrosion 2019, 75, 657–667. [Google Scholar] [CrossRef]
  23. Eliezer, D.; Chakrapani, D.G.; Altstetter, C.J.; Pugh, E.N. Influence of Austenite Stability on the Hydrogen Embrittlement and Stress-Corrosion Cracking of Stainless-Steel. Metall. Trans. Phys. Metall. Mater. Sci. 1979, 10, 935–941. [Google Scholar] [CrossRef]
  24. Li, W.J.; Young, M.C.; Lai, C.L.; Kai, W.; Tsay, L.W. The effects of rolling and sensitization treatments on the stress corrosion cracking of 304L stainless steel in salt-spray environment. Corros. Sci. 2013, 68, 25–33. [Google Scholar] [CrossRef]
  25. Ghosh, S.; Kain, V. Microstructural changes in AISI 304L stainless steel due to surface machining: Effect on its susceptibility to chloride stress corrosion cracking. J. Nucl. Mater. 2010, 403, 62–67. [Google Scholar] [CrossRef]
  26. Kubota, M.; Macadre, A.; Mori, K.; Mori, R. Fatigue Properties of Ultra-Fine Grain Austenitic Stainless Steel and the Effect of Hydrogen. In MATEC Web of Conferences; EDP Sciences: Les Ulis, France, 2018. [Google Scholar] [CrossRef]
  27. Kentish, P. Stress corrosion cracking of gas pipelines—Effect of surface roughness, orientations and flattening. Corros. Sci. 2007, 49, 2521–2533. [Google Scholar] [CrossRef]
  28. Lillard, R.S.; Kashfipour, M.A.; Niu, W. Pit Propagation at the Boundary between Manganese Sulfide Inclusions and Austenitic Stainless Steel 303 and the Role of Copper. J. Electrochem. Soc. 2016, 163, C440–C451. [Google Scholar] [CrossRef]
  29. Hara, N.; Hirabayashi, K.; Sugawara, Y.; Muto, I. Improvement of Pitting Corrosion Resistance of Type 316L Stainless Steel by Potentiostatic Removal of Surface MnS Inclusions. Int. J. Corros. 2012, 2012, 6. [Google Scholar] [CrossRef]
  30. Wijesinghe, T.L.S.L.; Blackwood, D.J. Real time pit initiation studies on stainless steels: The effect of sulphide inclusions. Corros. Sci. 2007, 49, 1755–1764. [Google Scholar] [CrossRef]
  31. Roffey, P.; Davies, E.H. The generation of corrosion under insulation and stress corrosion cracking due to sulphide stress cracking in an austenitic stainless steel hydrocarbon gas pipeline. Eng. Fail. Anal. 2014, 44, 148–157. [Google Scholar] [CrossRef]
Figure 1. Sketch of a AISI 316L tube-fitting nut (Swagelok®). The colored cross section exhibits the simulated maximum principal stress distribution under service conditions (in MPa), obtained by finite-element analysis.
Metals 10 01324 g001
Figure 2. Stress–corrosion testing protocol: 2.6Ms (720h) at 338K, cyclic between two distinct levels of relative humidity, ϕ 1 = 1.00 , ϕ 2 = 0.65 , for increasing durations t 1 , t 2 as shown in the diagram. The inset shows tested tube fitting system after 777.6ks.
Metals 10 01324 g002
Figure 3. Macro- and microscale plan-view images of stress–corrosion-tested AISI 316L nuts, machined by different tools. (a,a’) FT1. (b,b’) FT2. (c,c’) SPT.
Metals 10 01324 g003
Figure 4. Different forms of cracks. (a) Crack nucleated at the pitting corrosion site on the annulus surface of SPT. (b) Crack branched out transgranularly under the chamfer surface of FT1.
Metals 10 01324 g004
Figure 5. Microstructure and microhardness–depth profiles close to annulus and chamfer surfaces (on the left side) of as-machined nuts. (a,a’) FT1. (b,b’) FT2. (c,c’) SPT.
Metals 10 01324 g005
Figure 6. TEM bright-field image of as-machined FT1 from annulus subsurface (left) to the core (right). The color-coded maps indicating the local crystallographic orientation of the surface normal reveal the transition of microstructure from the immediate-subsurface to the alloy core.
Metals 10 01324 g006
Figure 7. X-ray diffractograms of as-machined FT1, FT2, and SPT in comparison with the standard diffractogram of -Fe. The diffractograms were obtained on the nut annulus surface in a region close to the chamfer.
Metals 10 01324 g007
Figure 8. ASTAR orientation analysis and phase-mapping, verifying transformation from austenite to martensite in the chamfer zone of as-machined FT1. (a) Correlation-index map. (b) Phase map. (c) Orientation map. (d) Misorientation as a function of the spatial coordinate l along the straight line shown in (b).
Metals 10 01324 g008
Figure 9. Elemental mapping of stress–corrosion-tested FT1. The analyzed cross section is from a cracked region near the chamfer.
Metals 10 01324 g009
Figure 10. Elemental mapping of as-machined FT1. The analyzed region is from around the annulus, where the deformed layer was noted in 05-TEM(a,a’).
Metals 10 01324 g010
Figure 11. Surface morphology and surface roughness of as-machined nuts. (a) FT1. (b) FT2. (c) SPT. Note that the color–height scale is different in each case. (d) The average roughness, R a . (e) Root mean square roughness R q . Results from Swagelok nuts machined by the same method are grouped and marked by colored shading. Non-grouped nuts are from other companies.
Metals 10 01324 g011
Figure 12. Model illustrating the impact of machining-induced grain refinement and surface roughness variation on SCC susceptibility of.
Metals 10 01324 g012
Table 1. Composition of AISI 316L stainless steel nuts.
X Fe X Cr X Ni X Mn X C X P X S
Atom
Fractions
0.683 0.181 0.113 0.020 0.0014 0.0008 0.0005
68.3 % 18.1 % 11.3 % 2.0 % 0.14 % 0.08 % 0.05 %
Table 2. Surface roughness of specimens surface-machined with different tools.
Tool R a / m R q / m
FT1 0.60 ± 0.15 0.70 ± 0.25
FT2 0.35 ± 0.10 0.50 ± 0.15
SPT 0.75 ± 0.20 1.75 ± 1.20

