Article

Tensile Properties and Microstructural Evolution of an Al-Bearing Ferritic Stainless Steel at Elevated Temperatures

1
Key Laboratory of Advanced Structural Materials, Ministry of Education, Changchun University of Technology, Changchun 130012, China
2
National Key Laboratory for Precision Hot Processing of Metals, Harbin Institute of Technology, Harbin 150001, China
3
College of Mechanics and Materials, Hohai University, Nanjing 211100, China
*
Authors to whom correspondence should be addressed.
Metals 2020, 10(1), 86; https://doi.org/10.3390/met10010086
Submission received: 29 November 2019 / Revised: 24 December 2019 / Accepted: 27 December 2019 / Published: 4 January 2020
(This article belongs to the Special Issue Thermomechanical Processing of Steels)

Abstract

:
The influence of temperature and strain rate on the hot tensile properties of 0Cr18AlSi ferritic stainless steel, a potential structural material in the ultra-supercritical generation industry, was investigated at temperatures ranging from 873 to 1123 K and strain rates of 1.7 × 10⁻⁴–1.7 × 10⁻² s−1. The microstructural evolution linked to the hot deformation mechanism was characterized by electron backscatter diffraction (EBSD). At the same strain rate, the yield strength and ultimate tensile strength decrease rapidly from 873 K to 1023 K and then gradually to 1123 K. Meanwhile, both yield strength and ultimate tensile strength increase with the increase in strain rate. At high temperatures and low strain rates, the prolonged necking deformation can be observed, which determines the ductility of the steel to some extent. The maximum elongation is obtained at 1023 K for the strain rates of 1.7 × 10⁻³ and 1.7 × 10⁻² s−1, while this temperature is postponed to 1073 K once decreasing the strain rate to 1.7 × 10⁻⁴ s−1. Dynamic recovery (DRV) and continuous dynamic recrystallization (CDRX) are found to be the main softening mechanisms during the hot tensile deformation. With the increase of temperature and the decrease of strain rate (i.e., 1123 K and 1.7 × 10⁻⁴ s−1), the sub-grain coalescence becomes the main mode of CDRX that evolved from the sub-grain rotation. The gradual decrease in strength above 1023 K is related to the limited increase of dynamic recrystallization and the sufficient DRV. The area around the new small recrystallized grains on the coarse grain boundaries provides the nucleation site for cavity, which generally results in a reduction in ductility. Constitutive analysis shows that the stress exponent and the deformation activation energy are 5.9 and 355 kJ·mol−1 respectively, indicating that the dominant deformation mechanism is the dislocations motion controlled by climb. This work makes a deeply understanding of the hot deformation behavior and its mechanism of the Al-bearing ferritic stainless steel and thus provides a basal design consideration for its extensive application.

1. Introduction

Ferritic stainless steels are widely used in automobile, furnace part, construction and environmental protecting industries owing to their higher thermal conductivities, smaller thermal expansions, better resistance to atmospheric corrosion and stress corrosion cracking, and lower cost in comparison with austenitic stainless steels [1,2]. However, low strength and poor resistance to oxidation at high temperatures generally limit their extensive application.
Hot tensile property is an important performance index of heat resistant steel. Generally, the dynamic recovery (DRV) and dynamic recrystallization (DRX) are the most softening mechanisms during the deformation [3,4]. The microstructural reconstitution including grain refinement and structure homogenization can be achieved, which will be beneficial to improve the high temperature strength and toughness of the materials [5]. Of course, the microstructural evolution during the deformation depends strongly on the deformation parameters, such as temperature and strain rate, and thus affecting the mechanical property. Chiu et al. [6] investigated the hot tensile property of Crofer 22 APU ferritic stainless steel at the temperatures of 873–1073 K and found a remarkable drop of yield strength between 973 and 1023 K due to the obvious DRV. In addition, the micro-alloying technique as an efficient approach has been applied in ferritic stainless steels to improve the high temperature property [7,8]. The solute atoms, such as Nb, Mo, Ti, and Zr, are used to enhance the high temperature strength of ferritic stainless steels [9,10,11]. Moreover, W and Ce can improve their high temperature oxidation resistance [12,13]. However, these alloying elements are commonly expensive, and it is no doubt that they would increase the manufacturing cost of the products of ferritic stainless steels.
Recently, with the development of metallurgical technologies, it is proved that Al as a cheap element becomes an important alternative of the alloying design for many steels. For instance, adding a small amount of Al (~1 wt.%) in transformation induced plasticity steels (TRIPs) facilitated the suppression of cementite precipitation, the refinement of the bainite laths and the retention of austenite [14,15,16], all which would improve the strength and toughness. For high Mn steels, the addition of Al could increase the stacking fault energy and produce short-range ordering and/or κ′-carbide precipitation [17]. In addition, Al can lead to a specific weight reduction, and a 1.3% reduction in density was obtained per 1 wt% addition of Al [17]. Due to the addition of the large amount of Al (~10 wt.%), a new type of steel, namely low-density steel, has been formed [18]. The strength of oxide dispersion strengthened steels (ODSs) also increased with Al addition due to the back stress strengthening combined with Orowan strengthening [19]. However, for ferritic stainless steels, the high temperature properties [20], particularly in oxidation resistance [21,22], could be improved considerably by alloying them with Al. However, the addition of Al could decrease the recrystallization temperature of ferritic stainless steels [23], and thus resulted in untimely softening during applications at high temperatures. Hence, the research on the hot deformation behavior of Al-bearing ferritic stainless steels is significant. However, the studies on this aspect are limited.
0Cr18AlSi ferritic stainless steel is a potential structural material in the ultra-supercritical generation industry. The authors’ previous results showed that this steel exhibited excellent high temperature oxidation resistance at 1073 and 1173 K due to the formation of continuous, compact, and well-adherent multicomponent oxide films containing Al2O3 [21]. The purpose of the present study is to investigate the hot tensile deformation behavior and fracture of 0Cr18AlSi ferritic stainless steel. Effects of temperature and strain rate on the tensile properties and microstructural evolution are analyzed in detail. The results provide a reasonable evidence for the materials design and applications of Al-bearing ferritic stainless steels.

2. Materials and Methods

The 0Cr18AlSi ferritic stainless steel used in this study was prepared by melting high-purity elements in a vacuum induction furnace with an argon atmosphere. Its composition is as follows (wt.%): C 0.09, Cr 18.4, Al 1.05, Si 1.01, Mn 0.75, P 0.017, S 0.001. The ingots were first forged at 1423 K, and then hot-rolled at 1323 K to 8 mm thick strips in a laboratory hot-rolling mill. The strips were annealed at 1123 K for 40 min in a resistance furnace, followed by quenching in water.
The tensile specimens with a gage length of 10 mm and cross section of 2 mm × 2 mm were machined from the annealed plates parallel to rolling direction. An electronic universal testing machine (WDW-200, JILIN GUANTENG AUTOMATION TECHNONOGY CO., LTD., Changchun, China) was used to carry out the tensile tests. Temperatures ranging from 873 to 1123 K and strain rates ranging from 1.7 × 10⁻⁴ to 1.7 × 10⁻² s−1 were employed. The specimens were loaded at the target temperature for 20 min before testing in order to eliminate the temperature gradient. After the tensile tests, all specimens were immediately quenched to room temperature by water.
The fracture surfaces of the tensile specimens were observed by scanning electron microscope (SEM, JSM-5600, JEOL, Tokyo, Japan). The microstructural morphology close to the fracture parallel to tensile direction was analyzed by the optical microscope (OM, DM13000M, Leica, Vizula, Germany). After the standard metallographic procedures including grinding, polishing and etching for the specimens, a mixed solution of 5 vol.% ferric chloride (FeCl3) and 5 vol.% hydrochloric acid (HCl) in distilled water was used to display the microstructures. In order to obtain the detailed information on microstructural evolution during hot deformation, electron backscattered diffraction (EBSD) technology was performed. The specimens for EBSD were ground mechanically followed by argon ion polishing. The HKL CHANNEL 5 software (Company Oxford Instruments, Oxfordshire, UK) was utilized to post-process the data obtained from the EBSD measurements.

3. Results and Discussion

3.1. Initial Microstructure

The initial microstructure of the studied steel is shown in Figure 1a, which reveals a relatively uniform equiaxed grain structure with an average grain size of 27 μm, as measured by the linear-intercept method (ASTM E112). Corresponding X-ray diffraction result is seen in Figure 1b. Only body-centered cubic (bcc) structured phase can be detected, confirming that the existence of the complete ferritic microstructure after annealing at 1123 K for 40 min.

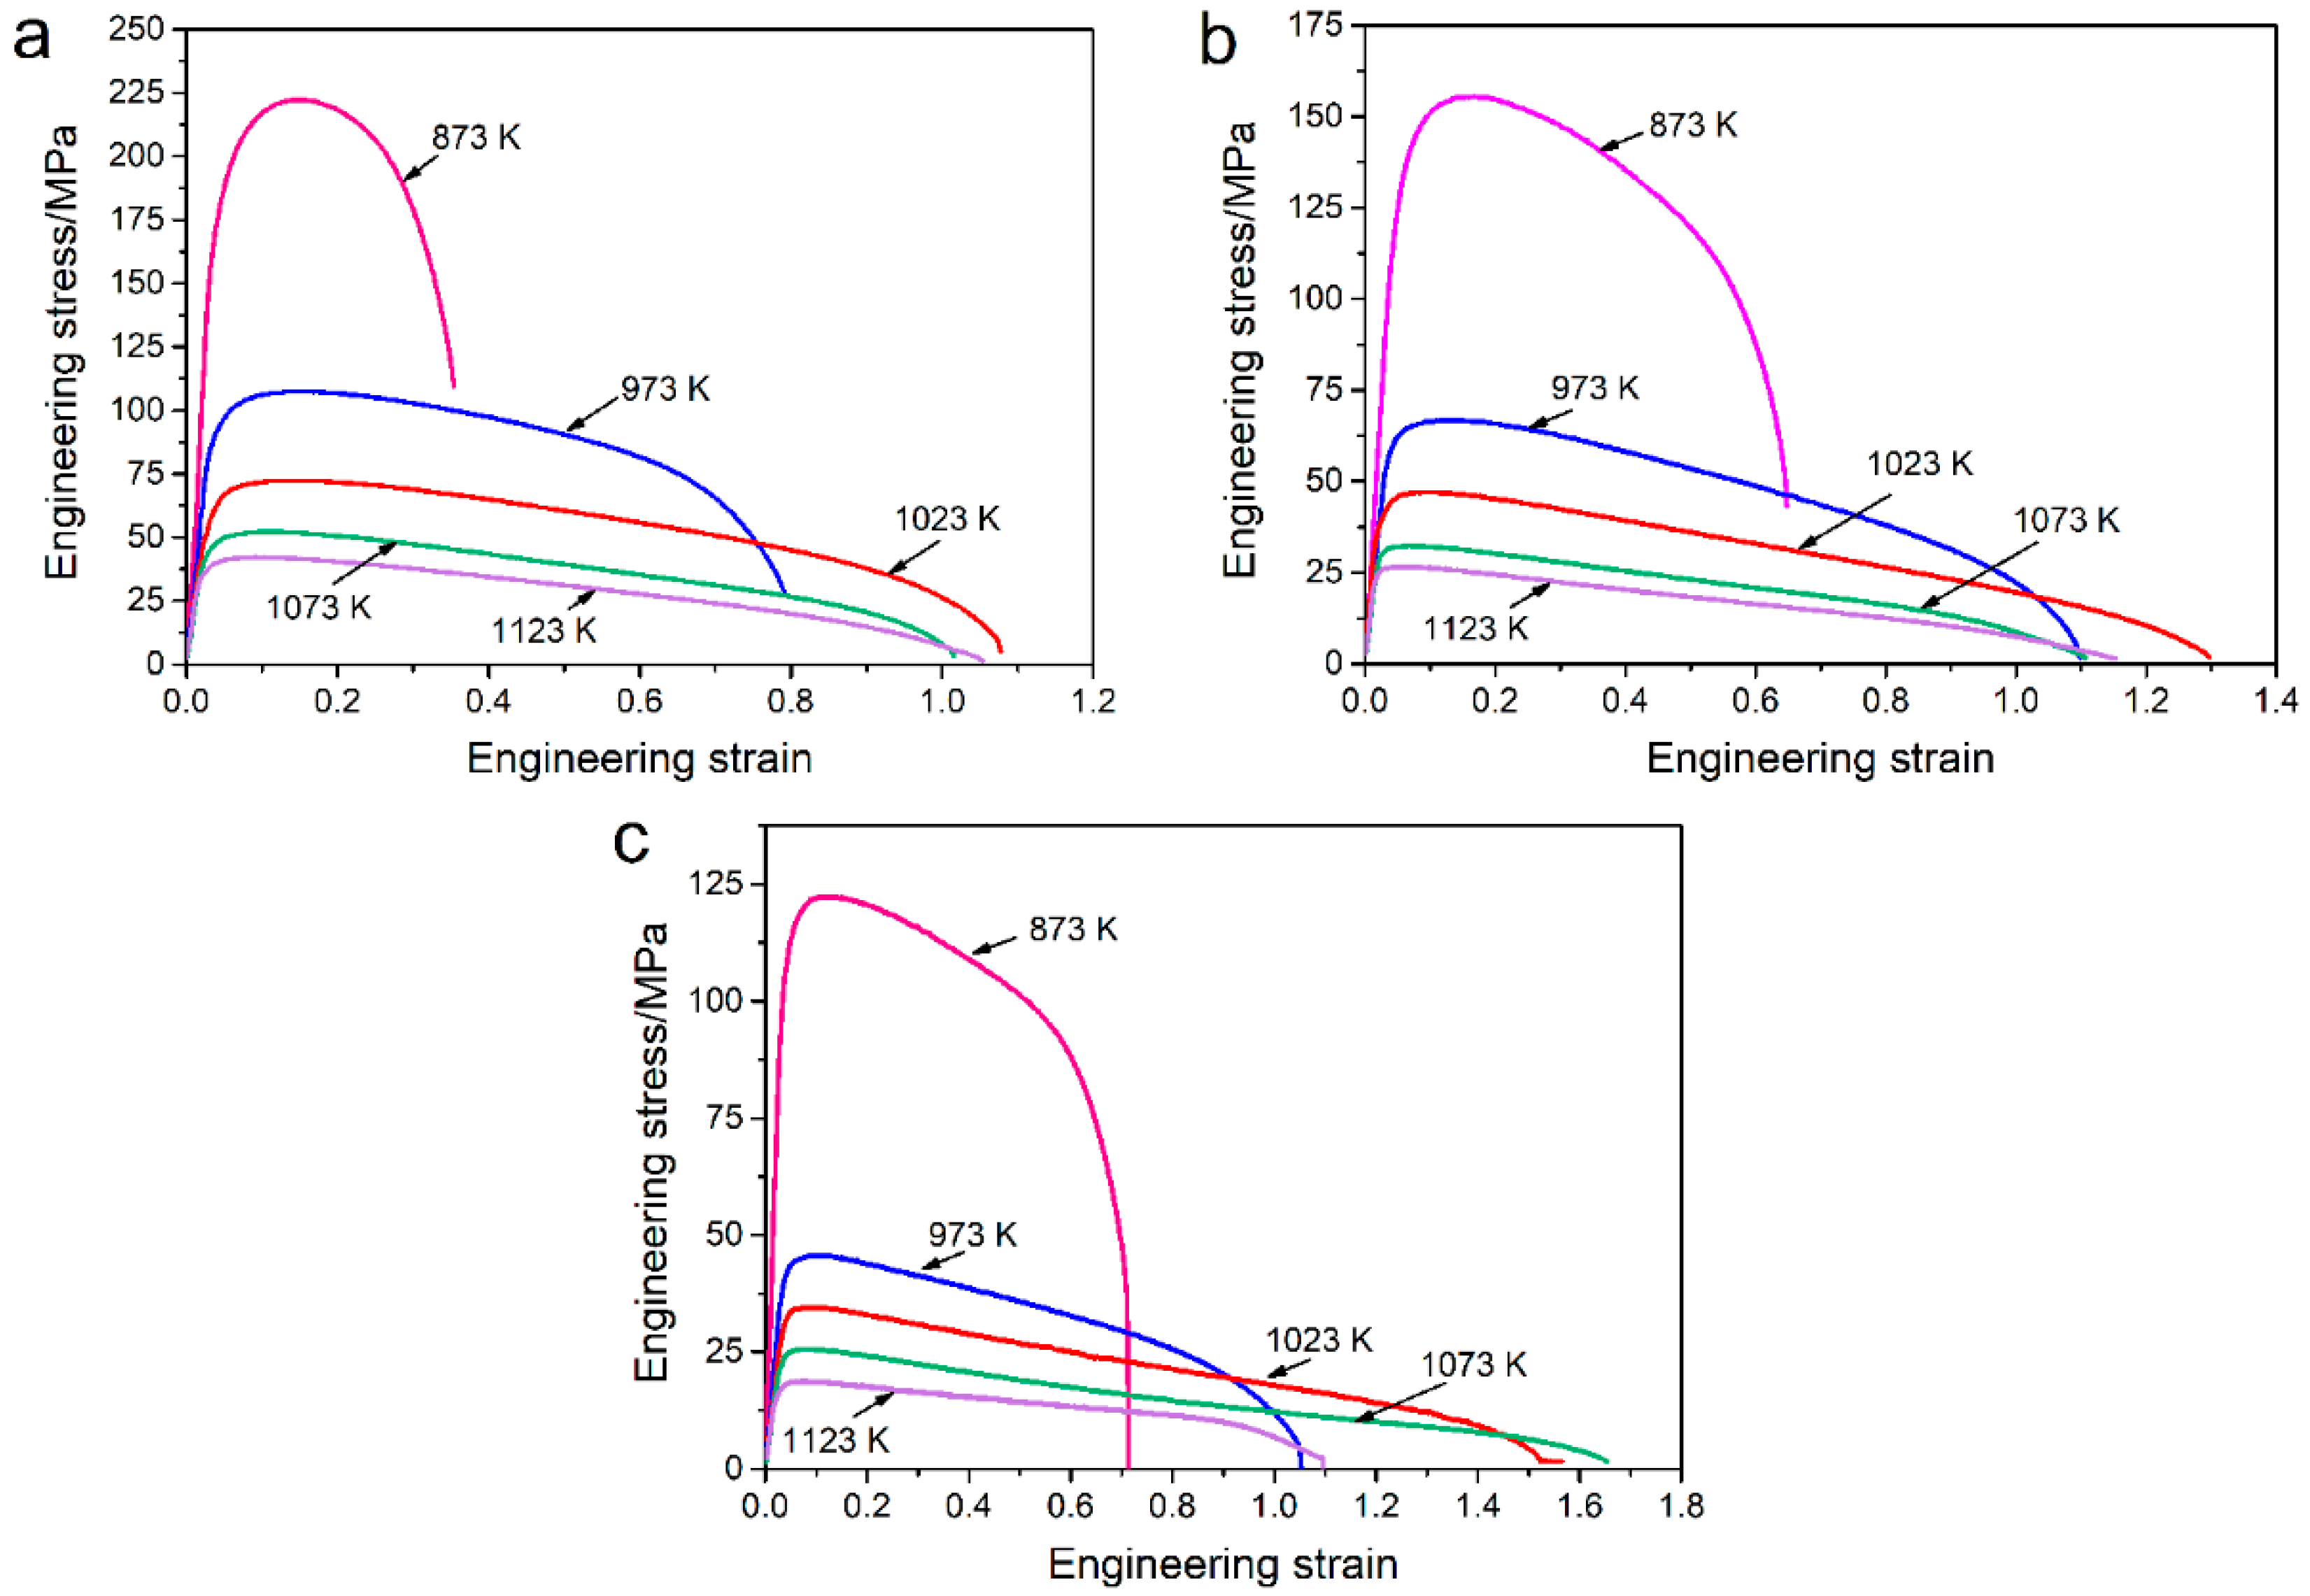
3.2. Tensile Properties

Figure 2 shows the tensile engineering stress–strain curves of the specimens tested at different deformation conditions. It can be seen that the flow behavior is sensitive to deformation temperature and strain rate. At low temperature and high strain rate, i.e., 873 K and 1.7 × 10⁻² s−1, the variation of flow stress is parabolic. It means that the flow stress increases to a peak value at a reduced increase rate as the strain proceeds, and then declines quickly until the specimen ruptures. This is related to the microstructural evolution during hot tensile deformation. As illustrated in Figure 1b, the studied steel has a bcc structure. The dislocations can cross-slip and climb easily during hot deformation because of a relatively high stacking fault energy of the bcc structure [24], and thus dynamic recovery (DRV) generally dominates the softening process of this kind of steel [24,25]. Dynamic recrystallization (DRX) will take place only when DRV is not enough to offset the strain hardening effect [26]. As can be seen, the slow increase in flow stress at the early deformation stage indicates that the flow softening, mainly DRV, occurs. This partially offsets the initial strain hardening caused by dislocation proliferation. After necking, the cavities and cracks will be formed easily. Their rapid propagation at the localized necking positions can be responsible for the sharp decrease in flow stress. In stark contrast to parabolic stress-strain curve, the stress-strain curves are characterized by the rapidly increased flow stress to a peak value followed by gradually decreasing at a steady rate as increasing the temperature or decreasing the strain rate, as shown in Figure 2b,c. This indicates the extended necking deformation though the necking has occurred. The similar phenomenon has also been reported in other alloys [27,28]. It is inferred that the flow softening associated with DRV and possible DRX can promote the progressive development of necking deformation and thus delay the necking rupture.
The tensile properties, namely, yield strength (YS), ultimate tensile strength (UTS), elongation to fracture (EL), uniform elongation (UE), and reduction of area (RA) are summarized in detail, and the results are presented in Figure 3. From Figure 3a,b, it can be seen that, overall, YS and UTS drop rapidly from 873 K to 1023 K for all strain rates followed by a gradual decrease until 1123 K. Meanwhile, both YS and UTS increase with the increase of the strain rate for all temperatures. The maximum YS and UTS are obtained at 873 K and 1.7 × 10⁻² s−1 (166.49 MPa and 222.28 MPa, respectively). It is known that the grain boundary and dislocation are easy to move at high temperatures, because the average kinetic energy of atoms increases and the critical shear stress for dislocation activation is reduced [29]. Therefore, the flow softening can be promoted by reducing the dislocation density at high temperatures, so as to decrease the strength. In addition, the increase of strain rate can enhance deformation storage energy and restrict atoms motion, which can cause an obvious work hardening, and thus results in the enhancement of strength. The influence of temperature on the EL is complex (Figure 3c). At high strain rates of 1.7 × 10⁻² s−1 and 1.7 × 10⁻³ s−1, EL increases with increasing temperature up to 1023 K, after which it exhibits a gradual decrease and then remains relatively stable. At the low strain rate of 1.7 × 10⁻⁴ s−1, a peak value in EL (~163%) can be found at 1073 K, indicating the pleasant plasticity. However, at temperatures above 1073 K, EL decreases to ~107%. Generally, such remarkable decrease in EL at high temperatures is ascribed to carbide precipitation and grain boundary migration [30]. The detailed discussion will be demonstrated later. Furthermore, it is observed from Figure 2 that the studied steel shows a limited strain hardening. The variations of UE with temperature at different strain rates are shown in Figure 3d. It is well known that the higher the value of UE, the more the strain hardening capacity [27]. From Figure 4d, UE decreases with increasing the temperatures regardless of the strain rates. UE presents a high level at the strain rate of 1.7 × 10⁻² s−1 in comparison to other employed strain rates, where it reaches a maximum of 12.5%. This infers that the flow softening is accelerated at low strain rate and high temperature, which thereby leads to an invisible strain hardening during the initial tensile deformation. For the RA, as shown in Figure 3e, it increases with increasing the temperature at all strain rates, which exhibits a distinct difference with the variation of EL at temperatures above 1023 K. A high RA and low EL illustrates that the local necking resistance is reduced at high temperatures. RA increases with decreasing the strain rate as expect, but it changes little when the strain rate is less than 1.7 × 10⁻³ s−1.
The fracture surfaces of the specimens tested at different conditions are shown in Figure 4, which reveals the rupture features. The existence of tearing ridges and dimples indicate that the fracture failure mode is ductile in nature. At the high strain rate of 1.7 × 10⁻² s−1, it can be seen that the small equiaxed dimples are uniformly distributed on the fracture surface of the specimen deformed at 973 K (Figure 4a), and the inner walls of these dimples are smooth. The dimples become larger and deeper with increasing the temperature up to 1023 K (Figure 4b). This indicates that the studied steel undergoes large deformation before rupture, and thus facilitates the void growth. This is also evidenced from the macro-view of the tested specimen along the gauge length (Figure 4b inset). The macro-appearance of the fracture changes from square to strip, and obvious rumpling of the side walls can be observed. Moreover, the trans-granular shear becomes apparent as the increase of test temperature, as shown in Figure 4c. When the strain rate decreases to 1.7 × 10⁻⁴ s−1, there exhibits significant change on the fracture morphology. The dimples coalescence and the cracks on tearing ridges can be easily observed (Figure 4d,e). More micro-voids are also activated at low strain rates. This infers that the degree of the deformation is increased. Similar with the fracture at 1123 K and 1.7 × 10⁻² s−1, the trans-granular shear failure with plastic flow is the main feature of the fracture surface as increasing the temperature to 1073 K at 1.7 × 10⁻⁴ s−1, as shown in Figure 4f. The severe deformation featured by oblate dimples and cracks with a large size give the reason for the achievement of best elongation.

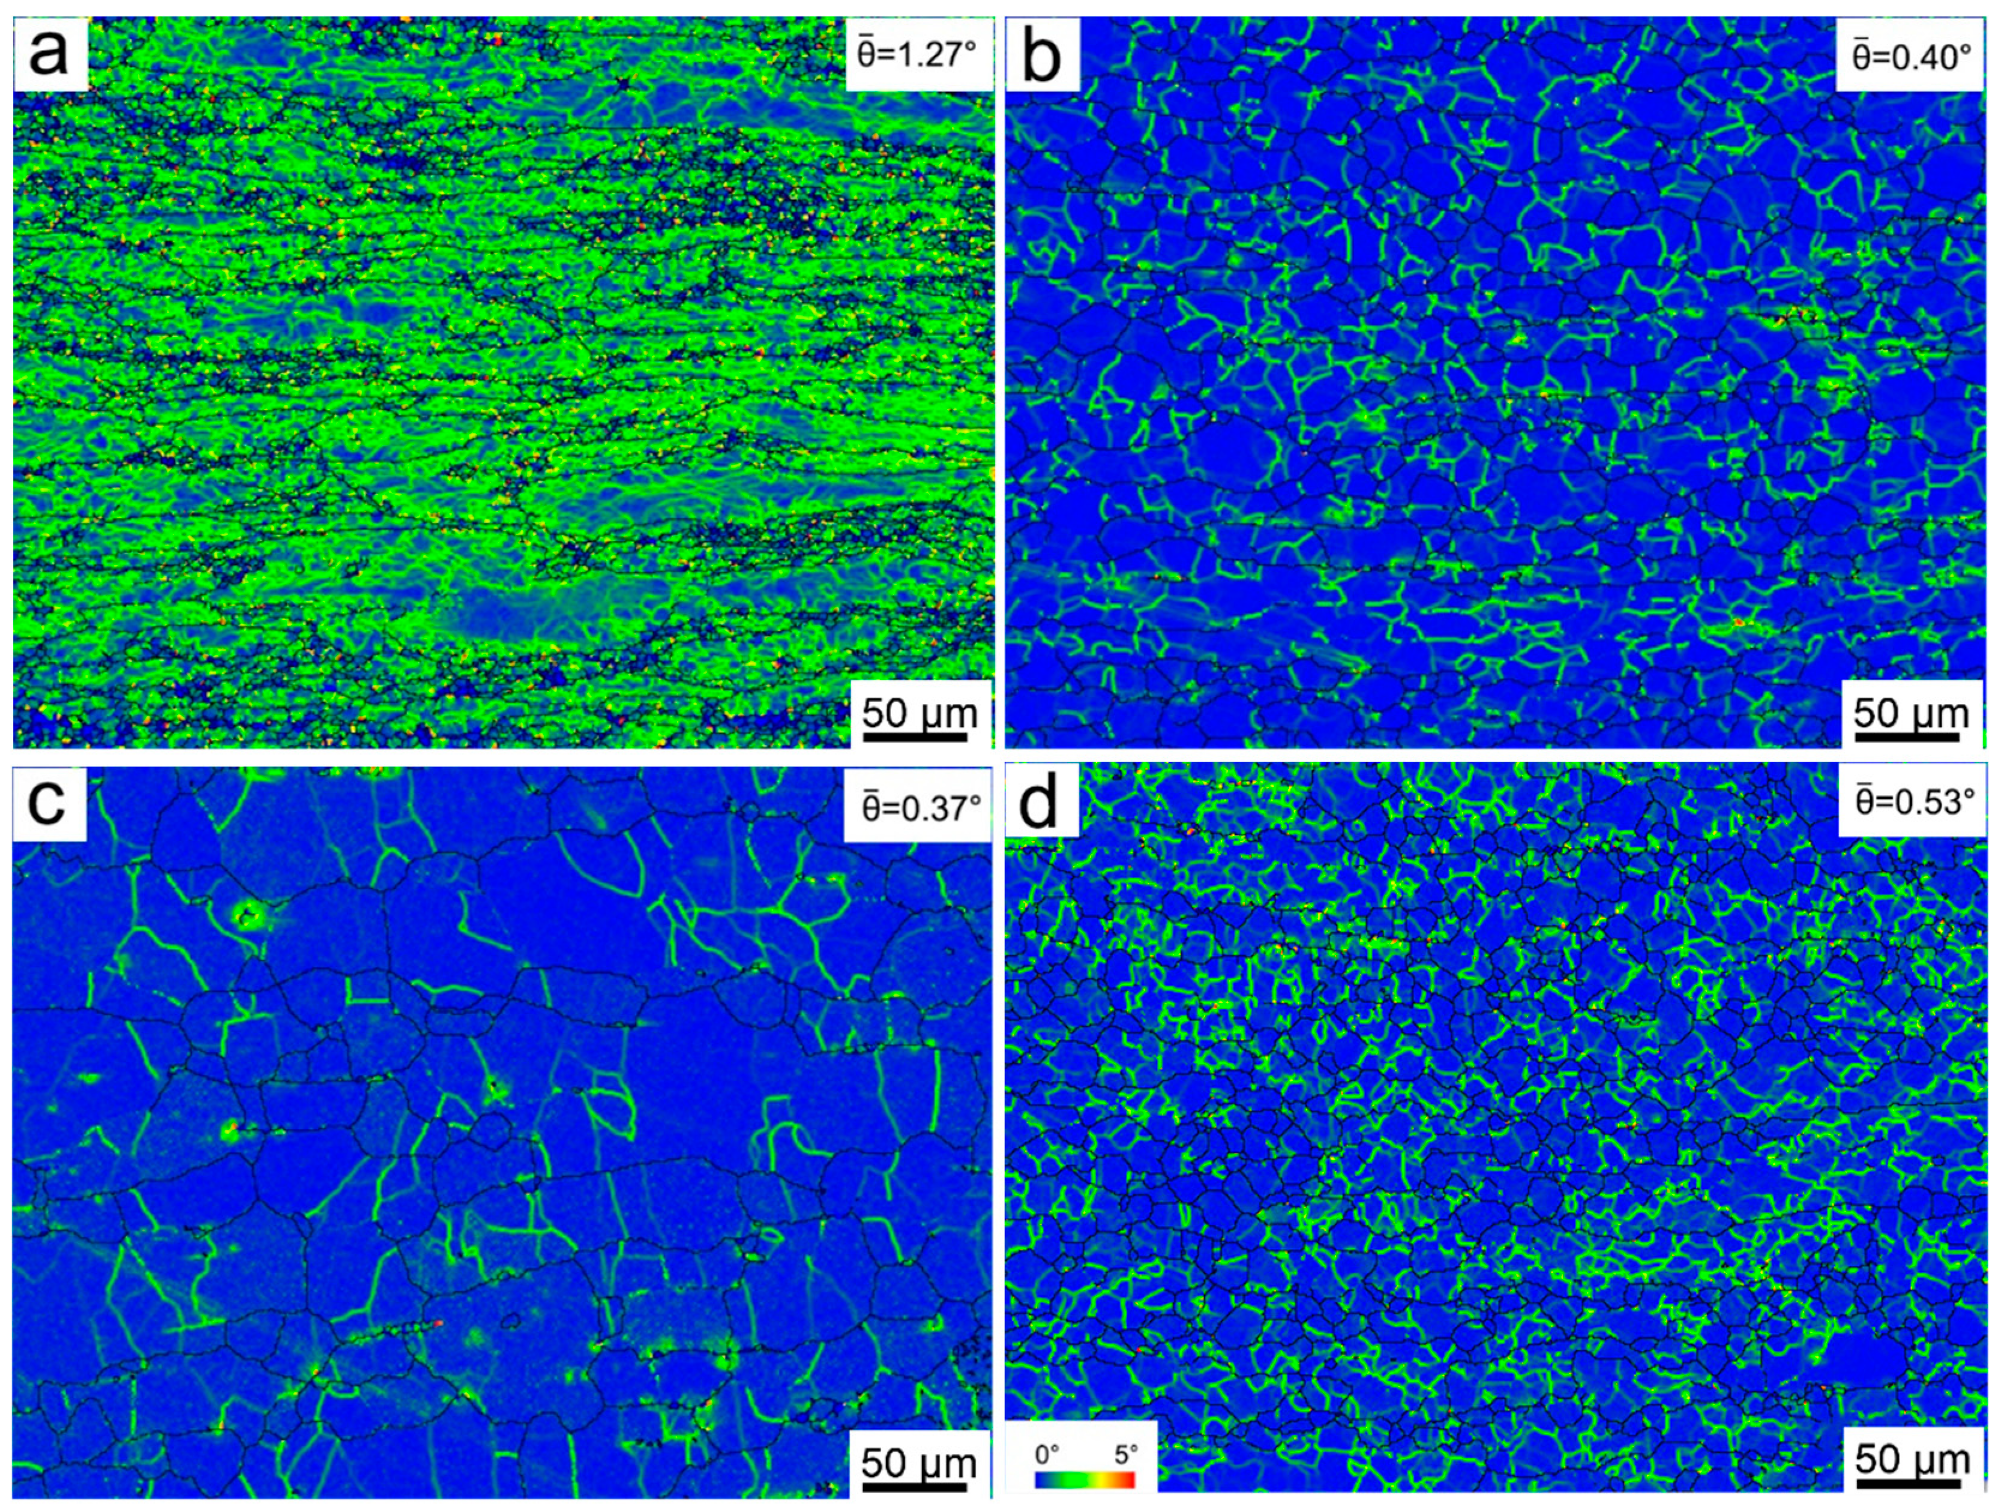
3.3. Microstructures Analyses

3.3.1. Microstructures Evolution Observed by OM

The tensile behaviors are strongly connected to the microstructures. Figure 5 shows the optical micrographs of the cross-sectional area beneath the fracture surface for the specimen fractured under the typical conditions. The characteristics of microstructures and cavities can be observed. It is seen that at 873 K and 1.7 × 10⁻⁴ s−1 (Figure 5a), most grains are elongated parallel to the tensile axis due to the deformation of original grains, and a large number of small spherical cavities appear near the grain boundaries, particularly in the boundary junctions. These small cavities become coarser in the vicinity of the fracture due to their coalescence, eventually causing the material to break. As can be seen, the fracture experiences cavity formation, cavity coalescence, and crack formation and growth. As the temperature goes up to 1023 K (Figure 5b), the equiaxed grains can be found in the microstructure near the fracture apart from the deformed grains, indicating the formation of DRX. Moreover, the number of cavities is significantly reduced. However, these cavities preferentially nucleated at the boundaries of the new grains, and they are then elongated and expanded from the grain boundaries to interiors. This process can consume a large amount of deformation energy. Therefore, the necking deformation ability is improved when deformed at 1023 K. At the high temperature of 1123 K (Figure 5c), the grains are obviously coarsened due to the activation of boundaries migration, which indicates the dynamic softening is accelerated. However, the number of elongated cavities decreases. Plenty of spherical cavities and their coalescence in the vicinity of the fracture can be observed once again, which also indicates that the studied steel undergoes low necking deformation before fracture. With increasing the strain rate up to 1.7 × 10⁻² s−1 at 1123 K (Figure 5d), the microstructure is refined obviously. It is noted that most elongated cavities distribute intensely near the upper and lower surfaces (marked the blue arrows). This because that a strong three-dimensional stress has formed at the necking area during the tensile test at high strain rates, which can promote the initiation and propagation of cavities.

3.3.2. Microstructures Evolution Observed by EBSD

In order to analyze the mechanism of microstructures evolution during hot tensile deformation, EBSD measurements were carried out on the deformed specimens. Figure 6 shows the grain morphologies near the fracture tips of the specimens tested at 1.7 × 10⁻⁴ s−1 with different temperatures. At 873 K (Figure 6a), numerous pancake-like deformed grains can be easily observed along the tensile direction. Different areas show various colors in these deformed grains, indicating the generation of sub-structures. To reveal the development of the sub-structures within the deformed grains, the local (point-to-point) and cumulative (point-to-origin) misorientations were calculated in a special grain marked the line L1 from left to right, and the results are shown in Figure 7a. Several sharp peaks with misorientation angle of 4–7° can be seen in the point-to-point misorientation curve, while the misorientation angle between these sharp peaks is less than 2°. This indicates that the orientation of different areas within this grain changes, and the grain has been divided into several sub-grains surrounded by low-angle grain boundaries (LAGBs, 2–15°). The large amount of wavy shape peaks less than 2° represent that the high density of dislocations forms in the sub-grains. Belyakov et al. [31] pointed out that the dislocation density between the dislocation walls could exceed 1014 m−2 during warm deformation for ferritic stainless steel. Moreover, the point-to-origin misorientation can easily exceed 10° on the distances of 16–20 μm, 38–93 μm, and 122–157 μm. The large strain gradient will promote the sub-grain rotation and eventually lead to the formation of high-angle grain boundaries (HAGBs, >15°). Some new segments of HAGBs have been detected in the deformed grain interiors, marked the black arrows in Figure 6a. The variation in misorientation across a typical HAGB segment is plotted in Figure 7b, which provides an evidence for the occurrence of sub-grain boundary rotation induced HAGB. Obviously, these new segments of HAGBs will promote the formation of DRX nuclei through their closed loop. Such DRX formation mechanism caused by the progressive sub-grain rotation within the deformed grain is generally referred as continuous DRX (CDRX) [32,33,34]. Therefore, the emergence of HAGBs segments means the initial stage of CDRX nucleation. In addition, some fine equiaxed grains can be observed around the original grain boundaries, except for a few clusters of small grains around the particles within the grains (white arrows in Figure 6a), thus forming the typical necklace structure. These fine grains are formed dynamically during the hot tensile deformation, indicating the formation of DRX. However, the DRX region accounts for only ~7%. The average size of the new grains is about 3.7 μm. It is referred that the growth of DRX grains is restricted due to the low deformation temperature in spite of at a very low strain rate. The serrated original grain boundaries can be easily observed in Figure 6a, and fine grains exist along these boundaries. This phenomenon is generally associated with discontinuous DRX (DDRX) characterized by grain boundary bulging [35]. The nucleation sites of DDRX can be provided by the grain boundary bulging through strain-induced grain boundary migration. Subsequently, the sub-boundaries with low misorientations caused by dislocation rearrangement can be formed at the bottom of the bulging area, and then they continuously absorb dislocations to increase their misorientations. Once HAGBs form from these LAGBs, the fine DDRX grains will develop. In fact, DDRX will spread toward the center of the prior grain with increasing the strain, and eventually swallow up the whole grain. However, under the current state, DDRX is insufficient because of the low degree of deformation. Therefore, DRV characterized by sub-grain formation and a small amount of DDRX play an important role in the microstructural evolution.
At 1023 K (Figure 6b), as expected, the extensive DRX can be observed. The degree of DRX reaches 42%. Obviously, the DRX process is facilitated when the temperature increases from 873 to 1023 K at the strain rate of 1.7 × 10⁻⁴ s−1, and thus DRX becomes a main softening mechanism. However, no necklace structure like the one in Figure 6a is observed, and numerous equiaxed grains can be found. Meanwhile, sub-structures are formed in the deformed grains, especially near the grain boundaries. The misorientation change across a typical deformed grain from left to right is shown in Figure 8a. Similarly, this grain is divided into several well-defined sub-grains with different misorientations. The cumulative misorientation exceeds 10° over the distance of 17–80 μm. These sub-grain boundaries will easily develop into HAGBs with the increase of strain through the progressive sub-grain rotation [36]. Many sub-grains have been partly surrounded by the HAGBs (black arrows in Figure 6b), indicating the CDRX nucleation mechanism. Hence, the softening behavior at 1023 K is mainly controlled by DRV and CDRX. In addition, it is observed that the size of DRX grains increases in comparison to that at 873 K. This is because the increased temperature provides a greater driving force for migration of sub-grain/grain boundaries. Because of this, some new grains can still be nucleated by the bend of the grain boundary. Figure 8b shows the misorientation change across a special local bulging area from left to right, marked L4 in Figure 6b. The misorientation cumulates up to 10° at the bottom of bulging area, indicating that a well-developed sub-grain boundary has formed.
At 1123 K (Figure 6c), it is seen that the area of DRX region is ~46%, which has a slight increase when compared to that obtained at 1023 K. Coarse grains can be observed, and the average size of DRX grains is increased to ~32 μm. However, the amount of sub-structures decreases significantly, and therefore, the density of dislocations is reduced. Most of sub-boundaries are straight and regular, indicating that DRV becomes sufficient because of high driving force for dislocations climb and cross-slip [25]. The reduction of sub-structures accompanied with low dislocation density lowers the amount of stored energy, and thus reducing the driving force for lattice rotation. It is inferred that high temperature can contribute to the coalescence of sub-grains and the migration of sub-grain/grain boundaries. Figure 9 shows the variation in misorientation across several sub-grains from left to right, which reveals the development of sub-grain coalescence. From the lines L5 and L6, the misorientation angles between grains A and B or D and E are less than 2°, and the cumulative misorientations do not exceed 5°. This indicates that the adjacent grains gradually coalesce into a single grain through rotating to reduce the misorientation. It is noted that some new equiaxed grains have been formed on the boundaries of coarse grains (black arrows in Figure 6c). These new grains may be nucleated through grain boundary bulging. However, they are very small in size, and thus results in a less uniform microstructure. In summary, at high temperature of 1123 K, the effect of progressive sub-grain rotation induced HAGBs is weakened, and CDRX caused by sub-grain coalescence becomes the main mechanism of DRX.
In order to analyze the strain rate effect on the microstructures during hot tensile deformation, IPF-coloring orientation map of the studied steel deformed at a high strain rate of 1.7 × 10⁻² s−1 with 1123 K are presented in Figure 6d. The elongated original grains contained sub-structures as evident from the color variations can be observed, and a considerable HAGBs fragments are formed within these deformed grains. In addition, the new recrystallized grains can be seen inside the grains. It is inferred that these new grains nucleate through CDRX with the mechanism of sub-grain rotation. The HAGBs fragments will be able to contribute the CDRX nucleation. However, the fraction of DRX decreases to 38% as compared with that under the strain rate of 1.7 × 10⁻⁴ s−1. The DRX grain size also decreases. The high strain rate can increase the dislocation density, and generate more stored deformation energy [34,37]. Hence, the sub-grain rotation can be accelerated, leading to a quick nucleation of DRX. However, the growth of new grains is restricted due to the insufficient time for the migration of grain boundaries at the high strain rate. As a result, a finer microstructure is obtained.
The full grain boundary distribution corresponding to the Figure 6 is shown in Figure 10. Black and green lines represent HAGBs and LAGBs respectively. It is clear that a large number of LAGBs composed of dislocation-rich layers exist in the deformed grains at 873 K (Figure 10a,b). Interestingly, in large deformed grains, the closer to the original HAGBs, the higher the density of sub-grain boundaries. It can therefore be inferred that the area near original HAGBs has a high dislocation density. With increasing the deformation temperature (Figure 10c–f), as expected, the fraction of LAGBs decreases, while the fraction of HAGBs increases. This indicates that the dynamic softening accompanied with CDRX is reinforced with the increase of temperature. However, at high temperature of 1123 K, the fraction of sub-grain boundaries with misorientation angles less than 2° increases to 34%. This is related to the decrease in the boundary misorientation caused by a large number of sub-grain coalescence. In addition, according to Refs [38,39], the high fraction of 10–15° misorientation angles in sub-structures means that it may produce more HAGBs from these LAGBs by sub-grain rotation. For the strain rate of 1.7 × 10⁻⁴ s−1, the fractions of 10–15° misorientation angles at temperatures of 873, 1023, and 1123 K are 6%, 7% and 3.5%, respectively, which illustrates that the transition and migration from LAGBs to HAGBs is reduced at 1123 K. Therefore, the sub-grain coalescence becomes the main mode of CDRX gradually. With increasing the strain rate up to 1.7 × 10⁻² s−1 at 1123 K (Figure 10g,h), the distribution of sub-grain structure trends to uniform, which results in the fragment of the original grains. A high fraction of LAGBs (45%) can be obtained, which is much higher than that at 1.7 × 10⁻⁴ s−1. The presence of more sub-grains with LAGBs and segments of HAGBs in the interiors of grains will be able to contribute the CDRX nucleation by sub-grain rotation.
Kernel average misorientation (KAM) maps corresponding to the Figure 6 are shown in Figure 11. The KAM value can be recognized as an indicator of dislocation density. The higher the KAM value, the higher the dislocation density. At 1.7 × 10⁻⁴ s−1 and 873 K (Figure 11a), it is observed that the average KAM value is 1.27°. At this stage, DRV, rather than DRX, is the dominant softening mechanism. Furthermore, the high KAM values can be found in the areas surrounding the new DRX grains, indicating that a high density of dislocation has formed in these areas. The limited deformation between the adjacent new grains due to the high strain nearby the grain boundaries cannot offset the stress concentration caused by dislocations pilling up, and as a result, the cavities can be induced. This explains why the cavities preferentially nucleate nearby the original grain boundaries where DRX apparently takes place (Figure 6a). The high density of spherical cavities can be responsible for the low ductility and the significant necking. The average KAM value decreases with increasing the deformation temperature (Figure 11b,c), 0.40° for 1023 K and 0.37° for 1123 K. The dislocation density decreases significantly due to DRX, resulting in an obvious decrease in strength during the hot tensile process. However, a slight decrease in KAM value is observed at 1123 K, which is attributed to limited increase of DRX and sufficient DRV, thus leading to the slow decrease of flow stress in the range of 1023–1123 K. Moreover, at 1123 K, the area on the side of the bulging for new grains nucleated at the original grain boundaries has a relatively high KAM value. The deformation incompatibility in this area due to large difference in grain size generally can provide the sites for the nucleation of cavities (Figure 5c). The coarse grains caused by fast migration of boundaries and uneven grain distribution lead to the decrease of ductility. Figure 11d shows the effect of strain rate on the KAM value. It is found that the density of dislocations is increased at 1.7 × 10⁻² s−1, and the average KAM value is 0.53°, which is slightly higher than that at 1.7 × 10⁻⁴ s−1. The distribution of KAM value is relatively uniform. Therefore, the strength of the studied steel is increased.

3.4. Kinetic Analysis

The hot tensile flow behavior of the 0Cr18AlSi steel can be presented through the correlation among true stress, deformation temperature and strain rate, which is generally expressed by the Arrhenius type equation [40,41]:
ε ˙ = A σ n exp ( Q R T ) ,
where ε ˙ the strain rate (s−1), A a constant (s−1), σ the true stress (MPa), n the stress exponent, Q the deformation activation energy (kJ·mol−1), R the universal gas constant (8.314 J mol−1 K−1), and T the temperature in K.
In Equation (1), the stress exponent and the deformation activation energy are considered to be the significant parameters with physical meaning. The stress exponent correlates the high temperature deformation mechanism, while the deformation activation energy reflects how the temperature affects the kinetics or the rate of the process, i.e., diffusion. In order to estimate the n value of the 0Cr18AlSi steel at the current state, Equation (1) can be rewritten in the following expression:
ln σ = ln ε ˙ n + Q n R T l n A n .
Here, the stable true stresses are taken from the flow curves. Remarkably, the n value can be obtained from the reciprocal of the slope of the linear regression line in the lnσ ln ε ˙ plot at a particular temperature. In fact, such slope of the regressive line, the reciprocal of the stress exponent, represents strain rate sensitivity (m, m = 1/n). Ideally, a larger m value indicated a larger ductility and higher necking resistance [40]. Figure 12a shows the correlation between the flow stress and strain rate in a natural log. It is clear that at the low temperature of 873 K, m has the lowest value (~0.12), indicating a low ductility, which is consistent with the results in Figure 3c. While increasing the temperature, the value of m rises first and then declines. The maximum m value (~0.19) can be obtained at temperatures between 1023 and 1073 K. After averaging the m values, the stress exponent is estimated to be 5.9. It is accepted that, when n = 4–6, the motion of dislocations controlled by climb would be the dominant deformation mechanism [42].
Similarly, for a particular strain rate, the partial derivatives from both sides of Equation (2) are taken to 1/T, Q can be expressed as:
Q = n R [ ln σ ( 1 / T ) ] ε ˙ = n R S ,
where S the slope of lnσ–1/T plot at various strain rates, as shown in Figure 12b. The Q value of the present steel is calculated to be 355 kJ·mol−1. This value is found to be much higher than the activation energy of self-diffusion in α–Fe (239 kJ/mol) [43], indicating that the softening mechanism of the 0Cr18AlSi steel at high temperatures is controlled by DRV and DRX rather than diffusion. However, it is lower than the previously determined values of 385 kJ/mol for high purity 17Cr ferritic stainless steel [44], 405 kJ/mol for 21Cr ferritic stainless steel [45], or 424 kJ/mol for Ti and Nb containing 17Cr ferritic stainless steel [46]. Such relatively low deformation activation energy for the 0Cr18AlSi steel means that the movement of dislocations, such as climbing of edge dislocations and cross-slipping of screw dislocations, only requires a small driving force during hot deformation. Therefore, DRV and DRX occur more easily in comparison with the above conventional ferritic stainless steels.

4. Conclusions

The hot tensile tests were conducted at temperatures ranging from 873 to 1123 K and strain rates of 1.7 × 10⁻⁴–1.7 × 10⁻² s−1 for the 0Cr18AlSi ferritic stainless steel. The tensile properties and mechanism of microstructural evolution were investigated. The main results are as follows:
(1)
The maximum elongation to fracture can be obtained at 1023 K for the strain rates of 1.7 × 10⁻³ and 1.7 × 10⁻² s−1. The temperature for the maximum elongation to fracture is delayed to 1073 K when decreasing the strain rate to 1.7 × 10⁻⁴ s−1. The decrease in necking deformation resistance caused by fast migration of boundaries and uneven grain distribution results in the low ductility at high temperature of 1123 K.
(2)
At low temperature, DRV dominates the softening process though a small number of DDRX occurs. As increasing the temperature, the flow softening by CDRX is reinforced due to the acceleration of rotation and coalescence of sub-grains. The main reason of ductility decrease at high temperature and low strain rate is the grain coarsening and the deformation discordance between small new DRX grains and coarse grains.
(3)
The stress exponent and the deformation activation energy are 5.9 and 355 kJ·mol−1 respectively. The dominant deformation mechanism is the dislocations motion controlled by climb.

Author Contributions

Y.H. conceived and designed the experiments; J.S. (Jiaqi Sun) performed the experiments; Y.H. and Y.S. analyzed the data; J.S. (Jiapeng Sun) contributed analysis tools; Y.H. and X.R. wrote the paper. All authors have read and agreed to the published version of the manuscript.

Funding

This research received no external funding. This work is supported by the National Natural Science Foundation of China (No. 51604034 and 51974032) and the Science and Technology Development Program of Jilin Province (No. 20190302003GX).

Conflicts of Interest

The authors declare no conflict of interest. The founding sponsors had no role in the design of the study; in the collection, analyses, or interpretation of data; in the writing of the manuscript, and in the decision to publish the results.

References

  1. Fu, J.; Li, F.; Sun, J.; Wu, Y. Texture, orientation, and mechanical properties of Ti-stabilized Fe-17Cr ferritic stainless steel. Mater. Sci. Eng. A 2018, 738, 335–343. [Google Scholar] [CrossRef]
  2. Han, J.; Li, H.; Zhu, Z.; Jiang, L.; Xu, H.; Ma, L. Effects of processing optimization on microstructure, texture, grain boundary and mechanical properties of Fe-17Cr ferritic stainless steel thick plates. Mater. Sci. Eng. A 2014, 616, 20–28. [Google Scholar] [CrossRef]
  3. Wang, W.; Han, P.; Peng, P.; Zhang, T.; Liu, Q.; Yuan, S.-N.; Huang, L.-Y.; Yu, H.-L.; Qiao, K.; Wang, K.-S. Friction Stir Processing of Magnesium Alloys: A Review. Acta Met. Sin. Engl. Lett. 2019, 32, 1–15. [Google Scholar] [CrossRef] [Green Version]
  4. Wang, W.; Han, P.; Yuan, J.; Peng, P.; Liu, Q.; Qiang, F.; Qiao, K.; Wang, K.-S. Enhanced Mechanical Properties of Pure Zirconium via Friction Stir Processing. Acta Met. Sin. Engl. Lett. 2019, 32, 1–7. [Google Scholar] [CrossRef] [Green Version]
  5. Hu, W.Q.; Dong, Z.; Yu, L.M.; Ma, Z.Q.; Liu, Y.C. Synthesis of W-Y2O3 alloys by freeze-drying and subsequent low temperature sintering: Microstructure refinement and second phase particles regulation. J. Mater. Res. Technol. 2020, 36, 84–90. [Google Scholar] [CrossRef]
  6. Chiu, Y.-T.; Lin, C.-K.; Wu, J.-C. High-temperation tensile and creep properties of a ferritic stainless steel for interconnect in solid oxide fuel cell. J. Power Sources 2011, 196, 2005–2012. [Google Scholar] [CrossRef]
  7. Gurram, M.; Adepu, K.; Pinninti, R.R.; Gankidi, M.R. Effect of copper and aluminium addition on mechanical properties and corrosion behaviour of AISI 430 ferritic stainless steel gas tungsten arc welds. J. Mater. Res. Technol. 2013, 2, 238–249. [Google Scholar] [CrossRef] [Green Version]
  8. Zhang, C.; Liu, Z.; Xu, Y.; Wang, G. The sticking behavior of an ultra purified ferritic stainless steel during hot strip rolling. J. Mater. Process. Technol. 2012, 212, 2183–2192. [Google Scholar] [CrossRef]
  9. Fujita, N.; Ohmura, K.; Kikuchi, M.; Suzuki, T.; Funaki, S.; Hiroshige, I. Effect of niobium on high-temperature properties for ferritic stainless steel. Scr. Mater. 1996, 35, 705–710. [Google Scholar] [CrossRef]
  10. Sim, G.M.; Ahn, J.C.; Hong, S.C.; Lee, K.J.; Lee, K.S. Effect of Nb precipitate coarsening on the high temperature strength in Nb containing ferritic stainless steels. Mater. Sci. Eng. A 2005, 396, 159–165. [Google Scholar] [CrossRef]
  11. Han, J.; Li, H.; Xu, H. Microalloying effects on microstructure and mechanical properties of 18Cr–2Mo ferritic stainless steel heavy plates. Mater. Des. 2014, 58, 518–526. [Google Scholar] [CrossRef]
  12. Chiu, Y.-T.; Lin, C.-K. Effects of Nb and W additions on high-temperature creep properties of ferritic stainless steels for solid oxide fuel cell interconnect. J. Power Sources 2012, 198, 149–157. [Google Scholar] [CrossRef]
  13. Wei, L.; Zheng, J.; Chen, L.; Misra, R.D.K. High temperature oxidation behavior of ferritic stainless steel containing W and Ce. Corros. Sci. 2018, 142, 79–92. [Google Scholar] [CrossRef]
  14. DeMeyer, M.; Vanderschueren, D.; DeCoon, B.C. The influence of the substitutionof Si by Al on the properties of cold rolled C–Mn–Si TRIP steels. ISIJ Int. 1999, 39, 813–822. [Google Scholar]
  15. Hojo, T.; Sugimoto, K.-I.; Mukai, Y.; Ikeda, S. Effects of Aluminum on Delayed Fracture Properties of Ultra High Strength Low Alloy TRIP-aided Steels. ISIJ Int. 2008, 48, 824–829. [Google Scholar] [CrossRef] [Green Version]
  16. Qian, L.; Zhou, Q.; Zhang, F.; Meng, J.; Zhang, M.; Tian, Y. Microstructure and mechanical properties of a low carbon carbide-free bainitic steel co-alloyed with Al and Si. Mater. Des. 2012, 39, 264–268. [Google Scholar] [CrossRef]
  17. Chen, S.; Rana, R.; Haldar, A.; Ray, R.K. Current state of Fe-Mn-Al-C low density steels. Prog. Mater. Sci. 2017, 89, 345–391. [Google Scholar] [CrossRef]
  18. Wu, Z.; Tang, Y.; Chen, W.; Lu, L.; Li, E.; Li, Z.; Ding, H. Exploring the influence of Al content on the hot deformation behavior of Fe-Mn-Al-C steels through 3D processing map. Vacuum 2019, 159, 447–455. [Google Scholar] [CrossRef] [Green Version]
  19. Xu, S.; Zhou, Z.; Long, F.; Jia, H.; Guo, N.; Yao, Z.; Daymond, M.R. Combination of back stress strengthening and Orowan strengthening in bimodal structured Fe–9Cr–Al ODS steel with high Al addition. Mater. Sci. Eng. A 2019, 739, 45–52. [Google Scholar] [CrossRef]
  20. Ota, H.; Nakamura, T.; Maruyama, K. Effect of solute atoms on thermal fatigue properties in ferritic stainless steels. Mater. Sci. Eng. A 2013, 586, 133–141. [Google Scholar] [CrossRef]
  21. Zou, D.; Zhou, Y.; Zhang, X.; Zhang, W.; Han, Y. High temperature oxidation behavior of a high Al-containing ferritic heat-resistant stainless steel. Mater. Charact. 2018, 136, 435–443. [Google Scholar] [CrossRef]
  22. Sastry, S.D.; Rohatgi, P.K.; Abraham, K.P.; Prasad, Y.V.R.K. Influence of heat treatment on the strength and fracture behavior of Fe-12Cr-6Al ferritic stainless steel. J. Mater. Sci. 1982, 17, 3009–3016. [Google Scholar] [CrossRef]
  23. Zhang, X.; Fan, L.; Xu, Y.; Li, J.; Xiao, X.; Jiang, L. Texture, microstructure and mechanical properties of aluminum modified ultra-pure 429 ferritic stainless steels. Mater. Des. 2016, 89, 626–635. [Google Scholar] [CrossRef]
  24. Gao, F.; Liu, Z.Y.; Misra, R.D.K.; Liu, H.T.; Yu, F.X. Constitutive modeling and dynamic softening mechanism during hotdeformation of an ultra-pure 17%Cr ferritic stainless steel stabilized with Nb. Met. Mater. Int. 2014, 20, 939–951. [Google Scholar] [CrossRef]
  25. Gao, F.; Song, B.; Xu, Y.; Xia, K. Substructural changes during hot deformation of an Fe-26Cr ferritic stainless steel. Met. Mater. Trans. A 2000, 31, 21–27. [Google Scholar] [CrossRef]
  26. Kim, S.-L.; Yoo, Y.-C. Continuous dynamic recrystallization of AISI 430 ferritic stainless steel. Met. Mater. Int. 2002, 8, 7–13. [Google Scholar] [CrossRef]
  27. Chauhan, A.; Litvinov, D.; Aktaa, J. High temperature tensile properties and fracture characteristics of bimodal 12Cr-ODS steel. J. Nucl. Mater. 2016, 468, 1–8. [Google Scholar] [CrossRef]
  28. Pan, L.; Zheng, L.; Han, W.; Zhou, L.; Hu, Z.; Zhang, H. High-temperature tensile properties of a NiTi–Al-based alloy prepared by directional solidification and homogenizing treatment. Mater. Des. 2012, 39, 192–199. [Google Scholar] [CrossRef]
  29. Liu, Y.; Ning, Y.; Nan, Y.; Liang, H.; Li, Y.; Zhao, Z.; Yao, Z.; Guo, H. Characterization of hot deformation behavior and processing map of FGH4096–GH4133B dual alloys. J. Alloy. Compd. 2015, 633, 505–515. [Google Scholar] [CrossRef]
  30. Jiang, Z.H.; Han, J.P.; Li, Y.; He, P. High temperature ductility and corrosion resistance property of novel tin-bearing economic 17Cr-xSn ferritic stainless steel. Ironmak Steelmak 2015, 42, 504–511. [Google Scholar] [CrossRef]
  31. Belyakov, A.; Sakai, T.; Kaibyshev, R. New grain formation during warm deformation of ferritic stainless steel. Met. Mater. Trans. A 1998, 29, 161–167. [Google Scholar] [CrossRef]
  32. Mehtonen, S.; Palmiere, E.; Misra, R.; Karjalainen, L.; Porter, D. Dynamic restoration mechanisms in a Ti–Nb stabilized ferritic stainless steel during hot deformation. Mater. Sci. Eng. A 2014, 601, 7–19. [Google Scholar] [CrossRef]
  33. Ebied, S.; Hamada, A.; Borek, W.; Gepreel, M.; Chiba, A. High-temperature deformation behavior and microstructural characterization of high-Mn bearing titanium-based alloy. Mater. Charact. 2018, 139, 176–185. [Google Scholar] [CrossRef]
  34. Xie, B.; Zhang, B.; Ning, Y.; Fu, M. Mechanisms of DRX nucleation with grain boundary bulging and subgrain rotation during the hot working of nickel-based superalloys with columnar grains. J. Alloy. Compd. 2019, 786, 636–647. [Google Scholar] [CrossRef]
  35. Han, Y.; Liu, G.W.; Zou, D.N.; Liu, R.; Qiao, G.J. Deformation behavior and microstructural evolution of as-cast 904L austenitic stainless steel under hot compression. Mater. Sci. Eng. A 2013, 565, 342–350. [Google Scholar] [CrossRef]
  36. Xiao, W.; Wang, B.; Wu, Y.; Yang, X. Constitutive modeling of flow behavior and microstructure evolution of AA7075 in hot tensile deformation. Mater. Sci. Eng. A 2018, 712, 704–713. [Google Scholar] [CrossRef]
  37. Lin, Y.; Jiang, X.-Y.; Shuai, C.-J.; Zhao, C.-Y.; He, D.-G.; Chen, M.-S.; Chen, C. Effects of initial microstructures on hot tensile deformation behaviors and fracture characteristics of Ti-6Al-4V alloy. Mater. Sci. Eng. A 2018, 711, 293–302. [Google Scholar] [CrossRef]
  38. Liu, Z.; Li, P.; Xiong, L.; Liu, T.; He, L. High-temperature tensile deformation behavior and microstructure evolution of Ti55 titanium alloy. Mater. Sci. Eng. A 2017, 680, 259–269. [Google Scholar] [CrossRef]
  39. Mandal, S.; Bhaduri, A.K.; Sarma, V.S. A study on microstructural evolution and dynamic recrystallization during isothermal deformation of a Ti-modified austenitic stainless steel. Metall. Mater. Trans. A 2010, 42, 1062–1072. [Google Scholar] [CrossRef]
  40. Alsagabi, S.; Shrestha, T.; Charit, I. High temperature tensile deformation behavior of Grade 92 steel. J. Nucl. Mater. 2014, 453, 151–157. [Google Scholar] [CrossRef]
  41. Lin, Y.C.; Huang, J.; Li, H.-B.; Chen, D.-D. Phase transformation and constitutive models of a hot compressed TC18 titanium alloy in the α+β regime. Vacuum 2018, 157, 83–91. [Google Scholar] [CrossRef]
  42. Shrestha, T.; Basirat, M.; Charit, I.; Potirniche, G.P.; Rink, K.K.; Sahaym, U. Creep deformation mechanisms in modified 9Cr–1Mo steel. J. Nucl. Mater. 2012, 423, 110–119. [Google Scholar] [CrossRef]
  43. Shewmon, P. Diffusion in Solids, 2nd ed.; TMS: Warrendale, PA, USA, 1989. [Google Scholar]
  44. Gao, F.; Liu, Z.-Y.; Wang, G.-D. Hot deformation behavior of high-purified 17%Cr ferritic stainless steel. J. Northeast Univ. 2011, 32, 1406–1409. [Google Scholar]
  45. Mehtonen, S.; Karjalainen, L.; Porter, D. Hot deformation behavior and microstructure evolution of a stabilized high-Cr ferritic stainless steel. Mater. Sci. Eng. A 2013, 571, 1–12. [Google Scholar] [CrossRef]
  46. Gao, F.; Yu, F.-X.; Liu, H.-T.; Liu, Z.-Y.; Liu, F.-T. Hot Deformation Behavior and Flow Stress Prediction of Ultra Purified 17% Cr Ferritic Stainless Steel Stabilized with Nb and Ti. J. Iron Steel Res. Int. 2015, 22, 827–836. [Google Scholar] [CrossRef]
Figure 1. (a) Optical microstructure of the annealed 0Cr18AlSi steel and (b) corresponding X-ray diffraction pattern.
Metals 10 00086 g001
Figure 2. Tensile engineering stress–strain curves of the 0Cr18AlSi steel tested at various temperatures with strain rates of (a) 1.7 × 10⁻² s−1; (b) 1.7 × 10⁻³ s−1; and (c) 1.7 × 10⁻⁴ s−1.
Metals 10 00086 g002
Figure 3. Tensile properties of the 0Cr18AlSi steel tested at different conditions: (a) yield strength, YS; (b) ultimate tensile strength (UTS); (c) elongation to fracture (EL); (d) uniform elongation (UE); (e) reduction of area (RA).
Metals 10 00086 g003
Figure 4. SEM fractographs of the 0Cr18AlSi steel tested at different conditions: (a) 973 K and 1.7 × 10⁻² s−1; (b) 1023 K and 1.7 × 10⁻² s−1; (c) 1123 K and 1.7 × 10⁻² s−1; (d) 873 K and 1.7 × 10⁻⁴ s−1; (e) 973 K and 1.7 × 10⁻⁴ s−1; (f) 1073 K and 1.7 × 10⁻⁴ s−1. The insets indicated the fracture surfaces at low magnifications.
Metals 10 00086 g004
Figure 5. Cross-sectional microstructures of the fracture tips of the specimens after tensile tests at different conditions: (a) 873 K and 1.7 × 10⁻⁴ s−1; (b) 1023 K and 1.7 × 10⁻⁴ s−1; (c) 1123 K and 1.7 × 10⁻⁴ s−1; (d) 1123 K and 1.7 × 10⁻² s−1.
Metals 10 00086 g005
Figure 6. Inverse pole figure (IPF)-coloring orientation map for the 0Cr18AlSi steel tested under different deformation conditions: (a) 1.7 × 10⁻⁴ s−1 and 873 K; (b) 1.7 × 10⁻⁴ s−1 and 1023 K; (c) 1.7 × 10⁻⁴ s−1 and 1123 K; (d) 1.7 × 10⁻² s−1 and 1123 K.
Metals 10 00086 g006
Figure 7. Misorientation profiles obtained along the lines marked in Figure 6a. (a) L1; (b) L2.
Metals 10 00086 g007
Figure 8. Misorientation profiles obtained along the lines marked in Figure 6b. (a) L3; (b) L4.
Metals 10 00086 g008
Figure 9. Misorientation profiles obtained along the lines marked in Figure 6c. (a) L5; (b) L6.
Metals 10 00086 g009
Figure 10. The distribution of grain boundary for the 0Cr18AlSi steel tested under different deformation conditions: (a) and (b) 1.7 × 10⁻⁴ s−1 and 873 K; (c) and (d) 1.7 × 10⁻⁴ s−1 and 1023 K; (e) and (f) 1.7 × 10⁻⁴ s−1 and 1123 K; (g) and (h) 1.7 × 10⁻² s−1 and 1123 K. Green lines correspond to boundaries with low misorientation 2° < θ < 15°, and black lines θ > 15° represent high-angle boundaries.
Metals 10 00086 g010
Figure 11. Kernel average misorientation (KAM) maps for the 0Cr18AlSi steel tested under different deformation conditions: (a) 1.7 × 10⁻⁴ s−1 and 873 K; (b) 1.7 × 10⁻⁴ s−1 and 1023 K; (c) 1.7 × 10⁻⁴ s−1 and 1123 K; (d) 1.7 × 10⁻² s−1 and 1123 K.
Metals 10 00086 g011
Figure 12. Plots of lnσ– ln ε ˙ (a) and lnσ–1/T (b) for the 0Cr18AlSi steel.
Metals 10 00086 g012

