Article

Hot Deformation Characteristics of 18Cr-5Ni-4Cu-N Stainless Steel Using Constitutive Equation and Processing Map

1
School of Material Science and Engineering, Inner Mongolia University of Technology, Hohhot 010051, China
2
School of Material and Metallurgy, Inner Mongolia University of Science and Technology, Baotou 014010, China
*
Author to whom correspondence should be addressed.
Metals 2020, 10(1), 82; https://doi.org/10.3390/met10010082
Submission received: 5 November 2019 / Revised: 16 December 2019 / Accepted: 25 December 2019 / Published: 3 January 2020

Abstract

:
The hot deformation of 18Cr-5Ni-4Cu nitrogen-alloyed austenitic stainless steel was tested with a Gleeble-1500D simulator in the temperature range of 1273–1473 K and in the strain rate range of 0.01–10 s−1. The Zener-Hollomon parameter method was used to construct a constitutive equation for high-temperature plastic deformation. The energy dissipation diagram of the material was calculated based on dynamic material modelling (DMM). The microstructural variations were characterized via X-ray diffraction (XRD), field emission scanning electron microscopy (FESEM) with energy dispersive spectroscopy (EDS) and transmission electron microscopy (TEM). The thermodynamic calculation results showed that the addition of nitrogen to 18Cr-5Ni-4Cu steel promoted the formation of Cr2N and gas phases and expanded the austenite phase region; these results were consistent with the XRD test results of the solid solution sample. The hot deformation activation energy after nitrogen addition was 556.46 kJ∙mol−1. The processing map predicted that the optimum hot working regimes were in the temperature range of 1416–1461 K, where ln ε ˙ was 0.75–1 on the power dissipation map. At high temperatures and a small strain rate, dynamic recrystallization easily occurred. The TEM analyses showed that nano-scale M23C6 and Cr2N precipitated at the grain boundary, and NbC with a diameter of approximately 150 nm appeared along the grain boundary, resulting in grain boundary strengthening. The phase precipitation results were consistent with the Thermo-Calc calculation results. The nitrogen solid solution in the steel promoted the precipitation of nitrides, which caused grain boundary strengthening. Thus, the grain boundary stress increased and wedge-shaped grain boundary cracks formed.

1. Introduction

Many objects, including medical materials and kitchenware, are often composed of Cr-Ni-Cu-N austenitic stainless steel because of its non-magnetic and corrosion-resistant properties and its low nickel content.
In recent years, research on Cu-bearing nitrogen alloy steel has mainly focused on the solid solution strengthening of nitrogen, the nano-precipitation strengthening of Cu and the antibacterial effect of Cu. Tan et al. [1] studied the precipitation characteristics of the Cu-rich phase and its effect on the strengthening mechanism of Super 304H steel with 2.2 wt.%, 4 wt.% and 5 wt.% Cu content during 2000 h of ageing. Yang et al. [2] conducted antibacterial tests on 2.5 wt.%, 3.5 wt.% and 4.5 wt.% Cu-bearing stainless steel. San et al. [3] studied the effect of solid solution and dissolution of the Cu-rich phase in Super 304 H austenitic stainless steel on the corresponding corrosion behaviour of the material. Prabha et al. [4] studied the stress corrosion cracking performance of a Super304 H stainless steel supercritical boiler containing 3 wt.% Cu and found that the crack width in the steel increased as the strain level increased. Hattestrand et al. [5] performed three-dimensional atom probe (3-DAP) analyses and found that the formation of Cu clusters in aged steel promoted the early precipitation of nickel-rich precipitates. Sen et al. [6] found that Cu segregation and precipitation at the grain boundaries promoted grain boundary embrittlement during the solution treatment of copper-containing steel. Cheng et al. [7] performed tests on the creep properties of Super 304 H steel and found that a Cu content between 3.5 and 4 wt.% produced the best results.
Many previous studies have focused on the effect of nitride precipitation. The nitrogen content in the materials used in the works referenced above was generally from 0.1 to 0.15 wt.%. The excellent properties of these materials were attributed to the high content of various alloying elements, such as Cr, Ni, Mo, N and Cu; however, the hot deformation of these materials could be difficult. Few studies have focused on the high-temperature workability and microstructure of high-nitrogen steel with a Cu content of 4–5 wt.% Cu and a N content of 0.4 wt.%. At present, thermal processing research mainly adopts processing maps based on dynamic material modelling (DMM) [8,9]. For example, Lin et al. [10] studied the hot deformation mechanism of work hardening and dynamic softening caused by dislocations; they also investigated the occurrence of dislocations in metals during thermal deformation. Tan et al. [11] studied the thermal processing map of Super 304 H steel based on the dynamic material model theory and the Prasad instability criterion in hot compression experiments. Taylor et al. [12] studied the influence of Zener-Hollomon (Z) parameters on the shape of the deformation flow curve of 304 stainless steel and the relationship between Z parameters and dynamic recrystallization. Murty et al. [13] used the flow stress data of AISI 304 stainless steel to propose simple unstable conditions for verifying large plastic flow. The thermal processing chart describes the regional hot compression test of unstable metal flow during hot deformation and produces optimum parameters for hot deformation based on DMM. The processed drawings have been used in a variety of alloys.
In this paper, a Gleebe-1500D simulator was used to study the effect of high N content on the deformation of 18Cr-5Ni-4Cu steel at different strain rates and deformation temperatures based on DMM. A high-temperature flow stress model was established, and a thermal processing map was calculated. The microstructural evolution during hot working was analysed to discuss the thermal processing optimization and microstructure of 18Cr-5Ni-4Cu-N steel.

2. Experimental Procedures
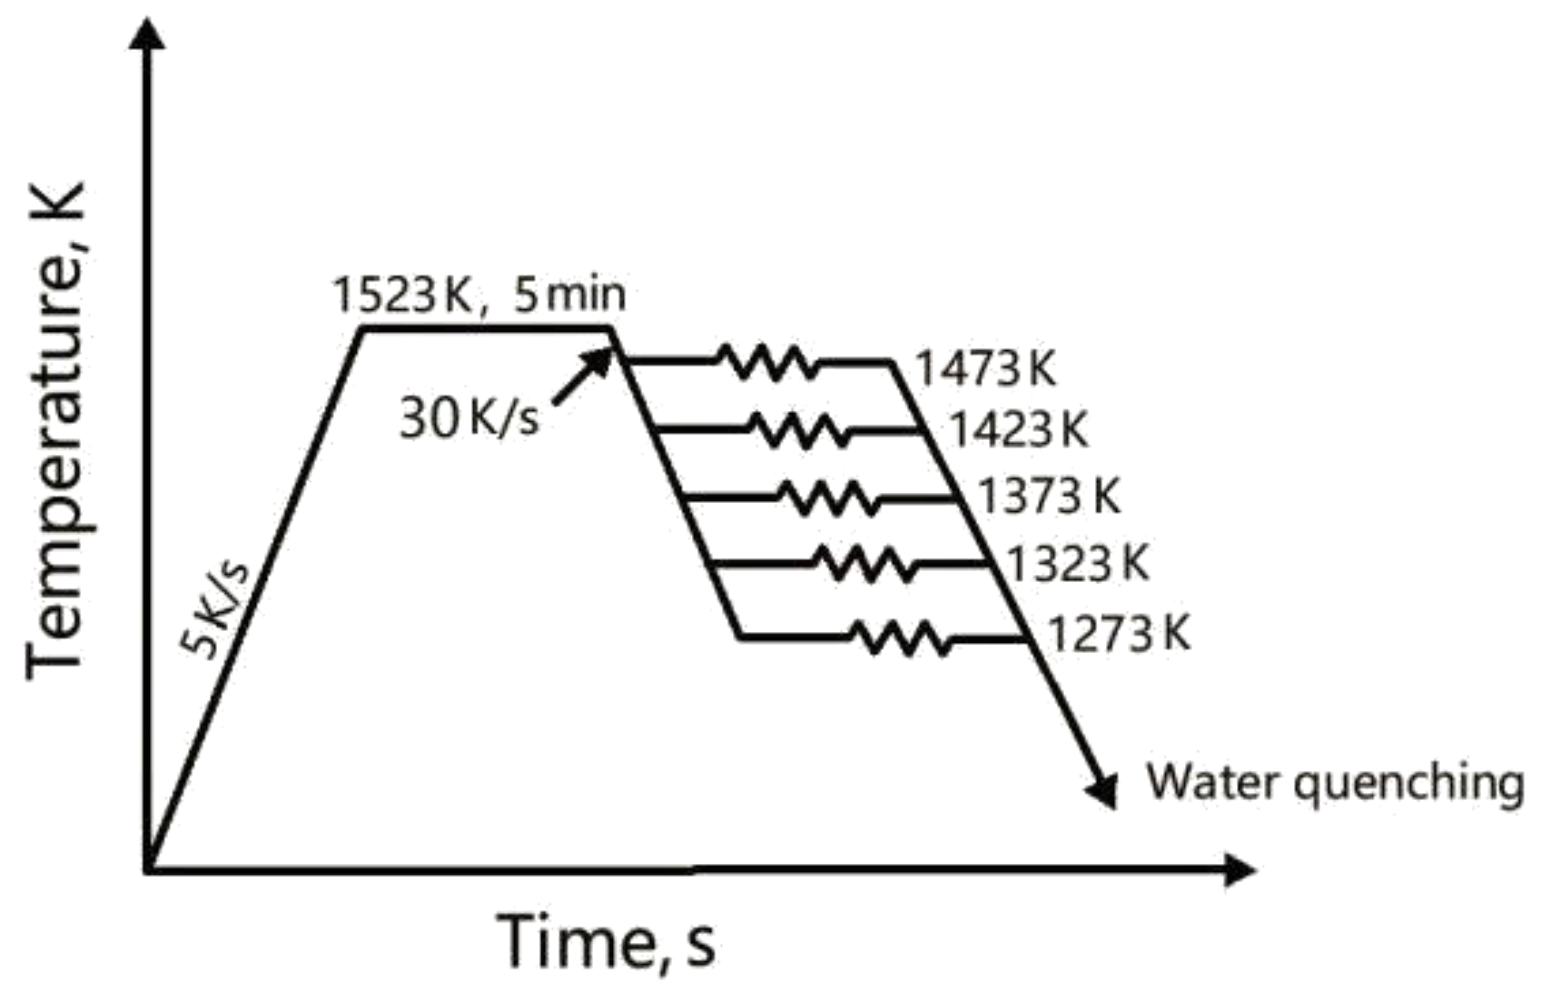
Hot Deformation

First, 10 kg ingots were fabricated via ZG-0.0.1 vacuum induction melting (VIM). The raw materials included industrial pure iron, electrolytic manganese, electrolytic nickel, electrolytic copper, ferromolybdenum and micro-carbon ferrochrome. During smelting, chromium nitride was added to increase the nitrogen content. After smelting, the material was cast into ∅ 80 mm cylindrical ingots.
The ingot was cut into the riser and placed in a muffle furnace to keep the temperature at 1473 K for 120 min; then, the material was rolled into a plate of 30 mm thickness with a two-roll reversing mill, and the finishing temperature was greater than or equal to 1223 K.
A test plate was cut from the rolled steel plate and subjected to solution treatment at 1373 K for 30 min; afterwards, the sample was processed normal to the rolling direction of the steel sheet to form a cylindrical compressed sample with dimensions of ∅ 8 mm × 12 mm. The chemical composition of the alloy examined in this investigation is as follows (wt.%): 0.06 C, 17.63 Cr, 5.55 Ni, 4.13 Cu, 2.0 Mn, 2.11 Mo, 0.86 Si, 0.025 P, 0.02 S, 0.41 N, 0.08 Nb, 0.13 V and Fe balance.
To evaluate the hot working behaviour of the specimen, a single hot compression test was performed with a Gleeble-1500D simulator (DSI, New York, NY, USA). The specimens were subjected to 40% height reduction in temperature ranges of 1273–1473 K (in steps of 50 K) at constant strain rates of 0.001, 0.01, 0.1, 1 and 10 s−1.
The ends of the specimen were insulated with a cymbal sheet and lubricated with graphite sheets to reduce the friction between the indenter and the sample. The temperature was increased to 1523 K at a heating rate of 5 K/s and kept for 5 min to ensure the temperature of the whole sample was uniform; then, the samples was cooled at 30 K/s to a set deformation temperature. The hot deformed specimens were quenched in water within 1–2 s after the deformation to freeze the microstructure. For comparison, a specimen subjected to a 20% height reduction was analysed at a deformation temperature of 1373 K and a strain rate of 1.0.
The compression cycles are shown in Figure 1.
To characterise the change in the microstructure, the quenched specimens were first sliced parallel to the compression axis at the sample centre. Then, these samples were subjected to standard grinding and polishing techniques followed by etching with a solution of 30 mL of HCl and 10 mL of HNO3 for 30–50 s at room temperature. The etched samples subjected to different hot compression deformations were then examined using scanning electron microscopy (SEM) (FEI, QUANTA400, Hillsboro, OR, USA) and energy-dispersive spectroscopy (EDS) to evaluate the initiation, growth and propagation process of cracks under different deformation conditions. The sample microstructures were analysed with an electron backscattered diffraction (EBSD) system attached to a Zeiss Suppra55 field emission scanning electron microscope (ZEISS, Oberkochen, Germany). The EBSD specimens were prepared by mechanical grinding, polishing and subsequent electrolytic polishing in a solution of ethyl alcohol and perchloric acid (15:85, volume fraction) at 20 V for 30 s. The phase composition in the solution treatment state was identified by X-ray diffraction (XRD) (RIGAKU, Tokyo, Japan) with a Cu-Kα characteristic radiation source in the 2θ range of 20–80°. Thin foils were prepared for transmission electron microscopy (TEM). These films were observed with a TEM instrument (JEM2100) (JEOL, Tokyo, Japan) with EDS at 200 KV to investigate the microscopic mechanism responsible for crack formation during hot compression. The equilibrium phase precipitation calculation of the tested steel was carried out in Thermo-Calc 2018b (2018b, Thermo-Calc software, Solna, Sweden) with the TCFE 8.0 iron-based alloy database.

3. Experimental Results and Analysis

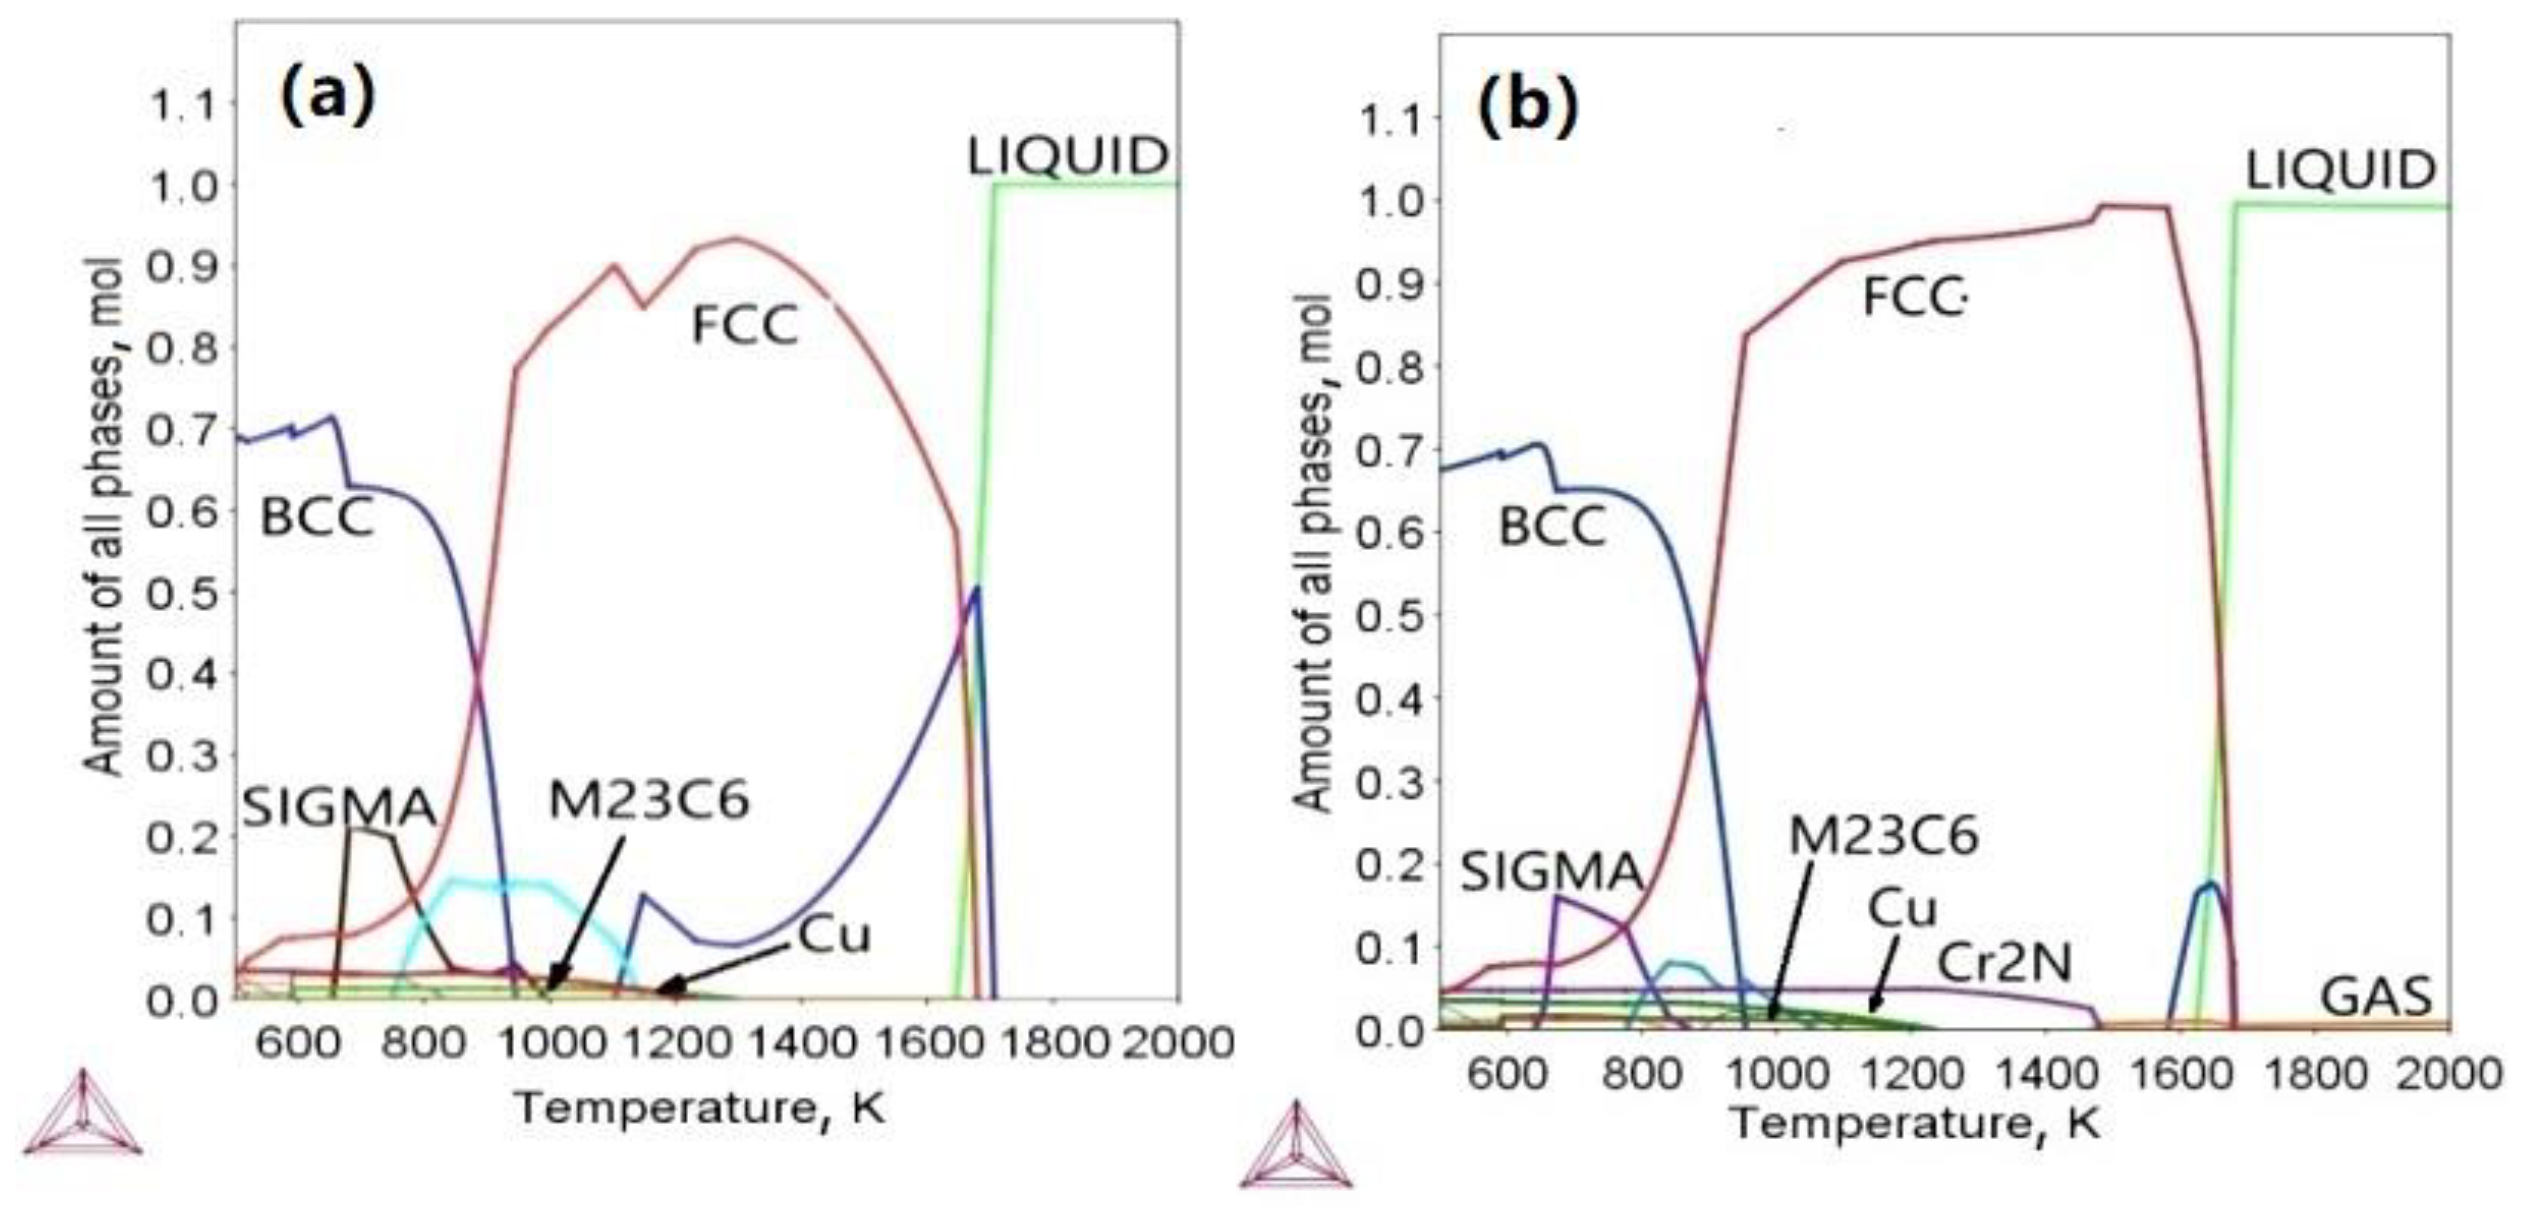
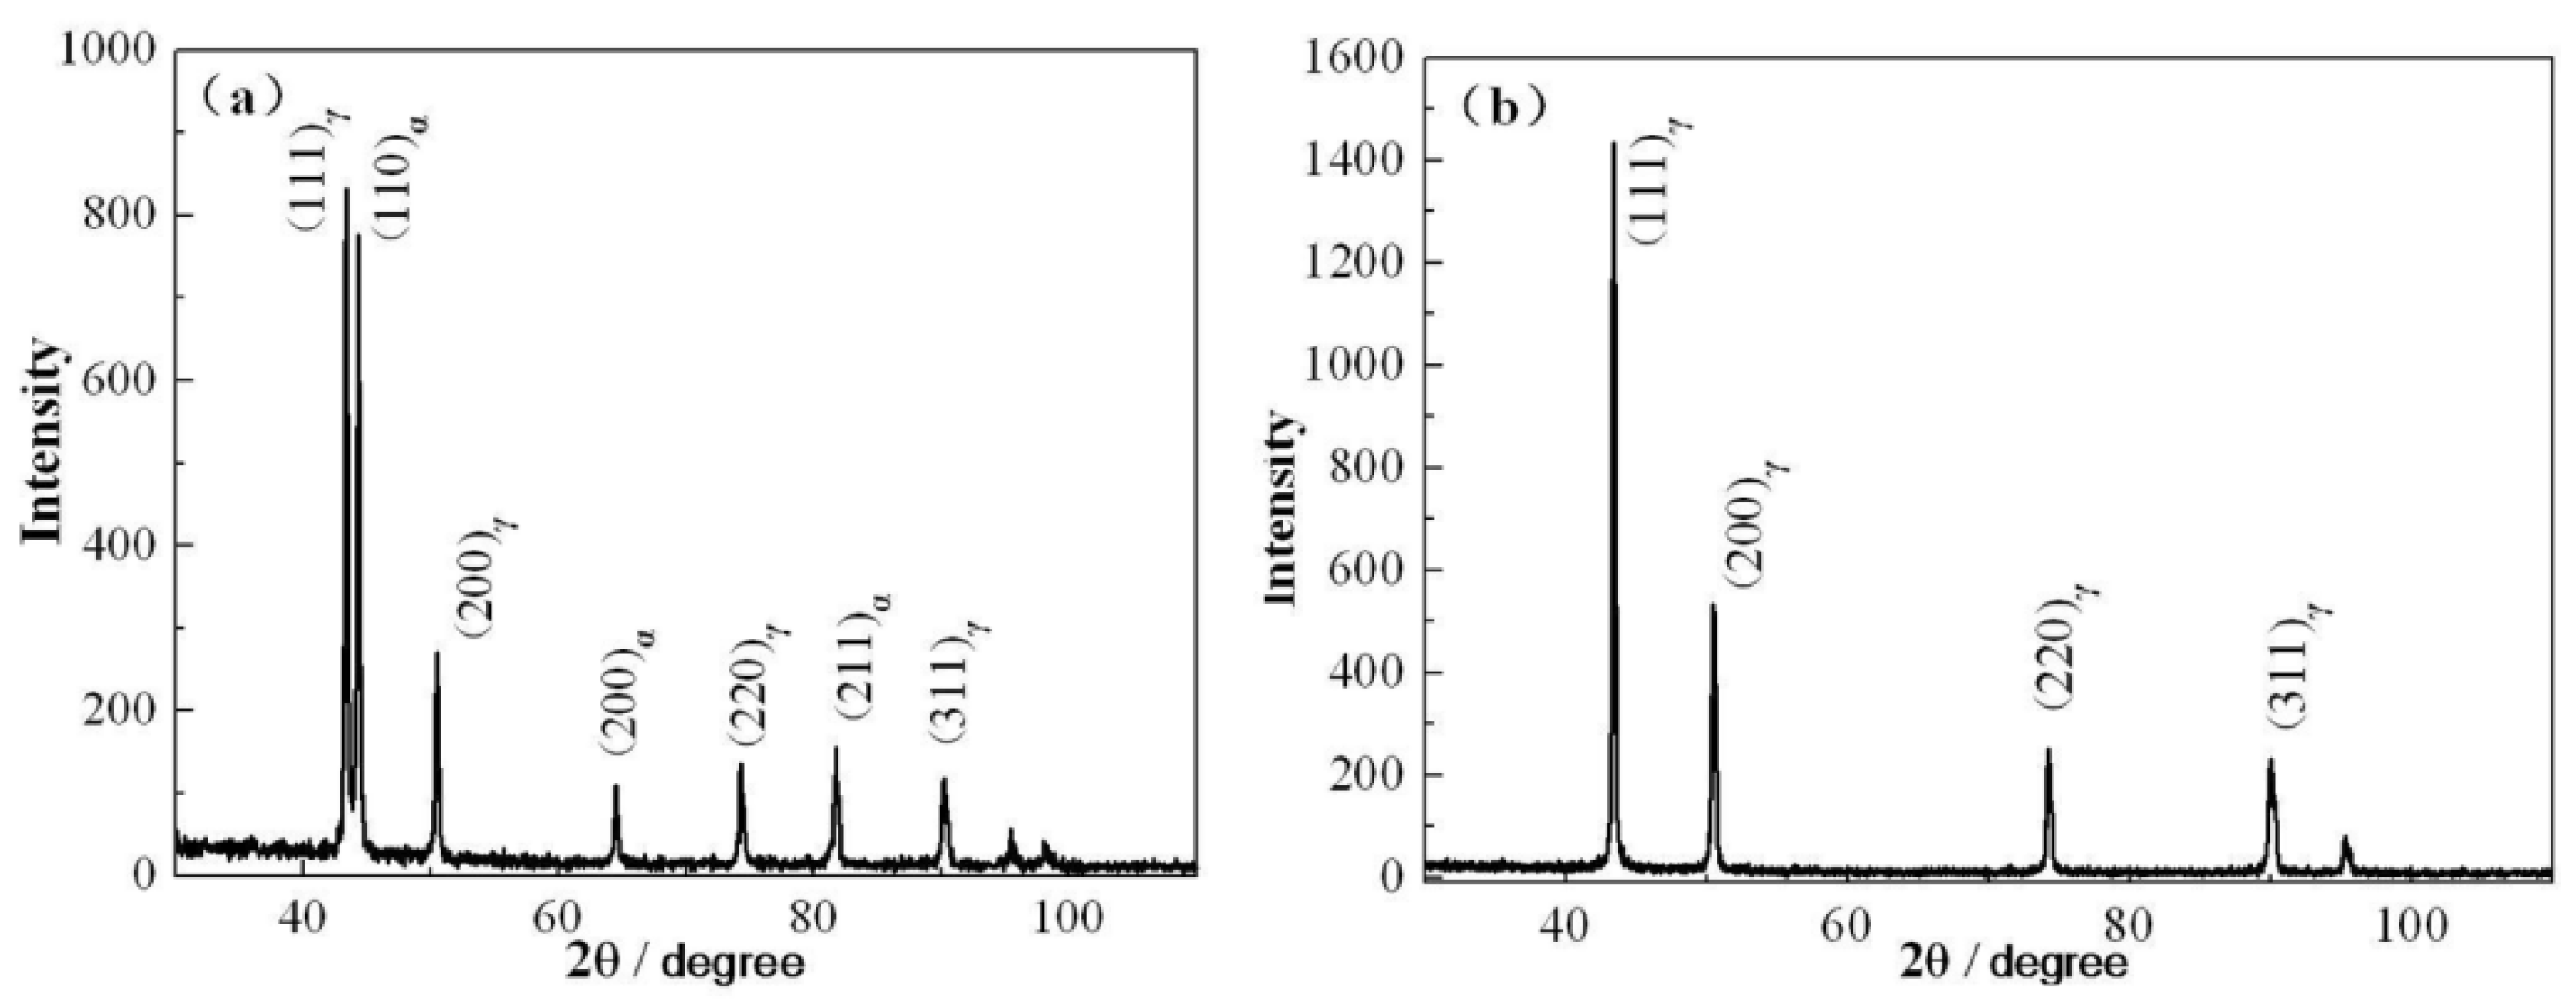
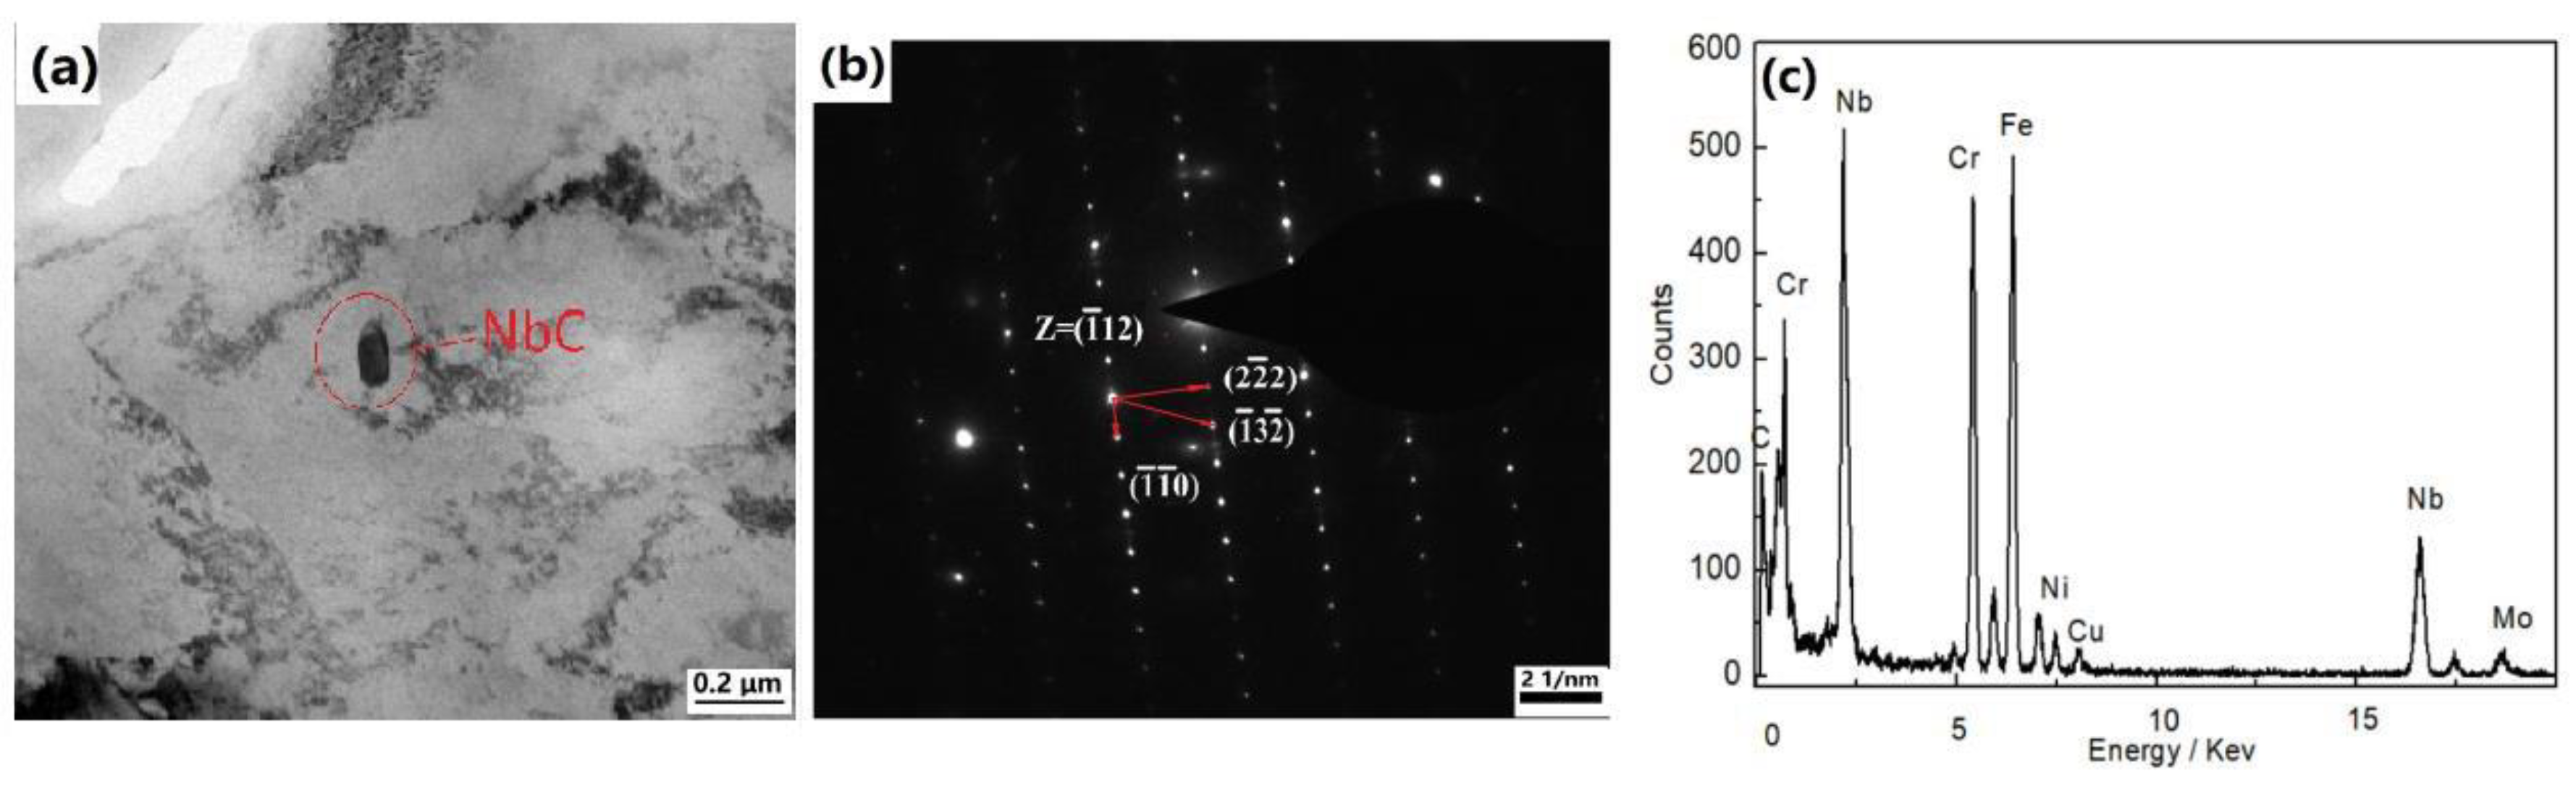
3.1. Thermodynamic Calculation of the Tested Steel and XRD Phase Results

The calculated equilibrium phase diagram of the tested steel without added N indicates the presence of austenite, ferrite, carbide, σ phase and liquid phase, as shown in Figure 2a. After the addition of nitrogen, the tested steel also had Cr2N and gas phases in Figure 2b. The XRD results show that the steel specimen without added N has two phases of austenite and ferrite, as shown in Figure 3a. The nitrogen-added steel specimen was a single austenite phase, indicating that N strongly promotes the formation of the austenite phase and reduces the role of the ferrite phase.

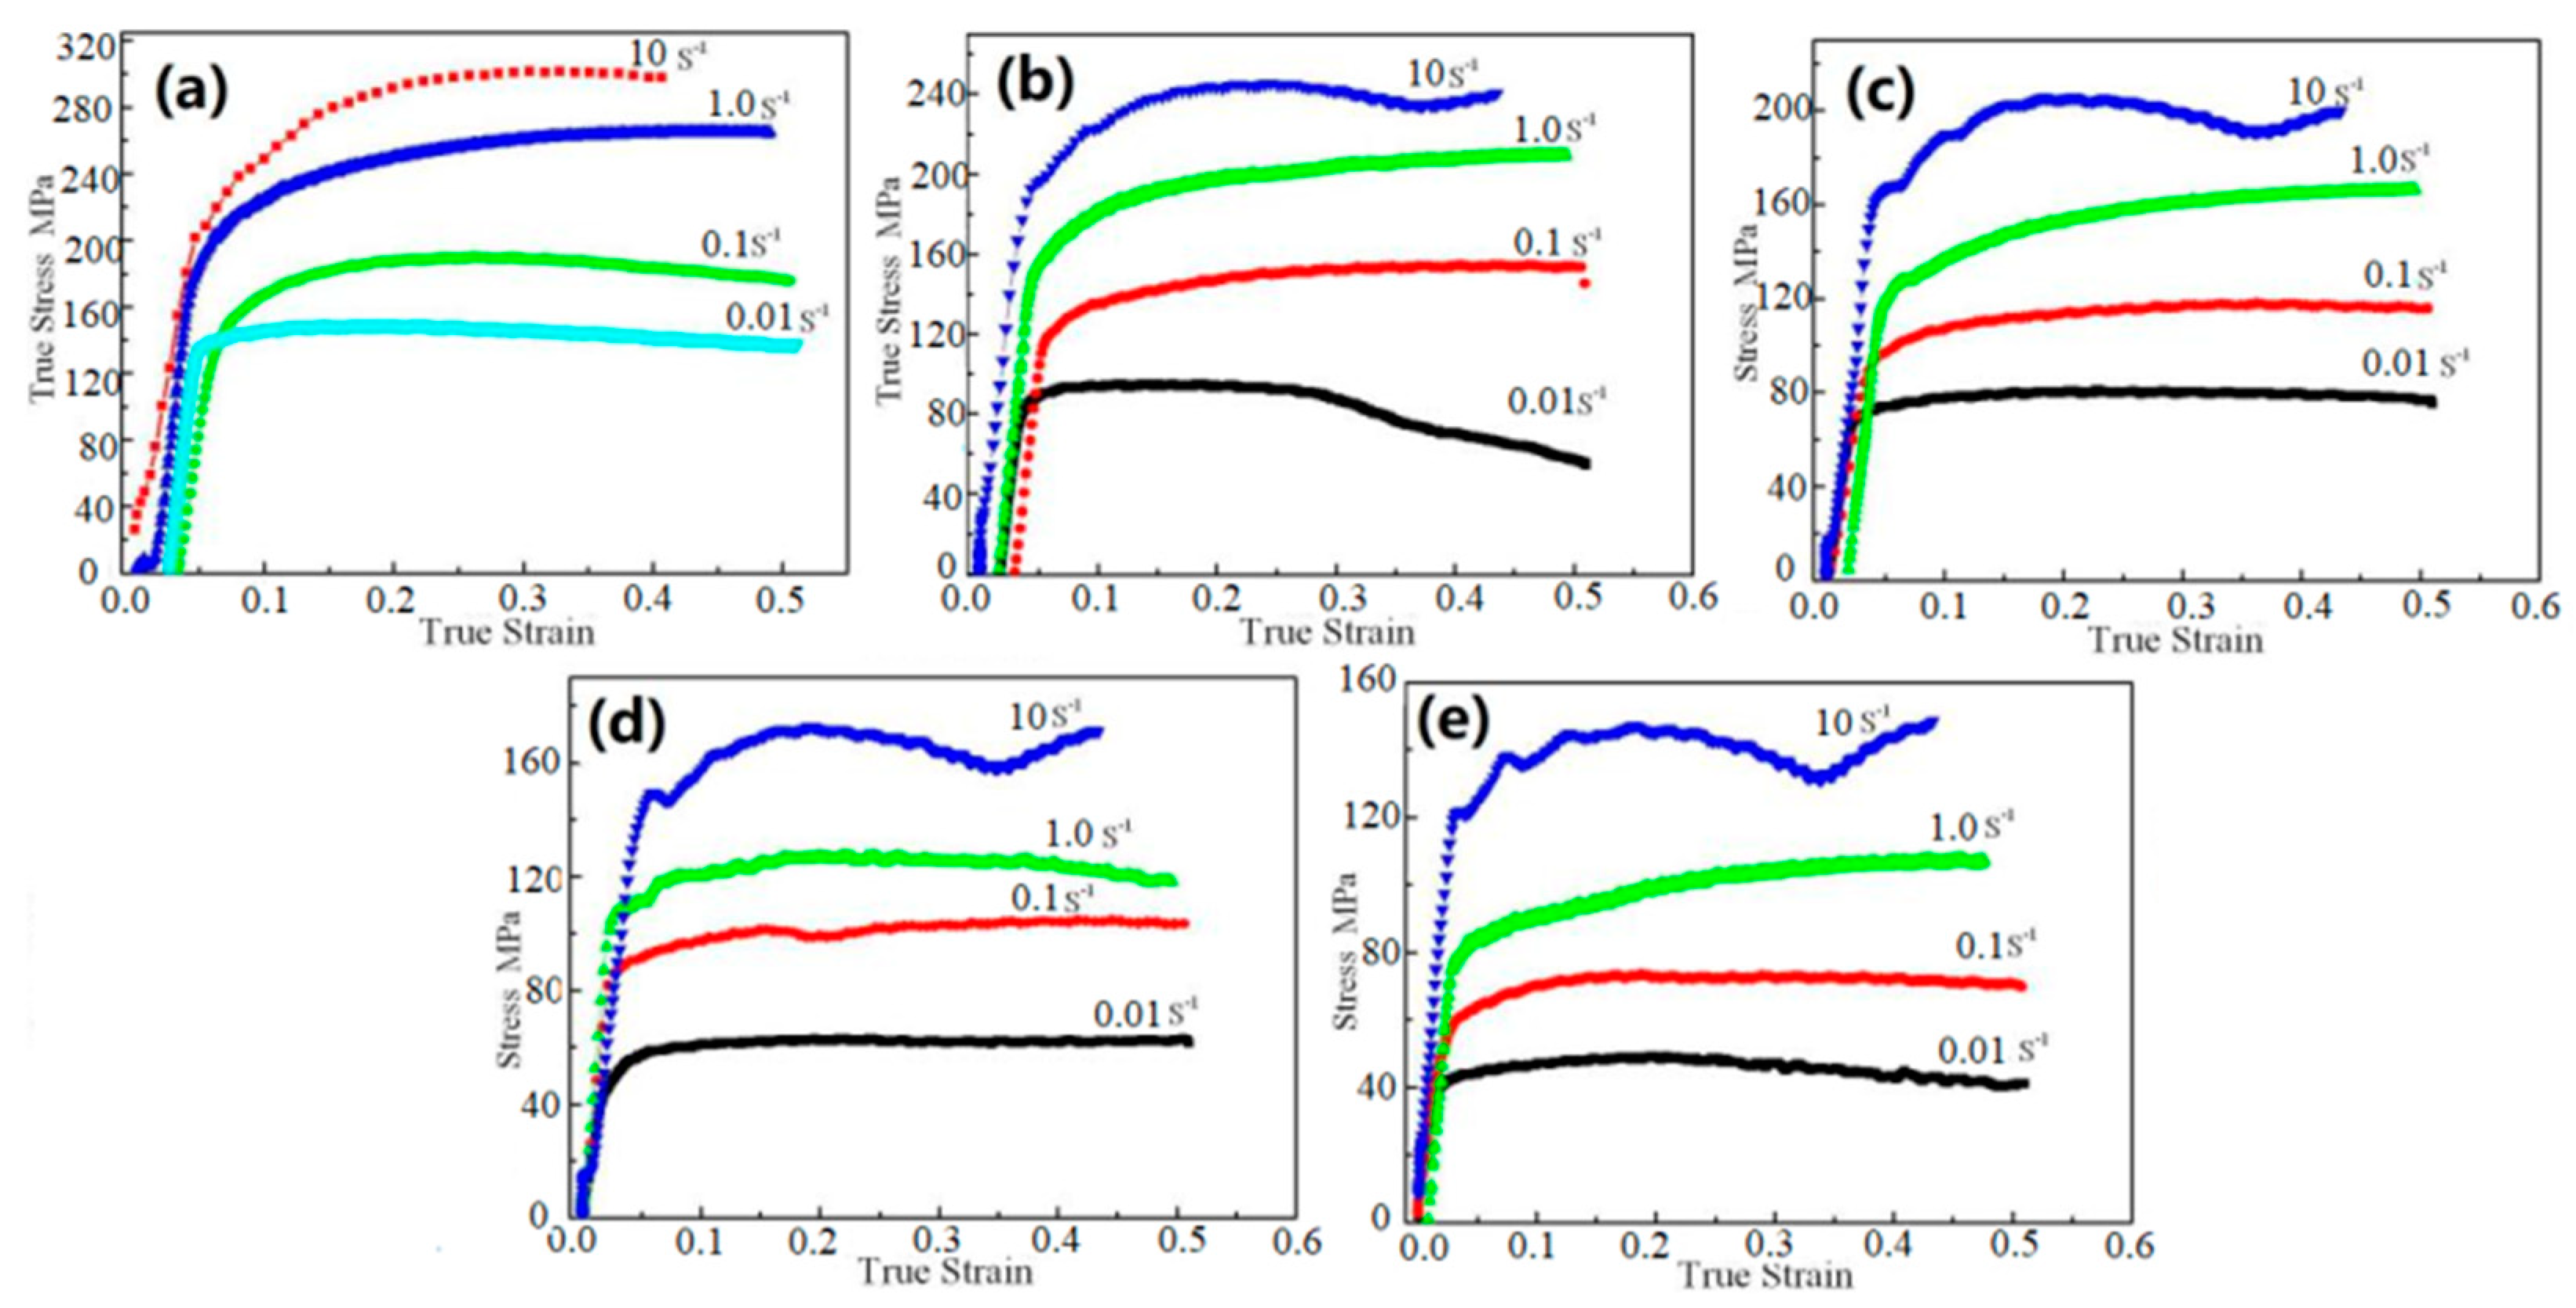
3.2. Flow Stress Model

The true stress–strain data automatically recorded by the Gleeble-1500D simulator (DSI, New York, NY, America) during hot compression are shown in Figure 4.
The strain rate is 10 s−1, the stress–strain curve shows sharp fluctuations, the hot compression process is a dynamic process whether it is dynamic recrystallization or dynamic recovery. Dislocation movement, recombination and accumulation are all hindered by solute atoms and precipitated phases. Especially in high temperature processes, solute atoms are relatively active. When the strain rate increases, because of the increase in deformation energy and the re-dissolution of more solute atomic carbon, the interaction between dislocations and solute atoms facilitates the faster accumulation of dislocations and rapid recrystallization. When dynamic recrystallization occurs, the dislocation density decreases rapidly. At this moment, the ‘softening’ effect is greater than the ‘hardening’ effect caused by the dislocation proliferation caused by continued deformation. However, as the strain increases, the dislocations multiply and the deformation resistance increases. At this time, the curve shown in the Figure 4. will fluctuate slightly and the strain rate is further accelerated, leaving the dislocations to dissolve the solute atoms for a shorter period of time. After a large number of dislocations accumulate, they are released instantaneously through dynamic recrystallization, resulting in a decrease in stress, and sharper stress fluctuations may occur. At the beginning of the stress–strain curve, the stress increases sharply with increasing strain, decreases after reaching the peak value, and finally stabilizes. When the strain rate is less than 1 s−1, the stress–strain curves are a dynamic recovery type, and the stress increases sharply with increasing strain. When the strain reaches a certain value, stress tends to be stabilized.

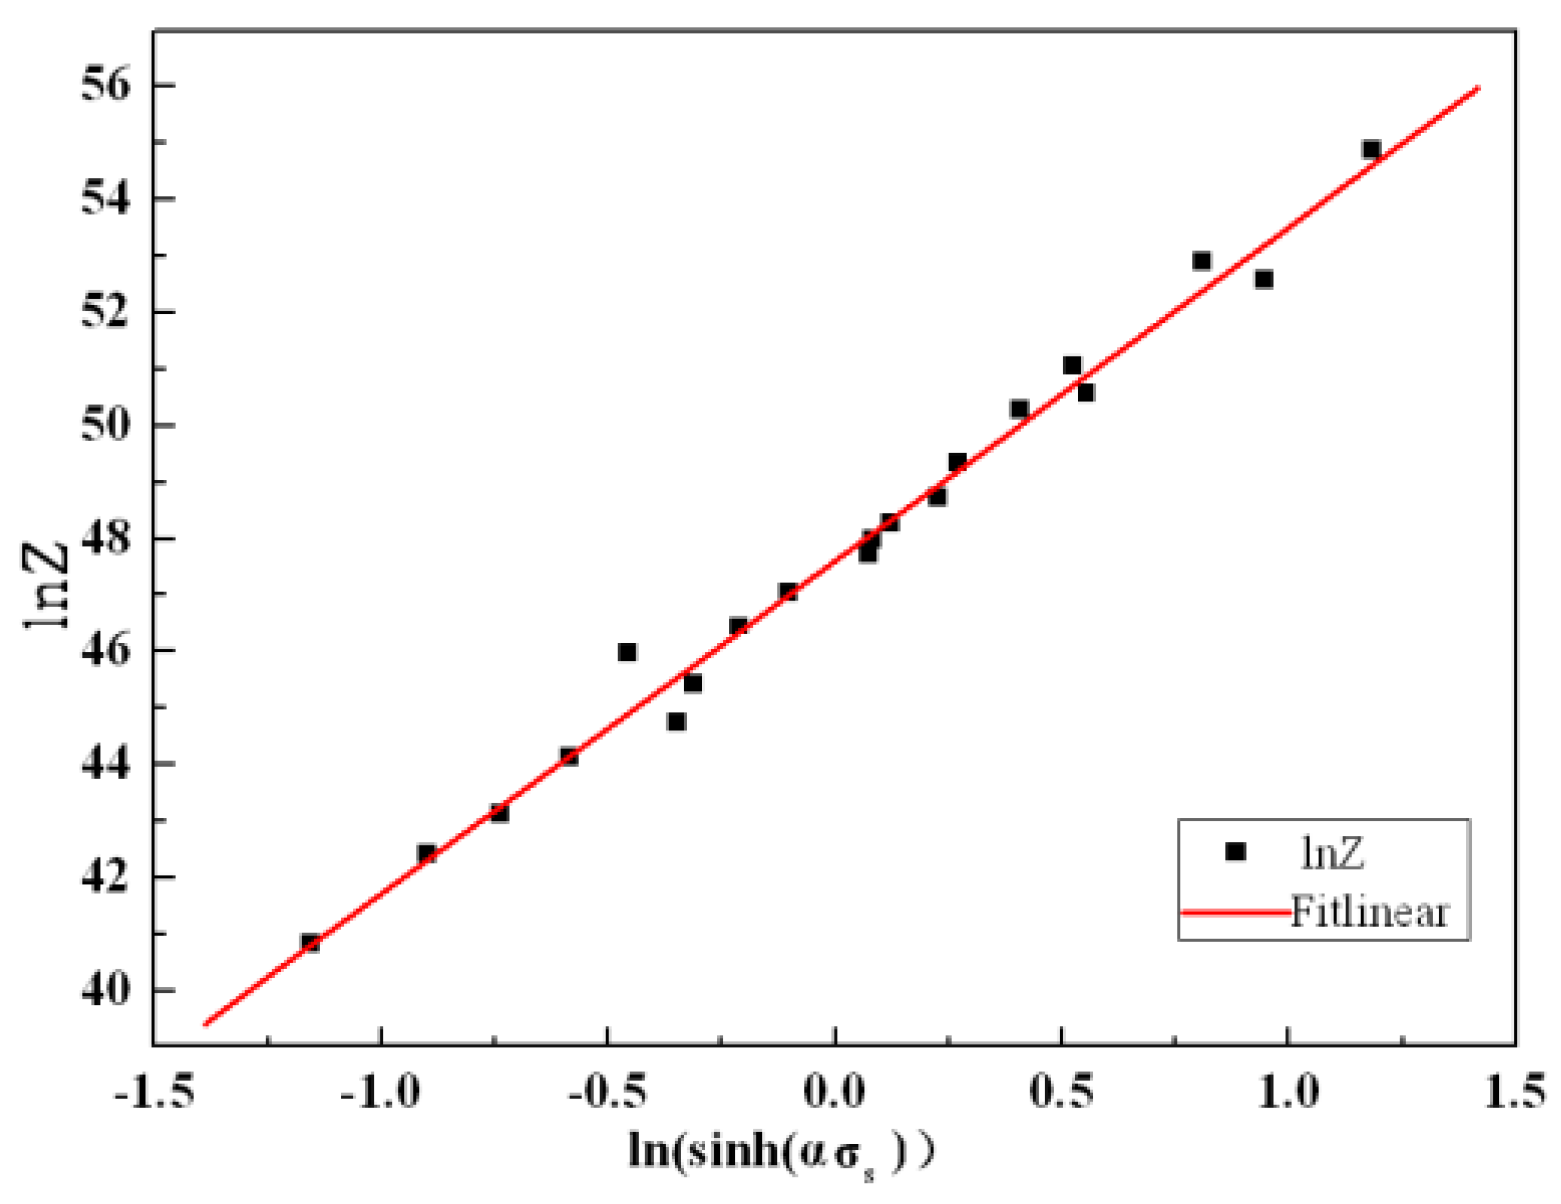
3.3. Flow Stress Model/Kinetic Analysis

The constitutive equation is mainly used to describe the quantitative relationship of the thermodynamic parameters during hot rolling at high temperatures. These thermodynamic parameters include flow stress, deformation temperature, strain rate and strain. For these thermodynamic parameters, the Zener-Hollomon parameter is generally used to define the relationship between strain rate and temperature during thermal deformation. The physical meaning is the temperature-compensated strain efficiency factor. The expression [14] for the Zener-Hollomon parameter is as follows:
Z = ε ˙ exp ( Q / R T )
where Z is the Zener-Hollomon parameter, Q is the deformation activation energy, ε ˙ is the strain rate, R is the gas constant (8.314 J∙mol−1) and T is the deformation temperature.
Sellars and Tegart [15] proposed a hyperbolic sinusoidal function (Equation (3)) to describe the relationship between thermodynamic parameters. Some studies [16,17] also proposed that under relatively low stress (<0.8), Equation (2) can be rewritten as shown in Equation (4), whereas under relatively high stress (>1.2), Equation (2) can be rewritten as shown in Equation (5); thus, Equation (2) can be adapted to various stress states.
ε ˙ = A [ sinh ( α σ ) ] n exp ( Q R T )
Z = ε ˙ exp ( Q / R T ) = A [ sinh ( α σ ) ] n
ε ˙ exp ( Q / R T ) = A 1 σ n 1 ( α σ < 0.8 )
ε ˙ exp ( Q / R T ) = A 2 exp ( β σ ) ( α σ > 1.2 )
where A, A1, A2, β, α, n and n1 are material constants. Among them, β, α and n1 can be calculated from the experimental data [18] under different deformation states:
α = β n 1
Taking the logarithm of Equations (2)–(5) above, the following equation can be obtained:
ln ε ˙ = n ln sinh ( α σ ) + ln A Q R T
ln Z = ln A + n ln [ sinh ( α σ ) ]
ln ε ˙ = n 1 ln σ + ln A 1 Q R T
ln ε ˙ = ln A 2 Q R T + β σ
To determine the values of β, α, n1 and n at the peak flow stress, the specimens were subjected to hot compression experiments at different strain rates and deformation temperatures. Different strain rates and deformations can be obtained from the measured stress–strain curve in Figure 4. The peak value of the flow stress at temperature is shown in Figure 5. This figure shows that when the material is deformed at any temperature, the peak flow stress increases significantly with the increase in the strain rate. On the one hand, under these conditions, the deformation storage energy of the tested steel increases, and the work hardening of the material is more obvious. The rate of destruction among the grains is much greater than the rate of softening (recovery and recrystallization) repair, which causes the stress to increase. When the strain rate is constant, as the deformation temperature T increases, the peak flow stress decreases.
The linear regression relationship from the test data and the corresponding results from Equations (9) and (10) are consistent at all temperatures. Thus, the ln σ s ln ε ˙ and σ s ln ε ˙ relationships of the 0Cr18Ni5Mn2Mo2Cu4N0.4 steel are calculated. According to the data in Figure 6, the slope of the curve when the error is reduced from 1273 K to 1423 K in Figure 6a. for the three fitting curves of 1273 K, 1323 K and 1373 K in Figure 6b, the corresponding stress is relatively large, and Equation (10) shows that for the tested steel, the average of the reciprocal of the slope of the three curves is taken. The calculation shows that n1 = 7.54 and β = 0.048; thus, from Equation (6), α = 0.0063.
Similarly, the linear regression from Equation (7) can be obtained in Figure 7 and Figure 8, which is the linear relationship between the peak flow stress, deformation rate and deformation temperature. Figure 7 and Figure 8 show that for the tested steel, n = 5.82 and Q = 556.46 kJ∙mol−1. Using the experimentally obtained Q for the present tested steel, Equation (3) can be written as Z = ε ˙ exp ( 556460 / R T ) .
This formula is substituted into Equation (8), and then the corresponding relationship diagram is drawn.
The test data and a corresponding linear fit are shown in Figure 9. According to the test data, n = 5.91 ± 0.15 and ln A = 47.61 ± 0.09; the correlation coefficient of the fitting curve is 0.9939. The n value of 5.82 calculated from Figure 7 is within the fitted value in Figure 9.
From the above calculation and analysis, the relationship between the hot deformation flow stress and the strain rate at different temperatures can be expressed as follows:
ln ε ˙ = 5.82 ln sinh ( 0.0063 σ ) + 47.61 5.5646 × 10 5 R T
The Zener-Hollomon parameters are expressed as follows:
Z = ε ˙ exp ( 5.5646 × 10 5 / R T )
The activation energy for hot deformation is calculated based on the peak stress data at different temperatures and strain rates. Mandal et al. [19] calculated the activation energy of super austenitic stainless steel to be lower than 500 kJ·mol−1. Wang et al. [20] used Gleeble1500 to calculate the Q value of 426 kJ·mol−1 at a strain rate of 0.01–10 s−1 at 1173–1573 K. The calculated Q value of conventional 304 stainless steel under the same conditions is about 400 kJ·mol−1 [21]. It is believed that it is because nitrogen has a strong blocking effect on DRX, which leads to an increase in activation energy.
According to Equation (2) from the above model, the value of Q was 556.46 kJ·mol−1 with 0.4 wt.% nitrogen added because solid solution nitrogen or nitride promoted strengthening.

3.4. Energy Dissipation Diagram

Prasad et al. [22] obtained the energy dissipation map according to the dynamic material model, and the workpiece under hot deformation plays the role of energy dissipation.
The energy consumed by the microstructural transformation is represented by the dimensionless parameter η, which represents the energy consumption rate. This parameter is a strain rate sensitivity function, for which the expression is given hereafter:
η = 2 m m + 1
m = ( ln σ ln ε ˙ ) T , ε , where m is the strain rate sensitivity factor. The slope of the ln σ s ln ε ˙ curve in Figure 6a is the m value of the tested steel formed at 1273 K, 1323 K, 1373 K, 1423 K and 1473 K. The values of m at these temperatures are 0.152, 0.182, 0.230, 0.312 and 0.271; thus, m increases with increasing T, and the logarithm of the stress and strain rate is linear. The process ability of the tested steel is enhanced in the high-temperature zone.
The tested steel is thermally compressed at a strain rate of 0.01–10 s−1 and at a deformation temperature of 1273–1473 K. The energy dissipation diagram obtained by Equation (13) is shown in Figure 9, which visually shows different deformation temperatures and strain rates. The energy consumed by the microstructural transformation during thermal deformation is greater than the power loss efficiency value, indicating that the material is more likely to undergo dynamic recrystallization during thermal deformation and that the organisation and properties of the material are improved.
Figure 10 shows that there are three regions with relatively high efficiency: the deformation temperature of region I is between 1350 and 1380 K, where the value of ln ε ˙ is between −0.5 and 0. Above 1405 K, η is greater than 0; the deformation temperature of zone II is between 1416 and 1461 K, where the value of ln ε ˙ is greater than 0. Region III is between 1425 and 1450 K, where the value of ln ε ˙ is between 0.5 and 1 and the value of η is 0.5. Region III is in the steady state region, and the corresponding thermal efficiency value was higher in this region than in the other regions.

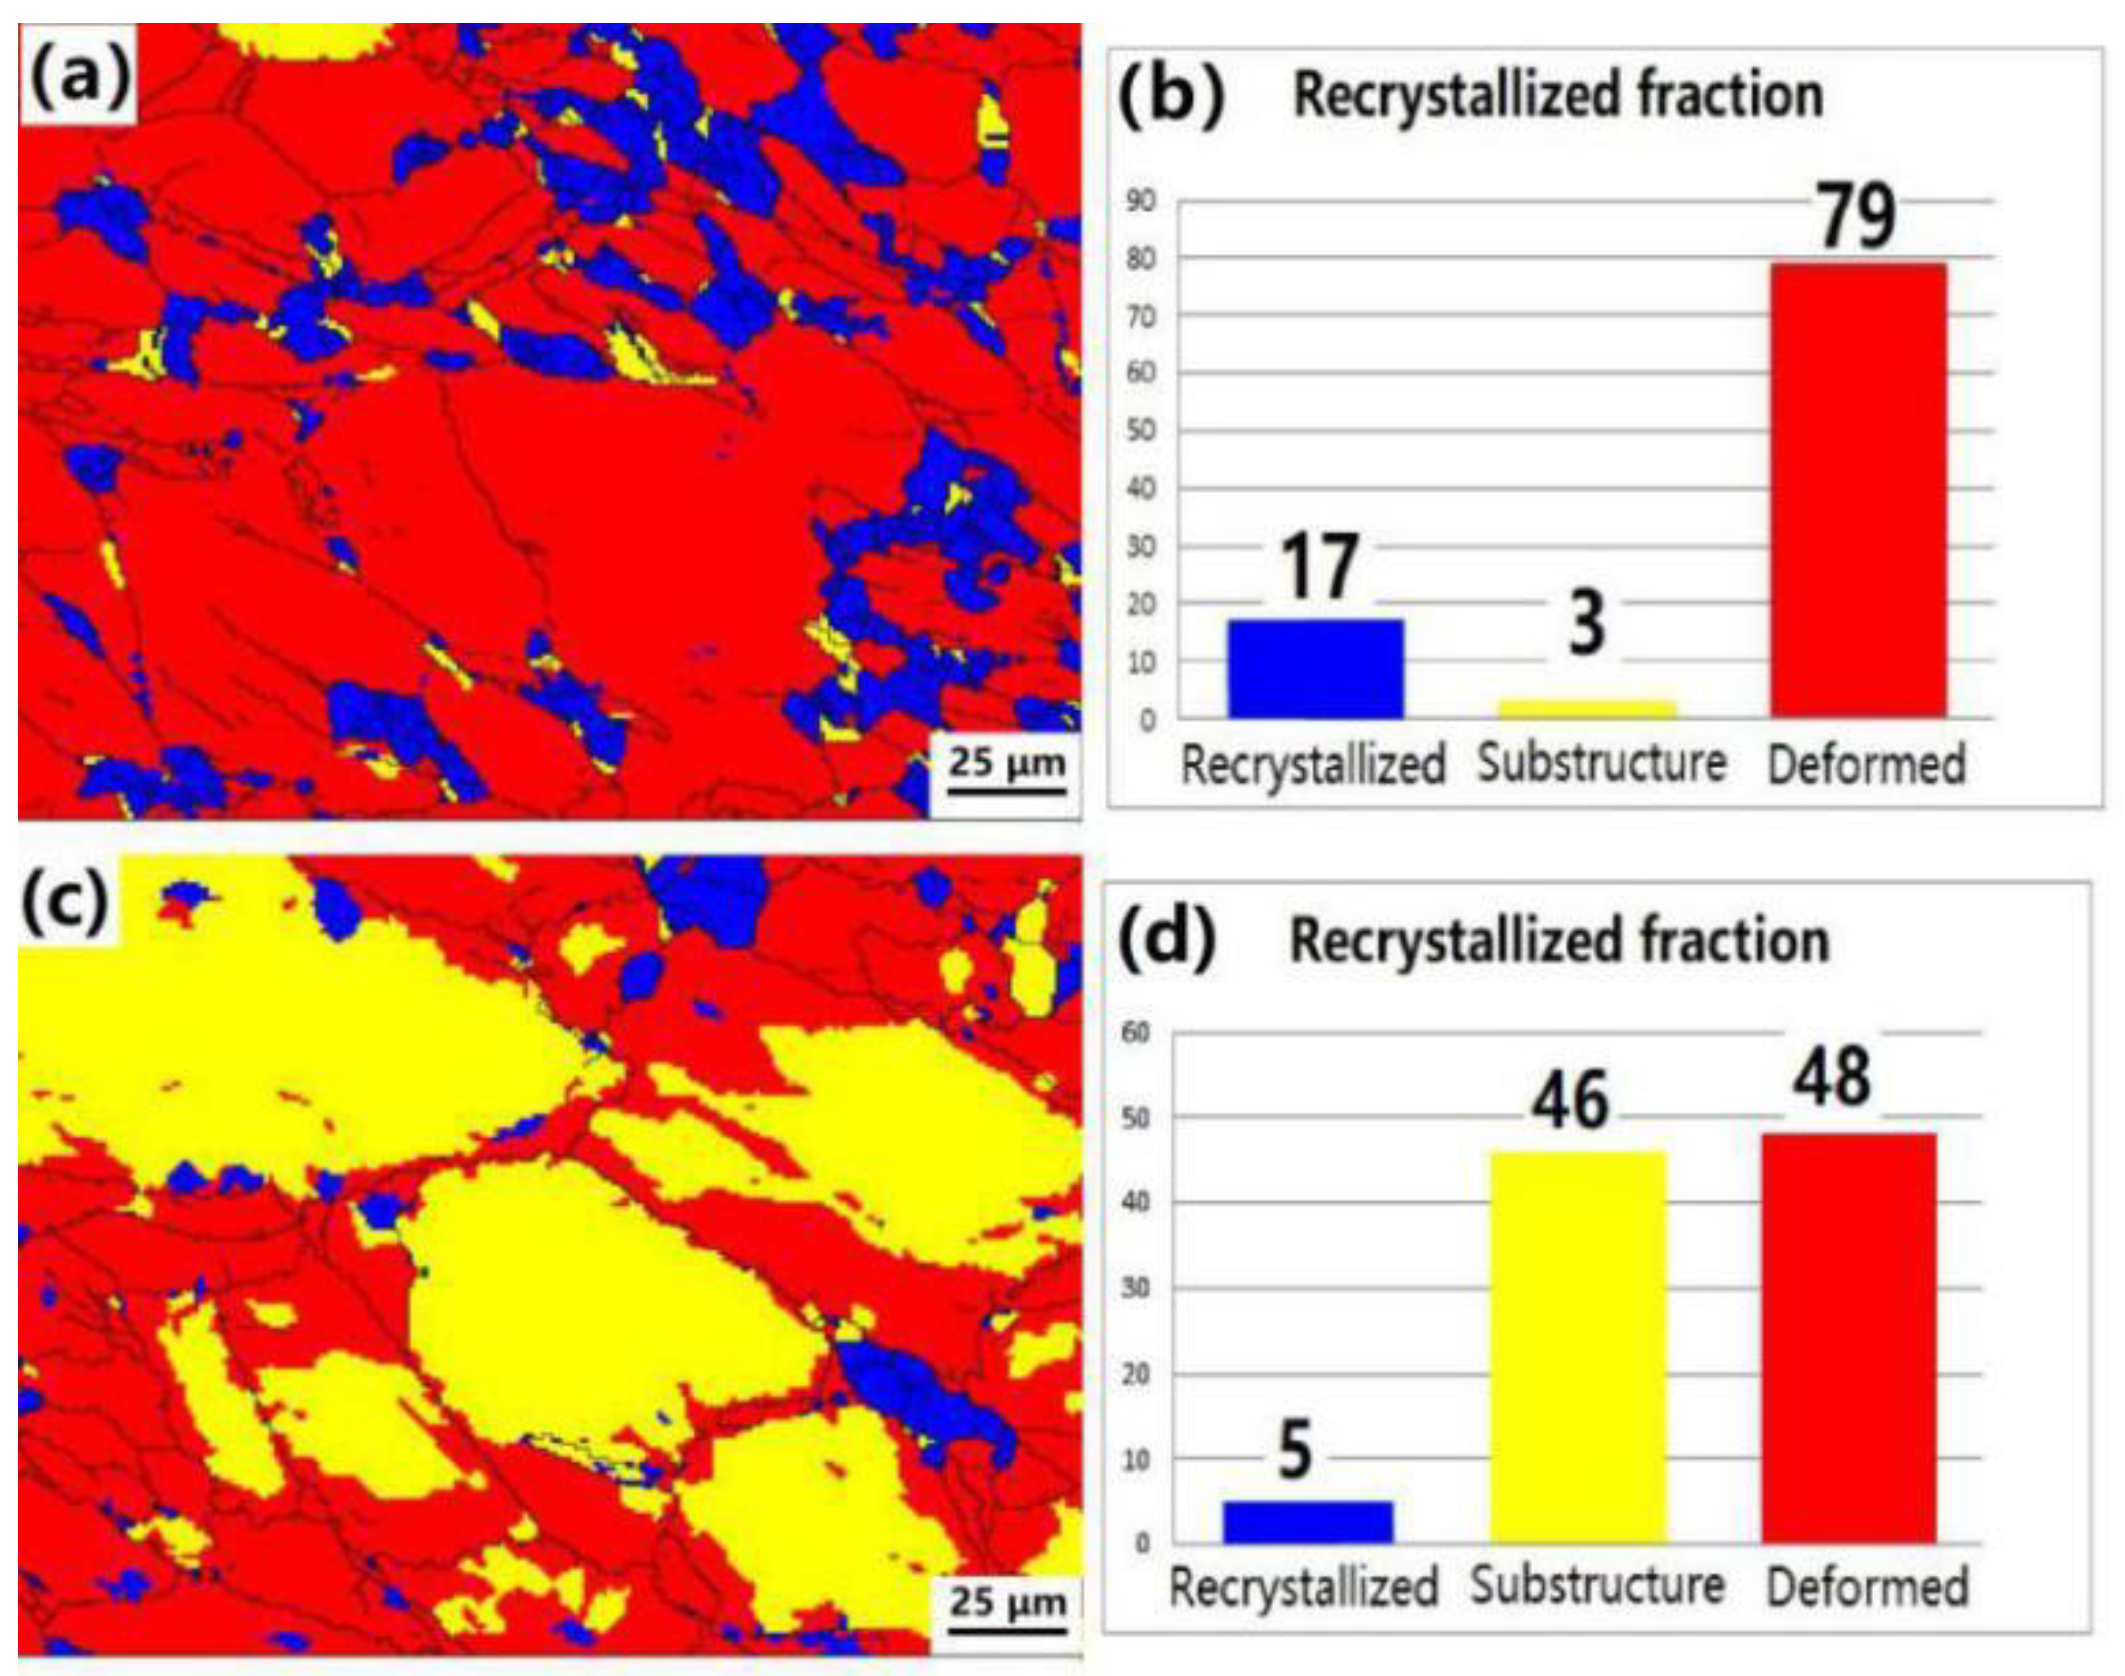
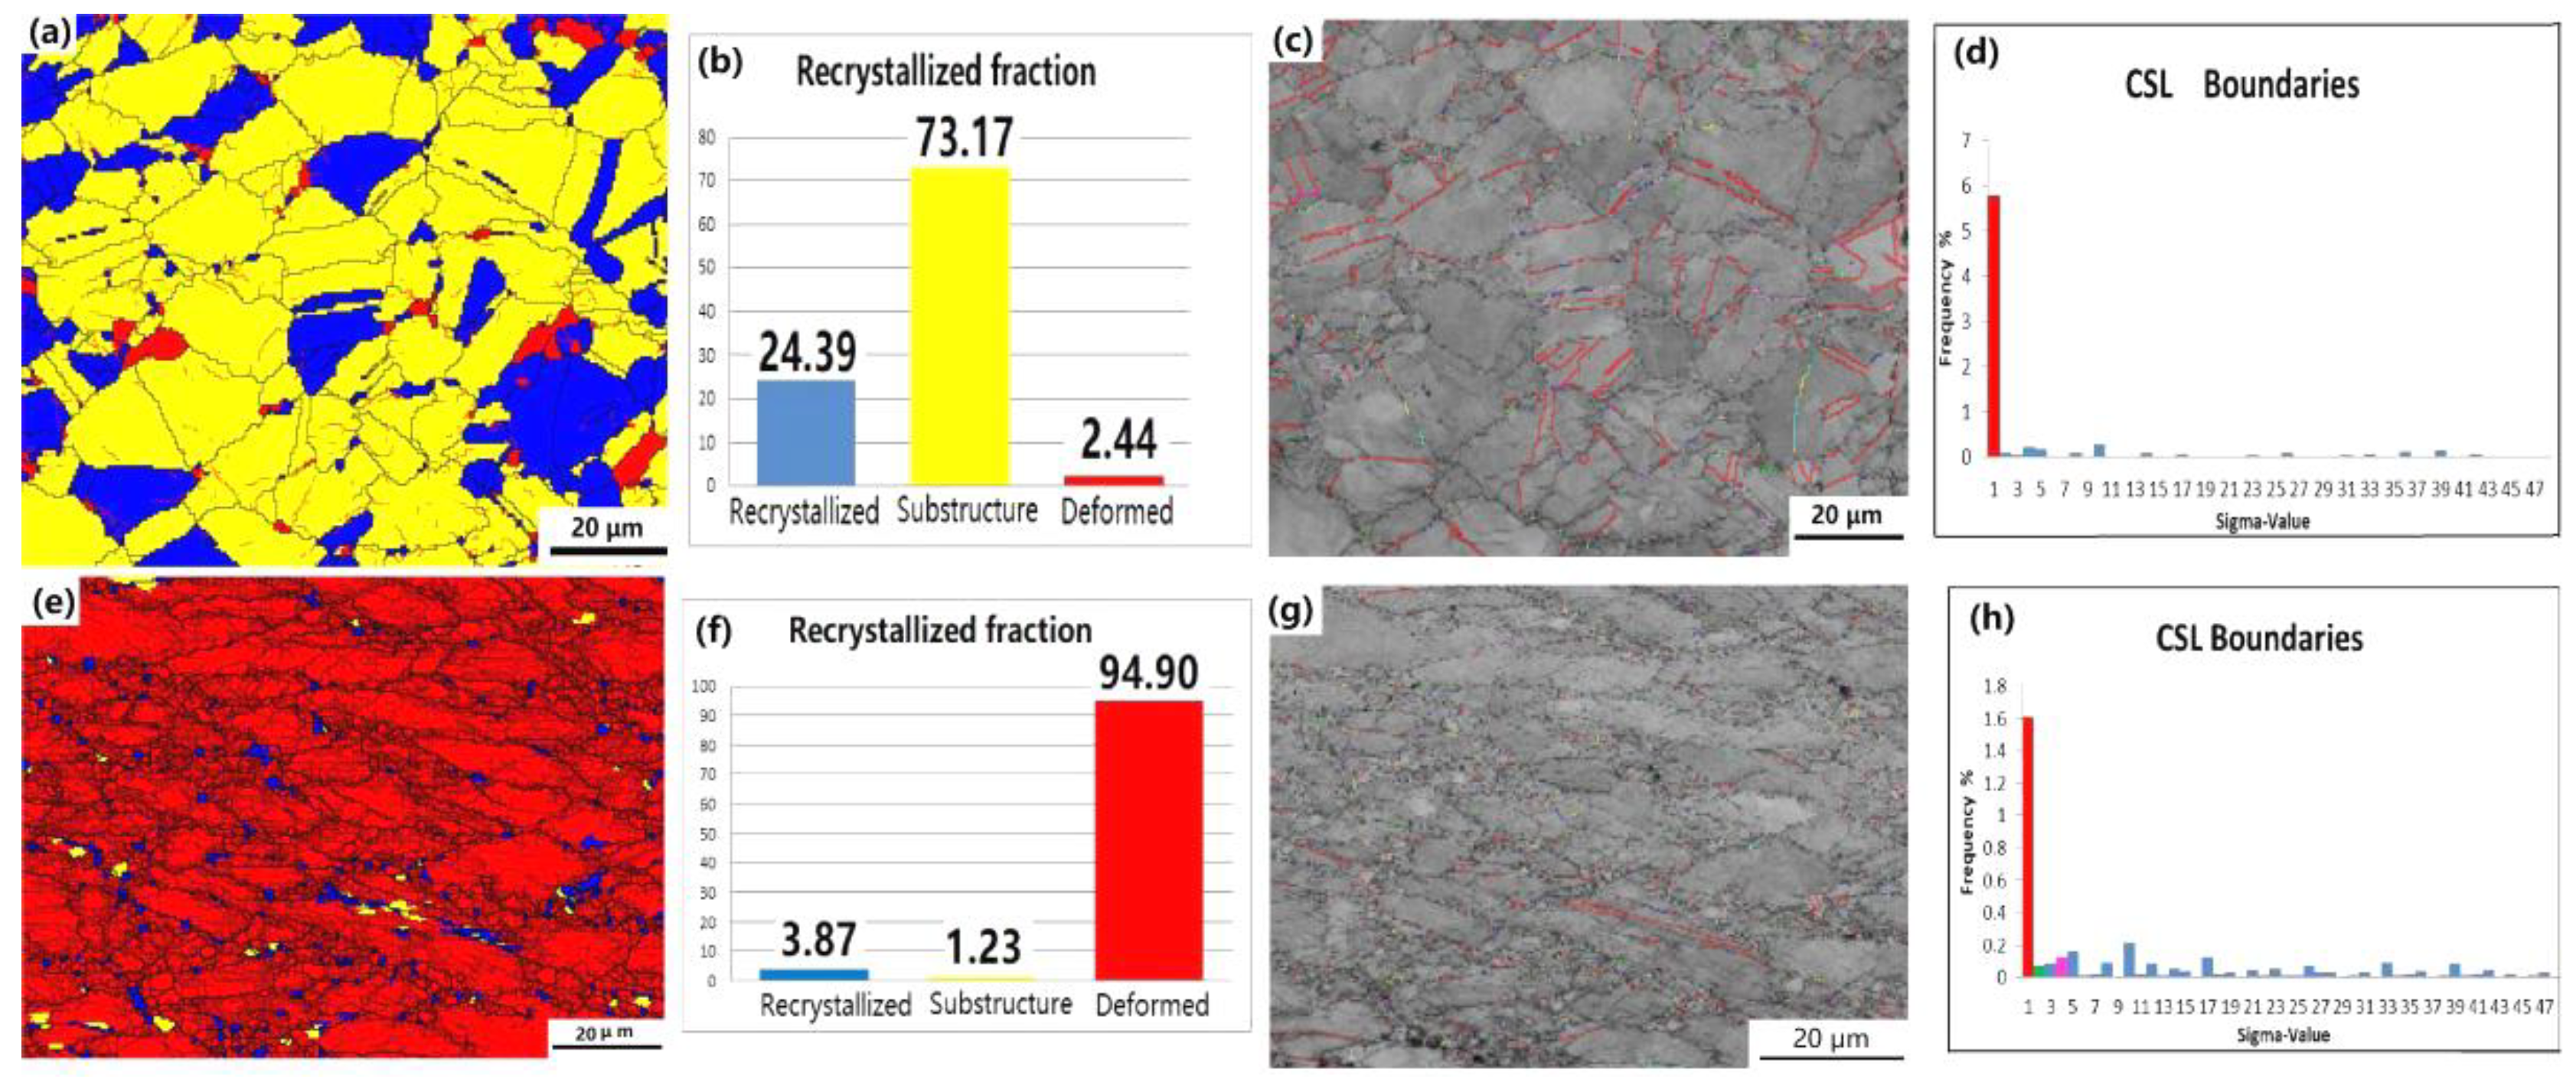
3.5. Dynamic Recrystallization Process

To study the recrystallization process, Figure 11 shows a comparison of the specimens tested at strain rates of 0.01 and 10 s−1 at a deformation temperature of 1373 K. At a strain rate of 0.01 s−1, the recrystallization ratio was 17% in Figure 11b, whereas the recrystallization ratio was 5% at a strain rate of 10 s−1 in Figure 11d. The smaller the strain rate was, the longer the compression deformation time, and the higher the proportion of dynamic recrystallization. The smaller the deformation resistance was, the lower the stress value of hot compression. This change law is consistent with the change in the stress–strain curve in Figure 4c.
The EBSD results of the sample with 40% height compression, a strain rate of 1 s−1 and a deformation temperature of 1323 K in Figure 12 show that dynamic recrystallization occurred. In Figure 12a, the size of the matrix crystal grains is large and uniform. A large number of fine crystal grains are formed at the edge of the other crystal grains; the deformation ratio is 2.44%, and the recrystallization ratio is 24.39%. In Figure 12e, the DRX nuclei appear along the primary grain boundaries. The DRX grains continuously grow, leading to the typical necklace structure around the pre-existing grain boundaries. The grain boundary type is analysed. The Σ3 (red line) coincidence site lattice (CSL) position is the twin boundary in the grain boundary diagram. The Σ3 statistic accounts for no more than 6% with 20% height deformation at 1373 K in Figure 12c. Moreover, the difference in the adjacent grain boundaries is small, the degree of atomic distortion of the grain boundaries is low, and the grain boundary energy is low. The Σ3 statistic accounts for 2% with 40% height reduction at 1373 K. When the deformation temperature is lower, the grain boundary energy increases, which indicates that the deformation temperature is the main influencing factor, and the height reduction is a secondary influencing factor.
TEM analysis was performed on the hot-compressed sample with 40% compression at a strain rate of 1 s−1. Precipitates appear inside the grain in Figure 13a. Combined with EDS, the diffraction spot was designated as NbC, which was not greater than 200 nm in length.
In Figure 14a, the phase precipitated at the grain boundary, and the diffraction spot was marked as Cr2N.
In Figure 15a, the phase precipitated at the grain boundary, and the diffraction spot was marked as M23C6.
In summary, the stress–strain curve exhibits a dynamic recrystallization phenomenon. When the deformation temperature is constant, the peak value of the flow stress increases as the strain rate increases. The increase in strain rate causes the deformation energy to rapidly increase in unit time, which leads to quick dislocation movement, accumulation, entanglement and plugging, which makes the kinetic recovery and recrystallization incomplete. Because of the solid solution in steel, nitrogen retards the growth of the detrimental intermetallic phase, and the precipitation of nitride and M23C6 causes hardening of the grain boundary [23].
The dislocation motion and the grain boundary intersection in the structure shown in Figure 16 explain the effect of dislocation motion on the grain boundary.
As the degree of work hardening increases, the flow stress increases. When the strain rate is constant, the peak value of the flow stress decreases as the deformation temperature increases. This phenomenon mainly occurs because as the hot compression temperature increases, the atomic kinetic energy increases, and the thermal deformation is more easily activated. At the same time, dynamic recrystallization nucleation becomes easier, and the high-temperature dynamic recrystallization process is accelerated. These two factors greatly accelerate the softening process and reduce the flow stress. The Cu-bearing steel exhibits dynamic crystallization during hot working. The smaller the strain rate is, the smaller the critical strain of dynamic recrystallization and the greater the degree of dynamic recrystallization.
Simmons et al. [24] proposed that cation precipitation caused by ageing under 1173 K significantly affects the plastic flow behaviour of materials under low and high strains.
Cellular precipitation leads to enhanced strengthening of the matrix under low-strain conditions. The nitride precipitation at the grain boundary has a harmful influence on the plastic deformation ability of the material.
Figure 17 shows that when the compression temperature is 1373 K and the strain rate is 1 s−1, the cellular precipitates along the grain boundary are identified as CrN and Cr23C6 phases via EBSD. Nitride precipitation reduces the interstitial nitrogen concentration and strengthens the grain boundary, which has a significant effect on the strain limit of the material. It is easy to exceed the strain limits of the matrix itself, thereby promoting premature fracture of the material at lower strain levels.
Based on the particle boundary-sliding-promoted microporous coalescence and cracking and intergranular rock formation promoted by grain boundary sliding, Vedani et al. [25] found that the high-temperature deformation mechanism involves the accommodation of the relative deformation between adjacent particles by the plastic flow inside the particles. When the strength of the steel is greater, the plastic flow is hindered, and grain boundary sliding is easily achieved by cracking at the boundary, resulting in an increase in steel brittleness.
Figure 18 indicates that there are no precipitates along the grain boundary crack in the steel at 1423 K and a strain rate of 0.01 s−1, the internal distributions of Fe, Cr, Mn, Mo, S and N in the grain solid solution are uniform, and the element concentration at the grain boundary cracking point is not drastically reduced. Combined with the above studies, it is shown that the solid solution causes grain boundary hardening, and the grain boundary stress increases to cause grain boundary cracking to meet the requirements of processing deformation plastic flow.
Ohadi et al. [26] observed a zigzag flow stress in the stress–strain curve at a strain rate of 0.01 s−1 and a deformation temperature of 1373 K. They believed this flow was related to the segregation of impurity elements and its delayed effect. Therefore, it is necessary to control the purity of the smelting steel, implement a low sulphur oxygen smelting process and determine a suitable rolling temperature to avoid the formation of impurities. Figure 19 shows that the tested steel has MnS impurities that reduce hot workability. These impurities decrease the hot workability of austenitic steel, causing cracking of the strip during rolling and affecting surface roughness.

4. Conclusions

The hot deformation characteristics of the Cu-bearing N-alloyed stainless steel in a temperature range of 1273–1473 K and a strain rate range of 0.001–10 s−1 were studied. The equations in this paper were derived on the basis of the true stress–true strain curve, and the corresponding microstructural evolution mechanism was discussed.
(1) The Thermo-Calc calculation shows that the addition of N to the steel results in the formation of Cr2N and gas phases; moreover, the austenite phase region is enlarged, which is consistent with the XRD test results of the 1373 K solid solution sample.
(2) Using the flow stress data with a true strain of 0.5 to establish the Zenner–Hollomon parameters, the average activation energy is 556.46 kJ/mol. The following constitutive equations are obtained:
Z = ε ˙ exp ( 5.5646 × 10 5 / R T ) = 4.72 × 10 20 [ sinh ( 0.0063 σ ) ] 5.82
(3) The tested steel has a temperature of 1273–1473 K and a strain rate of 0.01–10 s−1. The true stress–strain curve has no obvious bimodal characteristics, conforms to the typical dynamic recovery and dynamic recrystallization rheological curves, and exhibits alternating partially softening and hardening phenomena.
(4) The thermal processing diagram shows that the steady state field of optimal thermal processing is the temperature range of 1416–1461 K and the strain rate range of 5.62–10 s−1, and the peak efficiency is approximately 30%.
(5) The TEM observations show that Cr2N, M23C6 and NbC precipitated at the grain boundary in the hot-compressed sample, which results in grain boundary strengthening and is consistent with the Thermo-Calc calculation results.
(6) Hot compression produces dislocation motion, and second phase particles hinder dislocation motion. These phenomena cause dislocation strengthening because of dislocation pile up and increase grain boundary stress because of grain boundary strengthening, which results in wedge-shaped grain boundary cracking.

Author Contributions

X.-Y.F. and P.-C.B. conceived and designed; X.-Y.F. performed the experiments; X.-Y.F. and P.-C.B. analyzed the data; J.-C.Y. also put forward some suggestions and contributed reagents/materials/analysis tools; P.-C.B. also analyzed the image of transmission electron microscope; X.-Y.F. wrote the paper and P.-C.B. carried out the examination of papers. All authors have read and agreed to the published version of the manuscript.

Funding

This work was funded by the National Natural Science Foundation of China (Nos. 51364031, 11672140, 11362014) and the Natural Science Foundation of Inner Mongolia Region (No.2019MS05044).

Conflicts of Interest

The authors declare no conflict of interest. Pu-cun Bai is a doctoral advisor of Xiao-yang Fu; Ji-chun Yang is the provider of the experimental scheme. Xiao-yang Fu performed the experiments; Ji-chun Yang contributed reagents/materials/analysis tools; Pu-cun Bai was the funding sponsors and played an important role in the design of the study; analyses or interpretation of data; in the writing of the manuscript and in the decision. Everyone has no conflict of interest.

References

  1. Tan, S.-P.; Wang, Z.-H.; Cheng, S.-C.; Liu, Z.-D.; Han, J.-C.; Fu, W.-T. Effect of Cu Content on Aging Precipitation Behaviors of Cu-Rich Phase in Fe-Cr-Ni Alloy. J. Iron Steel Res. Int. 2010, 17, 63–68. [Google Scholar] [CrossRef]
  2. Xi, T.; Shahzad, M.B.; Xu, D.; Zhao, J.; Yang, C.; Qi, M.; Yang, K. Copper precipitation behavior and mechanical properties of Cu-bearing 316L austenitic stainless steel: A comprehensive cross-correlation study. Mater. Sci. Eng. A 2016, 675, 243–252. [Google Scholar] [CrossRef]
  3. San, X.Y.; Zhang, B.; Wu, B.; Wei, X.X.; Oguzie, E.E.; Ma, X.L. Investigating the effect of Cu-rich phase on the corrosion behavior of Super304H austenitic stainless steel by TEM. Corros. Sci. 2018, 130, 143–152. [Google Scholar] [CrossRef]
  4. Prabha, B.; Sundaramoorthy, P.; Suresh, S.; Manimozhi, S.; Ravishankar, B. Studies on Stress Corrosion Cracking of Super 304H Austenitic Stainless Steel. J. Mater. Eng. Perform. 2009, 18, 1294–1299. [Google Scholar] [CrossRef]
  5. Hattestrand, M.; Nilsson, J.-O.; Stiller, K.; Liu, P.; Andersson, M. Precipitation hardening in a 12%Cr–9%Ni–4%Mo–2%Cu stainless steel. Acta Mater. 2004, 52, 1023–1037. [Google Scholar] [CrossRef]
  6. Sen, I.; Kumar, E.A.S.; Fleury, E.; Oh-ishi, K.; Hono, K.; Ramamurty, U. Microstructure and mechanical properties of annealed SUS 304H austeniticstainless steel with copper. Mater. Sci. Eng. A 2011, 528, 4491–4499. [Google Scholar] [CrossRef]
  7. Yan, Y.; Cheng, S.C.; Gang, Y. Effect of Cu Addition on the Creep Rupture Properties of Super304H Steel. Mater. Mech. Eng. 2002, 26, 23–25. (In Chinese) [Google Scholar]
  8. Raj, R. Development of a processing map for use in warm forming and hot forming process. Metall. Trans. A 1981, 12, 1089–1097. [Google Scholar] [CrossRef]
  9. Saadatkia, S.; Mirzadeh, H.; Cabrera, J.-M. Hot deformation behavior, dynamic recrystallization, andphysically-based constitutive modeling of plain carbon steels. Mater. Sci. Eng. A 2015, 636, 196–202. [Google Scholar] [CrossRef] [Green Version]
  10. Lin, Y.C.; Chen, X.-M. A critical review of experimental results and constitutive descriptions for metals and alloys in hot working. Mater. Des. 2011, 32, 1733–1759. [Google Scholar] [CrossRef]
  11. Tan, S.; Wang, Z.; Cheng, S.; Liu, Z.; Han, J.; Fu, W. Processing maps and hot workability of Super304H austenitic heat-resistantstainless steel. Mater. Sci. Eng. A 2009, 517, 312–315. [Google Scholar] [CrossRef]
  12. Taylor, A.S.; Hodgson, P.D. Dynamic behaviour of 304 stainless steel during high Z deformation. Mater. Sci. Eng. A 2011, 528, 3310–3320. [Google Scholar] [CrossRef]
  13. Narayana, S.V.S.; Murty, B.; Rao, N.; Kashyap, B.P. Identification of flow instabilities in the p rocessingmaps of AISI 304 stainless steel. J. Mater. Process. Technol. 2005, 166, 268–278. [Google Scholar] [CrossRef]
  14. Zener, C.; Hollomon, J.H. Effect of Strain Rate Upon Plastic Flow of Steel. J. Appl. Phys. 1944, 15, 22–32. [Google Scholar] [CrossRef]
  15. CSellars, M.; Tegart, W.J.M.G. Relationship between strength and structure in deformation at elevated temperatures. Mem. Sci. Rev. Met. 1966, 63, 731–746. [Google Scholar]
  16. Mwembela, A.; Konopleva, E.B.; McQueen, H.J. Microstructural development in Mg alloy AZ31 during hot working. Scr. Mater. 1997, 37, 1789–1795. [Google Scholar] [CrossRef]
  17. Jonas, J.J.; Sellars, C.M.; Tegart, W.J.M. Strength and structure under hot-working conditions. Metall. Rev. 1969, 14, 1–24. [Google Scholar]
  18. McQueen, H.J.; Wong, W.A.; Jonas, J.J. Deformation of aluminum at high temperatures and strain rates. Can. J. Phys. 1967, 45, 1225–1234. [Google Scholar] [CrossRef]
  19. Arun, K.; Babu, S.; Mandal, C.N.; Athreya, B.; Shakthipriya, V. Subramanya Sarma.Hot deformation characteristics and processing map of a phosphorous modified super austenitic stainless steel. Mater. Des. 2017, 115, 262–275. [Google Scholar]
  20. Changjun, W.; Han, F.; Wenjie, Z.; Zhigang, S.; Qilong, Y. Dynamic Recrystallization Behavior and Microstructure Evolution of AISI304N Stainless Steel. J. Iron Steel Res. Int. 2013, 20, 107–112. [Google Scholar]
  21. Belyakov, A.; Miura, H.; Sakai, T. Dynamic Recrystallization Under Warm Deformation of a 304 Type Austenitic Stainless Steel. Mater. Sci. Eng. 1998, 255A, 139–147. [Google Scholar] [CrossRef]
  22. Prasad, Y.V.R.K.; Gegel, H.L.; Doraivelu, S.M. Modeling of dynamic material behavior in hot deformation: Forging of Ti-6242. Metall. Trans. A 1984, 15, 1883–1892. [Google Scholar] [CrossRef]
  23. HaÈnninen, H.; Romu, J.; Ilola, R.; Tervo, J.; Laitinen, A. Effects of processing and manufacturing of high nitrogen-containing stainless steels on their mechanical, corrosion and wear properties. J. Mater. Process. Technol. 2001, 117, 424–430. [Google Scholar] [CrossRef]
  24. Simmons, J.W. Influence of nitride (Cr2N) precipitation on the plastic flow behavior of high-nitrogen austenitic stainless steel. Scr. Metall. Et Mater. 1995, 32, 265–270. [Google Scholar] [CrossRef]
  25. Maurizo, V.; David, D.; Aldo, M. Characterization of Grain-boundary Precipitates after Hot-ductility Tests of Microalloyed Steels. ISIJ Int. 2009, 49, 446–452. [Google Scholar]
  26. Ohadi, D.; Parsan, M.H.; Mirzadeh, H. Development of dynamic recrystallization maps based on the initial grain size. Mater. Sci. Eng. A 2013, 565, 90–95. [Google Scholar] [CrossRef]
Figure 1. Schematic diagrams of the hot compression test.
Metals 10 00082 g001
Figure 2. Thermodynamic calculation phase diagrams of steel (a) without and (b) with added nitrogen.
Metals 10 00082 g002
Figure 3. X-ray diffraction (XRD) diffraction analyses of the tested steel (a) without and (b) with added nitrogen.
Metals 10 00082 g003
Figure 4. True stress–strain curves for the compression tested steel formed at (a) 1273 K, (b) 1323 K, (c) 1373 K, (d) 1423 K and (e) 1473 K.
Metals 10 00082 g004
Figure 5. Flow stress peaks at different strain rates.
Metals 10 00082 g005
Figure 6. Plots of (a) lnσs vs. ln ε ˙ and (b) σs vs. ln ε ˙ .
Metals 10 00082 g006
Figure 7. Plot of ln(sinh(ασs)) vs. ln ε ˙ .
Metals 10 00082 g007
Figure 8. Plot of ln(sinh(ασs)) vs. 104/T.
Metals 10 00082 g008
Figure 9. Z-parameter and peak stress fitting curve.
Metals 10 00082 g009
Figure 10. Power dissipation map and instability.
Metals 10 00082 g010
Figure 11. Electron backscattered diffraction (EBSD) results of the specimens under different strain rates: (a) deformation recrystallization at a strain rate of 0.01 s−1, (b) recrystallized fraction at a strain rate of 0.01 s−1, (c) deformation recrystallization at a strain rate of 10 s−1 and (d) recrystallized fraction at a strain rate of 10 s−1.
Metals 10 00082 g011
Figure 12. Sample microstructure at strain rate of 1 s−1 with a deformation temperature of 1373 K: (a) 20% height deformation image, (b) recrystallization ratio, (c) CSL image and (d) CSL distribution data. Sample microstructure at strain rate of 1 s−1 with a deformation temperature of 1323 K: (e) 40% height deformation image, (f) recrystallization ratio, (g) CSL image and (h) CSL distribution data.
Metals 10 00082 g012
Figure 13. Transmission electron microscopy (TEM) results of NbC with 40% height reduction at 1323 K: (a) bright field, (b) selected area electron diffraction and (c) energy dispersive spectroscopy (EDS).
Metals 10 00082 g013
Figure 14. TEM results of Cr2N: (a) bright field and (b) selected area electron diffraction.
Metals 10 00082 g014
Figure 15. TEM results of M23C6: (a) bright field and (b) selected area electron diffraction.
Metals 10 00082 g015
Figure 16. TEM of dislocation accumulation.
Metals 10 00082 g016
Figure 17. EBSD images of dots with ε ˙ = 1 s−1 and 20% height reduction at 1373 K: (a) electronic image, (b) kikuchi Line of CrN, (c) energy spectrum of CrN, (d) kikuchi Line of M23C6 and (e) energy spectrum of M23C6.
Metals 10 00082 g017
Figure 18. Scanning electron microscopy-energy dispersive spectroscopy (SEM-EDS) elemental line-scan map during hot deformation with a strain rate of 1 s1 at 1423 K: (a) line-scan map and (b) line-scan EDS.
Metals 10 00082 g018
Figure 19. TEM of MnS inclusions: (a) shape and (b) EDS.
Metals 10 00082 g019

