Article

The Influence of Heat Input on the Microstructure and Properties of Wire-Arc-Additive-Manufactured Al-Cu-Sn Alloy Deposits

1
Northeastern University School of Materials and Metallurgy, Shenyang 110000, China
2
Inner Mongolia Metal Material Research Institute, Baotou 014000, China
3
Fushun Donggong Metallurgy & Materials Technology Co., Ltd., Fushun 113000, China
*
Author to whom correspondence should be addressed.
Metals 2020, 10(1), 79; https://doi.org/10.3390/met10010079
Submission received: 1 December 2019 / Revised: 25 December 2019 / Accepted: 30 December 2019 / Published: 2 January 2020

Abstract

:
In this experiment, Al-Cu-Sn alloy was used as raw material to form deposits with different heat input using the wire-arc additive manufacturing (WAAM) process. The effects of heat input on microstructure and mechanical properties of Al-Cu-Sn alloy deposits were investigated by metallography, scanning electron microscopy (SEM), energy dispersive spectroscopy (EDS), and transmission electron microscopy (TEM) and mechanical properties tests. The results show that with increased of heat input, the thickness of the deposits increased and the layer height of the deposits increased. The number and size of pores in the deposits also improved with the increased heat input. The grain size of the deposits in the as-deposited state gradually increased and changed from isometric crystals to columnar crystals, the precipitated θ phases gradually converged on the grain boundary from within the grains. After T6 heat treatment, with increased heat input, the number of unsolved θ phases on the grain boundary increased, and the number of θ phases precipitated out of the matrix decreased as the phase spacing increased. With the increased heat input, the mechanical properties of the deposits gradually decreased, and the fracture mode changed from ductile fracture to brittle fracture.

1. Introduction

Due to their excellent mechanical properties, Al-Cu alloys are widely used in the aviation and aerospace fields [1,2,3]. The additive manufacturing technology (AM) has the advantages of fast response speed [4] and conservation of raw materials [5], opening a new window for the production of Al-Cu alloy structural parts. In recent years, a research hotspot has been the use of Al-Cu alloy as a raw material to make products using the wire + arc additive manufacturing (WAAM) process. Cong et al. [6] studied the effect of the cold metal transfer (CMT) process on pores of Al-Cu alloy walls. Gu et al. [7] researched the microstructure and properties of 2319 wall manufactured by the CMT process, and enhanced the wall by interlayer rolling. Wang et al. [8] investigated the structure and properties of ZL205A alloy wall deposited by the wire + arc additive manufacturing process. Qi et al. [9] investigated the effect of solid solution temperature on the performance of 2024 wall. The above studies show that the WAAM Al-Cu alloy deposits have excellent microstructure and properties, and have a broad potential for industrial application.
However, at present, research on WAAM Al-Cu alloy mainly focuses on finding suitable raw materials, and there are few systematic studies on the influence of additive process on microstructure and properties, which has a significant effect on the industrial application of this technology. In the WAAM process, layers are piled up to form a solid by welding. A large number of studies have investigated the influence of heat input on the microstructure and properties of welded joints. The microstructure of welded joints obtained under higher heat input comprises columnar crystals, while the microstructure of welded joints obtained under lower heat input is equiaxial crystals [10,11]. There are hundreds or thousands of welds in the WAAM process, and the deposits have to undergo repeated thermal cycles, so heat input must have a great influence on the structure and properties of the accumulation body.
In this paper, Al-Cu-Sn alloy is used as the raw material, in which Sn can refine the grain of wall and promote the precipitation of θ phases, keeping it stable during the aging process. We investigate the effects of heat input on the forming size, structure and properties of the deposits, to explore the appropriate process window of WAAM Al-Cu-Sn alloy, paving the way for the industrial application of WAAM process.

2. Materials and Methods

The Al-Cu-Sn alloy welding wire used in this experiment is produced by North East Industrial Materials & Metallurgy Co., Ltd. (Fushun, China), and has a diameter of 1.2 mm. The chemical composition of the main alloy elements and impurities of the welding wire are shown in Table 1. A 10-mm 2219 aluminum plate purchased from Dong Qing (Haerbin, China) was used as the base plate in the additive process.
The additive manufacturing system is shown in Figure 1a. The system included a Fronius Advance 4000 arc welding power supply and an ABB 1410 welding robot. The additive manufacturing process is shown in Figure 1b. The x-axis corresponds to the front of the wall, the y-axis corresponds to the heat source movement direction, horizontal along the wall, and the z-axis corresponds to the direction of growth, perpendicular to the wall.
The print parameters are shown in Table 2, where I is the welding current, U is the welding voltage, νWFS is the wire feeding speed and νTS is the torch traveling speed. The heat input can be calculated from Equation (1) [12]:
HI = ηUI/νTS
For CMT technology, energy utilization η = 0.8 [13].
The wall was heat-treated at a solution temperature of 535 °C for 600 min with a quenching water temperature of 40 °C and aging at 175 °C for 240 min.
A WDW-300 micro-controlled electronic universal testing machine (Chang Chun Ke Xin, Changchun, China). Vernier caliper (accuracy: 0.01 mm) was used to measure the thickness of the accumulation body, measure 5 points and take the average value. Furthermore, a GX53 (Olympus, Tokyo, Japan) metallographic microscope and a Sigma scanning electron microscope (Zeiss, London, UK) were used for the structural and morphological observations. Energy-dispersive X-ray spectroscopy (Zeiss, London, UK) was conducted for the elemental and phase analysis, and an FEI Titan Themis (Titan Themis, New York, NY, USA) spherical aberration-corrected transmission electron microscope (TEM) was used for the morphological observation of the precipitation phase. The sampling locations and the machining shape of the mechanical samples are shown in Figure 1b. Four tensile samples were collected at locations 1 and 2, and the metallographic and transmission samples were collected at location 3. The tensile samples were processed into a plate structure with a gauge length of 30 mm and a cross-sectional area of 2.5 × 10 mm2.

3. Results and Discussion

3.1. Appearance Size of Deposits

The thickness and layer height of the deposits changed with the heat input are shown in Figure 2. As can be seen from the figure, the thickness and layer height of the deposits gradually increased with increasing heat input. Due to the enlargement of heat input, the width of the molten pool improves, resulting in an increase in thickness. The relationship between the thickness of deposits and the heat input satisfies the function: y = 4.7992ln(x) − 11.882. The increase of layer height is due to the unified control of the welding machine and the amount of feeding wire built up with the increase of heat input. The relationship between layer height and heat input satisfies the function: y = 0.0038x + 0.402. According to the two functions, the appropriate heat input can be selected according to the target wall thickness and later determines the suitable height during WAAM process.

3.2. Pores of Deposits

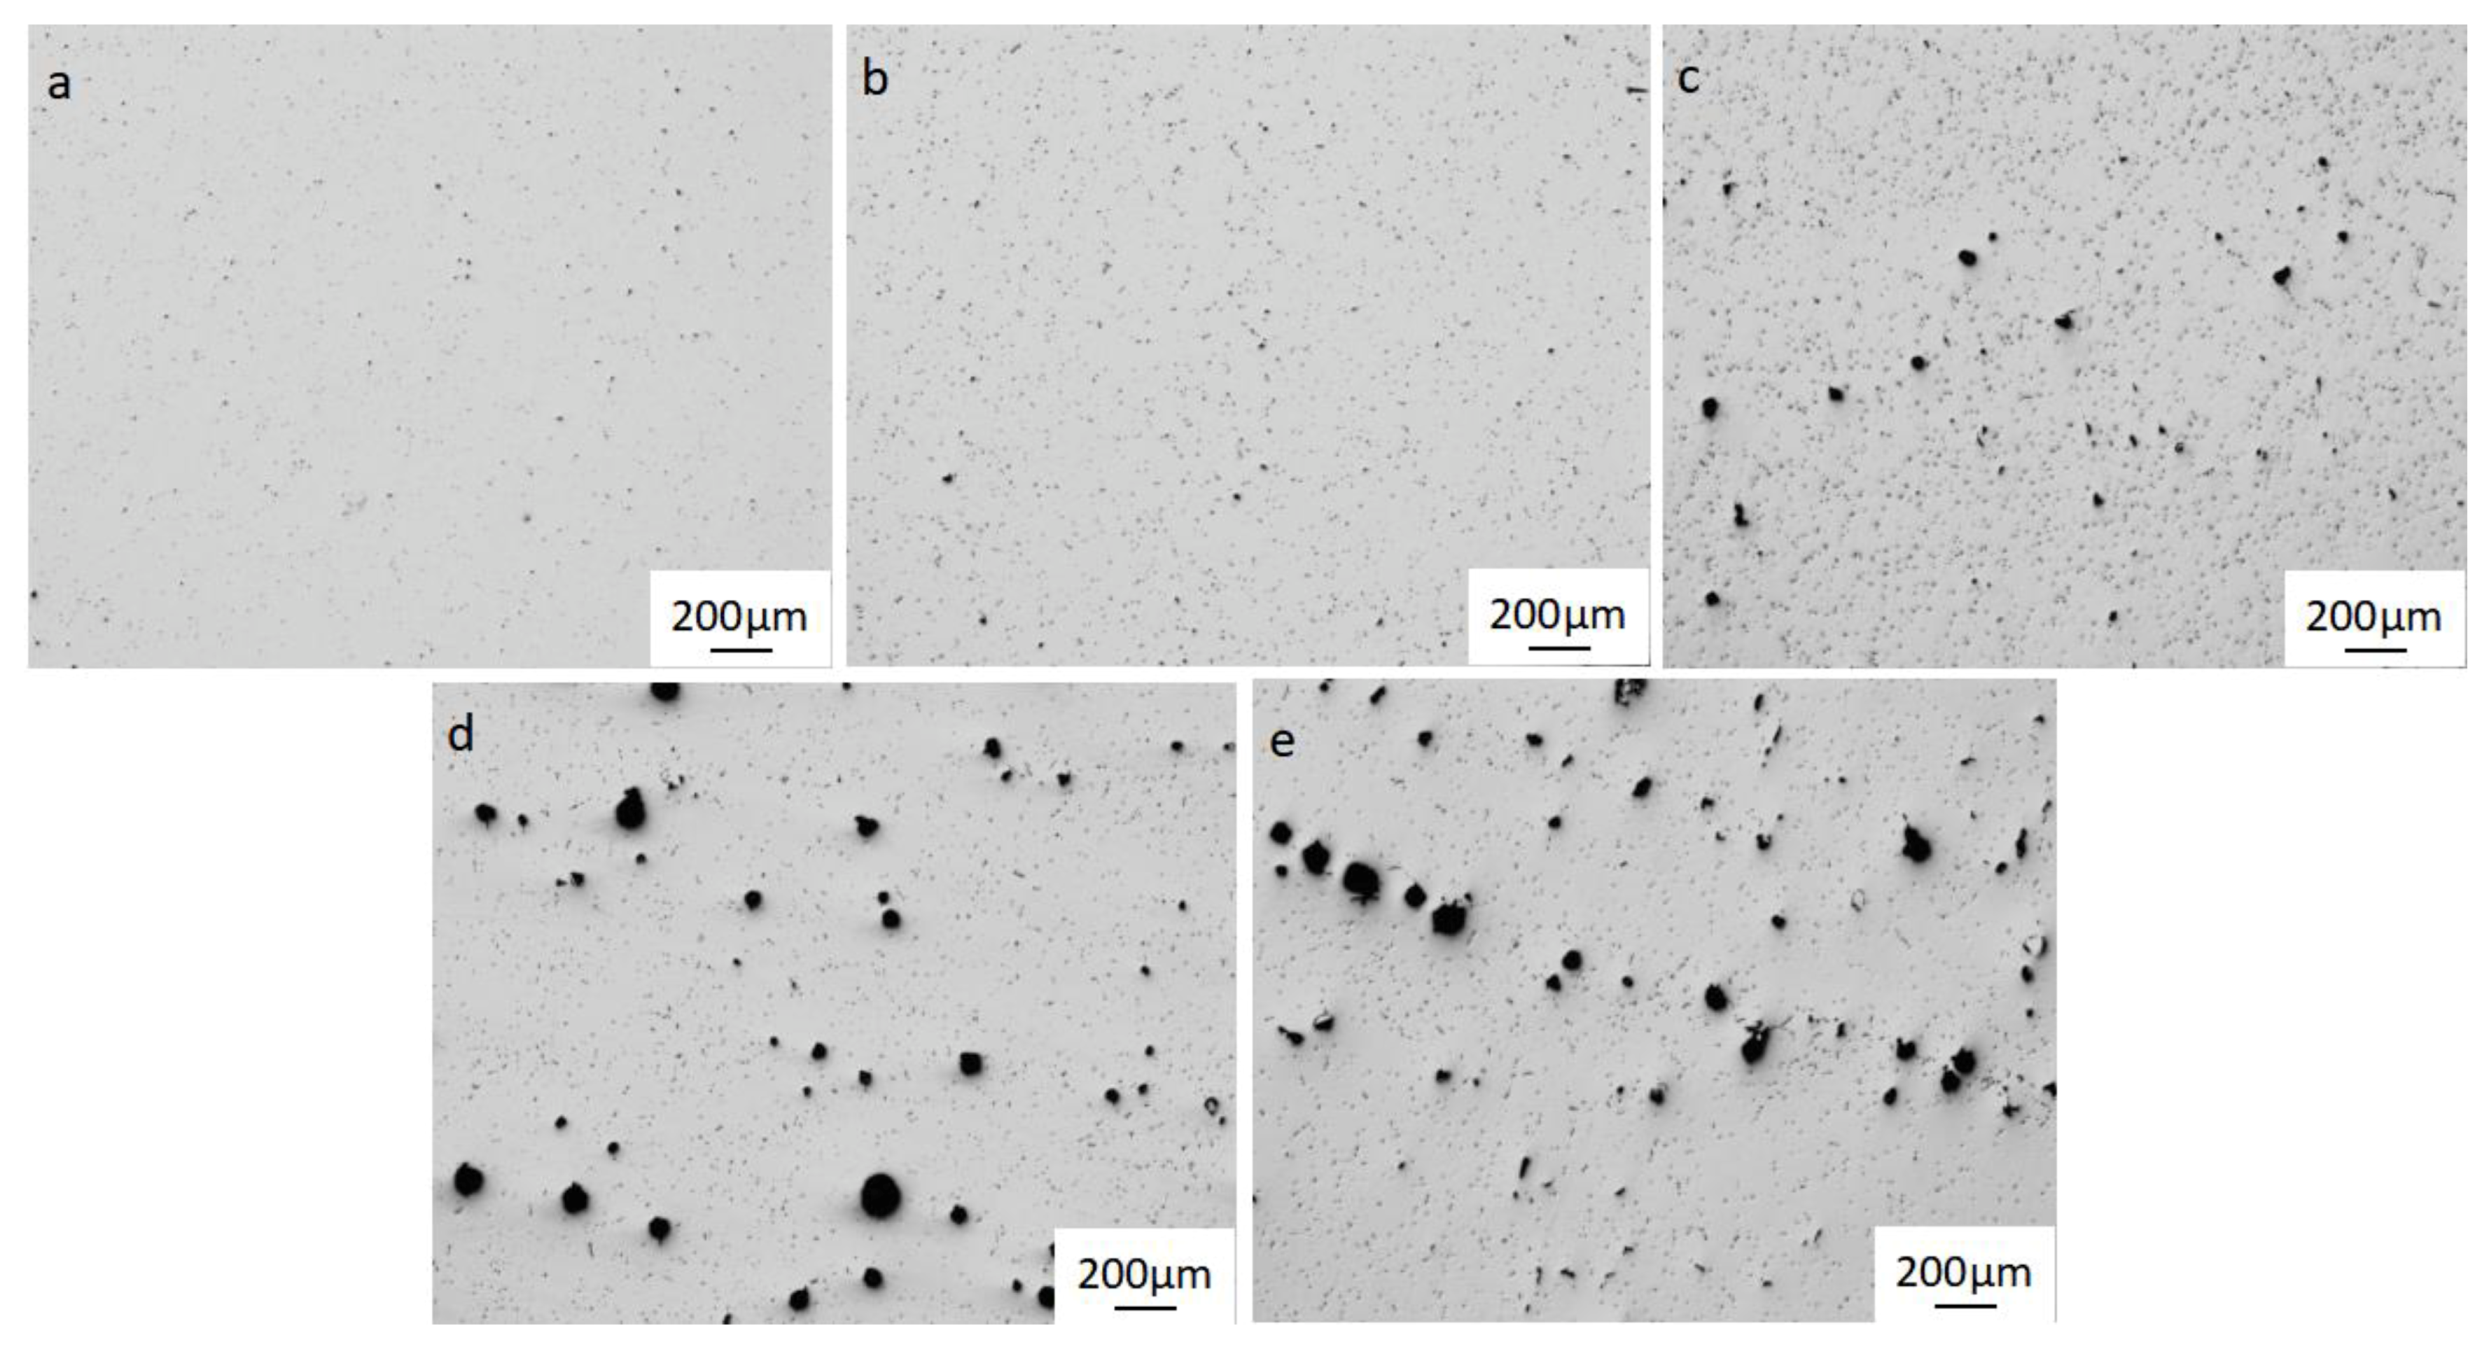
Porosity can cause stress concentration and reduce the effective stressed area, which has a significant impact on the performance of aluminum alloy [14]. Pores in deposits with different heat input are shown in Figure 3. As can be seen from this figure, when the heat input is 30 J/mm and 60 J/mm, there was no pore larger than 20 μm in the microstructure of deposit, as shown in Figure 3a,b. When the heat input reached 90 J/mm, pores with diameter of 50 μm could be seen in the microstructure of the deposit, as shown in Figure 3c. With the continuous increase of heat input, the number and size of pores in the deposits increased to 100 μm, and pores were parallel to the layers, showing a linear distribution; the same pattern of pore distribution was observed by Cong et al. [4]. The pores in welding aluminum alloys are mainly hydrogen pores, which are caused by the great difference in solubility of hydrogen between solid and liquid states [15]. Under the different heat input, tendency of pores to form is firstly due to the different heat input which leads to different degrees of superheating of the molten pools. The solubility of hydrogen in aluminum solution increases with the increase of temperature [16], so the larger the heat input is, the more dissolved hydrogen will be in the molten pools. Secondly the formation of pores goes through the nucleation stage first, and the nucleation velocity can be obtained from Equation (2) [17]:
j = C e 4 π r σ 3 K T
where j represents the number of nucleations per unit time, r represents the critical radius of the bubble, K represents the Boltzmann constant (K = 1.38 × 10⁻¹⁶ erg/k), and σ represents the surface tension. According to Equation (2), the higher the temperature is, the faster the nucleation speed. As a result, nucleation speed of pores will be faster with the larger of heat input. Finally, it can be seen from Figure 2 that the heat input is higher, the layer height is larger, and the overflow channel of pores is longer, which is not conducive for the pores to overflow. From the above three points, it can be known that when the heat input is higher, the number and size of pores will be larger.

3.3. Microstructure of Deposits

3.3.1. Microstructure of Deposits in As-Deposit State

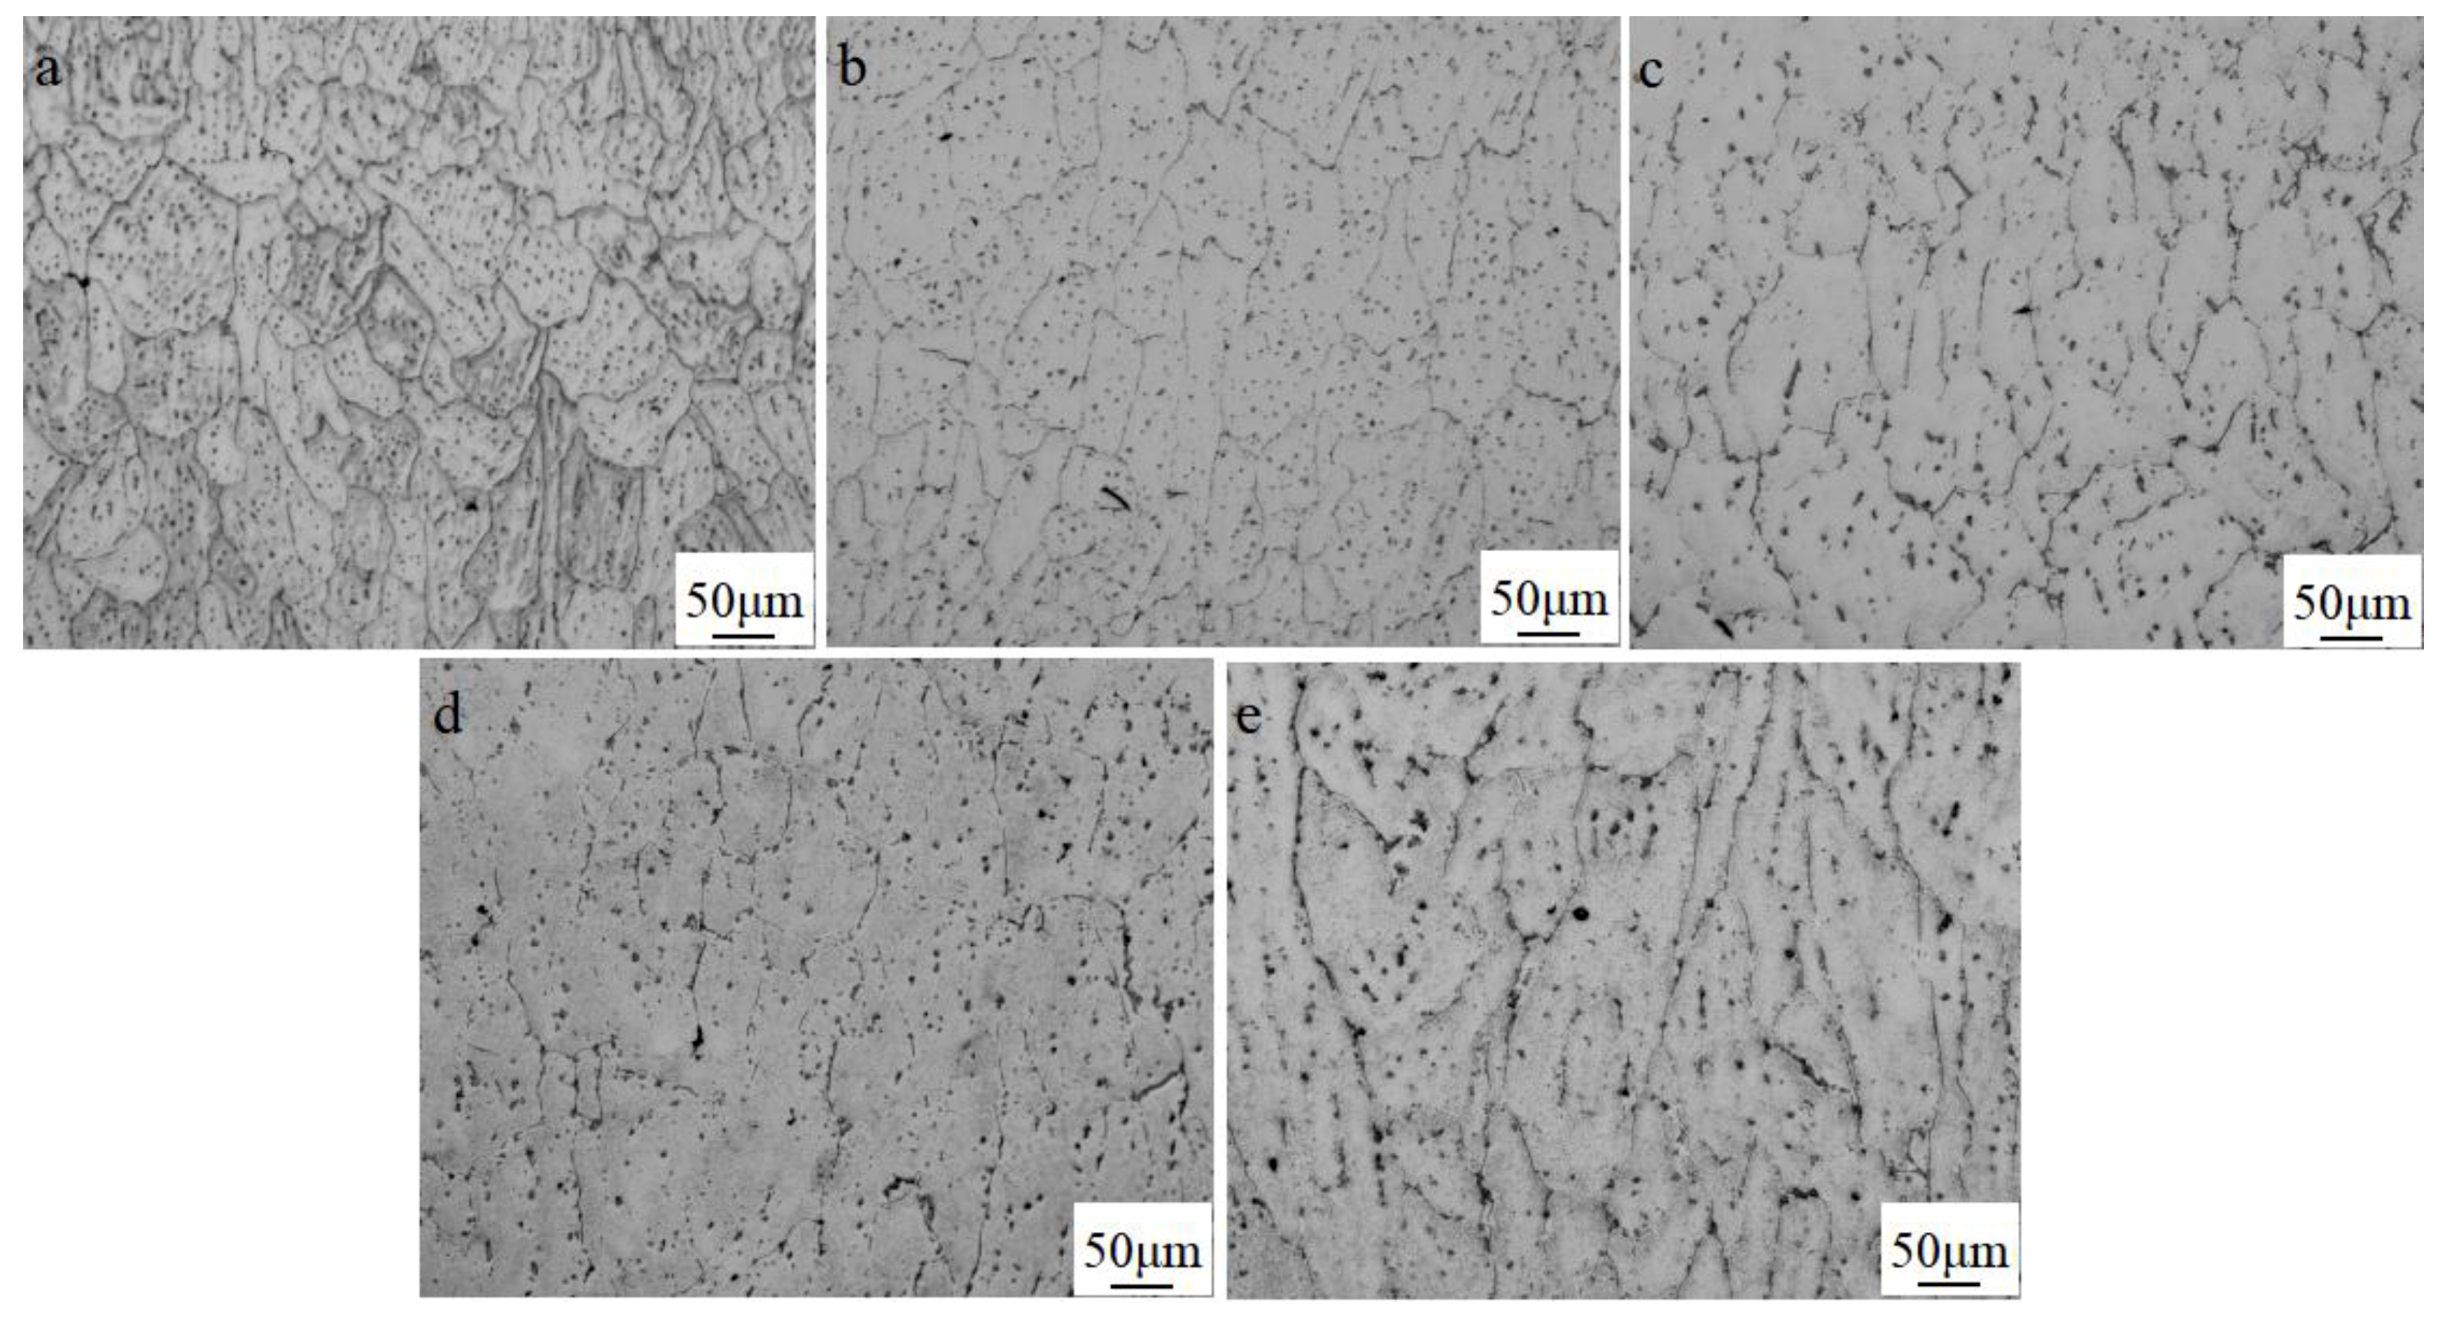
The microstructure of the deposits with different heat input in an as-deposited state is shown in Figure 4. It can be seen from this figure that with increased heat input, the grain size of the deposits in the as-deposited state gradually increases, and the shape of the grains gradually change from isometric crystals to columnar crystals. When the heat input is 30 J/mm, the grains are all isometric crystals. When the heat input is increased to 60 J/mm, 90 J/mm, 120 J/mm, the grains are a mixture of isometric crystals and columnar crystals, and the proportion of columnar crystals gradually increases. This is due to the increase of heat input, which causes the solidification rate of the molten pool to decrease, and the grains grow along the direction of the temperature gradient of the deposit. When the heat input reaches 150 J/mm, the grains of the deposit are all columnar crystals, and the grain direction is parallel to the growth direction of the deposit. Since the heat transfer coefficient of aluminum is much larger than that of air, the direction of the temperature gradient is parallel to the growth direction of the deposit.
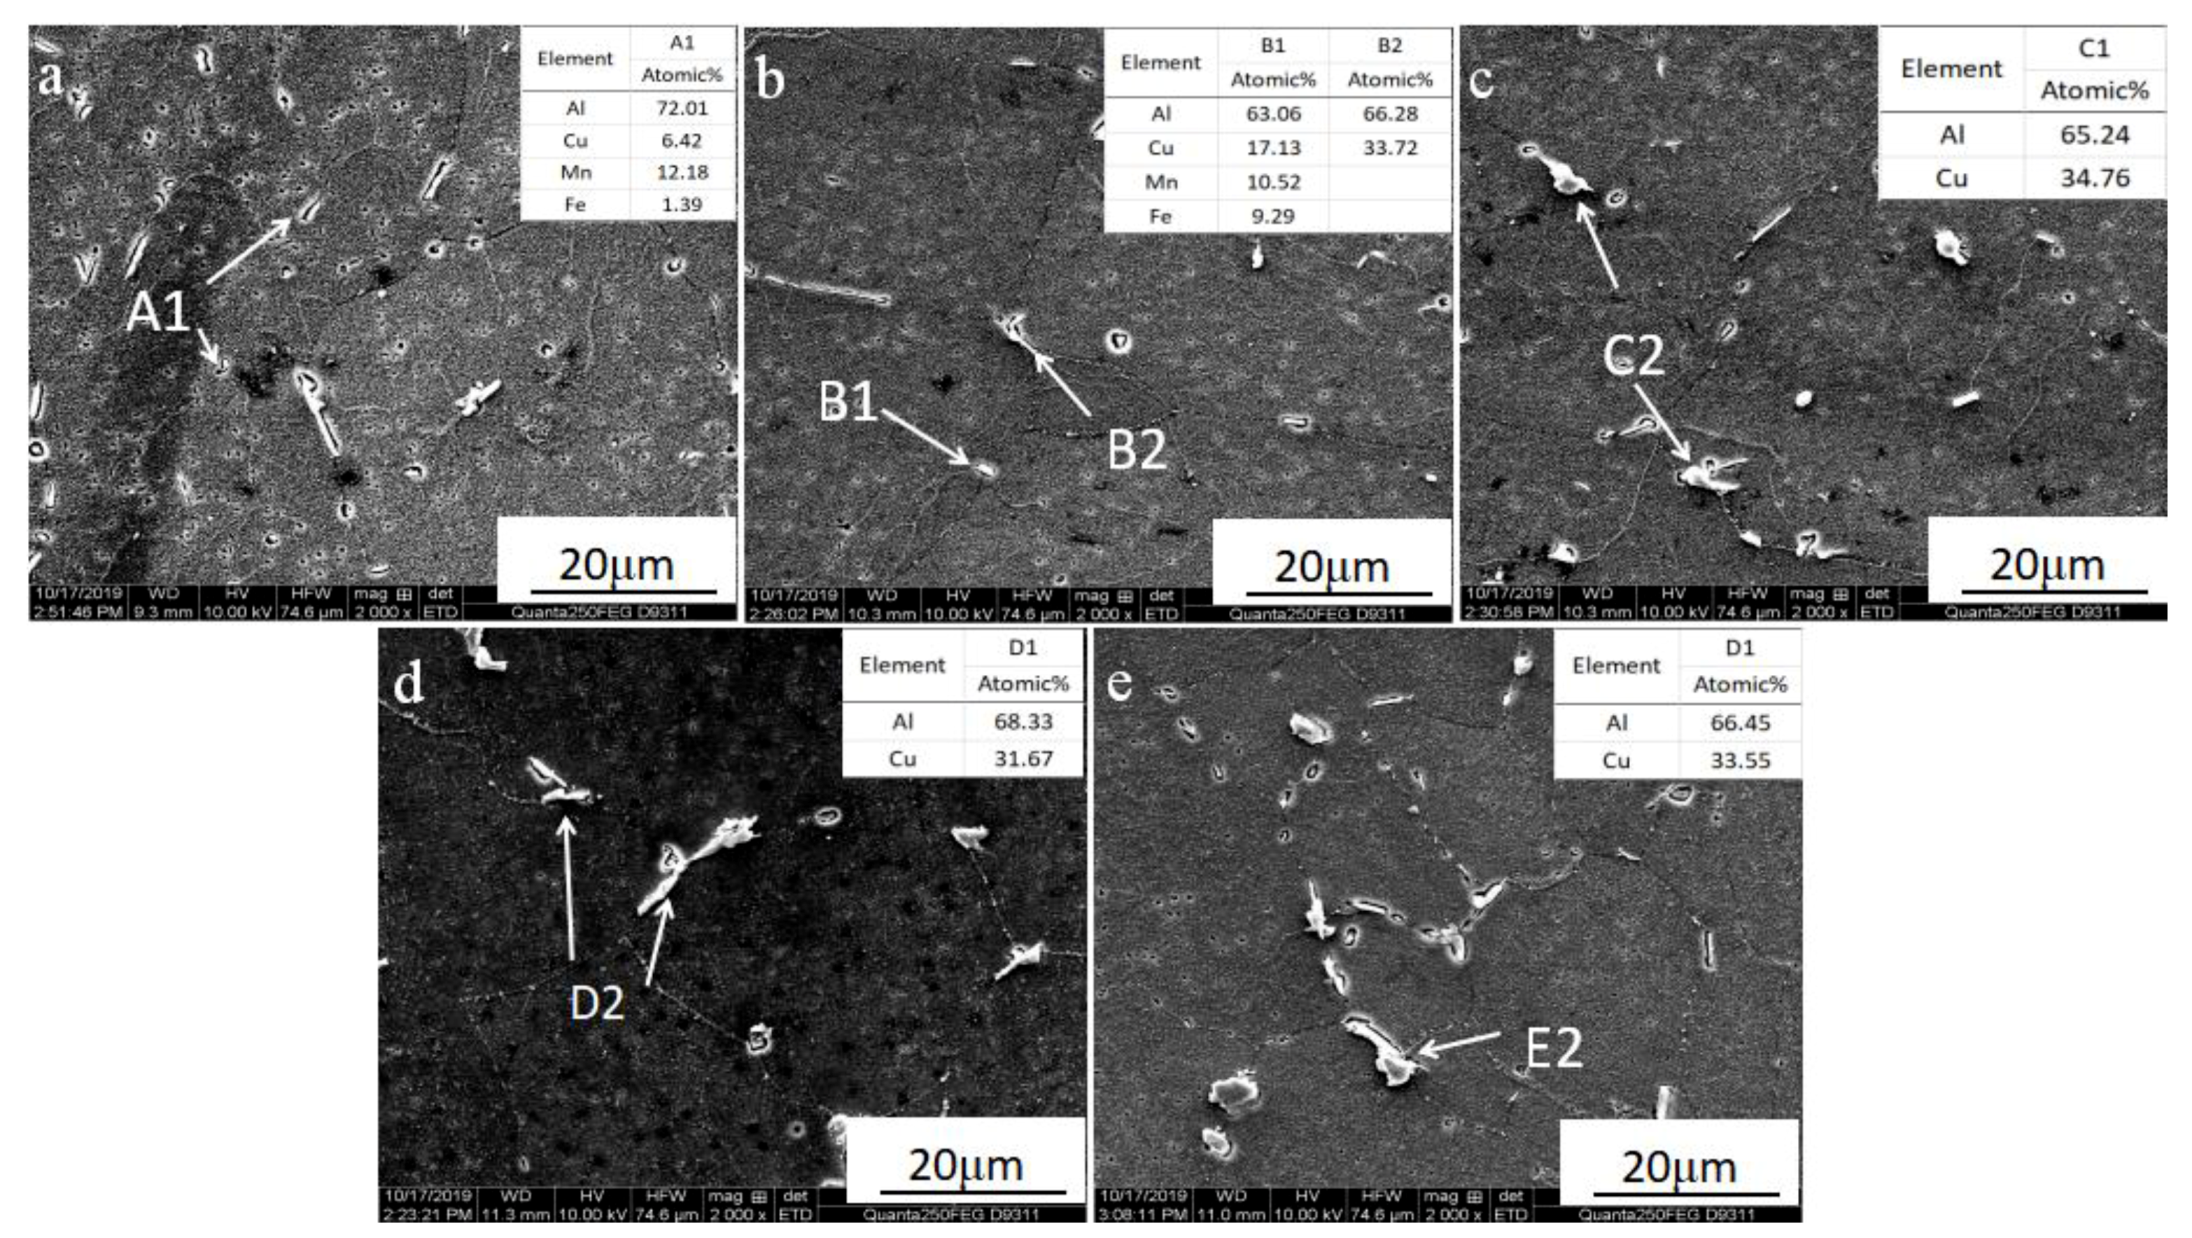
The SEM and EDS of the deposits with different heat input are shown in Figure 5. It can be seen from this figure that the precipitated phases of the deposits with different heat input are the same, mainly the long and massive θ (Al2Cu) phases, and the small-sized bulk T (Al12Mn2Cu) phases, as shown in Figure 4a. In Al-Cu alloy, the number of eutectic structures combined with Sheil’s law can be calculated from Equation (3) [18]:
fs = (CeC1−1) k01 − 1
Among them, Ce represents the content of Cu in the eutectic structure, and its value is 0.33; C1 is the mass fraction of Cu in the alloy, its value is 0.05, and k0 is the equilibrium distribution coefficient of the Cu element, taking the value of 0.17. It can be seen from the formula that the heat input does not have much influence on the content of the eutectic structure in the deposit. However, it can be seen from Figure 5 that the heat input has a greater effect on the morphology and distribution of the θ phases. As the amount of heat input increases, the number of precipitated θ phases in the grain gradually decreases, and their number on the grain boundaries increases. The size increases are shown in Figure 5a–c. When the heat input amount reaches 120 J/mm, the precipitated phases in the grains basically disappear, as shown in Figure 5d. When the heat input reaches 150 J/mm, the number of large-scale massive precipitated phases on the grain boundaries increases and there is segregation, as shown in Figure 5e. When the size of the precipitated θ phase is large, the potential energy barrier for them dissolve into the matrix is increased. Conducive to the dissolution of the θ phase in the solid solution process.

3.3.2. Microstructure of Deposits in T6 State

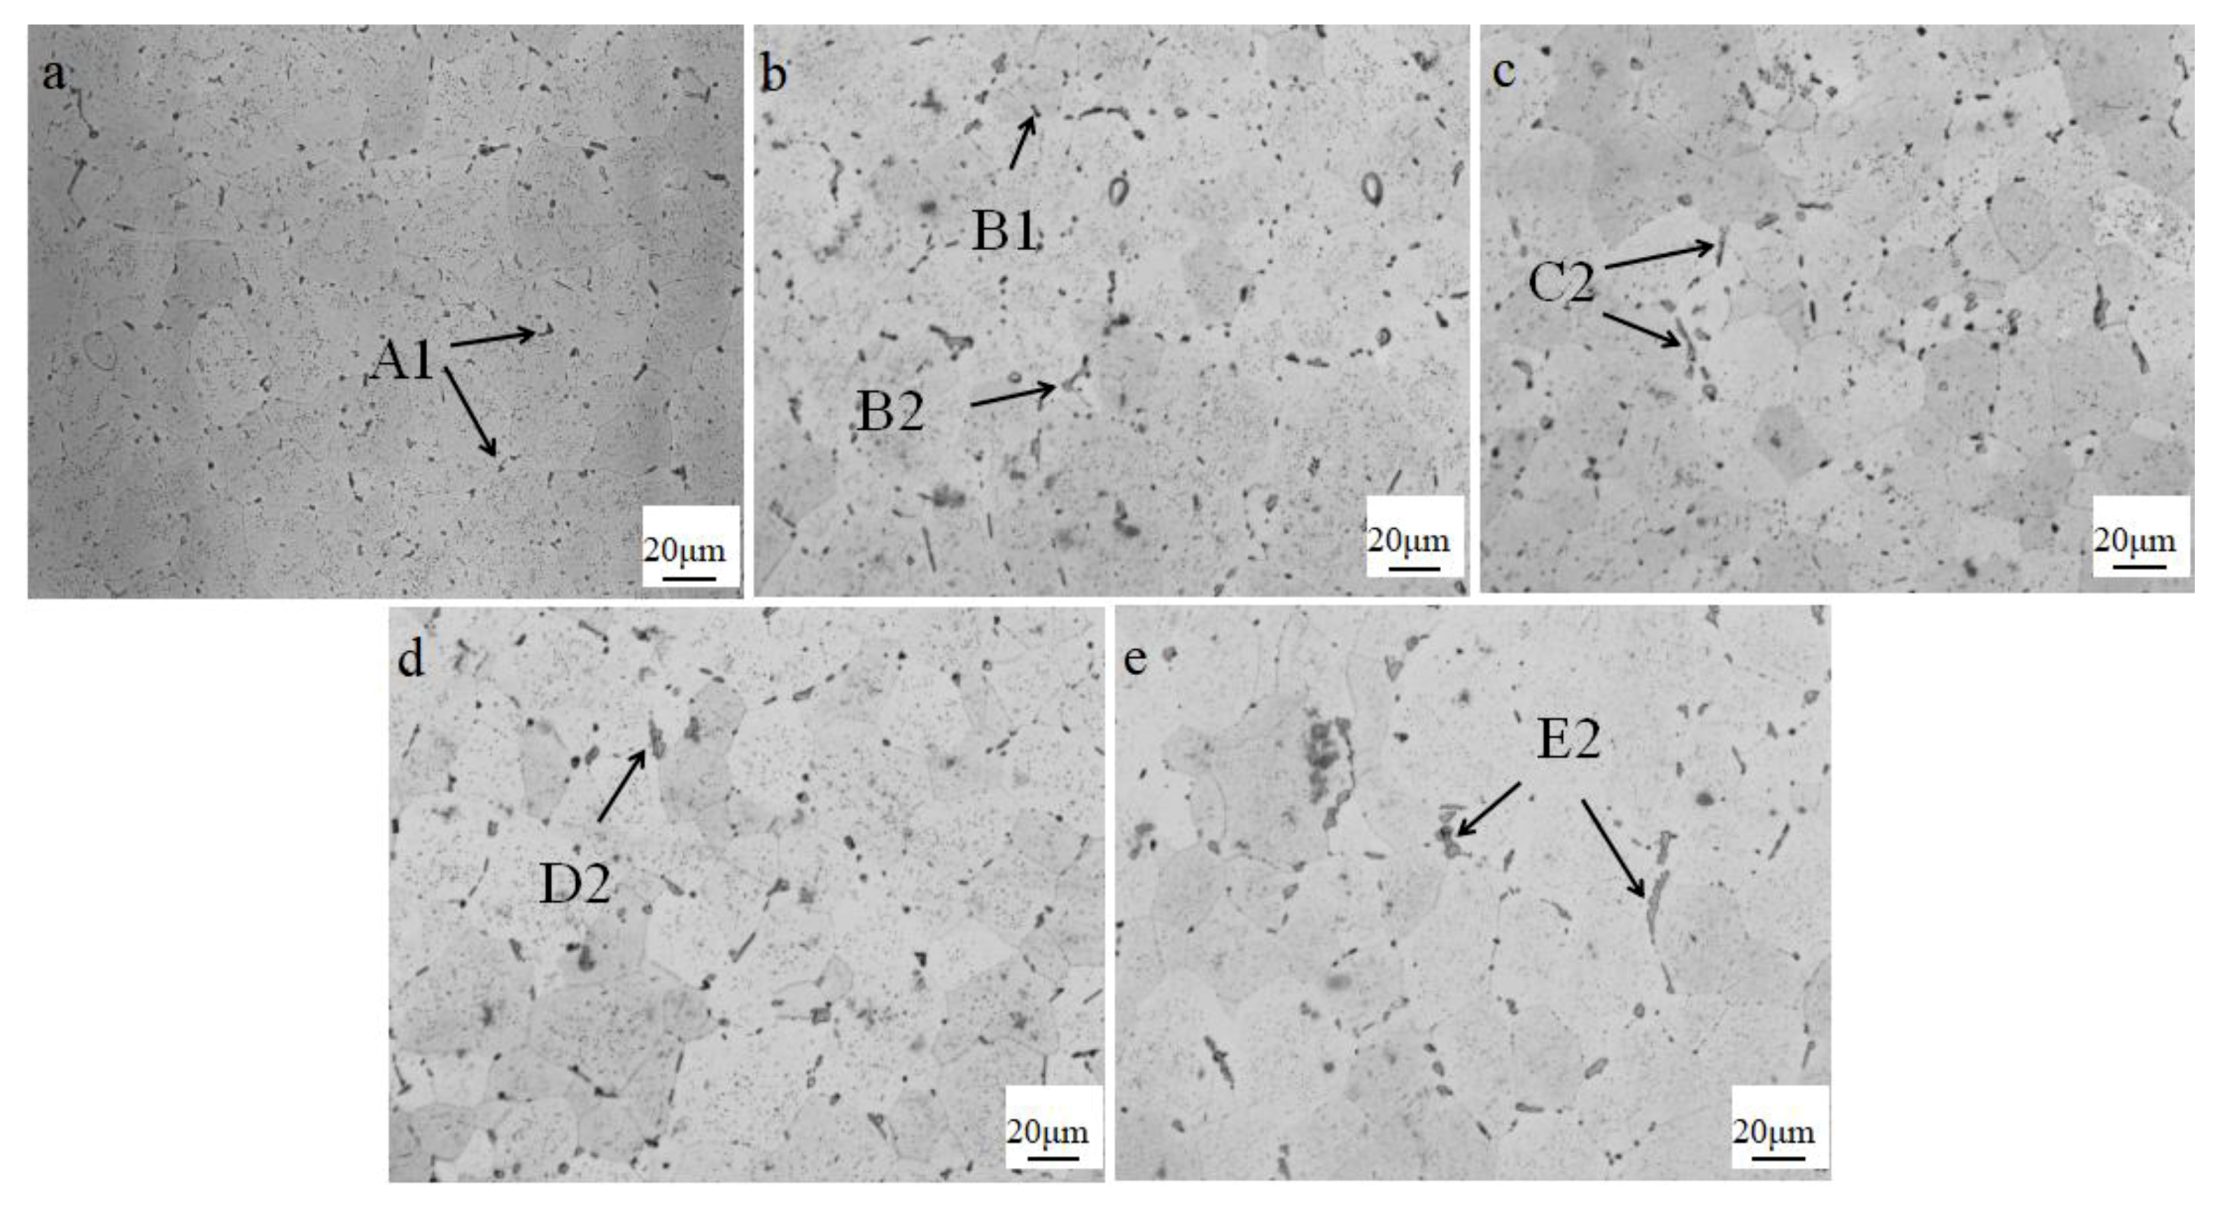
The microstructure of deposits with different heat input after heat treatment are shown in Figure 6. It can be seen from this figure that after heat treatment, all the columnar crystals in the as-deposited state were transformed into isometric crystals, which is due to the quenching and tempering effect. When the heat input is 30 J/mm, the grain size of the deposit was about 30 μm, and the size of grain was uniform. With increased heat input, the grain size of the deposits increased continuously, and the uniformity of the grain size decreased. When the heat input reached 150 J/mm, columnar crystals still existed after heat treatment.
It can be seen from Figure 6 that when the heat input is 30 J/mm, in the deposit only the small-sized black phases were dispersedly distributed on the grain boundaries after heat treatment, as shown in A1 of Figure 6a. When the heat input reached 60 J/mm, in addition to the black phases, a small amount of gray irregular shapes were distributed on the grain boundaries, as shown in B2 of Figure 6b. When the welding heat input further increased, the number of irregular gray phases in the microstructure increased and the size increased, as shown in C2, D2, and E2 in Figure 6c–e. From the SEM and EDS of the deposits with different heat inputs, it can be seen that the small black precipitated phase is the remelted T phase, as shown in A1 of Figure 7a, and the irregularly shaped gray precipitated phase is the θ phase, as shown in B2 of Figure 7b. The θ phases were not completely dissolved in the matrix during the solid solution process. It can be seen from the SEM that when the amount of heat input is higher, the number of unsolved θ phases is higher after heat treatment, and their size is larger. This is because the higher the heat input, the size of the primary θ phase on the grain boundary is larger, and it is more difficult for it to dissolve in the Al substrate during solution treatment. The amount of Cu dissolved in the matrix directly determines the density, size and phase spacing of the main strengthening phase θ, during the aging process [19]. These undissolved θ phases have the effect of pinning grain boundaries when the size is small, but when the size is large as an intermetallic compound, it is the crack initiation position during fracture, which has a large negative impact on mechanical properties.

3.3.3. Strengthening Phase at Peak Aging

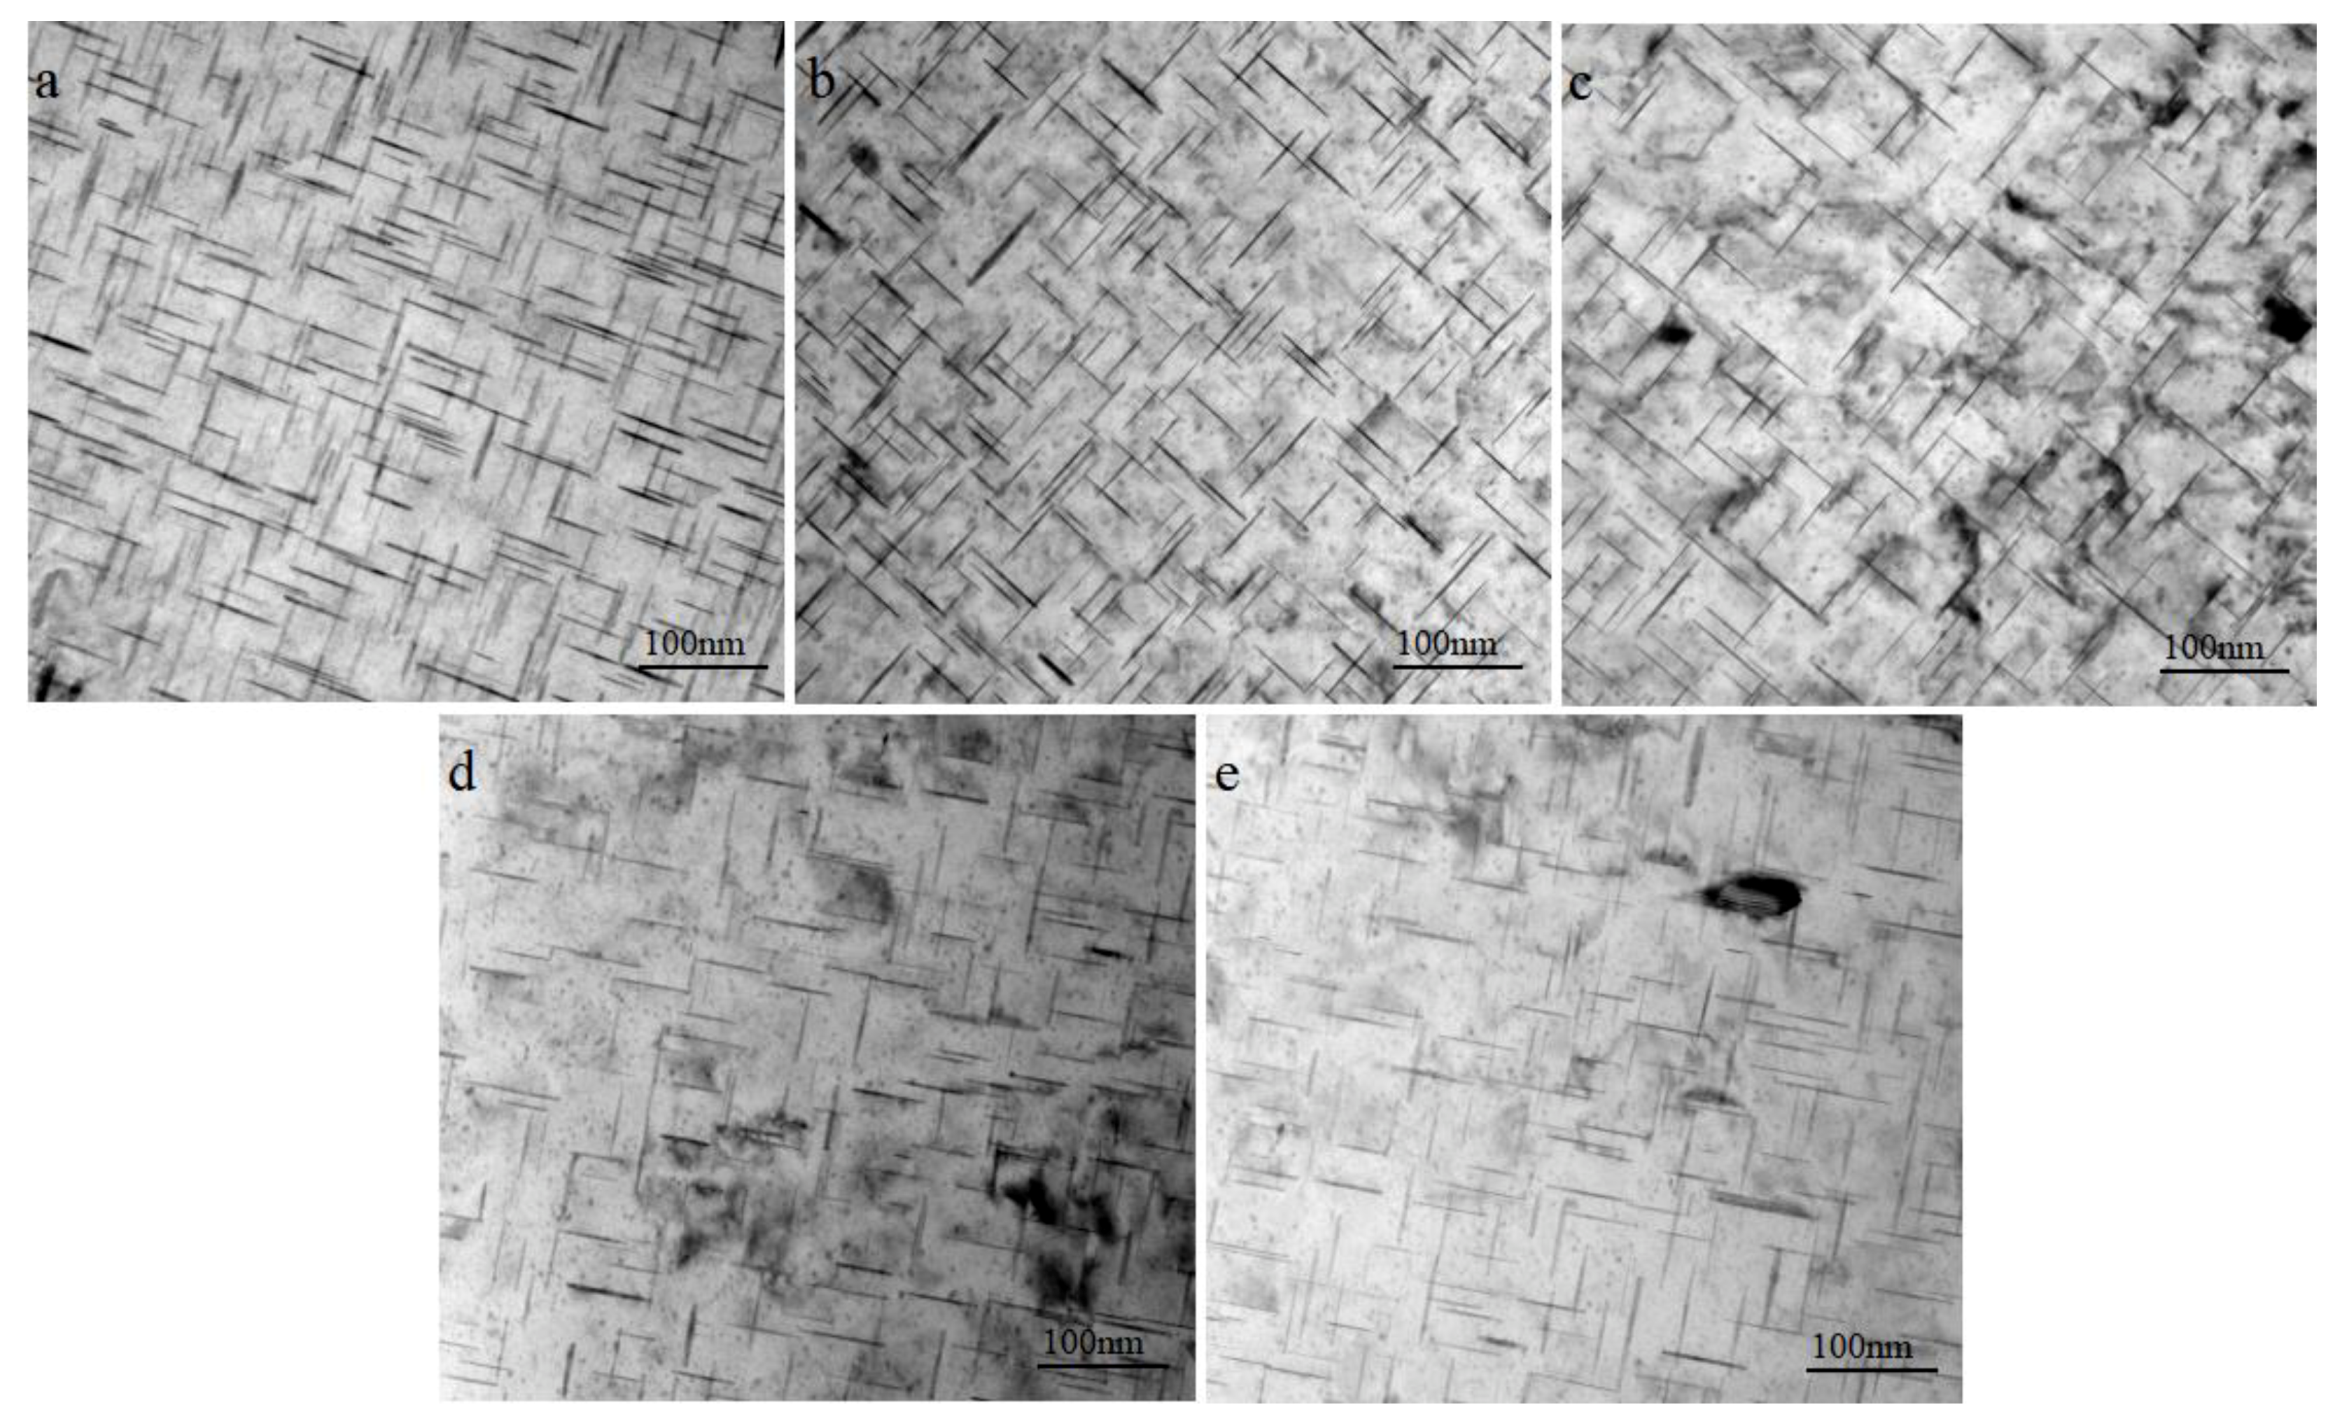
The θ phase is the main strengthening phase of Al-Cu alloy, and its size and density directly affect the mechanical properties of the alloy. Figure 8 shows the morphology of the strengthened θ phases at the peak aging state of different heat input deposits. It can be seen from the figure that along the 001 band axis, precipitates of the deposits with different heat inputs have the same morphology at the peak aging state, all of them are θ phases [20]. When the heat input is 30 J/mm, the size of θ phases are uniform, showing a diffuse dense distribution, as shown in Figure 8a. As the heat input increases, the phase density decreases and the phase spacing increases. The aging precipitation process of Al-Cu alloy is [21]: supersaturated solid solution (α ss) - GP zone (GP I) – θ” (GP II) – θ’ - θ. The copper atoms diverged to form the GP region and thus, the θ phase is formed. Thus the number of copper atoms solid-dissolved in the Al matrix determines the number of precipitated θ phases. As the heat input increases, the size of the θ phase increases; as shown in Figure 5, the number of θ phases remaining after solution treatment increases, and the number of Cu atoms dissolved in the aluminum matrix decreases, resulting in the number of precipitated θ phases decreases during the aging process.

3.4. Mechanical Properties and Fracture Morphology of the Wall

3.4.1. Mechanical Properties of the Wall

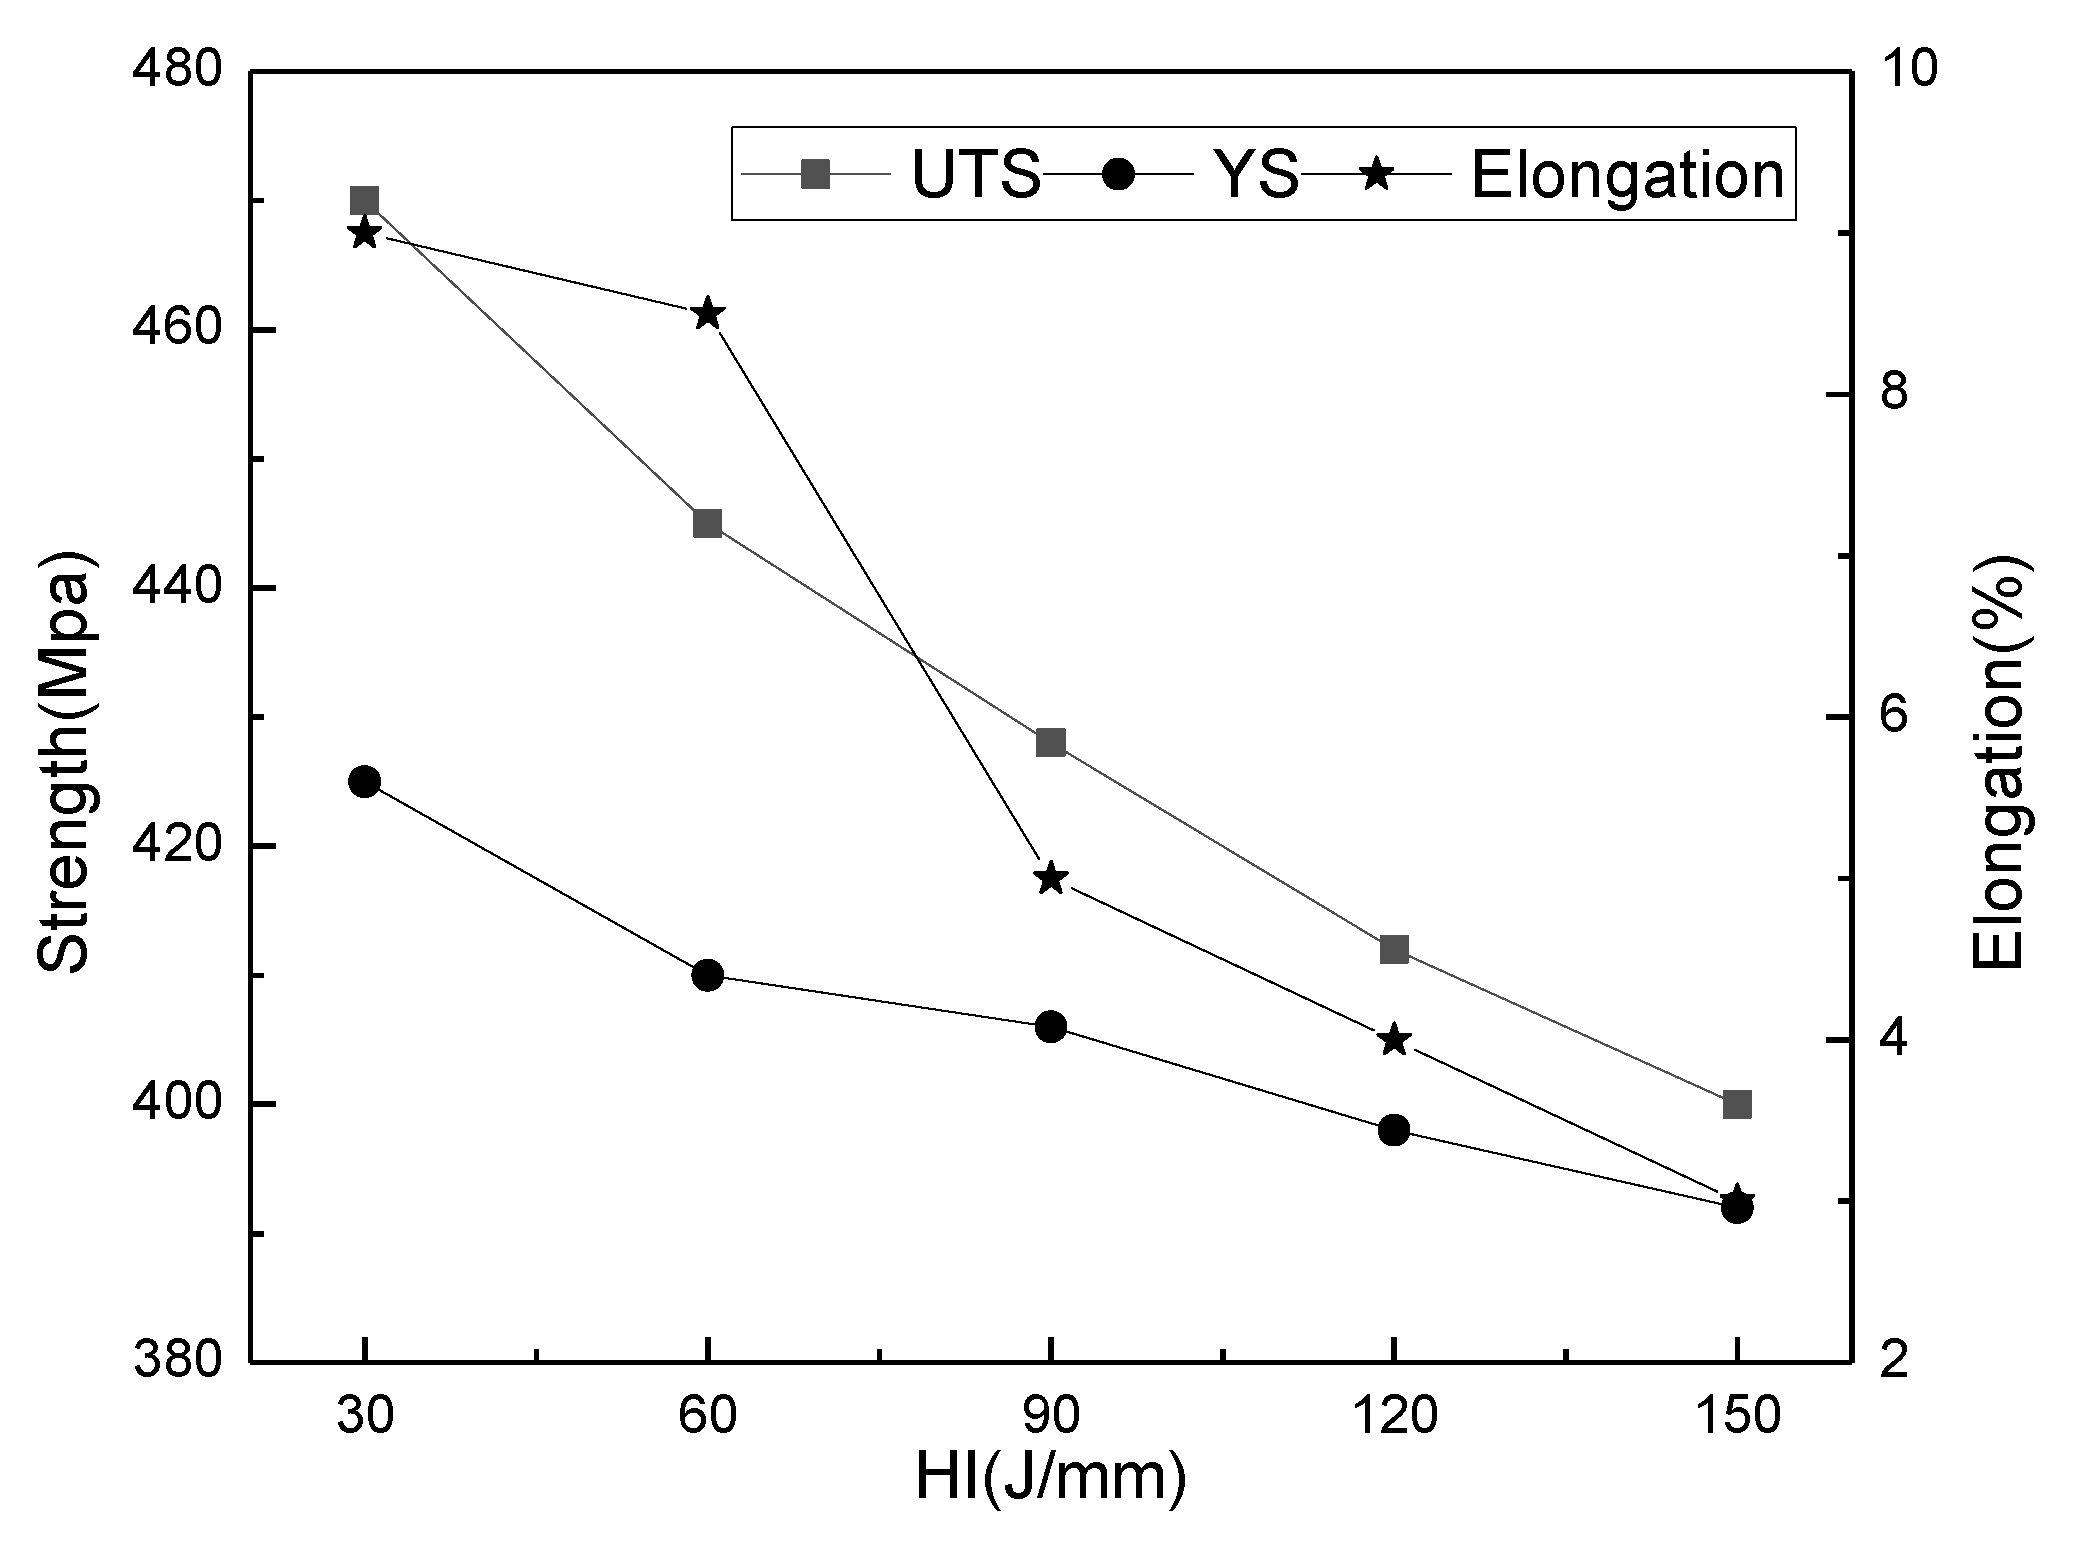
The mechanical properties of deposits with different heat input are shown in Figure 9. It can be seen from the figure that when the heat input is 30 J/mm, the mechanical properties of the deposit are: tensile strength: 470 Mpa, yield strength: 425 Mpa, elongation: 9%. With the increase of heat input, the mechanical properties of the deposits decrease significantly. The main reason is that with the increase of heat input, the grain size of the deposits increases, and the size of the precipitated phases increases, which leads to incomplete dissolution of the θ phase in the solid solution process. As a result, a smaller number of θ phases are precipitated during the aging process. When the heat input increases from 60 J/mm to 90 J/mm, the elongation decreases greatly, mainly due to the large number of pores present in the heat input = 90 J/mm deposit, which reduces elongation.

3.4.2. Fracture Morphology of Deposits

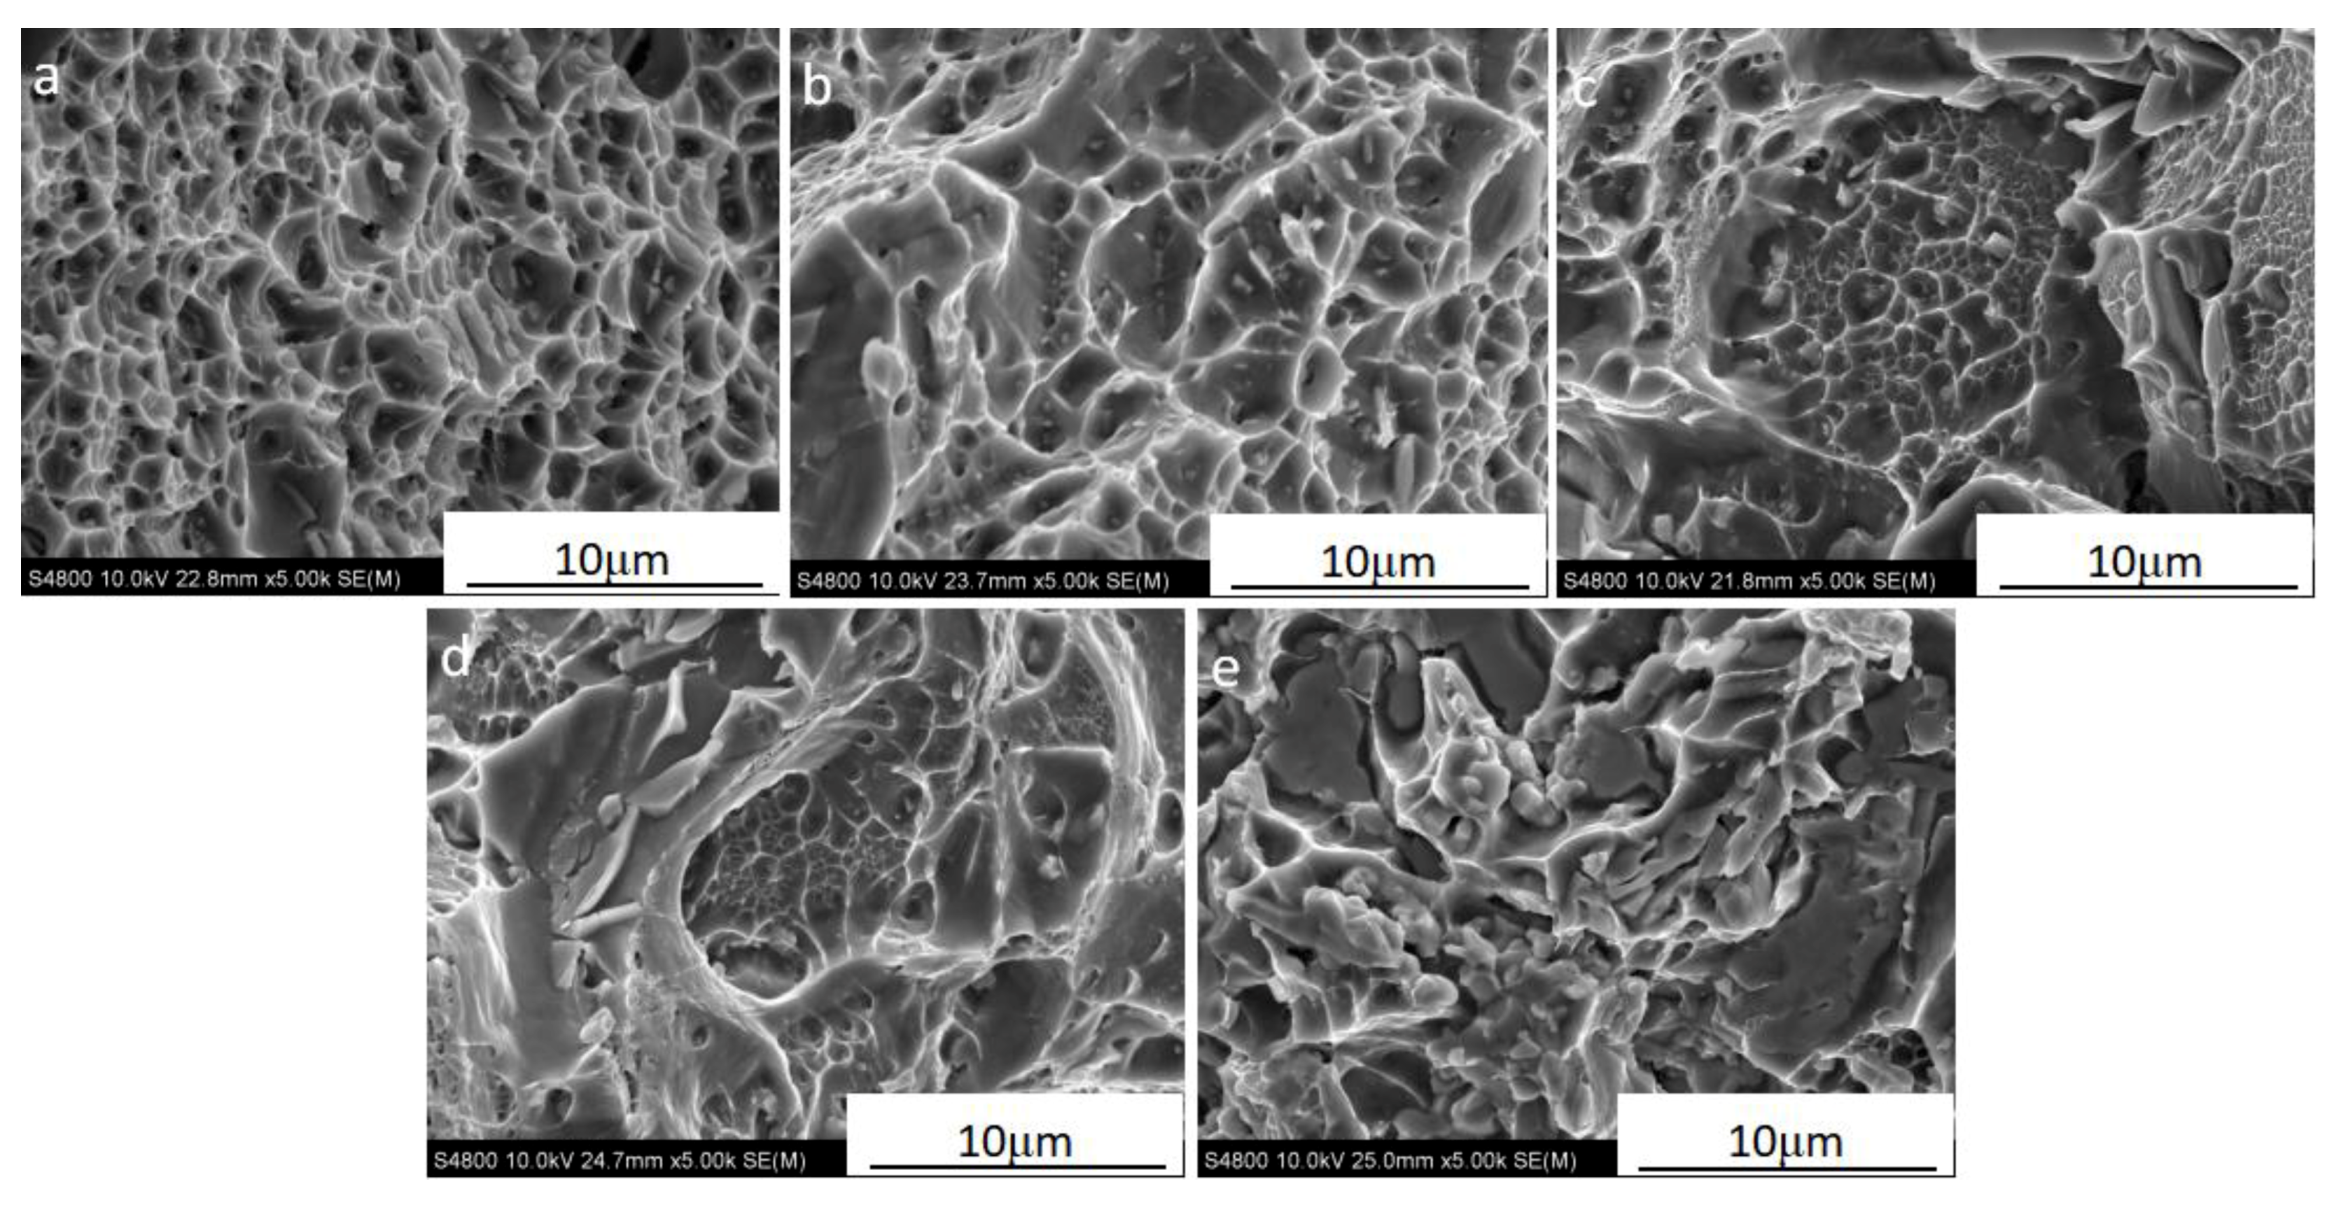
The fracture morphologies of different heat input deposits are shown in Figure 10. It can be seen from the figure that when the heat input was 30 J/mm and 60 J/mm, the fractures of the deposits were composed of a large number of dimples. The dimples were evenly distributed, the size was small, and the depth was large, indicating that the deposits have good toughness. When the heat input was increased to 90 J/mm, the size of the dimples increased and the depth decreased, which indicates that the toughness of the deposit is worse. At this temperature, the fracture mode of the deposit is still the ductile fracture. When the heat input reached 120 J/mm, in addition to the dimples, there were cleavage surfaces in the fracture. The fracture of the deposit is a mixed fracture. When the heat input was further increased to 150 J/mm, there were no dimples in the fracture, and the fracture mode was a brittle fracture. The change of the fracture mode of the deposits is mainly due to the number of grain boundaries and the width of the grain boundaries [22]. With the increase of heat input, the grain size increased, resulting in a reduction in the number of grain boundaries. The remaining precipitated phases after solution treatment increased the width of the grain boundaries, which resulted in a change in the fracture mode of the deposit.

4. Conclusions

In this experiment, Al-Cu-Sn alloy deposits with different heat inputs were formed by the WAAM process. The microstructure and mechanical properties in as-deposited state and T6 state of the deposited were investigated. The following conclusions can be drawn:
(1)
WAAM Al-Cu-Sn alloy deposits, as the heat input increased, the size and number of pores increased. The size of grains also increased. After solution treatment, the number of undissolved θ phases increased. The number of θ phases decreased and phase spacing increased. When the heat input was greater than 90 J/mm, pore size in the bulk material was greater than 50 μm, grains were mainly columnar in the as-deposited state. After heat treatment, there were a large number of un-dissolved θ phases on the grain, and the distribution of θ’ phases was sparse;
(2)
In WAAM Al-Cu-Sn alloy deposits, as the heat input increased, the mechanical properties of the deposits decreased. When the heat input was greater than 90 J/mm, the fracture characterization of this sample showed brittle fracture characteristics.

Author Contributions

Conceptualization, Y.Z. and P.M.; methodology, W.W.; software, C.L. and Z.W.; validation, S.W., L.R. and H.G.; formal analysis, S.W.; investigation, L.R.; resources, W.W.; data curation, H.G.; writing—original draft preparation, S.W.; writing—review and editing, S.W.; visualization, S.W. and C.L.; supervision, W.W.; project administration, W.W. All authors have read and agreed to the published version of the manuscript.

Funding

This research received no external funding.

Acknowledgments

This work was supported by the National Key Research and Development Plan “additive manufacturing and laser manufacturing” key project (grant number 2018yfb1106300-5). The advice and assistance provided by Wei Wang and Yuchun Zhai from Northeastern University are also greatly appreciated.

Conflicts of Interest

The authors declare no conflict of interest.

References

  1. Liu, J.; Kulak, M. A new paradigm in the design of aluminum alloys for aerospace applications. Mater. Sci. Forum 2000, 331, 127–140. [Google Scholar] [CrossRef]
  2. Jongbeom, L.; Jeongmin, P.; Haguk, J. Effect of strain on mechanical and microstructural properties of Al/Cu claddings during caliber-rolling. Mater. Lett. 2018, 222, 122–125. [Google Scholar]
  3. Rooy, E.L. Metals Handbook; ASM International: Materials Park, OH, USA, 1988; Volume 15, pp. 743–770. [Google Scholar]
  4. Bikas, H.; Stavropoulos, P.; Chryssolouris, G. Additive manufacturing methods and modelling approaches: A critical review. Int. J. Adv. Manuf. Technol. 2015, 83, 389–405. [Google Scholar] [CrossRef] [Green Version]
  5. Stavropoulos, P.; Foteinopoulos, P. Modelling of additive manufacturing processes: A review and classification. Manuf. Rev. 2018, 5, 2. [Google Scholar] [CrossRef] [Green Version]
  6. Cong, B.; Ding, J.; Williams, S.W. Effect of arc mode in cold metal transfer process on porosity of additively manufactured Al-6.3% Cu alloy. Int. J. Adv. Manuf. Technol. 2015, 76, 1593–1606. [Google Scholar] [CrossRef]
  7. Gu, J.L. Study on Microstructure and Mechanical Properties of Additively Manufactured Al-Cu-(Mg) Alloys with the CMT Process. Ph.D. Thesis, Northeastern University, Shenyang, China, 2016. [Google Scholar]
  8. Wang, S.; Gu, H.; Wang, W.; Li, C.; Ren, L.; Wang, Z.; Zhai, Y.; Ma, P. Microstructure and mechanical properties of aluminum alloy (ZL205A) wall produced by wire arc additive manufacturing method. Rare Metal Mater. Eng. 2019, 48, 2910–2916. [Google Scholar]
  9. Qi, Z.; Cong, B.; Qi, B.; Zhao, G.; Ding, J. Properties of wire+ arc additively manufactured 2024 aluminum alloy with different solution treatment temperature. Mater. Lett. 2018, 230, 275–278. [Google Scholar] [CrossRef] [Green Version]
  10. Ganaha, T.; Pearce, B.P.; Kerr, H.W. Grain structures in aluminum alloy GTA welds. Metall. Trans. A 1980, 11, 1351–1359. [Google Scholar] [CrossRef]
  11. Katayama, S. Solidification phenomena of weld metals (1st report). Characteristic solidification morphologies, microstructures and solidification theory. Weld. Int. 2000, 14, 25–37. [Google Scholar] [CrossRef]
  12. Cong, B.; Ouyang, R.; Qi, B.; Ding, J. Influence of cold metal transfer process and its heat input on weld bead geometry and porosity of aluminum-copper alloy welds. Rare Metal Mater. Eng. 2016, 45, 0606–0611. [Google Scholar] [CrossRef]
  13. Ferrie, E.; Buffiere, J.; Ludwig, W. 3D characterisation of the nucleation of a short fatigue crack at a pore in a cast Al alloy using high resolution synchrotron microtomography. Int. J. Fatigue 2005, 27, 1215–1220. [Google Scholar] [CrossRef]
  14. Hua, G.; Ahmadi, H.; Nouri, M.; Li, D. Positive effect of yttrium on the reduction of pores in cast Al alloy. Mater. Chem. Phys. 2015, 149, 140–144. [Google Scholar] [CrossRef]
  15. Fujii, H.; Nogi, K. Formation and disappearance of pores in aluminum alloy molten pool under microgravity. Sci. Technol. Adv. Mater. 2004, 5, 219–223. [Google Scholar] [CrossRef]
  16. Guang, R.J.; Liu, Y.; Li, Y.X. A model for calculating hydrogen solubility in molten aluminum alloys. Acta Metall. Sin. 2008, 2, 129–133. [Google Scholar]
  17. Zhang, W. Metal Fusion Welding Principle and Technology; Machinery Industry Press: Beijing, China, 1983; pp. 160–169. [Google Scholar]
  18. Grong, O. Metallurgical Modelling of Welding; Institute of Materials: London, UK, 1997. [Google Scholar]
  19. Hall, M.G.; Haworth, C.W. Dissolution of θ phase in Al-5% Cu. Acta Metall. 1970, 18, 331–337. [Google Scholar] [CrossRef]
  20. Banerjee, S.; Robi, P.S.; Srinivasan, A.; Lakavath, P.K. Effect of trace additions of Sn on microstructure and mechanical properties of Al–Cu–Mg alloys. Mater. Des. 2010, 31, 4007–4015. [Google Scholar] [CrossRef]
  21. Badin, C.; Marino, F.; Verne, E. Calorimetric study on precipitation path in 2024 alloy and its SiC composite. Mater. Sci. Eng. A 1995, 191, 185–191. [Google Scholar] [CrossRef]
  22. Anyalebechi, P.N. Hydrogen-induced gas porosity formation in Al-4.5wt% Cu-1.4 wt% Mg alloy. Mater. Sci. 2013, 48, 5342–5353. [Google Scholar] [CrossRef]
Figure 1. (a) Additive manufacture system and (b) definition of coordinates for wall.
Metals 10 00079 g001
Figure 2. The thickness and layer height of the deposits change with the heat input.
Metals 10 00079 g002
Figure 3. Pores of deposits with different heat input. (a) 30 J/mm; (b) 60 J/mm; (c) 90 J/mm; (d) 120 J/mm; (e) 150 J/mm.
Metals 10 00079 g003
Figure 4. Microstructure of deposits with different heat input in as-deposited state. (a) 30 J/mm; (b) 60 J/mm; (c) 90 J/mm; (d) 120 J/mm; (e) 150 J/mm.
Metals 10 00079 g004
Figure 5. SEM of deposits with different heat input in as-deposited state. (a) 30 J/mm; (b) 60 J/mm; (c) 90 J/mm; (d) 120 J/mm; (e) 150 J/mm.
Metals 10 00079 g005
Figure 6. Microstructure of deposits with different heat input in T6 state. (a) 30 J/mm; (b) 60 J/mm; (c) 90 J/mm; (d) 120 J/mm; (e) 150 J/mm.
Metals 10 00079 g006
Figure 7. SEM and EDS of deposits with different heat inputs in T6 state. (a) 30 J/mm; (b) 60 J/mm; (c) 90 J/mm; (d) 120 J/mm; (e) 150 J/mm.
Metals 10 00079 g007
Figure 8. Morphology of the strengthened θ phases of different heat input deposits at the peak aging state. (a) 30 J/mm; (b) 60 J/mm; (c) 90 J/mm; (d) 120 J/mm; (e) 150 J/mm.
Metals 10 00079 g008
Figure 9. Mechanical properties of deposits with different heat input.
Metals 10 00079 g009
Figure 10. Fracture morphologies of different heat input deposits. (a) 30 J/mm; (b) 60 J/mm; (c) 90 J/mm; (d) 120 J/mm; (e) 150 J/mm.
Metals 10 00079 g010
Table 1. Chemical composition of the raw material.
ElementFeSiMgCuMnTiSnZrBV
Content (wt.%)0.1000.0400.0255.1020.4210.2720.1030.1770.0340.125
Table 2. Print parameters.
Heat Input (J·mm−1)I/AU/VνWFS/m·min−1νTS/m·min−1
15012517.76.111.8
120106175.312
908016.54.011.7
606314.63.712.3
305514.62.921.4