Article

Study on Dynamic Mechanical Properties and Constitutive Model Construction of TC18 Titanium Alloy

1
School of Mechanical and Precision Instrument Engineering, Xi’an University of Technology, Xi’an 710048, China
2
School of Mechanical Engineering, Shaanxi University of Technology, Hanzhong 723000, China
*
Authors to whom correspondence should be addressed.
Metals 2020, 10(1), 44; https://doi.org/10.3390/met10010044
Submission received: 11 November 2019 / Revised: 20 December 2019 / Accepted: 21 December 2019 / Published: 25 December 2019

Abstract

:
In order to investigate the static and dynamic mechanical properties of TC18 titanium alloy, the quasi-static stress–strain curve of TC18 titanium alloy under room temperature was obtained by DNS 100 electronic universal testing machine (Changchun Institute of Mechanical Science Co., Ltd., Changchun, China). Meanwhile, the flow stress–strain curves under different temperatures and strain rates are analyzed by split Hopkinson pressure bar (SHPB) device with synchronous assembly system. On the basis of the two experimental data, the JC constitutive model under the combined action of high temperature and impact load is established using the linear least squares method. The results show the following: the yield strength and flow stress of TC18 titanium alloy increase slowly with the increase of the strain rate, and the strain value corresponding to the yield strength is reduced. With the increase of strain, the flow stress increases at first and then decreases at different temperatures. The strain value corresponding to the transition point rises with the temperature increase, and the corresponding stress value remains basically unchanged. With the increase of experimental temperature, the flow stress shows a downward trend, and the JC constitutive model can predict the plastic flow stress well.

1. Introduction

TC18 (Ti–5Al–5Mo–5V–1Cr–1Fe) is a high strength α + β titanium alloy developed by the Soviet Union, and it has excellent comprehensive properties such as high strength, good corrosion resistance, high temperature resistance, good elongation, and section shrinkage [1,2,3]. Therefore, it is widely used in aerospace, ship, and weapon industries [4,5,6,7]. However, TC18 titanium alloy has the characteristics of low plasticity, low thermal conductivity, low modulus of elasticity, and strong chemical activity [8,9,10]. It needs more cutting force and consumes more power in the cutting process. At the same time, the heat generated is not easy to be transmitted out, so the temperature in the cutting zone rises and the sticking phenomenon is serious, which aggravates the wear of the tool and causes serious damage to the machined surface. This shows that TC18 titanium alloy has poor machinability, so it is necessary to study the dynamic mechanical properties of TC18 titanium alloy.
At present, scholars at home and abroad have done some research on the dynamic mechanical properties of TC18 titanium alloy. Zhang et al. [11] conducted solution quenching treatment on TC18 titanium alloy, and studied the microstructure evolution of β phase and (α + β) phase in the aging process of TC18 titanium alloy. Balaykin et al. [12] conducted high temperature bending test on Ti–5Al–5Mo–5V–1Cr–1Fe titanium alloy, and analyzed the relationship between the homogeneity of grain structure and annealing time. Ran et al. [13] conducted static and dynamic compression experiments on TC18 titanium alloy, and studied the plastic deformation and fracture behavior of TC18 titanium alloy at room temperature, medium, and high strain rate. The results show that the strain hardening effect and strain rate strengthening effect of TC18 titanium alloy are obvious, and collapse of the specimens occurs along a plane inclined at an angle of about 45° to the compression axis under quasi-static and dynamic compression loads at room temperature. Luo et al. [14] conducted isothermal compression experiments on TC18 titanium alloy, studied the influence of process parameters on grain size and volume fraction, and clarified the deformation mechanism of TC18 titanium alloy. Shi et al. [15] studied the relationship between three kinds of microstructure of TC18 titanium alloy and its fatigue properties and micro-hardness before and after fatigue, and analyzed the correlation between fatigue strength and hardness decline under different microstructure. Luo et al. [16] conducted dynamic compression experiments on TC18 titanium alloy at different temperatures, strain rates, and strains, and studied the influence of process parameters on its rheological stress, strain rate sensitivity, and strain hardening index. Niex et al. [17] conducted creep experiments on TC18 titanium alloy at different temperatures and tensile stresses, studied the influence of microstructure on its creep behavior, and analyzed the creep mechanism. Zrebtsov et al. [18] carried out compression experiments at high temperature and high strain on Ti–5Al–5Mo–5V–1Cr–1Fe titanium alloy. The microstructure evolution of Ti–5Al–5Mo–5V–1Cr–1Fe titanium alloy at high temperature and high strain has been studied by means of scanning electron microscope (SEM) and transmission electron microscope (TEM), and it is concluded that the microstructure evolution of β phase is the main factor affecting the microstructure evolution at both temperatures. Wang et al. [19] studied the fatigue crack growth mechanism of TC18 titanium alloy, and concluded that the deformation crack growth path of specimen can prolong the fatigue crack growth life. Therefore, scholars at home and abroad have mainly studied the mechanical properties and microstructure changes of TC18 titanium alloy at low temperature or low strain rate. There are few studies on the dynamic mechanical properties and flow stress model construction at high temperature and high strain rate. Because the dynamic mechanical properties of the material are different from the static mechanical properties, only the dynamic mechanical properties can truly reflect the actual performance of the material deformation [20,21]. Therefore, this paper not only studies the dynamic mechanical properties of TC18 titanium alloy at high temperature and high strain rate, but also constructs JC constitutive model, which can predict the flow stress.
In this paper, TC18 titanium alloy was subjected to quasi-static compression test and dynamic compression test of different temperature and strain rate by using DNS 100 electronic universal testing machine (Changchun Institute of Mechanical Science Co., Ltd., Changchun, China) and split Hopkinson compression bar (SHPB) device with a synchronous assembly system. The relationship between flow stress and strain rate of TC18 titanium alloy under different impact loads, different temperatures, and different strain rates was analyzed. According to the experimental results, the JC constitutive model under the combined action of high temperature and impact load is established by the linear least squares method, and the correctness of the constitutive model is verified, which lays a foundation for the study of cutting mechanism and the prediction of plastic flow stress.

2. Dynamic Mechanical Properties of TC18 Titanium Alloy

2.1. Preparation of Test Sample

According to the relevant parameters of the experimental equipment and experimental parameters, the TC18 titanium alloy sample in the static and dynamic compression test is a φ 5 mm   ×   4   mm [22] cylindrical bar produced by the processing plant, with 85 samples [22]. The main chemical composition and mechanical properties are shown in Table 1 and Table 2, respectively. In the process of processing, in addition to the geometric dimension requirements of TC18 titanium alloy sample, the parallelism of the two ends must be about 0.01 mm. At the same time, the burr should be removed after the sample is processed to ensure that the two ends have good surface roughness to reduce the impact of end friction during the test.

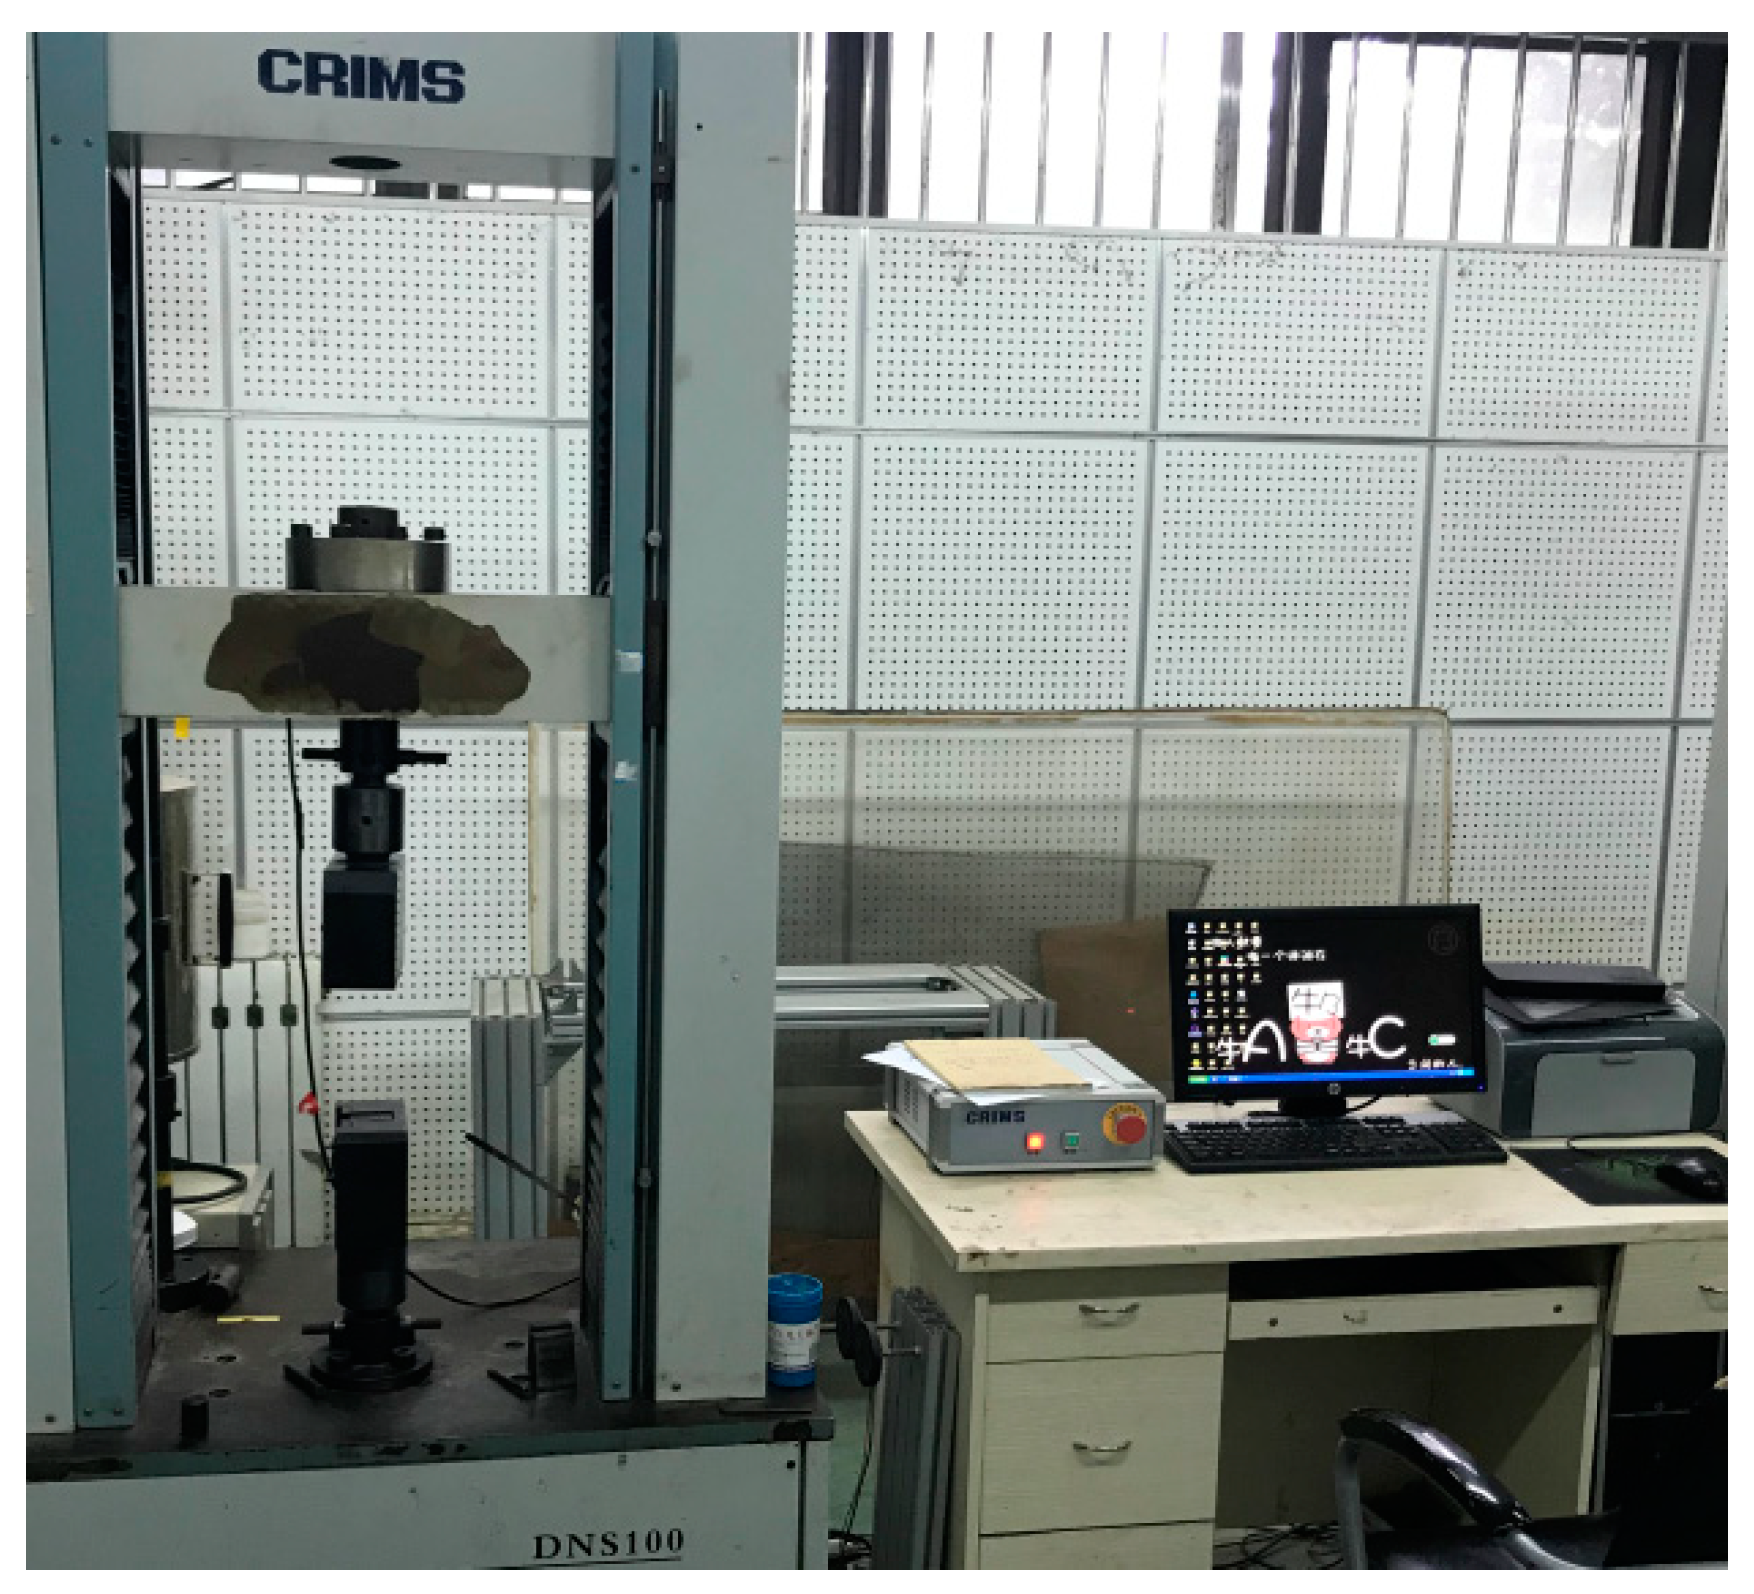
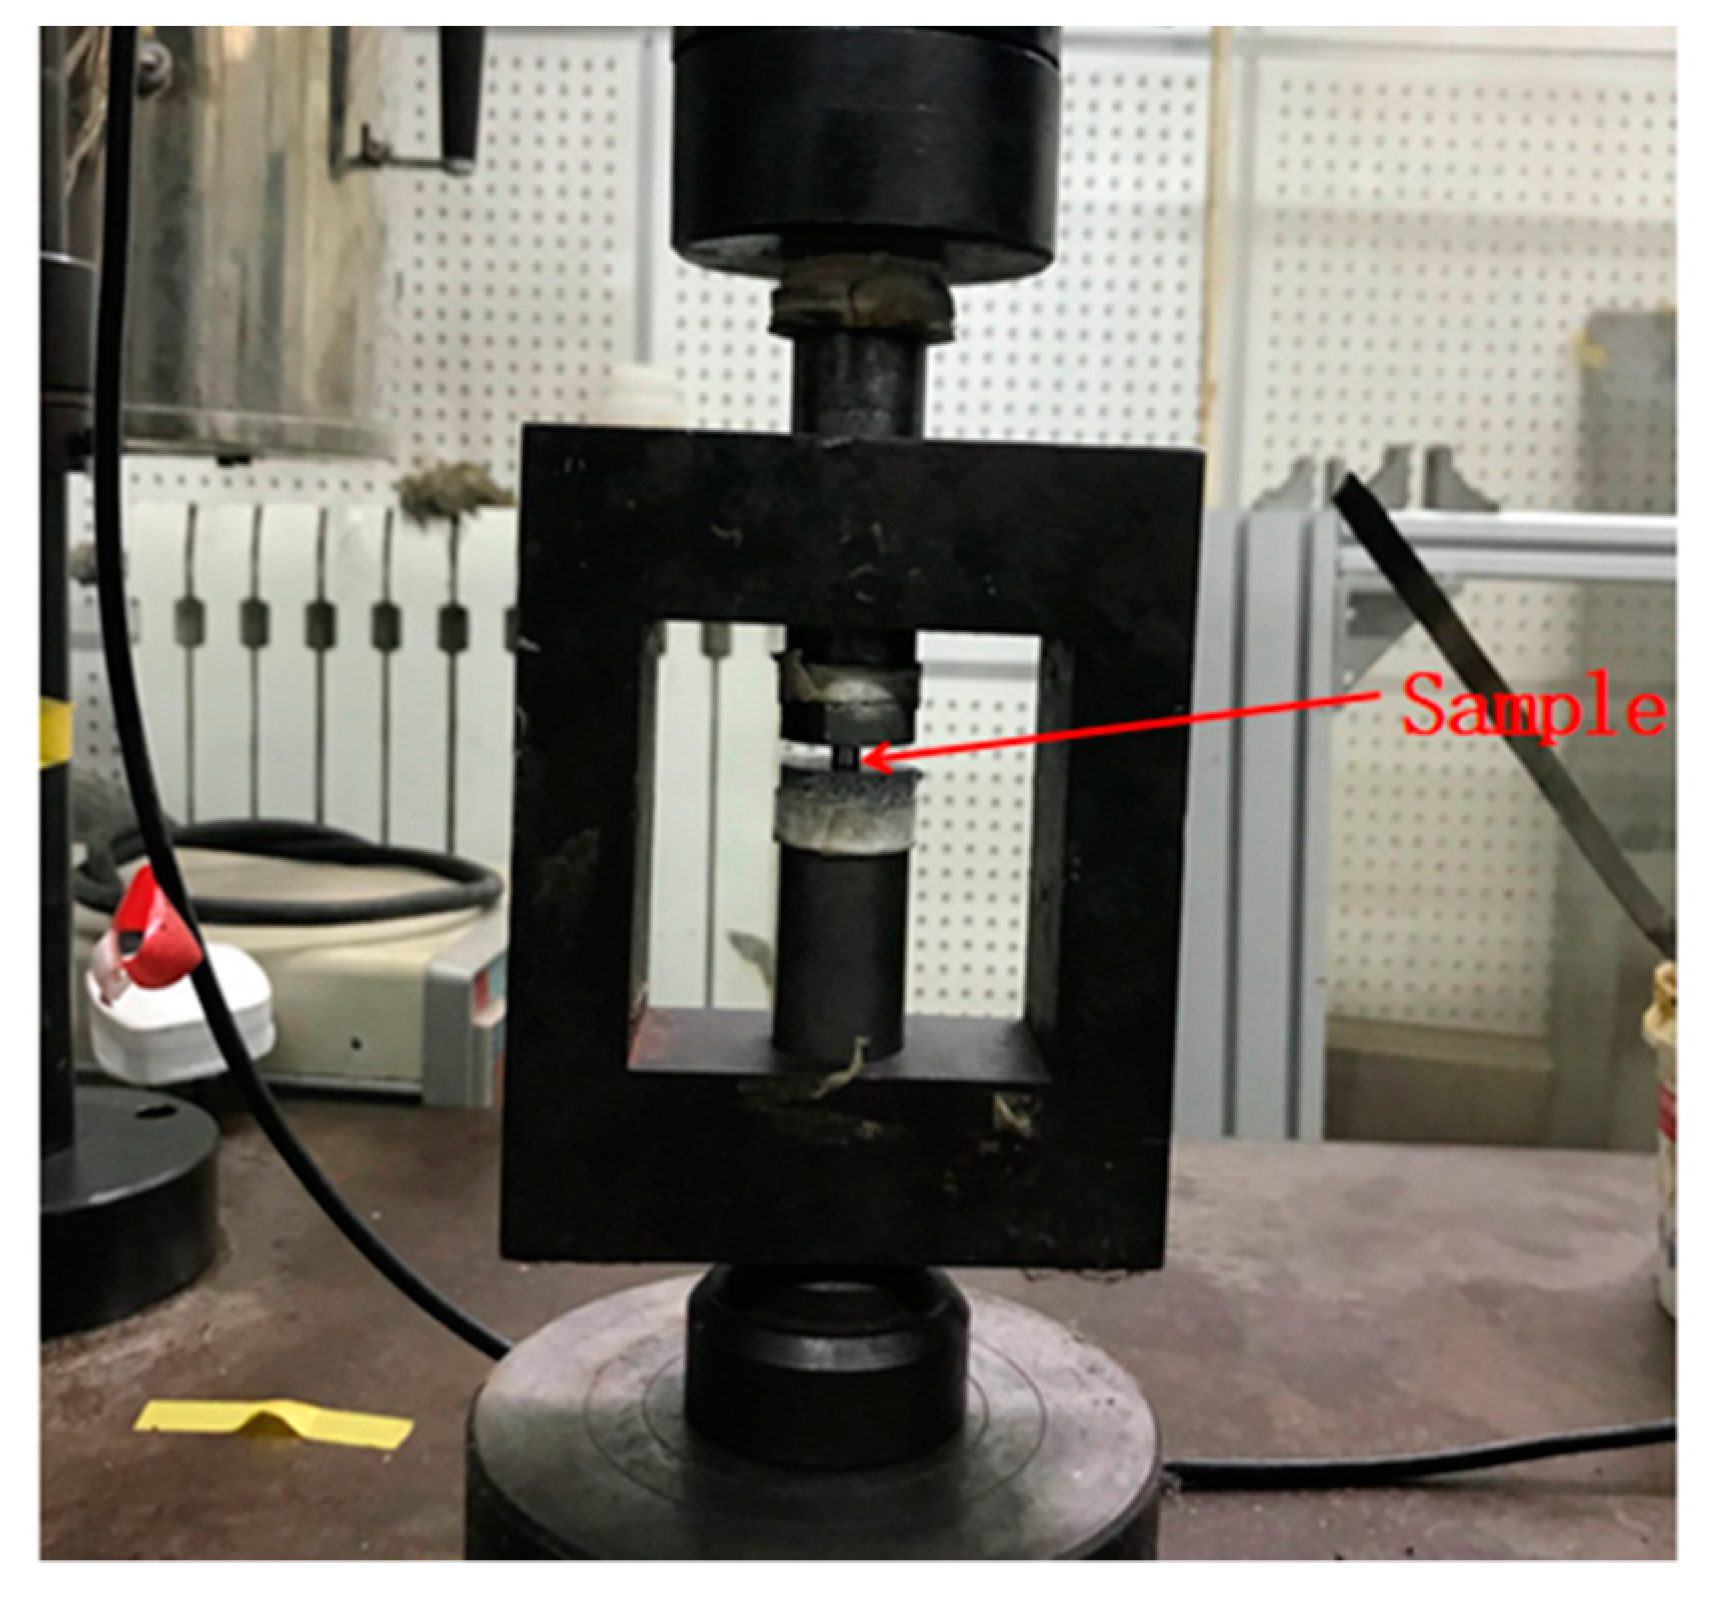
2.2. Quasi-Static Compression Test Device and Experimental Scheme

The quasi-static compression experiment adopts a cylindrical TC18 titanium alloy sample with φ 5 mm   ×   4   mm [22] and the experiment is carried out on a DNS 100 electronic universal testing machine (Changchun Institute of Mechanical Science Co., Ltd., Changchun, China) machine according to the national standard GB/T 7314-2005, and the experimental device and the sample clamping diagram are shown in Figure 1 and Figure 2, respectively. During the experiment, the temperature was kept at room temperature, and the loading strain rate of the sample was from 0.001 s−1 to 0.01 s−1. Before the experiment, the end face of the sample was coated with grease to reduce the friction between the end face of the sample and the loading platform. The volume change of the sample before and after the experiment is small, so it is assumed that the volume of the sample before and after the experiment is constant. In order to reduce the experimental error and ensure the accuracy of the experimental results, each experiment is repeated three times and the average value is calculated as the final experimental results.

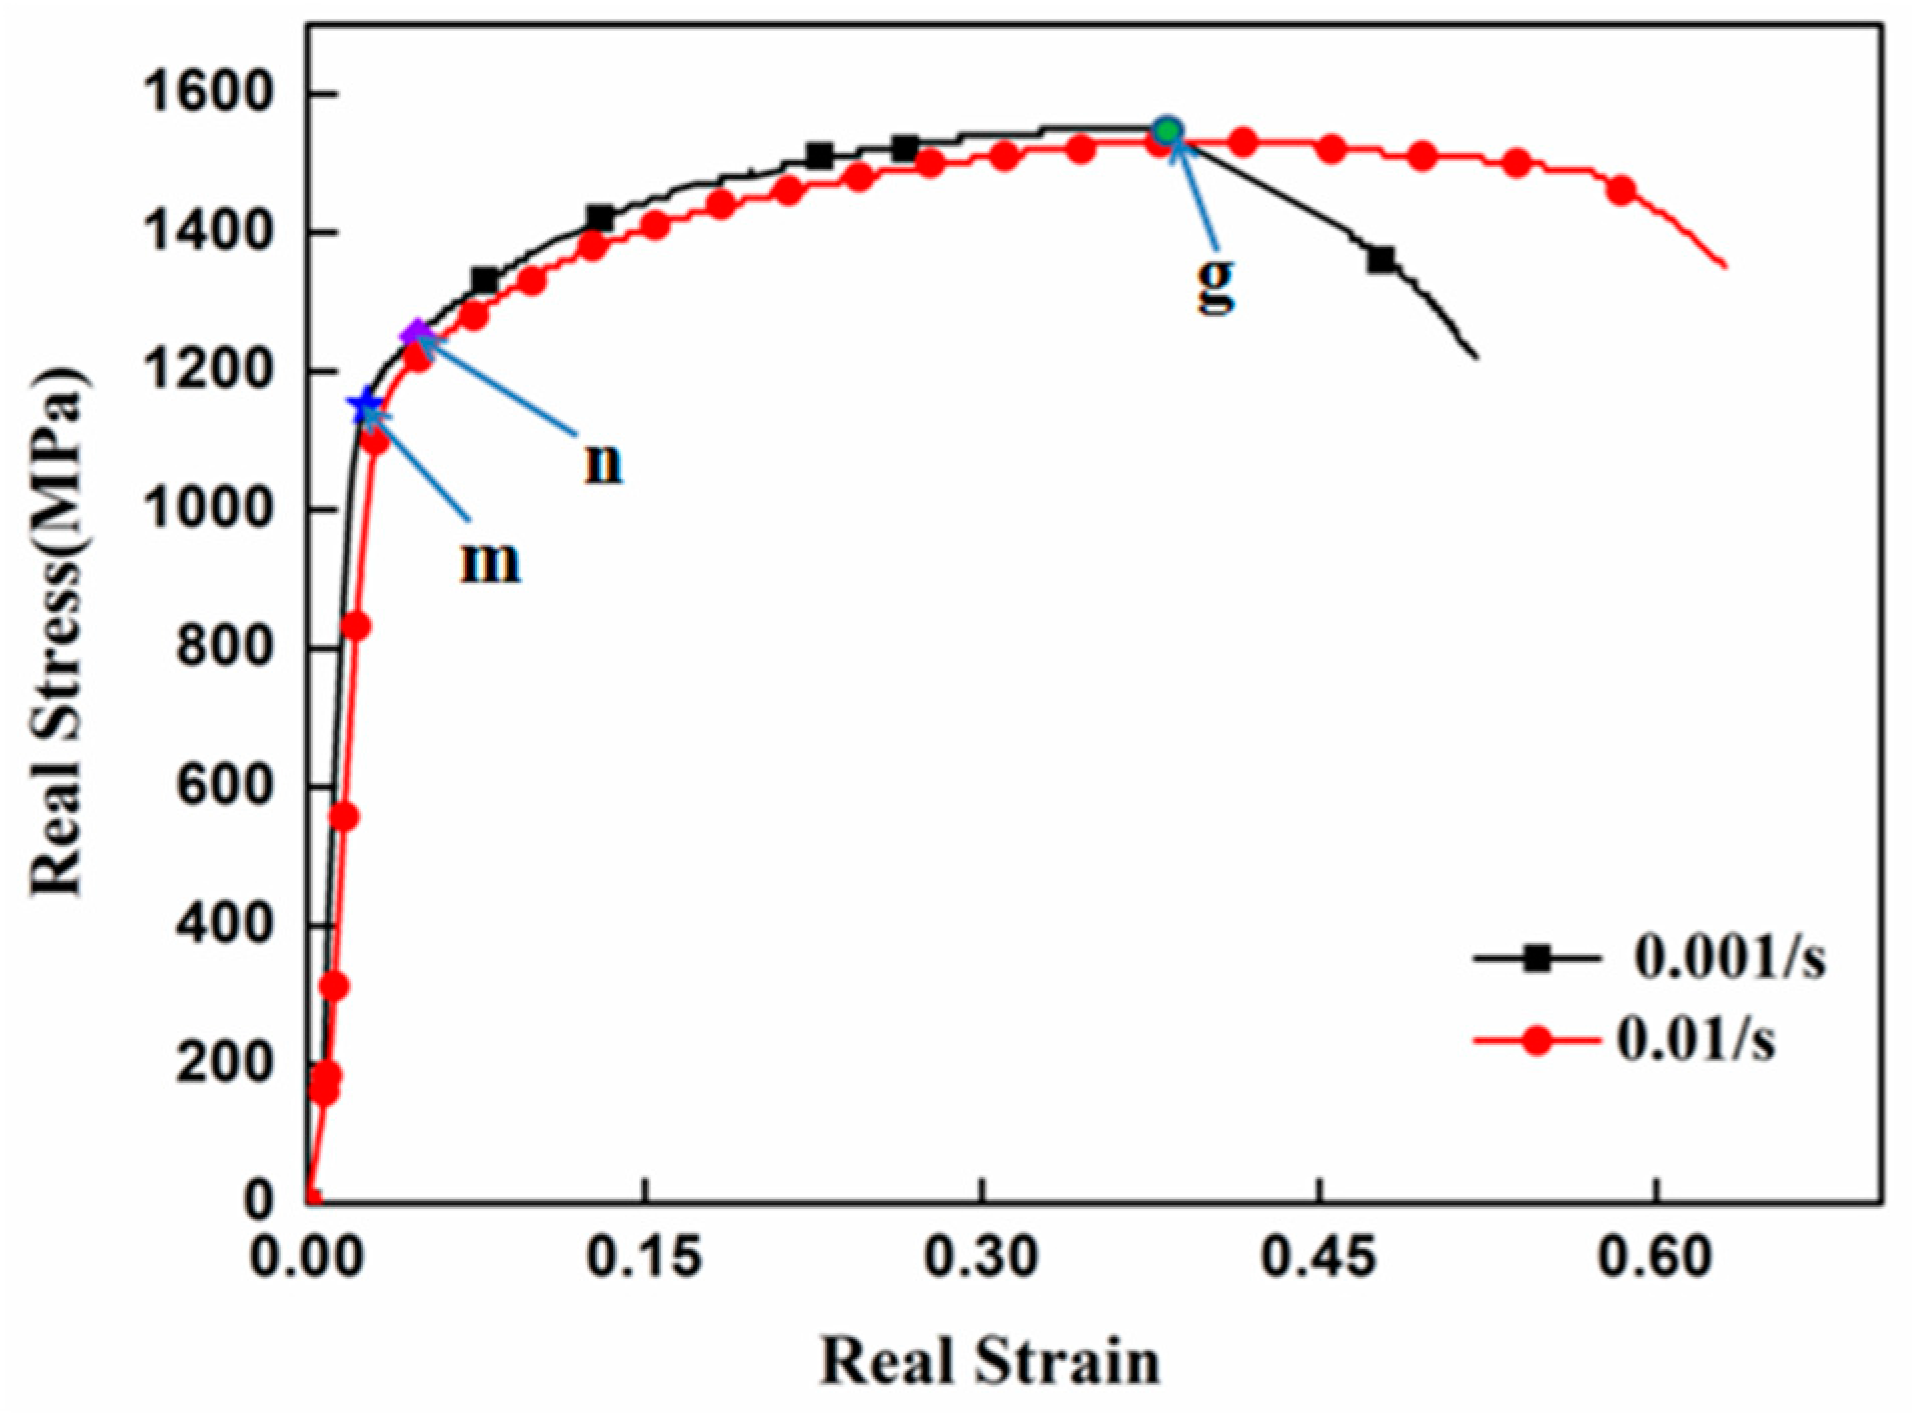
Experimental Results and Analysis under Quasi-Static Conditions

The data of compression load P and compression displacement are obtained by data acquisition and processing system of DNS 100 electronic universal testing machine (Changchun Institute of Mechanical Science Co., Ltd., Changchun, China). We load the equipment without loading the sample and measure the deformation of the indenter. Then, we apply load to the indenter with the sample and measure the deformation. The deformation Δ L of the sample is the difference before and after loading the sample. The engineering stress and engineering strain of the specimen are calculated according to Formulas (1) and (2), and the real stress and real strain data of the specimen are calculated according to Formulas (3) and (4). The sample is subjected to a positive value of stress and strain during the compression process. The real stress and strain data obtained at room temperature and different loading strain rates are drawn into a real stress–strain curve by using Origin 8.0 software (Origin Lab Corporation, Northampton, MA, USA), and the mechanical properties of TC18 titanium alloy during quasi-static compression were analyzed. The stress–strain relationship curve at room temperature is shown in Figure 3.
σ 1 = P A 1 ,
ε 1 = Δ L L 1 ,
σ 2 = σ 1 ( 1 ε 1 ) ,
ε 2 =   ln ( 1 ε 1 ) .
where σ 1 is the engineering stress of the sample, ε 1 is the engineering strain of the sample, σ 2 is the real stress of the sample, ε 2 is the real strain of the sample, P is the compression load, A 1 is the initial cross-sectional area of the sample, Δ L is the compression displacement, and L 1 is the initial length of the sample.
It can be seen from Figure 3 that TC18 titanium alloy material has no obvious yield stage under quasi-static compression, so the stress corresponding to the plastic strain of 0.2% is used as the yield stress ( σ b ), with the increase of strain rate, the yield strength shows a downward trend, but the downward range is small, which shows that TC18 titanium alloy material has poor sensitivity to the change rate under static compression. When the loading strain rate is ε = 0.001 s−1, 0 m is the elastic deformation stage of the sample. Meanwhile, with the increasing of the strain, the stress of the materials also increases proportionally. If the load is suddenly unloaded, the deformation of the material disappears immediately and can completely restore its original shape. mn is the elastic-plastic deformation stage of the sample, and the stress corresponding to the point n is the yield stress of the TC18 titanium alloy, which is σ n = 1180 MPa. ng is the stage of uniform plastic deformation of the sample. Owing to the existence of the strain hardening effect, the flow stress of material increases continuously with the increase of plastic deformation, and the stress corresponding to point g is the strength limit of the material, which is σ g = 1500 MPa. After point g, the flow stress of TC18 titanium alloy decreases rapidly. It is related to the plastic deformation work and cracks of the sample [23].

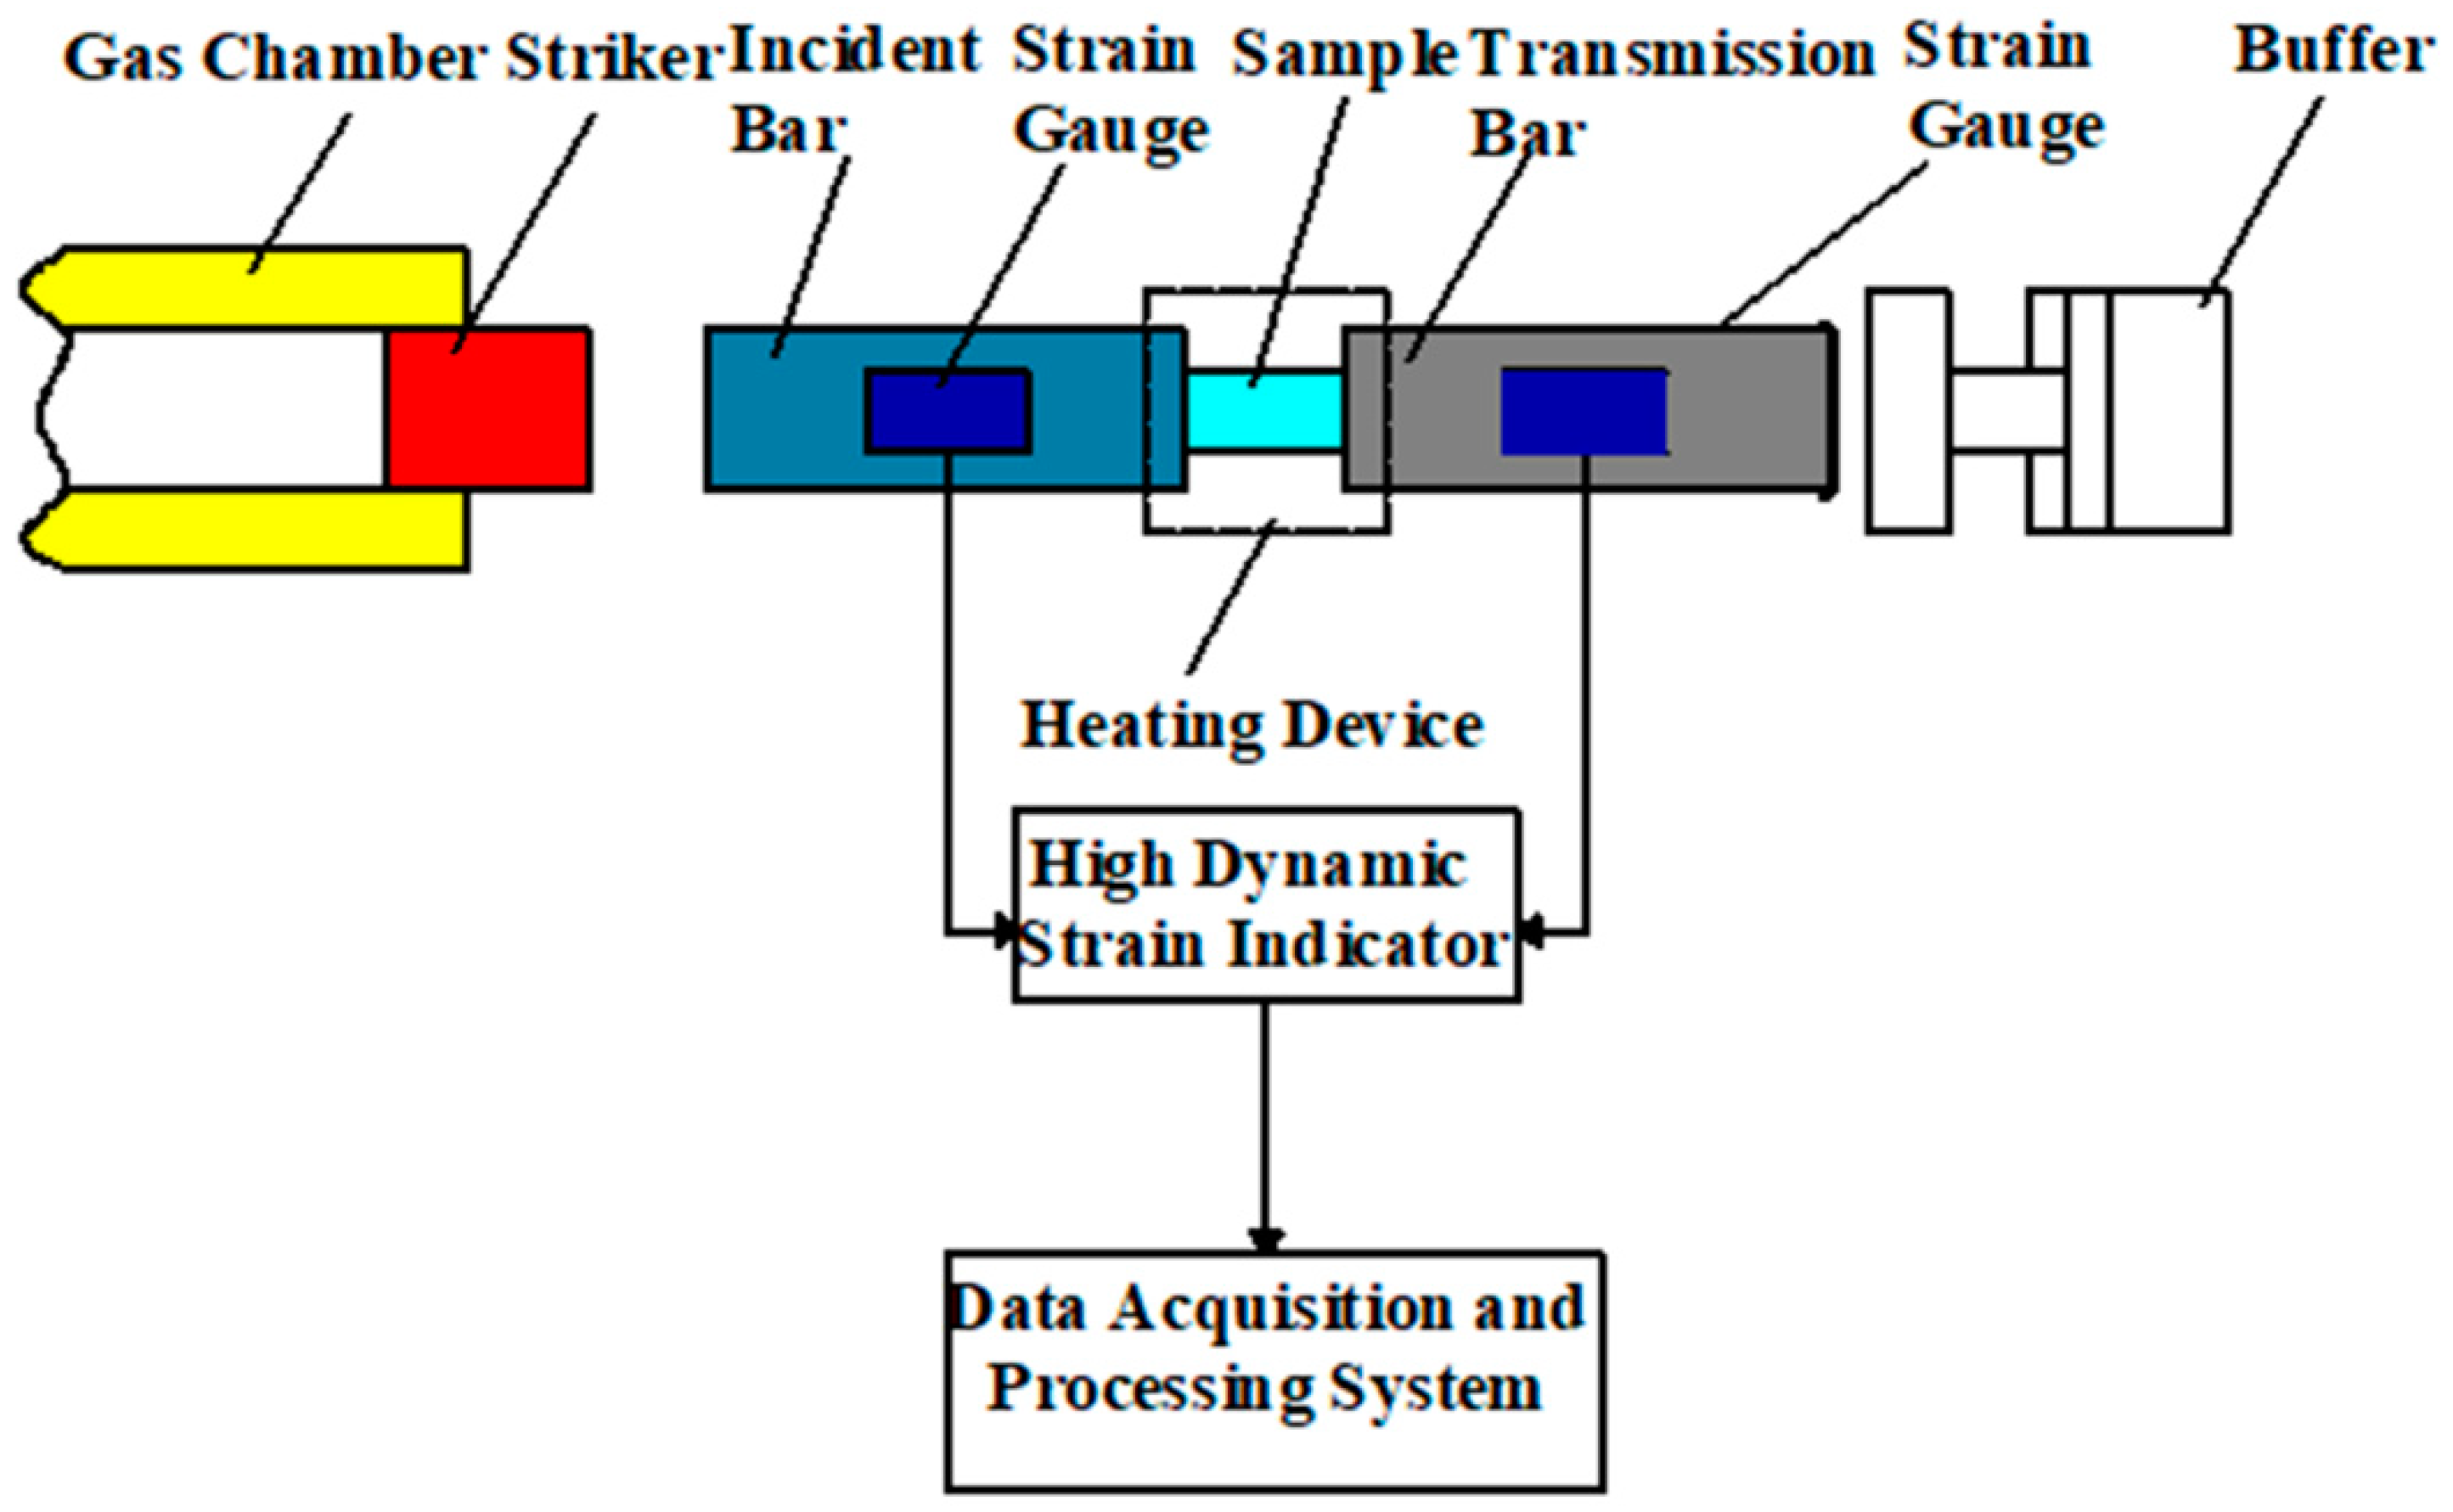
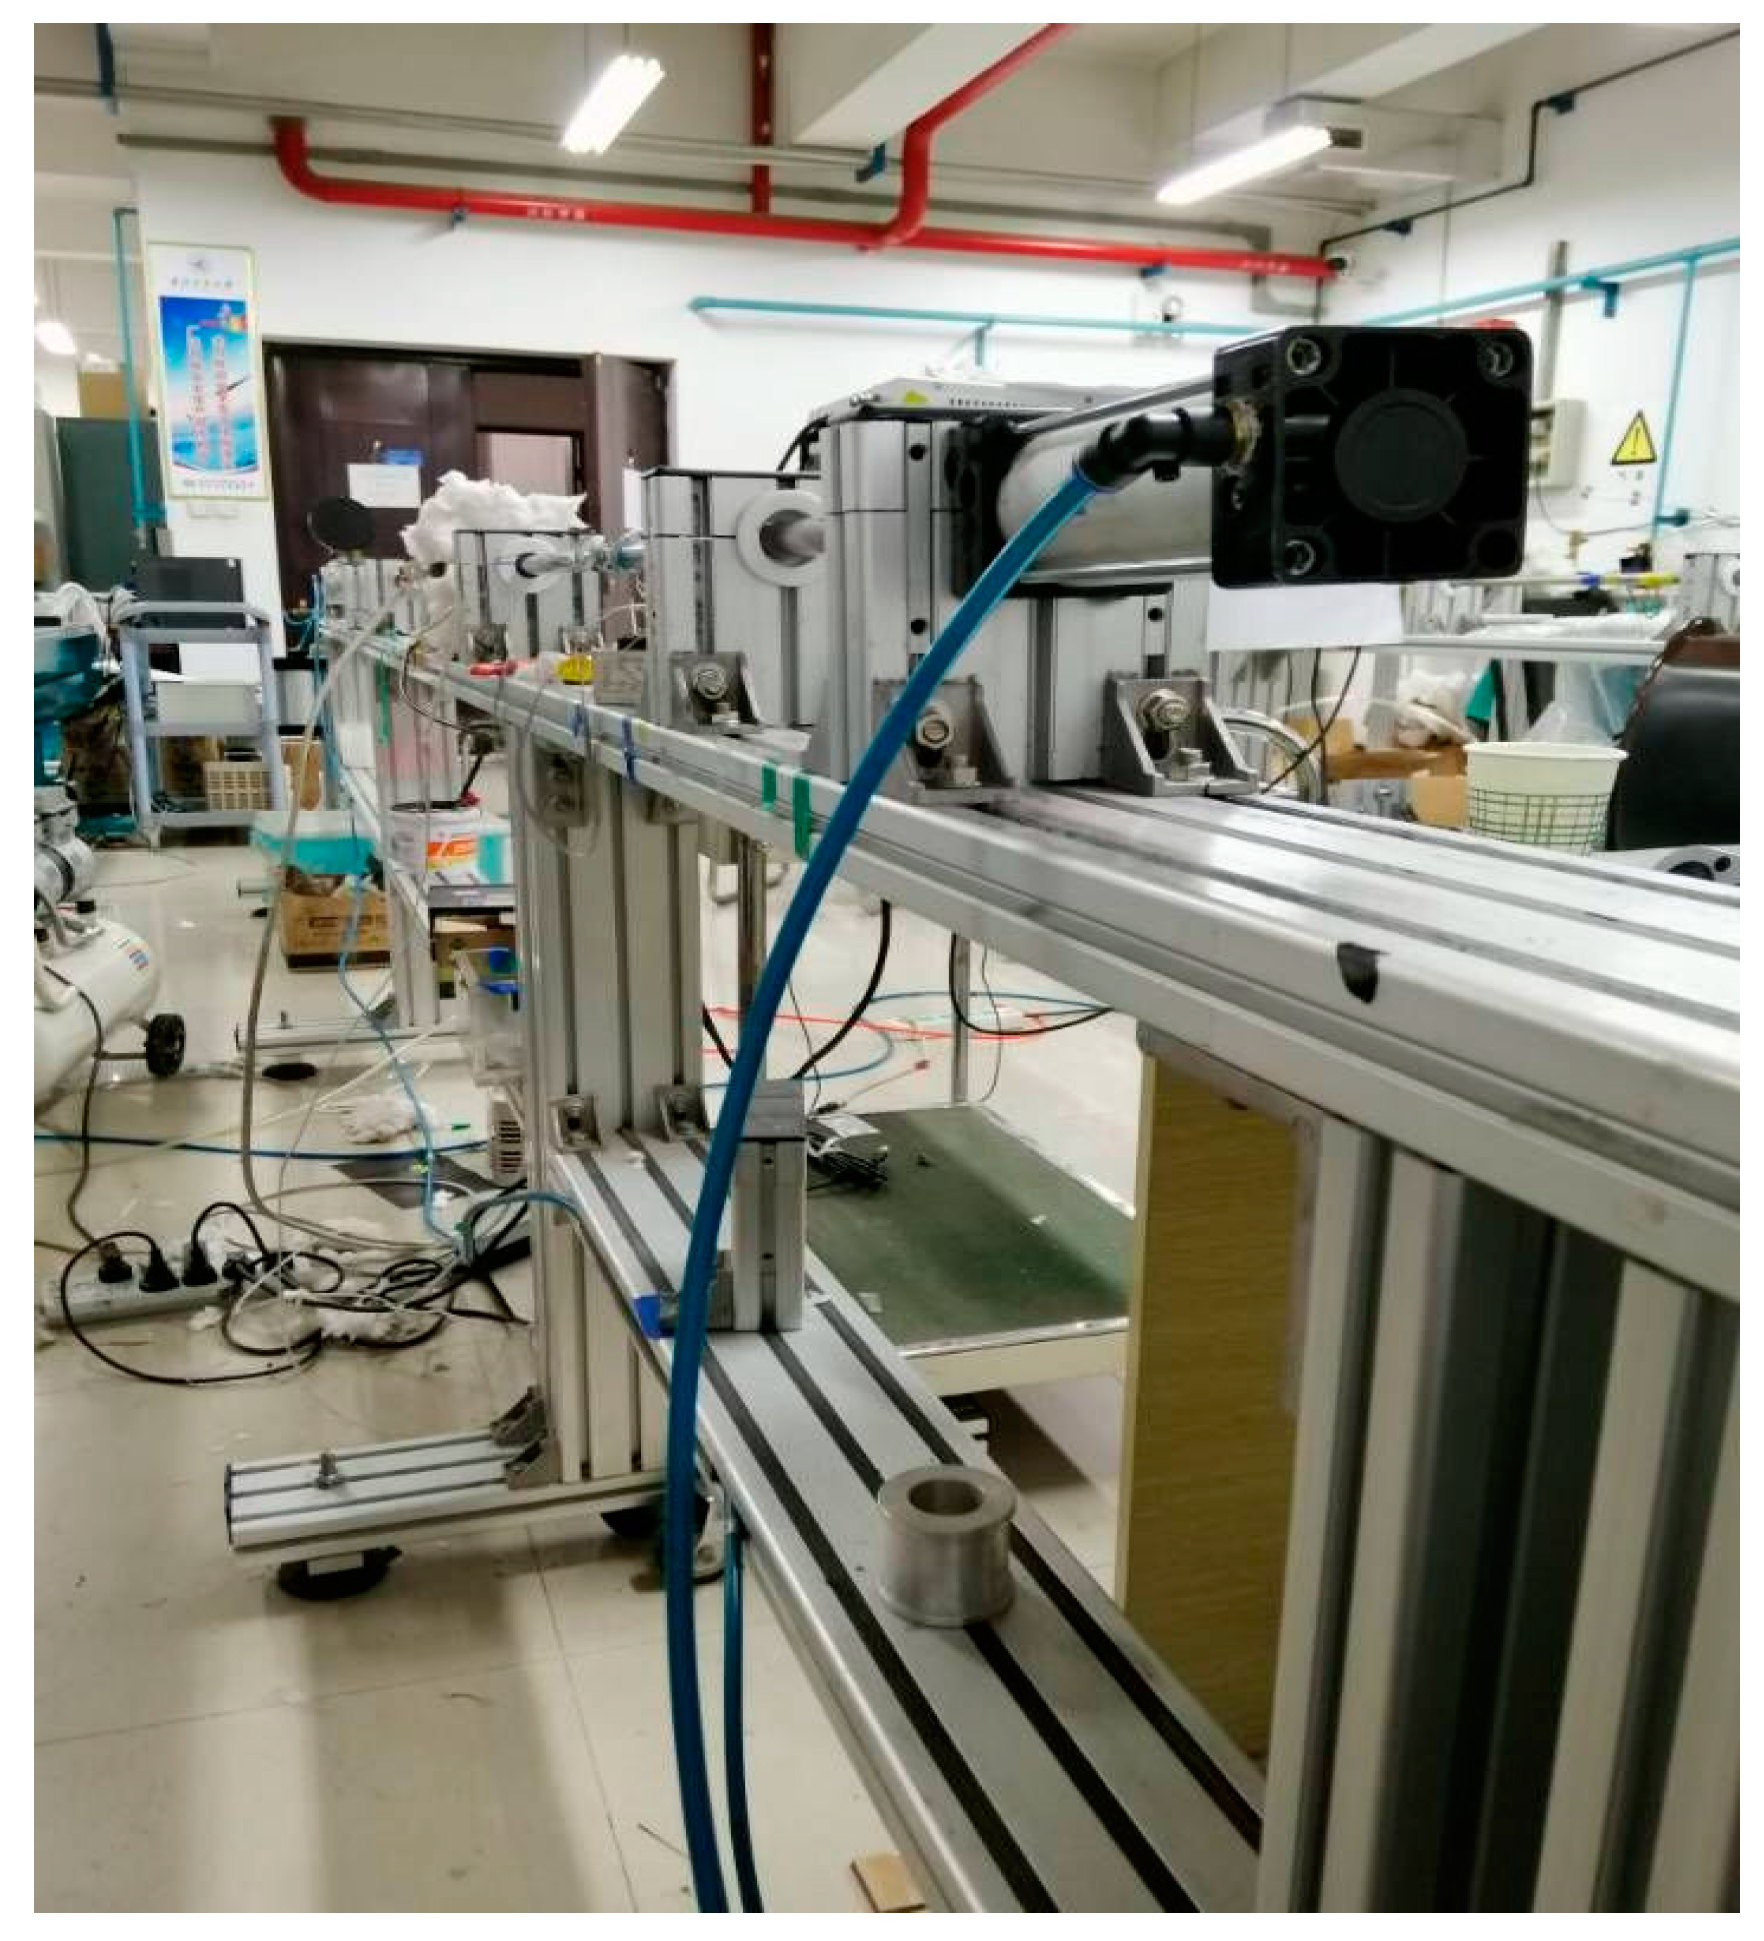
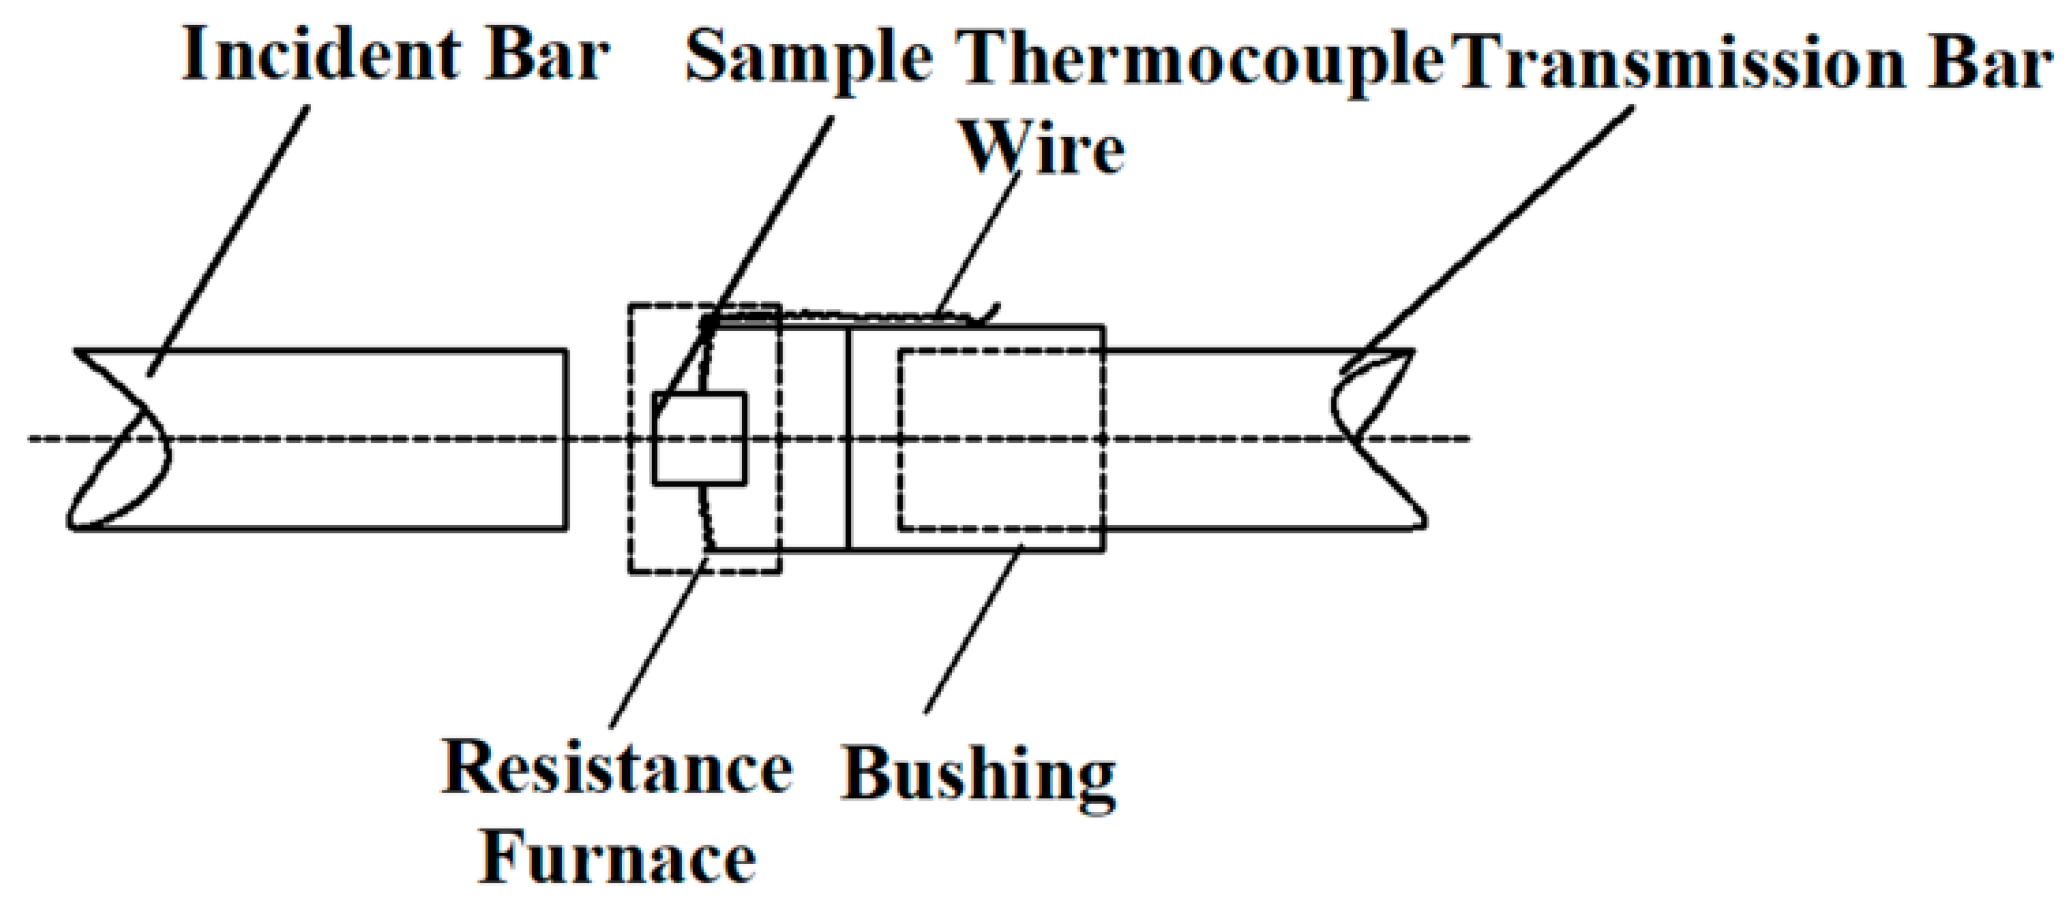
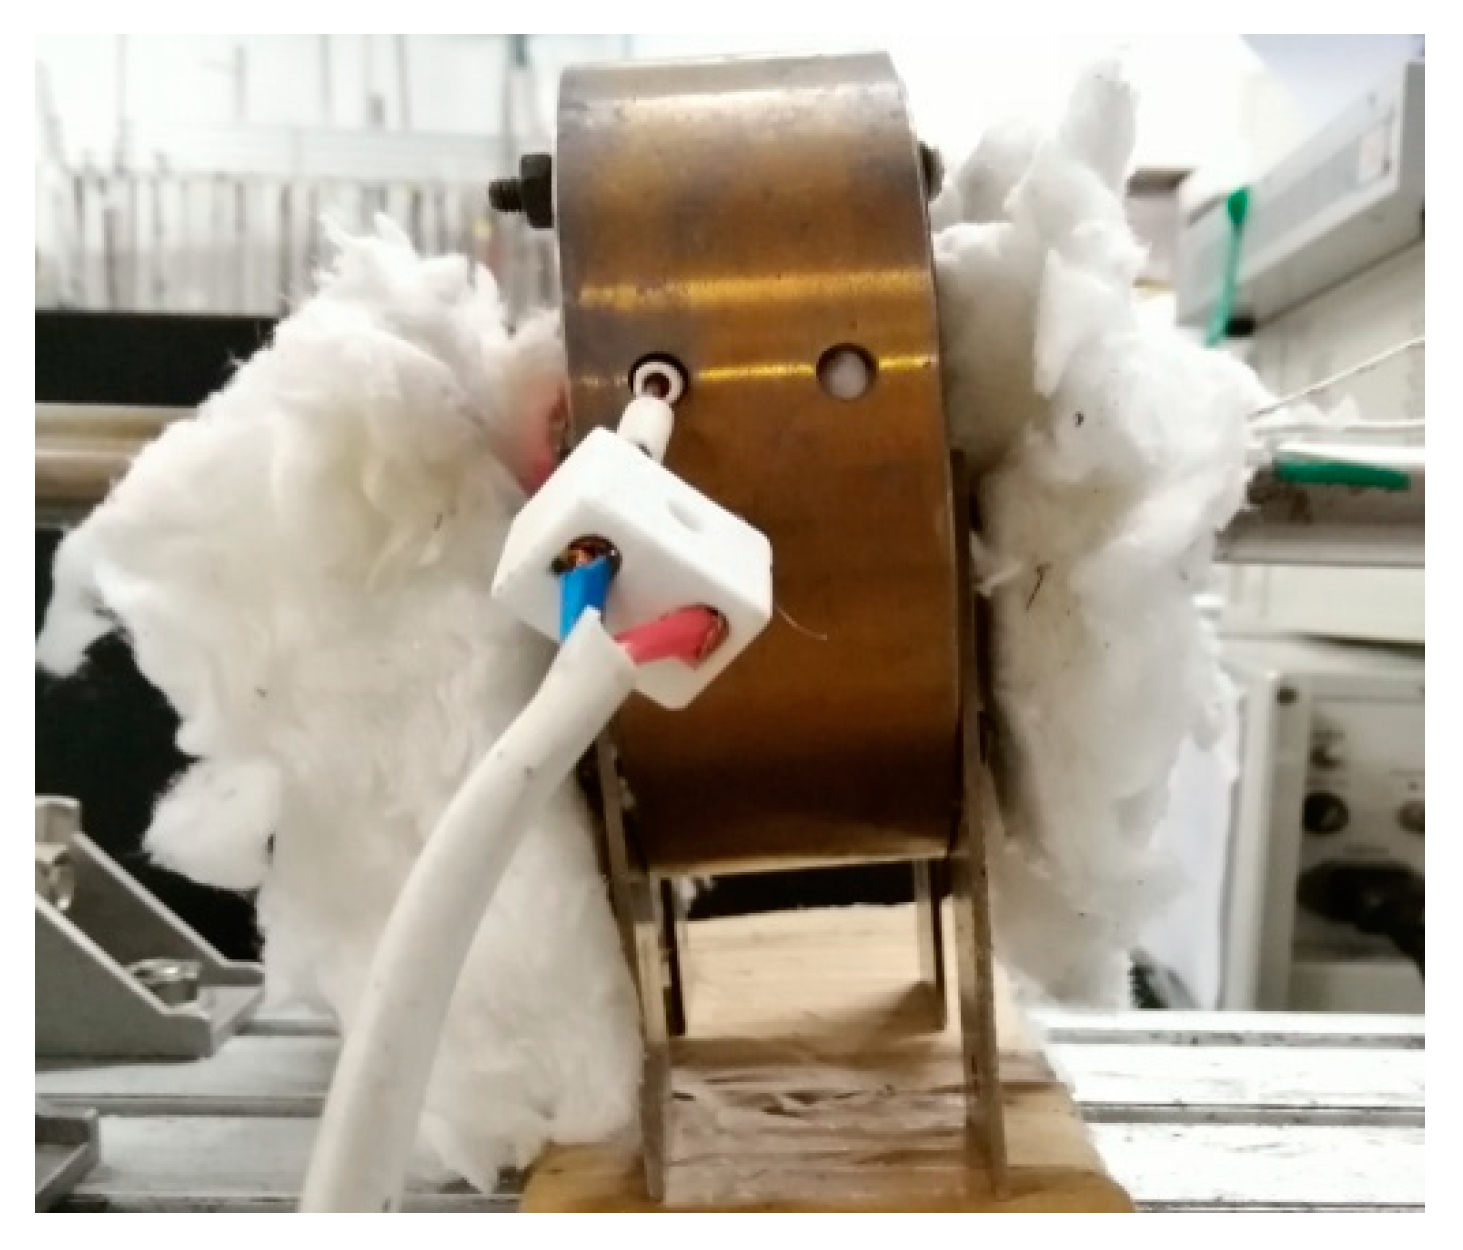
2.3. Hopkinson Pressure Bar Experiment Device, Principle, and Scheme

2.3.1. Split Hopkinson Pressure Bar Device

The split Hopkinson pressure bar experimental technique is based on one-dimensional hypothesis and uniform hypothesis. The one-dimensional stress wave theory can be used to determine the strain rate, strain, and stress of the material, and then the dynamic stress–strain relationship of the material can be obtained. It has the advantages of ingenious and simple measurement method, a wide range of strain rate measured and easy to measure and control the loading waveform. Split Hopkinson pressure bar device is the most commonly used method to measure the dynamic flow stress of materials. It mainly includes the following parts: pneumatic loading device, striker, incident bar, transmission bar, buffer, USB-12047 information acquisition, and processing system. The striker, incident bar, and transmission bar are made of maraging steel with yield stress of more than 1.8 GPa. Because of the high yield strength of maraging steel, the striker, incident bar, and transmission bar remain elastic and will not be destroyed in the experiment. The induction coil of the device can provide high heating rates and stamping speeds, avoids annealing softening and aging hardening of materials, and enables obtaining the stress–strain relationship at high temperatures. Before the experiment, the impacted end of the incident bar is pasted with a shaping sheet of copper material to reduce the high frequency oscillations during the experiment. The coaxiality of incident bar and transmission bar should be guaranteed in the experiment to avoid the scattering phenomenon of stress wave in the process of propagation. In the experiment, the sample is placed between the incident bar and the transmission bar and coated with grease. By adjusting the air pressure, the striker produces an accelerated pulse, and the sample is loaded. At the same time, the BE120-3AA strain gauge pasted on the incident bar and the transmission bar will record the pulse signal. Through the processing of the corresponding variable bar signal, the change course of the load at the end of the bar with time can be measured [24], thus the dynamic stress-strain curve of the material can be obtained. The experimental schematic diagram and experimental device of the split Hopkinson pressure bar are shown in Figure 4 and Figure 5, respectively.
When doing the high temperature pressure bar experiment, it is necessary to install the high-temperature synchronization device on the Hopkinson pressure bar device. In Figure 4, the buffer in the device is replaced with the driving piston, which is connected with the pneumatic loading device at the striker to ensure the synchronization between the driving piston and the transmission bar. The purpose of piston movement is to push the transmission bar to ensure that the sample contacts the two bars. Before the test, the sample was separated from the two bars, which is to avoid the change of the modulus of the bar due to the temperature rise and affect the test data. During the experiment, the sample is fixed on the bushing through thermocouple wire, and the bushing can slide arbitrarily on the transmission bar. The incident bar and the transmission bar are equipped with bushing fixed gasket and grease at both ends to avoid damage at the end of the bar.
In the high temperature test, the cold contact time (CCT) has a certain impact on the accuracy of the test results. The cold contact time (CCT) is defined as the time of direct contact between the sample and bar prior to the arrival of the incident stress wave. Because the temperature of the sample is higher than that of the bar, there is heat conduction between the sample and the bars, so the cold contact time (CCT) has an effect on the temperature decrease of sample and the temperature increase of the bars. After the sample is heated, when the pneumatic loading device is opened, the piston in the high temperature synchronization device can push the transmission bar to ensure that the sample contacts the two bars. The time for the synchronous cylinder wave to propagate from the sample to the strain gauge on the incident bar is t. At the same time, the striker in the bore hits the incident bar at a certain speed. The time for the loading wave to propagate from the strain gauge on the incident bar to the sample is t. The actual cold contact time is obtained by subtracting 2 t from the time difference T between the synchronous cylinder wave signal and the loading wave signal recorded by the strain gauge on the incident bar. Different test air pressure can obtain different cold contact time, so in order to test the cold contact time, we conduct the test without clamping the sample, so that the cold contact time is 38 ms. When the cold contact time is less than 50 ms [25], the test data can truly reflect the behavior of the material, so it can be seen that the cold contact time in this test has little impact on the measurement results. The cold contact time diagram was shown in Figure 6.
In the experiment, the sample is heated in an electric furnace, and the sample reaches the predetermined experimental temperature. The heating control system is used to keep the sample warm for 2–3 min. The velocity of the piston is so small that it is negligible relatively to the velocity of the striker. In the high temperature dynamic compression experiment, when the pneumatic loading device is opened, the movement of the piston and the striker in the bore are synchronous, but the piston stops after a full stroke, then the striker hits the incident bar. The pulse signals under different strain rates can be obtained by changing the air pressure of the high-temperature synchronization device. Figure 7 and Figure 8 show the schematic diagram of specimen clamping and the diagram of experimental device in high temperature experiment, respectively.

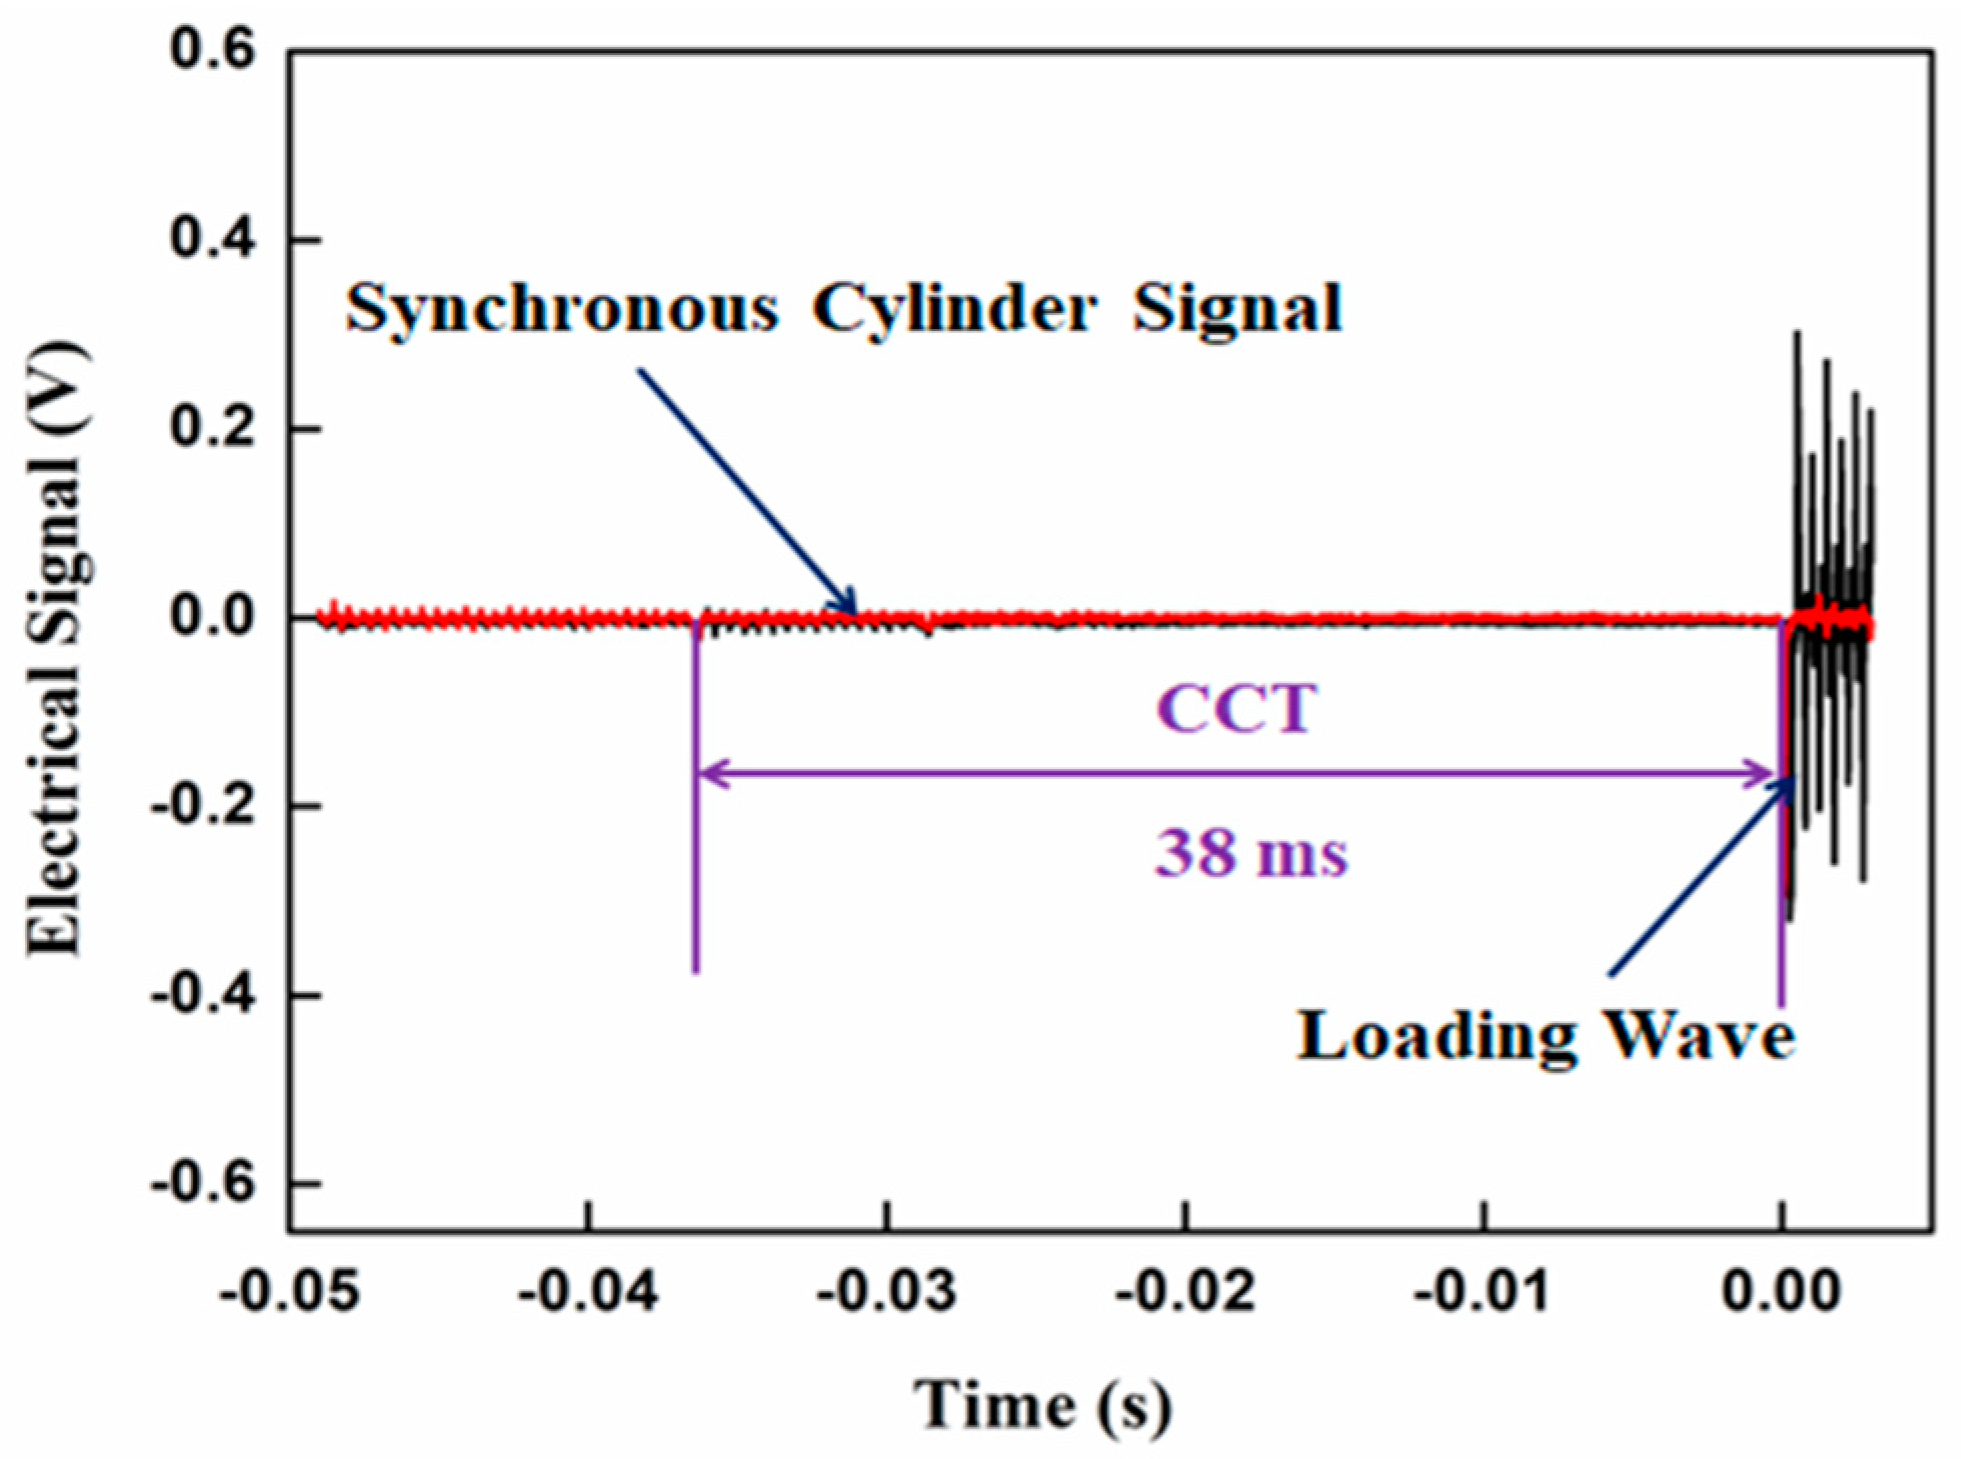
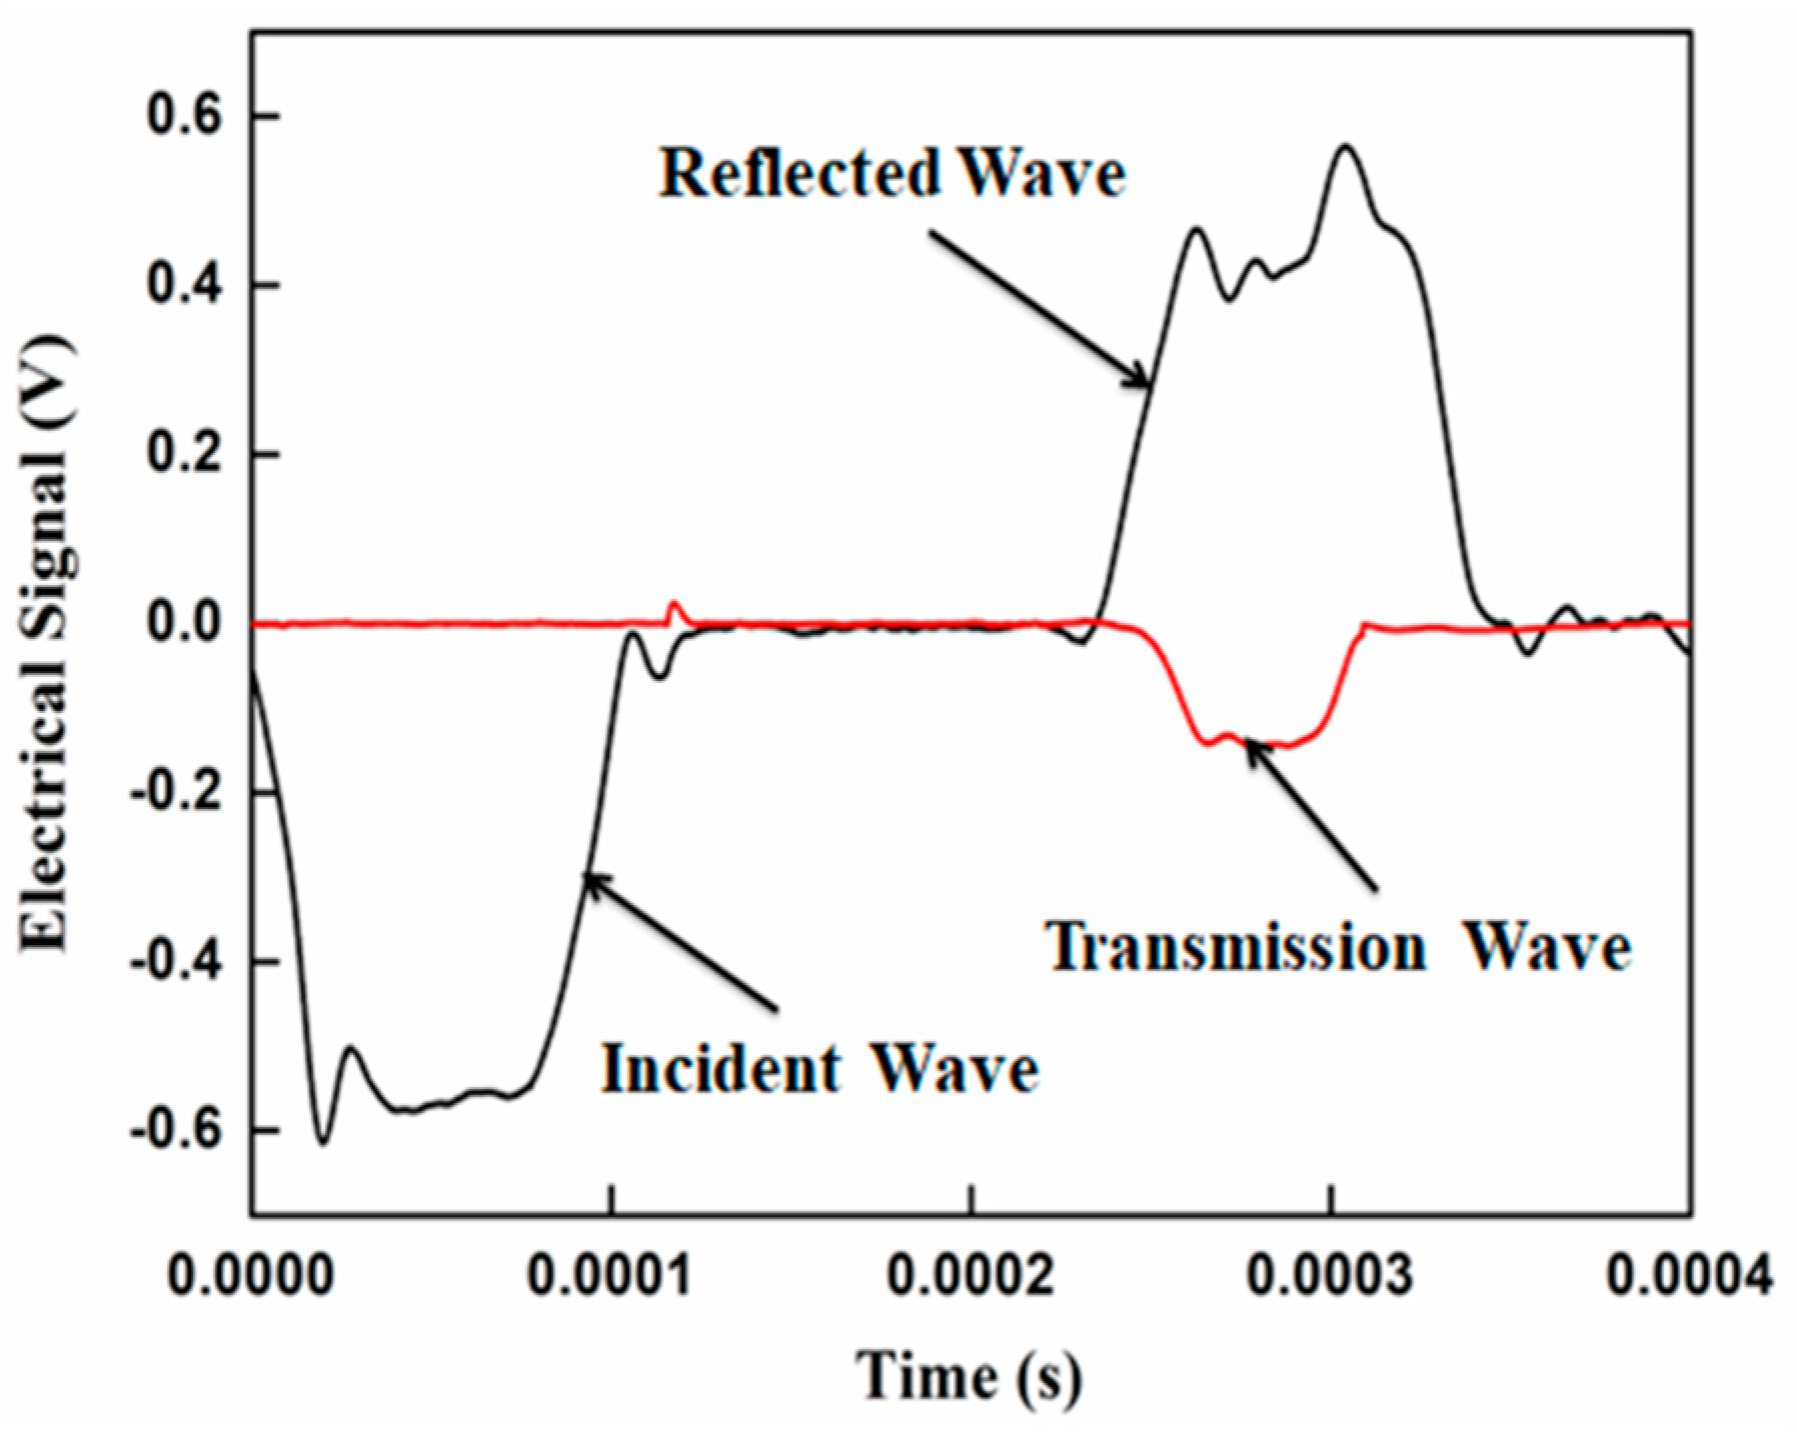
2.3.2. Experimental Principle of Split Hopkinson Compression Bar

The sample is placed between the incident bar and the transmission bar and is heated by a resistance furnace, the length L of the striker (the density is ρ , the one-dimensional elastic wave velocity is C 0 ) is driven by a high-pressure gas in the air chamber to impact the front end of the incident bar at a certain speed ν 0 , the incident pulse ε i is measured by a BE120-3AA strain gauge on the incident bar, a part of the incident wave causes high-speed plastic deformation of the sample and enters the transmission bar to form a transmission pulse ε t , and the other part of the incident wave is reflected back to the incident bar to form a reflection signal ε r owing to the difference in wave impedance between the incident bar and the sample. In the low temperature experiment, only the buffer is used, and the transmission wave is finally absorbed by the buffer. The high-temperature synchronization device replaces the buffer in the high temperature experiment, and the transmission wave is finally absorbed by the synchronization device, which plays the role of the buffer. The signals of incident wave, reflected wave, and transmitted wave measured by BE120-3AA strain gauge are amplified by SDY2107B high dynamic strain indicator (Beidaihe Institute of practical electronic technology, Qinhuangdao, China) and then transmitted to USB-12047 data acquisition and processing system. The average stress, average strain, and average strain rate of the specimen are obtained by theoretical analysis and calculation of one-dimensional stress wave and stress uniformity [26,27,28]. The engineering stress and engineering strain of the material are derived from Formulas (5)–(14). Under the assumption of incompressibility of the material, the real stress and real strain of the material can be converted from Formulas (3) and (4). Figure 9 shows a set of waveform signals measured by experiments.
σ = E H A H 2 A 1 ( ε i + ε r + ε t ) ,
ε = C H L 1 0 t ( ε i ε r ε t ) d t ,
ε = C H L 1 ( ε i ε r ε t ) .
If the force on the end face 1 and 2 of the sample is F 1 and F 2 , respectively, there are the following:
F 1 = A H E H ( ε i + ε r ) ,
F 2 = A H E H ε t .
When the force on both ends of the sample is balanced, that is,
F 1 = F 2 .
It is considered that there is an equilibrium state and a uniform process of stress and deformation in the sample. The average stress represents the one-dimensional stress state in the material, which can be obtained from the Formulas (8)–(10):
ε i + ε r = ε t .
By substituting Formula (11) into Formulas (5)–(7), we can obtain the following:
σ = A H E H A 1 ε t ,
ε = 2 C H L 1 0 t ε r d t ,
ε = 2 C H L 1 ε r ,
where E H represents the elastic modulus of a bar; A H indicates the cross-sectional area of the bar; C H represents the elastic wave velocity of the bar; L 1 indicates the initial length of the specimen; A 1 indicates the initial cross-sectional area of the specimen; and ε i , ε t , and ε r represent incident wave signal, reflected wave signal, and transmitted wave signal, respectively. The elastic wave velocity and elastic modulus of the incident bar material are 4904 m/s and 190.00 GPa, respectively.

2.3.3. Experimental Scheme of Split Hopkinson Compression Bar

In order to study the dynamic mechanical properties of TC18 titanium alloy at high temperature and high strain, a cylindrical bar with a diameter of φ 10 mm [22] and a diameter of φ 5 mm   ×   4   mm [22] was used in this experiment. The mean strain rates were 1033 s−1, 2100 s−1, 3011 s−1, 3065 s−1, and 5015 s−1, and the temperatures were 25 °C, 200 °C, 400 °C, and 600 °C. In order to reduce the experimental error and ensure the accuracy of the experimental results, each experiment is repeated three times and the average value is obtained as the final experimental results. The experimental scheme is shown in Table 3.

2.4. Dynamic Compression Test Results and Analysis of TC18 Titanium Alloy

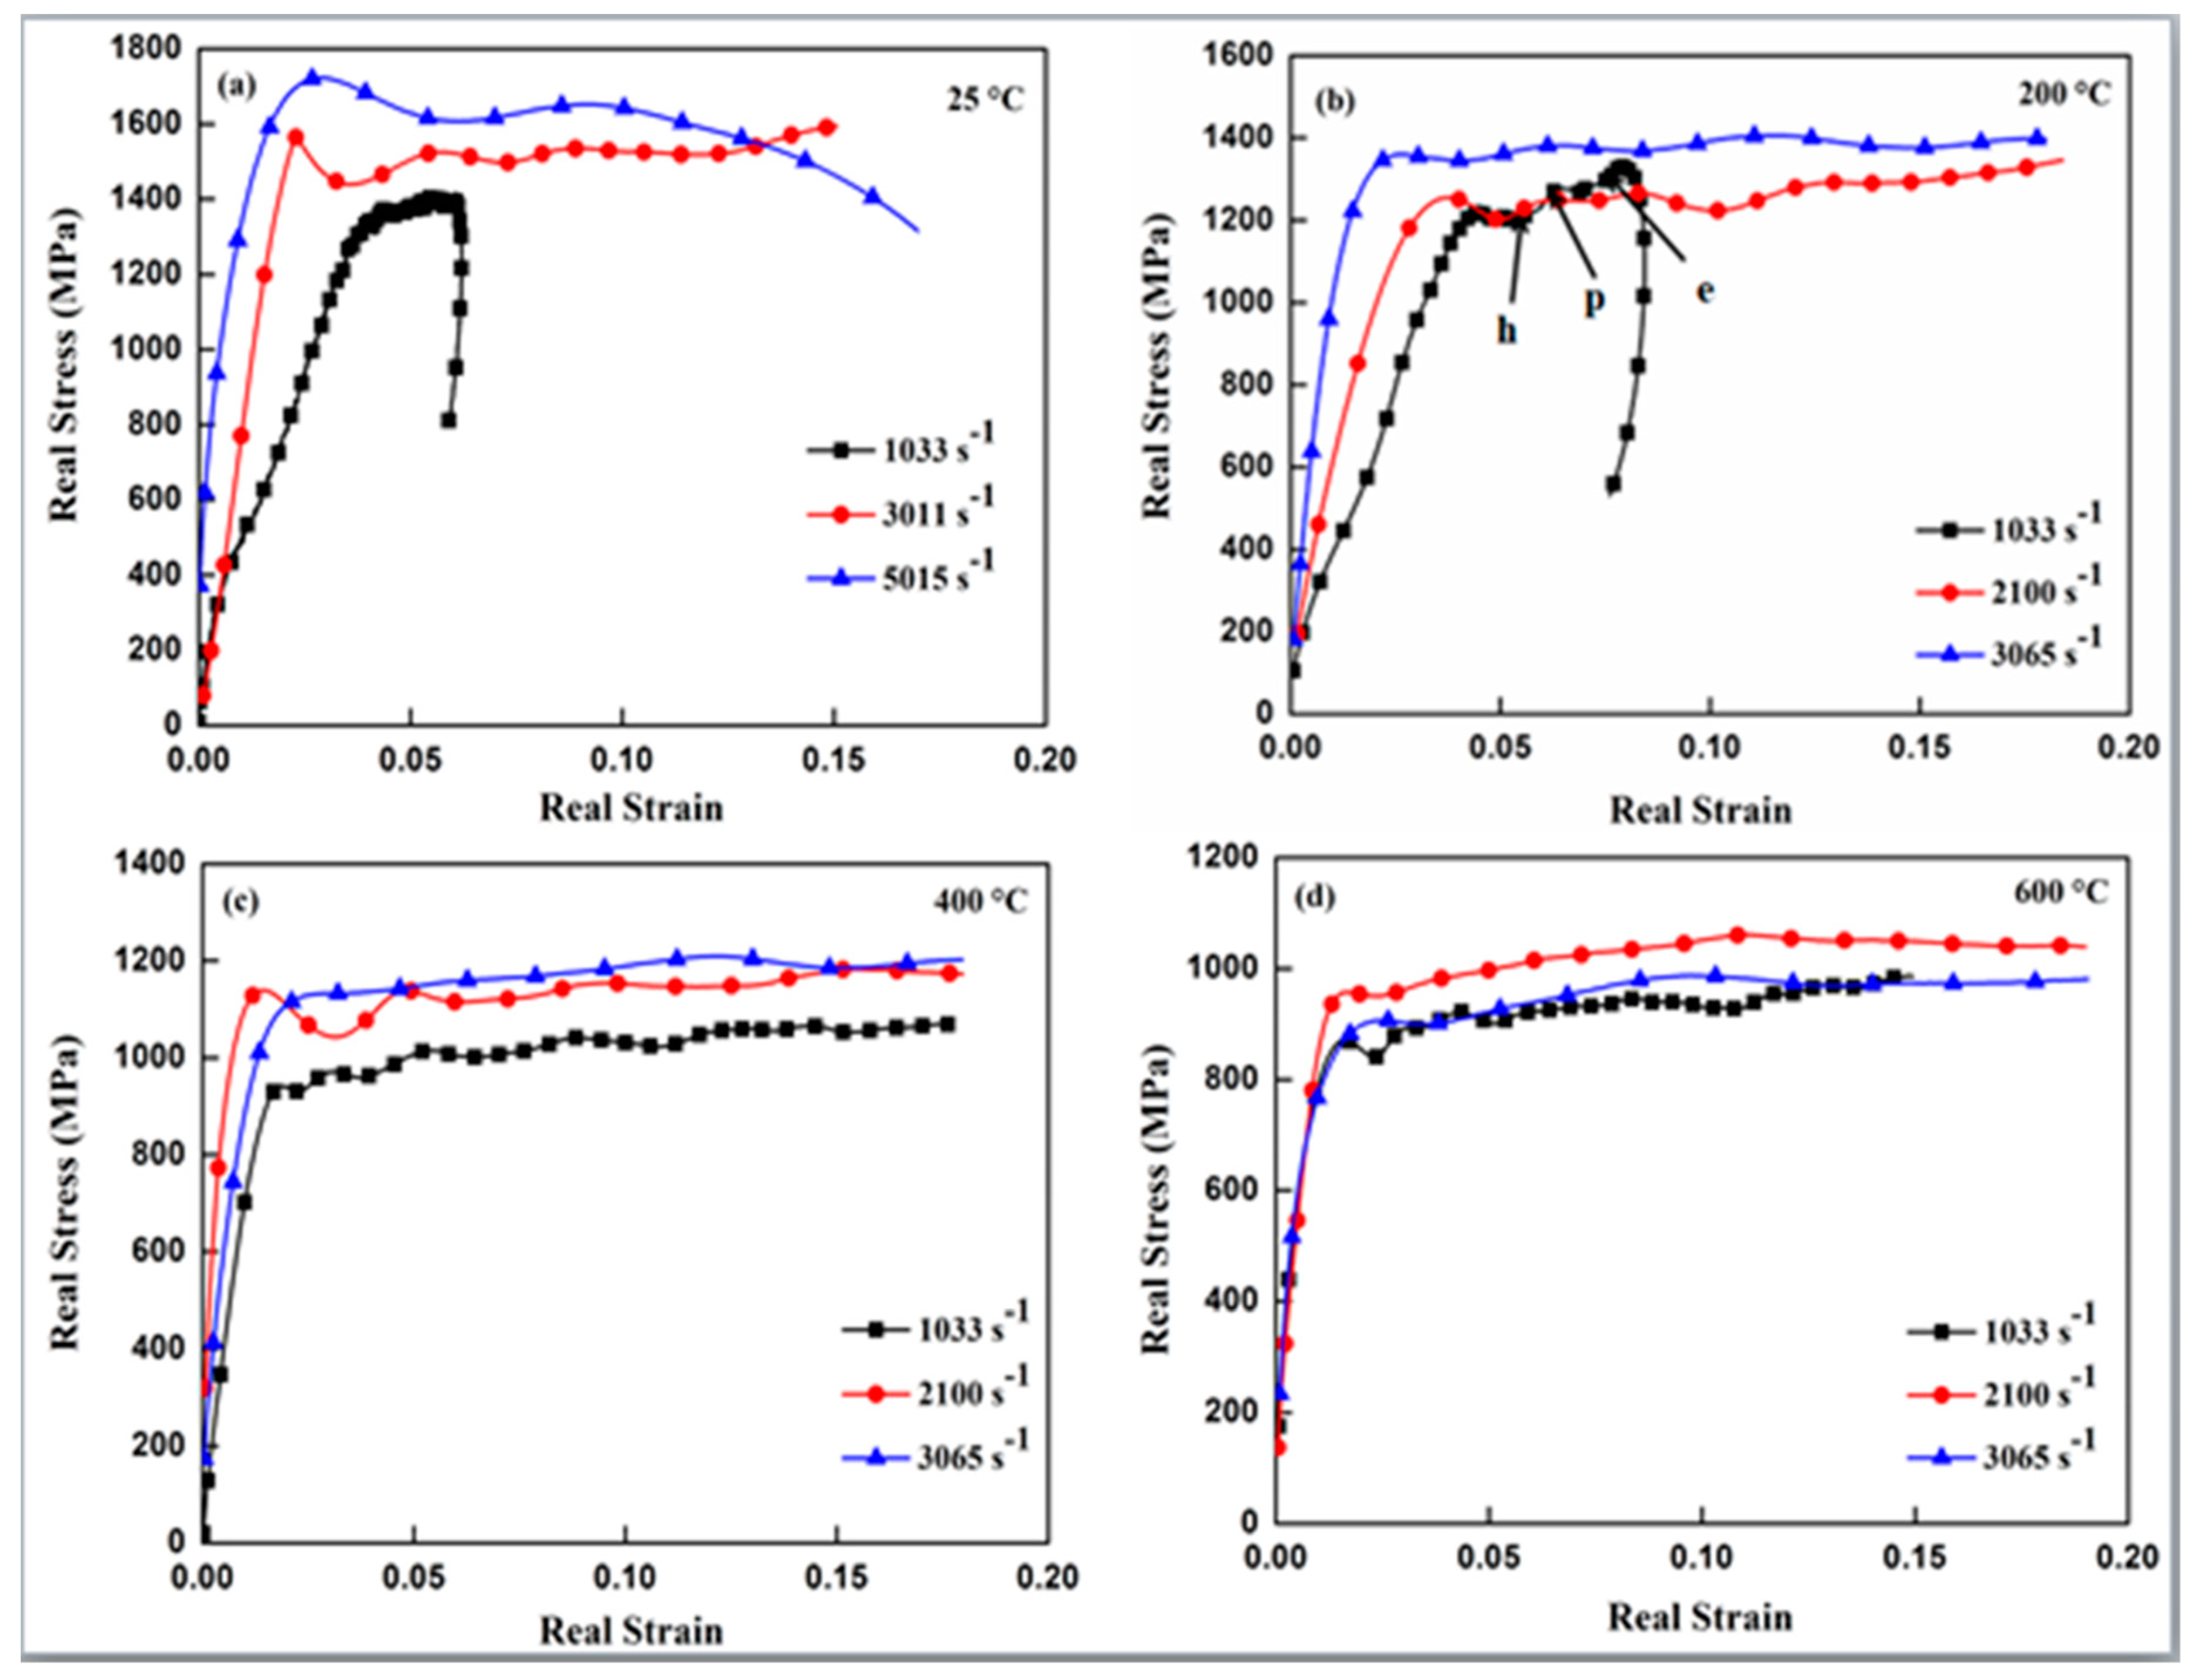
2.4.1. Strain Rate Sensitivity Analysis of TC18 Titanium Alloy

Through the processing of the results of Hopkinson dynamic compression experiment, the real stress and strain data measured at the same temperature and different strain rate are simulated by Origin software to form the curve, so as to obtain the true stress–strain curve of TC18 titanium alloy at different temperature and different strain rate, and analyze the effect of strain rate on the flow stress of TC18 titanium alloy. Figure 10 shows the stress-strain curves of TC18 alloy at different strain rates at (a) T = 25 °C, (b) T = 200 °C, (c) T = 400 °C, and (d) T = 600 °C.
It can be seen from Figure 10a that, under the condition of T = 25 °C, when the strain rate increases from 1033 s−1 to 3011 s−1, the maximum flow stress of TC18 titanium alloy increases from 1300 MPa to 1560 MPa, showing a significant increase trend. When the strain rate increases from 3011 s−1 to 5015 s−1, the maximum flow stress of the material increases from 1560 MPa to 1680 MPa, showing a slow growth trend. When the strain rate reaches 3011 s−1, the sample collected after the experiment has a broken shape [23].
It can be seen from Figure 10b that, under the condition of T = 200 °C, with the increase of loading strain rate, the flow stress of the material show an increasing trend, and the strain values corresponding to the yield strength decrease. When the loading strain rate is 1033 s−1, in section hp of the figure, the flow stress of the material increases from 1210 MPa to 1320 MPa with the increase of strain, which shows a sharp upward trend, because the work hardening effect of the material increases the flow stress. In the pe section of the figure, the flow stress of the material is basically stable with the increase of strain, which is because part of the plastic work is converted into heat energy, and the thermal softening effect of the material will reduce the flow stress, so the flow stress increases slowly with the strain. When the strain exceeds the e point, the flow stress of the material shows a sharp downward trend with the increase of strain. This is because the thermal softening effect of the material exceeds the strain hardening effect, and the stress drop caused by the thermal softening effect exceeds the stress rise caused by the strain hardening, so the flow stress shows a sharp downward trend [29,30].
It can be seen from Figure 10d that the flow stress of TC18 titanium alloy is basically constant during plastic deformation. When the experimental temperature is lower than 600 °C, the flow stress increases with the increase of strain rate, but when T = 600 °C, the yield stress and flow stress of TC18 titanium alloy increase first and then decrease with the increase of strain rate. This is because, under the condition of high temperature and high strain rate, the dislocation packing and dislocation density of TC18 titanium alloy increase under the action of the impact load. It shows that the flow stress of the material increases, but the heat generated in the plastic deformation process will promote the regeneration and the recrystallization of the material, reduce the dislocation sliding, and increase the dislocation density, so it shows that the flow stress decreases with the increase of the strain rate [29,30].

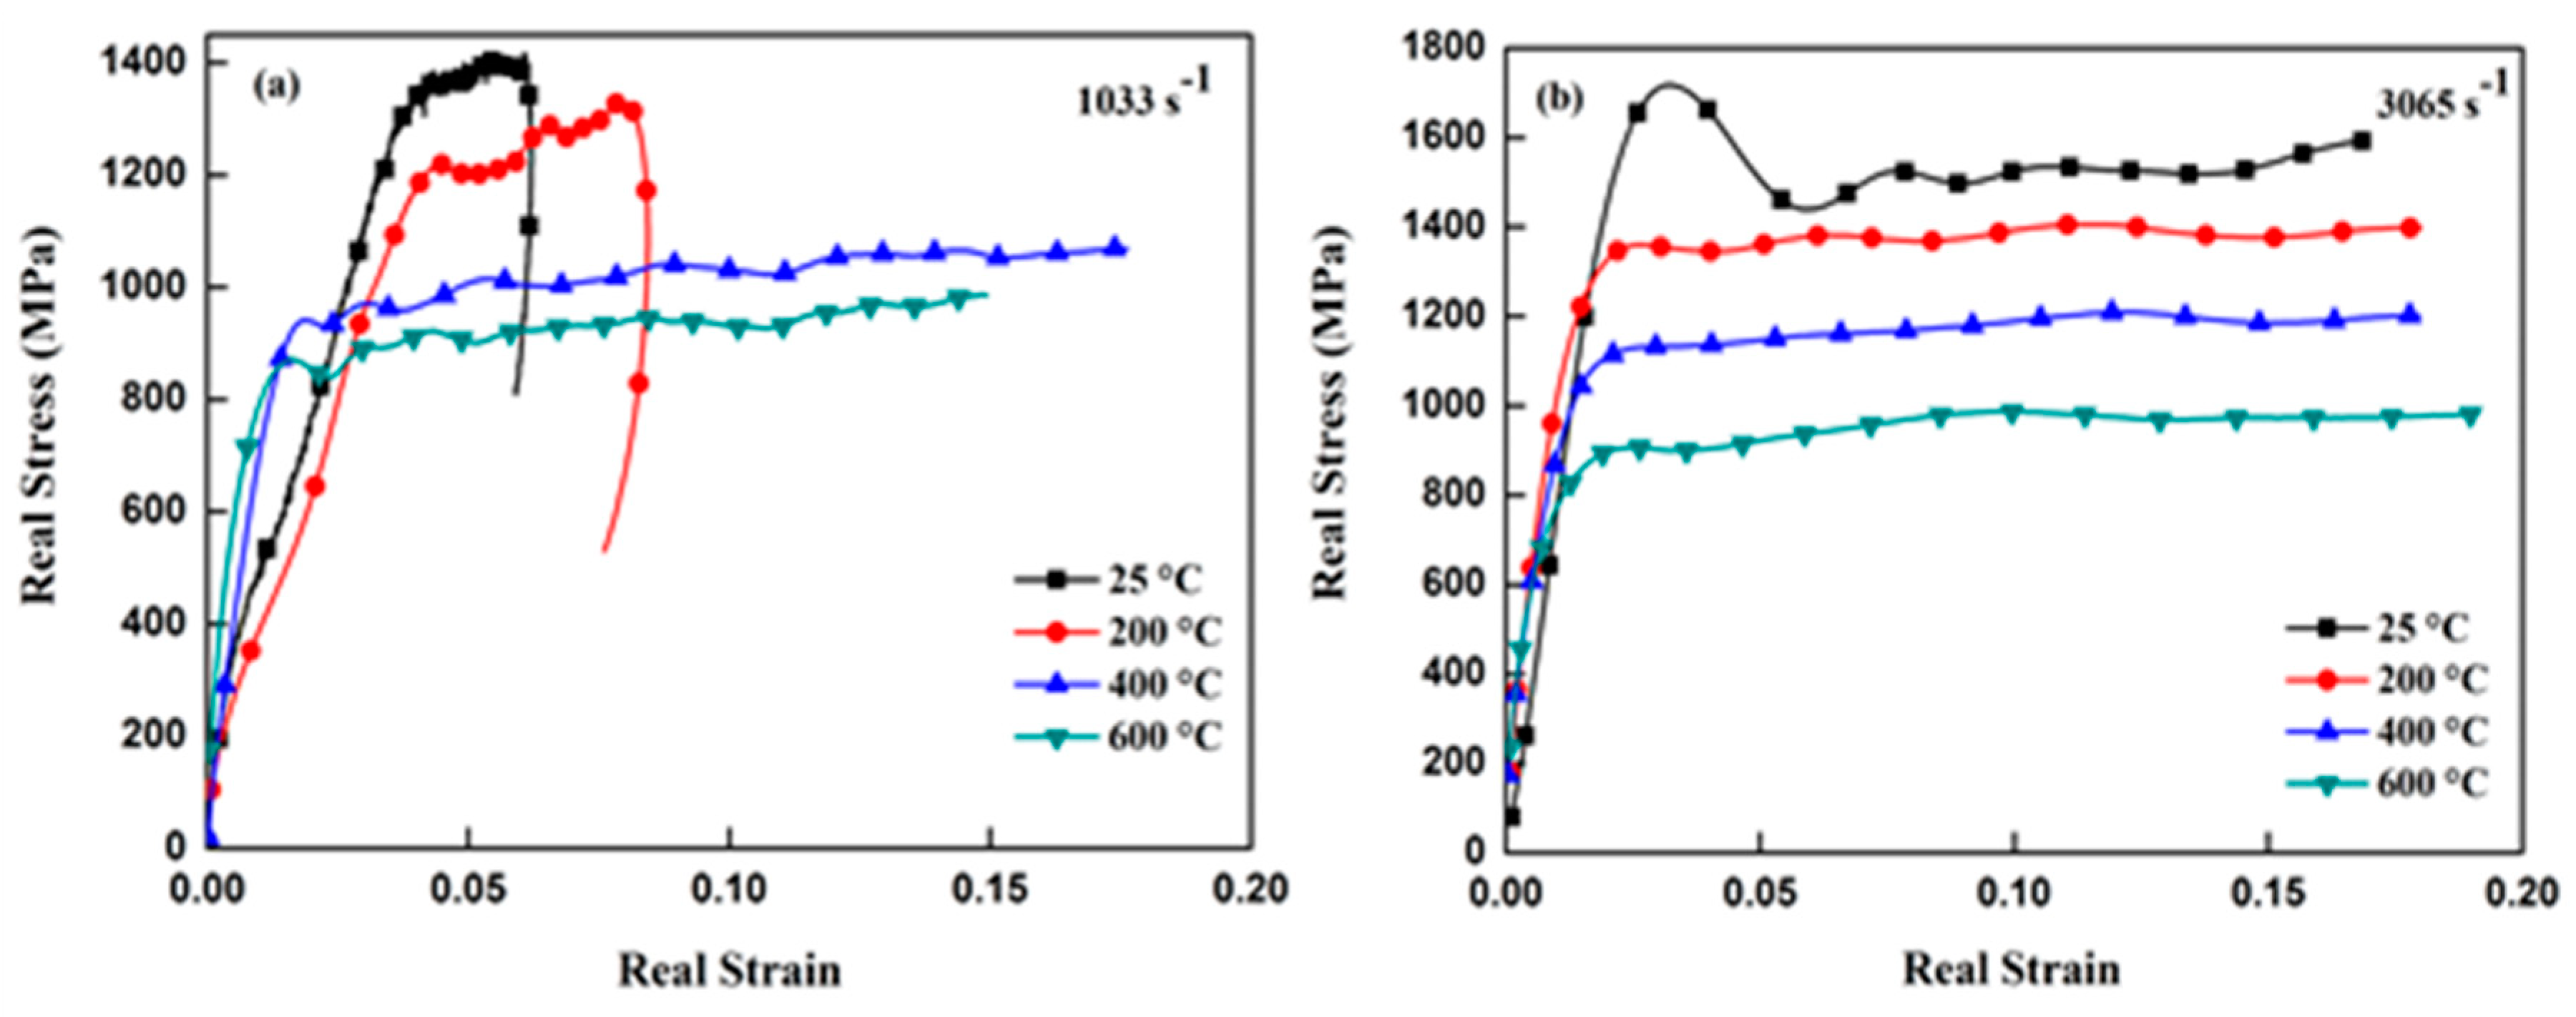
2.4.2. Temperature Sensitivity Analysis of TC18 Titanium Alloy

In order to analyze the temperature sensitivity of TC18 titanium alloy, the real stress and strain data measured at the same strain rate and different temperatures were simulated by Origin software to obtain the stress–strain curves at the same strain rate and different temperatures, and the influence of temperature on the flow stress of TC18 titanium alloy was analyzed. Figure 11 shows the stress–strain curves of TC18 alloy at different temperatures at (a) ε = 1033 s−1 and (b) ε = 3065 s−1.
It can be seen from Figure 11a that, with the increase of strain, the flow stress shows a trend of increasing first and then decreasing, and the strain values corresponding to the transition point increase, and the corresponding stress values remain basically unchanged. This is because, with the increase of plastic strain in the early stage, the dislocation slip, dislocation packing, and dislocation density appear in the grains, which shows the increase of flow stress. As the plastic deformation continues to increase, part of the plastic deformation work is converted into heat energy, and the strength value reduction caused by the temperature rise softening effect of the material is greater than that caused by strain strengthening, showing the decrease of flow stress [30]. At temperatures of 25 °C and 200 °C, the jump of elastic part of stress–strain curve is because of the fluctuation effect of the sample. Because, in the initial stage of stress pulse action, the internal state of the sample is uneven, the elastic part of the stress–strain curves jumps [31].
It can be seen from Figure 11b that, with the increase of the experimental temperature, the flow stress shows a downward trend and the stress value in the plastic deformation stage is basically constant. This is because the increase of temperature will enhance the dynamic recovery and recrystallization softening mechanism of the material. When the softening effect of the material exceeds the hardening effect, the flow stress of the material decreases, which shows that TC18 titanium alloy is very sensitive to temperature and has strong thermal softening effect [30]. So the flow stress increases with increasing strain rate and decreasing temperature. Meanwhile, the flow stress is more sensitive to temperature than to the strain rate [32].

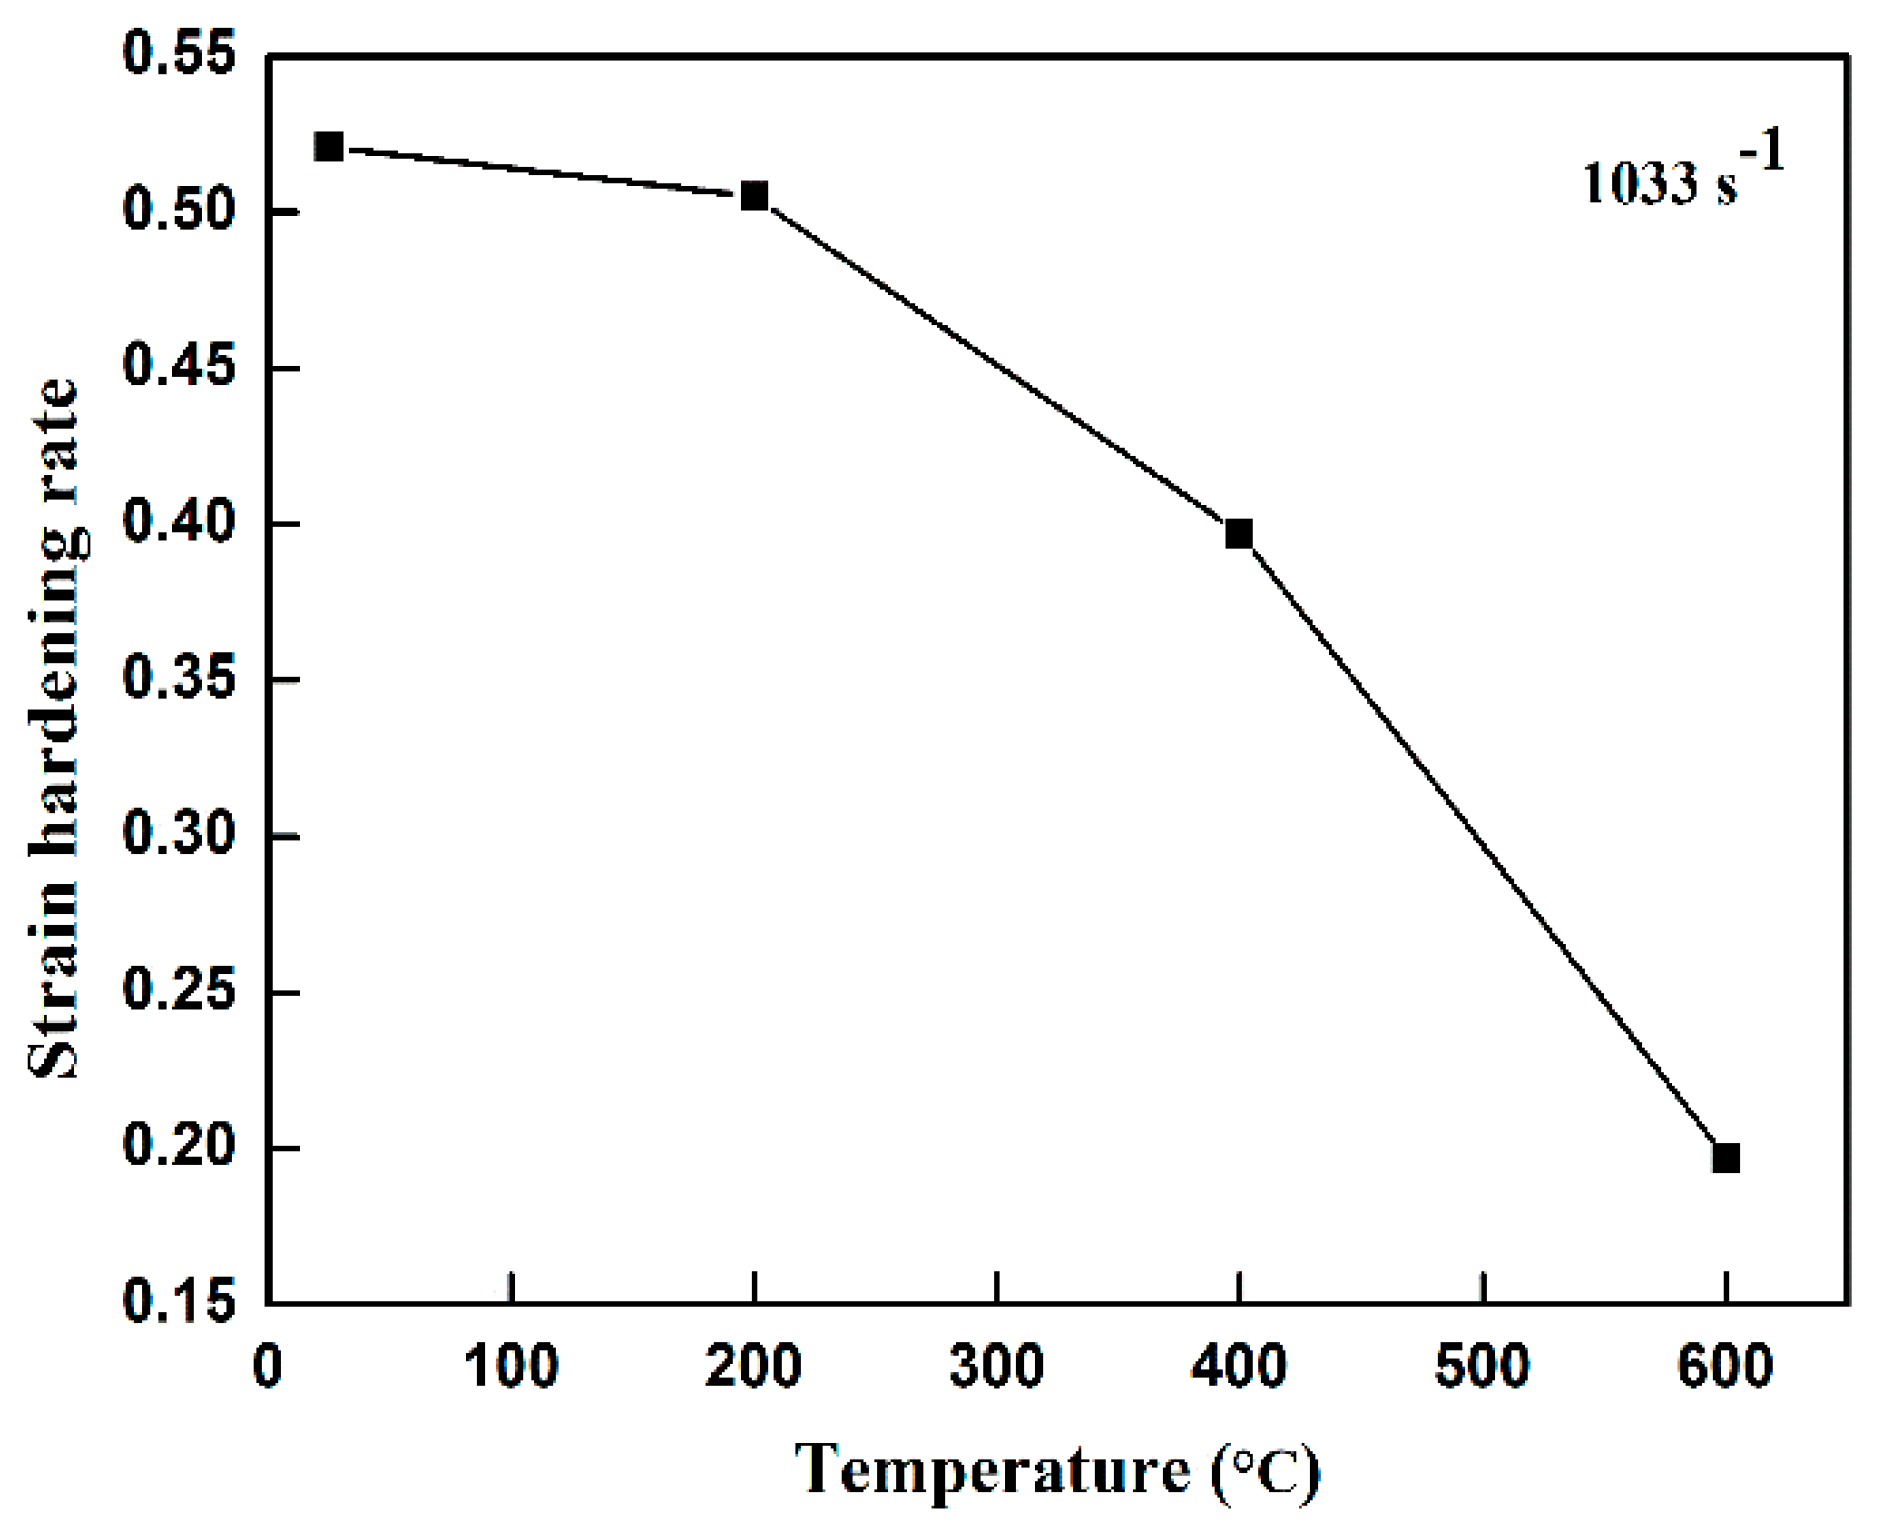
2.4.3. Analysis of Strain Hardening Rate of TC18 Titanium Alloy

Select the experimental data with strain rate ε = 1033 s−1, calculate the strain hardening index at different temperatures by the linear least squares method, and then use Origin software to simulate the strain hardening temperature curve, as shown in Figure 12.
It can be seen from Figure 12 that, with the increase of temperature, the strain hardening rate of materials presents a downward trend. When the temperature is lower than 200 °C, the strain hardening rate decreases slowly, and when the temperature is higher than 200 °C, the strain hardening rate decreases greatly, which shows that the thermal softening effect of the material exceeds the strain hardening effect at high temperature, so the thermal softening effect is the main factor affecting the flow stress drop.

2.5. JC Dynamic Constitutive Model for Dynamic Impact Test of TC18 Titanium Alloy

In order to better describe the mechanical properties of the material, it is necessary to establish a dynamic constitutive model suitable for the cutting process. In the cutting process, the strain, strain rate, temperature, and microstructure of the material are the main factors that affect the flow stress, but for the specific metal material, the strain, strain rate, and temperature constitute a comprehensive deformation condition. At present, there are many models to describe material flow stress, among which the JC constitutive model considers the influence of material strain, strain rate, and temperature on material flow stress. It describes the strain hardening effect, strain rate hardening effect, and thermal softening effect of material in cutting process, respectively, and has the characteristics of few parameters and simple form [33,34]. Therefore, the model is widely used to describe the flow stress of materials, with the following mathematical model form:
σ d = [ A + B ( ε q ) n ] [ 1 + C ln ( ε q ε 0 ) ] [ 1 ( T * ) m ] ,
where σ d is flow stress, ε q is plastic strain, A is yield strength under quasi-static condition, B is the strength coefficient, n is strain hardening index, C is the sensitivity of the material to the plastic strain rate, m is the sensitivity of material to thermal softening effect, ε q is plastic strain rate, and ε 0 is the reference plastic strain rate. We consider the elastic strain in the formula calculation.
T * = T T k T g T k , T k is room temperature, T g is the melting point of the material, and T is the temperature of the material.
In the JC constitutive model, the lowest experimental temperature and strain rate were selected to be the reference condition [35], among which T k is 25 °C and ε 0 is 0.001 s−1. The melting temperature ( T g ) of the TC18 titanium alloy was determined as 1678 °C [36]. Other unknown parameters need to be combined with the data of quasi-static compression experiment and Hopkins on compression bar experiment, and the JC constitutive model of TC18 titanium alloy can be obtained by the linear least squares method.

2.5.1. Determination of Parameters A , Β , and n in JC Constitutive Model

The five parameters of the JC constitutive model are fitted by static and dynamic compression experiments [37,38], in which the parameters A, B, and n in the JC constitutive model can be obtained from the experimental data of ε 0 = 0.001 s−1 and T = 25 °C under the quasi-static compression experiment. Under the quasi-static condition of room temperature, TC18 titanium alloy can be approximately linearly strengthened elastic-plastic material, and its strain rate hardening and thermal softening effects have little effect on the dynamic stress. Therefore, Formula (15) can be simplified as Formula (16):
σ d = A + B ( ε q ) n .
According to the quasi-static experimental data of room temperature and the stress–strain relationship curve under the strain rate of 0.001 s−1 in Figure 3, it can be seen that the yield stress of TC18 titanium alloy is 1180 MPa, that is to say, the parameter A is 1180 MPa, so Formula (16) can be simplified as follows:
σ d 1180 = B ( ε q ) n .
Order:
y = σ d 1180 ,   x = ε q .
Formula (17) can be changed to the following:
y = B x n .
Taking the logarithm on both sides of Formula (19), one gets the following:
ln y = ln B + n ln x .
According to the quasi-static experimental data and using the linear least squares [39] method in Statistical Product and Service Solutions 17.0 (SPSS) software (IBM Company, USA) to fit the equation, the following results are obtained: B = 762.079 , n = 0.625 .
Namely,
σ d = 1180 + 762.079 ( ε q ) 0.625 .

2.5.2. Determination of Parameters C and m in JC Constitutive Model

The parameter C in the JC constitutive equation can be obtained from the dynamic compression test data under different strain rates at room temperature. The flow stress of TC18 titanium alloy in the plastic stage no longer increases with the increase of strain, and the trend is close to gentle. The effect of strain strengthening on the dynamic stress is small. Therefore, the strain strengthening and thermal softening effects are not considered in the JC model; only strain rate strengthening effects are considered, so Formula (15) can be simplified as follows:
σ d i = σ 0 [ 1 + C ln ( ε q ε 0 ) ] ,
where σ d i is the yield stress at different strain rates at room temperature, σ 0 is 1180 MPa of the yield stress under the quasi-static condition, and ε 0 is 0.001 s−1 of the strain rate under quasi-static condition.
Order:
y = σ d i σ 0 1 ,   x = ln ( ε q ε 0 )
Then, Formula (22) can be changed into the following:
y = C x .
The linear least squares method in SPSS software is used to fit the experimental data under different strain rates at room temperature, and the following results are obtained: C = 0.0157 , and substitute the obtained C value into Formula (22) to get Formula (24):
σ d = 1180 × [ 1 + 0.0157 × ln ( ε q 0.001 ) ] .
Under the action of high temperature and high strain rate, the thermal softening effect of TC18 titanium alloy becomes the main factor affecting the flow stress. The parameter m of the JC constitutive equation can be obtained from the dynamic compression experimental data (a total of nine sets of data) with the temperature of 200 °C, 400 °C, and 600 °C and the strain rate of 1033 s−1, 2100 s−1, and 3065 s−1.
At high temperature and high strain rate, the JC model can be simplified to Formula (26):
σ d ( T * ) = σ d ( T k ) [ 1 ( T T k T g T k ) m ] ,
where σ d ( T * ) is the yield stress of TC18 titanium alloy at high temperature and σ d ( T k ) is the yield stress of TC18 titanium alloy at reference temperature. Taking the logarithm on both sides of Formula (26), one gets Formula (27):
ln ( 1 σ d ( T * ) σ d ( T k ) ) = mln ( T T k T g T k ) ,
where T k is 25 °C and T g is 1678 °C. Order:
y = ln ( 1 σ d ( T * ) σ d ( T k ) ) ,   x = ln ( T T k T g T k ) .
Then, Formula (28) can be changed into the following:
y = m x .
The linear least squares method in SPSS software is used to fit nine groups of experimental data under different temperature and strain rate. m = 0.939 was obtained, and the m value obtained is substituted into Formula (26) to get Formula (30):
σ d ( T * ) = σ d ( T k ) [ 1 ( T T k T g T k ) 0.939 ] .
The JC constitutive equation can be obtained by substituting the values of parameters A, B, n, C, and m into Formula (15):
σ d = [ 1180 + 762.079 × ( ε q ) 0.625 ] [ 1 + 0.0157 × ln ( ε q ε 0 ) ] [ 1 ( T T k T g T k ) 0.939 ] .

2.5.3. Verification of JC Constitutive Model of TC18 Titanium Alloy

The JC constitutive equation of TC18 titanium alloy is obtained through the data of quasi-static compression experiment and Hopkinson pressure bar experiment. In order to verify the accuracy of Formula (31), the data calculated by Formula (31) are fitted into the synthetic curve, and compared with the experimental curve under high temperature dynamic condition. The results are shown in Figure 13.
We choose some measuring points of the strain rate at ε = 1033 s−1 and ε = 3065 s−1 to compare the calculated value and the actual measured value of the fitting model. It can be seen from Figure 13a,b that the fitting result of Formula (31) is in good agreement with the high-temperature dynamic compression test result, which shows that the JC constitutive model can better predict the plastic flow stress of TC18 titanium alloy under the joint action of high temperature and impact load [40].

3. Conclusions

The dynamic mechanical behavior of TC18 titanium alloy can truly reflect the actual properties of material deformation in the actual cutting process. On the basis of the constitutive equation, the flow stress in the milling process can be predicted, and the appropriate milling parameters can be selected to improve the surface quality. Therefore, the dynamic mechanical properties of TC18 titanium alloy were studied using the split Hopkins pressure bar experimental device (SHPB). The relationship between flow stress and strain of TC18 titanium alloy under different impact loads, different temperatures, and different strain rates was analyzed, and the JC constitutive equation was established according to the experimental data. The conclusions are as follows:
(1) Under the same temperature, the yield strength and the flow stress of the TC18 titanium alloy material tend to increase slowly with the increase of the strain rate, and the strain value corresponding to the yield strength is reduced. However, when the temperature exceeds 600 °C, the yield stress and flow stress increase first and then decrease with the increase of strain rate.
(2) With the increase of strain, the flow stress increases first and then decreases, and the strain value corresponding to the transition point increases, and the corresponding stress value basically remains unchanged.
(3) With the increase of experimental temperature, the flow stress shows a downward trend and the stress value in plastic deformation stage is basically constant.
(4) The linear least squares method is used to establish the JC constitutive model under the common action of the high temperature and the impact load, and verify the correctness of the constitutive model.

Author Contributions

C.Z. designed all the experiments in the article, analyzed the experimental data, wrote the first draft, wrote comments and edited the manuscript. A.M. designed quasi-static compression experiment to help analyze the experimental data of quasi-static compression experiment, and drafted stress-strain relation curve at room temperature. Y.W. designed the Hopkinson pressure bar experiment, helped to analyze the experimental data, and wrote some articles of the Hopkinson pressure bar experiment. H.Z. helps analyze experimental data, write reviews and edit manuscripts. All authors have read and agreed to the published version of the manuscript.

Funding

This research was funded by the Natural Science Foundation of Shaanxi Province No. 2019GY-184.

Conflicts of Interest

The authors declare no conflict of interest.

References

  1. Boyer, R.R. An overview on the use of titanium in the aerospace industry. Mater. Sci. Eng. A 1996, 213, 103–114. [Google Scholar] [CrossRef]
  2. Jia, B.H.; Song, W.D.; Tang, H.P.; Wang, Z.H.; Mao, X.N.; Ning, J.G. Hot deformation behavior and constitutive model of TC18 alloy during compression. Rare Met. 2014, 33, 383–389. [Google Scholar] [CrossRef]
  3. Ning, Y.Q.; Xie, B.C.; Liang, H.Q.; Li, H.; Yang, X.M.; Guo, H.Z. Dynamic softening behavior of TC18 titanium alloy during hot deformation. Mater. Des. 2015, 71, 68–77. [Google Scholar] [CrossRef]
  4. Nyakana, S.L.; Fanning, J.C.; Boyer, R.R. Quick reference guide for β titanium alloys in the 00s. Mater. Eng. Perform. 2005, 14, 799–811. [Google Scholar] [CrossRef]
  5. Huang, L.J.; Geng, L.; Li, A.B.; Wang, G.S.; Cui, X.P. Effects of hot compression and heat treatment on the microstructure and tensile property of Ti-6.5Al-3.5Mo-1.5Zr-0.3Si alloy. Mater. Sci. Eng. A 2008, 489, 330–336. [Google Scholar] [CrossRef]
  6. Imayev, V.; Imayev, R.; Khismatullin, T.; Güther, V.; Beck, W.; Fecht, H.J. Superplastic behavior of Ti-43Al-7(Nb, Mo)-0.2B alloy in the cast + heat-treated condition. Scr. Mater. 2007, 57, 193–196. [Google Scholar] [CrossRef]
  7. Ko, Y.G.; Lee, C.S.; Shin, D.H. Deformation characteristics of sub microcrystalline Ti-6Al-4V. Scr. Mater. 2008, 58, 1094–1097. [Google Scholar] [CrossRef]
  8. Zhou, Z.B.; Fei, Y.; Lai, M.J.; Kou, H.C.; Chang, H.; Shang, G.Q.; Zhu, Z.S.; Li, J.S.; Zhou, L. Microstructure and mechanical properties of new metastable β type titanium alloy. Trans. Nonferrous Met. Soc. China 2010, 20, 2253–2258. [Google Scholar] [CrossRef]
  9. Zhou, Z.B.; Li, J.S.; Kou, H.C.; Zhou, Z.S. Aging response of TB-13 titanium alloy. Mater. Sci. Forum 2010, 654–656, 859–862. [Google Scholar] [CrossRef]
  10. Umbrello, D. Finite element simulation of conventional and high speed machining of Ti6Al4V alloy. Mater. Process. Technol. 2007, 196, 79–87. [Google Scholar] [CrossRef]
  11. Zhang, S.; Liu, Z.; Wang, G.; Chen, L.; Liu, X.; Yang, R. Microstructural evolution during aging of Ti-5Al-5Mo-5V-1Cr-1Fe alloy. Cent. South. Univ. 2009, 16, 354–359. [Google Scholar] [CrossRef]
  12. Balaykin, A.V.; Nosova, E.A.; Galkina, N.V. Study of the Ti-5Al-5Mo-5V-1Cr-1Fe titanium alloy grain structure uniformity after bending and annealing. IOP Conf. Ser. Mater. Sci. Eng. 2017, 177, 012106. [Google Scholar] [CrossRef] [Green Version]
  13. Ran, C.; Chen, P.; Li, L.; Zhang, W.; Liu, Y.; Zhang, X. High-strain-rate plastic deformation and fracture behaviour of Ti-5Al-5Mo-5V-1Cr-1Fe titanium alloy at room temperature. Mech. Mater. 2018, 116, 3–10. [Google Scholar] [CrossRef]
  14. Luo, J.; Liu, S.F.; Li, M.Q. Quantitative analysis of microstructure and deformation mechanisms during isothermal compression of Ti–5Al–5Mo–5V–1Cr–1Fe alloy. Mater. Charact. 2015, 108, 115–123. [Google Scholar] [CrossRef]
  15. Shi, C.; Wu, G.; Sha, A.; Jiang, H. Effect of microstructures on fatigue property of TC18 titanium alloy with equal strength. Procedia Eng. 2012, 27, 1209–1215. [Google Scholar] [CrossRef] [Green Version]
  16. Luo, J.; Wang, L.F.; Liu, S.F.; Li, M.Q. The correlation between the flow behavior and the microstructure evolution during hot working of TC18 alloy. Mater. Sci. Eng. A 2016, 654, 213–220. [Google Scholar] [CrossRef]
  17. Nie, X.; Liu, H.; Zhou, X.; Yi, D.; Huang, B.; Hu, Z.; Xu, Y.; Yang, Q.; Wang, D.; Gao, Q. Creep of Ti–5Al–5Mo–5V–1Fe–1Cr alloy with equiaxed and lamellar microstructures. Mater. Sci. Eng. A 2016, 651, 37–44. [Google Scholar] [CrossRef]
  18. Zherebtsov, S.V.; Murzinova, M.A.; Klimova, M.V.; Salishchev, G.A.; Popov, A.A.; Semiatin, S.L. Microstructure evolution during warm working of Ti-5Al-5Mo-5V-1Cr-1Fe at 600 °C and 800 °C. Mater. Sci. Eng. A 2013, 563, 168–176. [Google Scholar] [CrossRef] [Green Version]
  19. Wang, K.; Bao, R.; Jiang, B.; Wu, Y.; Liu, D.; Yan, C. Effect of primary, α phase on the fatigue crack path of laser melting deposited Ti–5Al–5Mo–5V–1Cr–1Fe near, β titanium alloy. Inter. J. Fatigue 2018, 116, 535–542. [Google Scholar] [CrossRef]
  20. Masahito, M.; Makoto, H.; Toshio, H. Numerical analysis of welding residual stress and its verification using neutron diffraction measurement. Trans. ASME J. Eng. Mater. Tech. 2000, 122, 98–103. [Google Scholar] [CrossRef]
  21. Kampfe, B. Investigation of residual stresses in microsystems using X-ray diffraction. Mater. Sci. Eng. A 2000, 288, 119–125. [Google Scholar] [CrossRef]
  22. Xiao, J.; Wang, J.; Guo, W.G.; He, Y.; Li, P. The influence of heat treatment and strain rate on the third type strain ageing phenomenon. Mater. High. Temp. 2019, 36, 104–110. [Google Scholar] [CrossRef]
  23. Chen, X.; Soveja, A.; Chaussumier, M.; Zhang, P.; Wei, D.; Ding, F. Effect of MEVVA ion implantation on fatigue properties of TC18 titanium alloy. Surf. Coat. Tech. 2018, 344, 572–578. [Google Scholar] [CrossRef]
  24. Wood, P.K.C.; Schley, C.A.; Mcgregor, I.; Dutton, T. Characterizing performance of automotive materials at high strain rate for improved crash design. J. Phys. IV Proc. 2006, 134, 1167–1174. [Google Scholar] [CrossRef] [Green Version]
  25. Wang, J.; Guo, W.G.; Li, P.; Zhou, P.; Wang, Z. Dynamic tensile properties of a single crystal Nickel-base superalloy at high temperatures measured with an improved SHTB technique. Mater. Sci. Eng. A 2016, 670, 1–8. [Google Scholar] [CrossRef]
  26. Peirs, J.; Verleysen, P.; Degrieck, J.; Coghe, F. The use of hat-shaped specimens to study the high strain rate shears behaviour of Ti-6Al-4V. Inter. J. Impact Eng. 2010, 37, 703–714. [Google Scholar] [CrossRef] [Green Version]
  27. Xu, W.-C.; Shan, D.-B.; Yang, G.-P.; Lv, Y. Flow behavior and microstructure evolution during hot compression of TA15 titanium alloy. Trans. Nonferrous Met. Soc. China 2006, 16, 2066–2071. [Google Scholar]
  28. Field, J.E.; Walley, S.M.; Proud, W.G.; Goldrein, H.T.; Siviour, C.R. Review of experimental techniques for high rate deformation and shock studies. Int. J. Impact Eng. 2004, 30, 725–775. [Google Scholar] [CrossRef]
  29. Sun, S.D.; Zong, Y.Y.; Shan, D.B.; Guo, B. Hot deformation behavior and microstructure evolution of TC4 titanium alloy. Trans. Nonferrous Met. Soc. China 2010, 20, 2181–2184. [Google Scholar] [CrossRef]
  30. Martinez, F.; Murr, L.E.; Ramirez, A.; Lopez, M.I.; Gaytan, S.M. Dynamic deformation and adiabatic shear microstructures associated with ballistic plug formation and fracture in Ti–6Al–4V targets. Mater. Sci. Eng. A (Struct. Mater. Prop. Microstruct. Process.) 2007, 454–455, 581–589. [Google Scholar] [CrossRef]
  31. Wang, L. Influences of Stress Wave propagation upon studying dynamic response of materials at high strain rates. J. Beijing Inst. Tech. 2004, 13, 225–235. [Google Scholar] [CrossRef]
  32. Zhan, H.; Kent, D.; Wang, G.; Dargusch, M.S. The dynamic response of a β titanium alloy to high strain rates and elevated temperatures. Mater. Sci. Eng. A 2014, 607, 417–426. [Google Scholar] [CrossRef] [Green Version]
  33. Dey, S.; Borvik, T.; Hopperstad, O.S.; Langseth, M. On the influence of constitutive relation in projectile impact of steel plates. Inter. J. Impact Eng. 2007, 34, 464–486. [Google Scholar] [CrossRef]
  34. Slycken, J.V.; Verleysen, P.; Degrieck, J.; Samek, L.; de Cooman, B.C. High-strain-rate behavior of low-alloy multiphase aluminum- and silicon-based transformation-induced plasticity steels. Metall. Mater. Trans. A Phys. Metall. Mater. Sci. 2006, 37, 1527–1539. [Google Scholar] [CrossRef]
  35. Chen, L.; Zhao, G.; Yu, J. Hot deformation behavior and constitutive modeling of homogenized 6026 aluminum alloy. Mater. Des. 2015, 74, 25–35. [Google Scholar] [CrossRef]
  36. Chen, J.L.; Li, J.F.; Sun, J.; Wang, Z.Q. The influence of material constitutive constants on numerical simulation of orthogonal cutting of titanium alloy Ti6Al4V. Key Eng. Mater. 2008, 375–376, 182–186. [Google Scholar] [CrossRef]
  37. Coghe, F.; Rabet, L.; Kestens, L. Deformation mechanisms of a commercial titanium alloy Ti6Al4V as a function of strain rate and initial texture. Le J. Phys. IV 2006, 134, 845–850. [Google Scholar] [CrossRef]
  38. Samantaray, D.; Mandal, S.; Bhaduri, A.K. A comparative study on Johnson Cook modified Zerilli–Armstrong and Arrhenius-type constitutive models to predict elevated temperature flow behaviour in modified 9Cr–1Mo steel. Comput. Mater. Sci. 2009, 47, 568–576. [Google Scholar] [CrossRef]
  39. Di, C.C.; Cui, K.B.; Qin, J.Q.; Wu, D.L. Parameters identification of Johnson-Cook constitutive equation for aluminum brass. Adv. Mater. Res. 2014, 887–888, 1032–1035. [Google Scholar] [CrossRef]
  40. Li, Y.; Wang, J.; Guo, W.; Guo, J. A modified model of residual strength prediction for metal plates with through-thickness cracks. J. Theor. Appl. Mech. 2019, 57, 537–547. [Google Scholar] [CrossRef]
Figure 1. Experimental device diagram.
Metals 10 00044 g001
Figure 2. Sample clamping drawing.
Metals 10 00044 g002
Figure 3. Stress–strain relation curve at room temperature quasi-static.
Metals 10 00044 g003
Figure 4. Principle diagram of Hopkinson compression bar experiment.
Metals 10 00044 g004
Figure 5. Hopkinson pressure bar experimental device.
Metals 10 00044 g005
Figure 6. Cold contact time (CCT) diagram.
Metals 10 00044 g006
Figure 7. Schematic diagram of sample clamping.
Metals 10 00044 g007
Figure 8. Experimental device.
Metals 10 00044 g008
Figure 9. Waveform signal measured by experiment (room temperature, 5200 s−1).
Metals 10 00044 g009
Figure 10. Stress–strain curve of TC18 alloy at the same temperature and different strain rates ((a) shows the stress–strain curves of different strain rates at T = 25 °C, (b) shows the stress–strain curves of different strain rates at T = 200 °C, (c) shows the stress–strain curves of different strain rates at T = 400 °C, and (d) shows the stress–strain curves of different strain rates at T = 600 °C).
Metals 10 00044 g010
Figure 11. Stress–strain curve of TC18 alloy at the same strain rate and different temperatures ((a) shows the stress–strain curves of different temperatures at ε = 1033 s−1, (b) shows comparison of calculated value and experimental value of different temperatures at ε = 3065 s−1).
Metals 10 00044 g011
Figure 12. Strain hardening rate-temperature curve of TC18 titanium alloy.
Metals 10 00044 g012
Figure 13. Comparison of calculated value and experimental value of TC18 titanium alloy at the same strain rate and different temperatures ((a) shows comparison of calculated value and experimental value of different temperatures at ε = 1033 s−1, (b) shows the stress–strain curves of different temperatures at ε = 3065 s−1).
Metals 10 00044 g013
Table 1. Main chemical composition of TC18 titanium alloy (%) [23].
AlMoVCrFeONTi
4.674.785.081.060.9360.140.012Bal
Table 2. Mechanical properties of TC18 titanium alloy [23].
Tensile Strength
σb/MPa
Yield Strength
σ0.2/MPa
Reduction of Area
ψ/%
Elongation
δ/%
1120106017%8.5%
Table 3. Split Hopkinson compression bar (SHPB) experimental scheme.
Temperature25 °C200 °C400 °C600 °C
Strain rate1033 s−11033 s−11033 s−11033 s−1
3011 s−12100 s−12100 s−12100 s−1
5015 s−13065 s−13065 s−13065 s−1

