Article

Nondestructive Evaluation of Thermal Aging in Al6061 Alloy by Measuring Acoustic Nonlinearity of Laser-Generated Surface Acoustic Waves

1
Department of Convergence Mechanical Engineering, Hanyang University, Seoul 04763, Korea
2
Strategy Research Division, Korea Atomic Energy Research Institute, Daejeon 34057, Korea
3
School of Mechanical Engineering, Hanyang University, Seoul 04763, Korea
*
Authors to whom correspondence should be addressed.
Metals 2020, 10(1), 38; https://doi.org/10.3390/met10010038
Submission received: 30 November 2019 / Revised: 21 December 2019 / Accepted: 23 December 2019 / Published: 24 December 2019
(This article belongs to the Special Issue Advanced Surface Enhancement)

Abstract

:
The structures in high-temperature environments are prone to undergo hardening and embrittlement as a result of thermal aging; this can cause variations in their mechanical properties. Because these changes occur at the microstructural level, it is difficult to evaluate them through linear ultrasonic techniques. In this work, a surface acoustic wave (SAW) was used to measure and compare the acoustic nonlinearity and mechanical properties of Al6061 alloys heat-treated at 220 °C for different durations (0 min, 20 min, 40 min, 1 h, 2 h, 10 h, 100 h, 1000 h). The SAW was generated by a pulsed laser and then received by an interferometer. Moreover, the yield strength, ultimate strength, and elongation to failure were measured by tensile tests. The results demonstrate that the critical variations in the mechanical properties can be detected by monitoring the variation features in the acoustic nonlinearity. Transmission electron microscopy images were captured to observe the microstructural changes, which shows that the acoustic nonlinearity varied according to the change in the precipitation phase. This supports the acoustic nonlinearity measurement using the laser-generated SAW being an effective technique for the fully noncontact nondestructive evaluation of material degradations as well as changes in mechanical properties.

Graphical Abstract

1. Introduction

Aluminum alloys have been widely employed for various purposes, including aircraft, robots, ships, space vehicles, and automotive parts [1,2], because they provide cost-effectiveness for stiff and lightweight designs [3]. The more the aluminum alloys are used, the more they are exposed to extreme environments with high temperatures and high pressures. In particular, long-term operations under these circumstances can cause a degradation of their mechanical properties: strength, elongation, and toughness; this represents a significant threat to the integrity of structures and reduces their remaining lifespan [4]. For this reason, the evaluation of such material degradations is periodically required for structural health monitoring [5]. Notably, most of the materials used in nuclear power plants suffer from thermal or creep aging. As the safety risks of the deteriorating structures increase in number, the demand for in-service nondestructive techniques to evaluate the aging level of structures, and to predict their remaining lifespan, has been growing.
In-service nondestructive evaluation (NDE) is an effective and practical method for detecting and assessing material degradations [6,7,8,9,10]. The most extensively used method in NDE is ultrasonic testing, which is effective because it has high mobility and high feasibility with a relatively simple instrumentation and uncomplicated configuration [6,7,10,11]. Particularly, the measurement of acoustic nonlinearity has shown its effectiveness in the evaluation of microstructural changes in materials, including stress corrosion cracks [12], plastic deformation [13,14,15,16], residual stress [17], fatigue [5,6,14,16,18,19,20,21], thermal aging [4,8,9,22,23,24,25,26], creep [10], and so on [18,27,28]. The microstructural changes, such as the evolution of dislocation structure, precipitate growth, and the phase transitions of precipitates, affect the acoustic nonlinearity of any ultrasonic waves propagating through the region where the microstructural change has taken place. By monitoring the variations in the acoustic nonlinearity, the changes in the microstructure can be nondestructively evaluated. Several theoretical [5,8,18,29] and experimental [4,5,6,8,9,10,12,13,14,15,16,17,18,20,22,23,24,25,26,27,28,29,30] studies have shown that the acoustic nonlinearity parameter can represent a sensitive indicator in the NDE of the material degradations.
The NDE using a surface acoustic wave (SAW), also known as a Rayleigh wave, has many advantages in industrial applications [14,27,28,30,31] compared to bulk acoustic waves [5,7,10,14,15,18,22,23,25,29]. Since the SAW can be generated and received on only one side of the target, the NDE using the SAW is a powerful solution for the situations in which the accessible area is limited. Furthermore, the SAW can travel a long distance because most of its acoustic energy is concentrated near the surface where the SAW propagates. Therefore, the NDE using the SAW is a feasible and promising candidate for inspecting large areas of complex structures. In order to measure the acoustic nonlinearity by using the SAW for the NDE of the material degradations, both contact [7,12,16,17,19,20] and non-contact [6,13,14,24,27,28,30,31,32] methods have been studied. Although the generation mechanisms of the SAWs are different from each other, e.g., using a contact transducer or using a pulsed laser shot, the variation trend in the acoustic nonlinearity was measured similarly with respect to the material degradation [33]. However, there is no comparison of the three methods using the SAW for the NDE of the same specimens: fully contact, semi noncontact, and fully noncontact methods. To confirm the reliability and feasibility of acoustic nonlinearity measurements using the SAW, it is necessary to ensure that the changes observed in acoustic nonlinearity are similar irrespective of the excitation and reception methods used for the SAW. Furthermore, the analysis of the relationship between the variation in the acoustic nonlinearity and the microstructural changes will be useful for understanding which features of microstructural changes have an influence on the acoustic nonlinearity.
In this study, an NDE of thermal aging was conducted via a fully noncontact method using a SAW for aluminum alloys (Al6061-T6). The alloys have been heat-treated for eight different durations: 0 min, 20 min, 40 min, 1 h, 2 h, 10 h, 100 h, and 1000 h. Their transmission electron microscopy (TEM) images were also taken to observe and analyze the changes in the precipitation phase corresponding to the heat-treatment durations. The SAW used to measure the acoustic nonlinearity was generated by using a Nd:YAG pulsed laser shot of 1064 nm (Spectron Laser Systems, Warwickshire, UK), and was then received by a laser interferometer via two-wave mixing in the photorefractive crystal (Tecnar, Saint-Bruno-de-Montarville, QC, Canada). For each thermal-aged specimen, the relative acoustic nonlinearity parameter was obtained via a frequency analysis of the received SAW signals, and by its linear regression. The results of this fully noncontact method were compared to that of contact and semi noncontact methods, as well as to the yield strengths reported in our previous works [33]. The ultimate strength and elongation to failure were also compared. The results show that there is a strong correlation between the variation trends in acoustic nonlinearity and the mechanical properties of the alloys, regardless of the excitation and reception methods of the SAW. Moreover, the TEM images indicate that the precipitate phase changes affect the variation in the acoustic nonlinearity. Consequently, this study shows that the acoustic nonlinearity measurements using the laser-generated SAW in the fully noncontact method is effective for nondestructively assessing both the microstructural changes and material degradations.

2. Materials

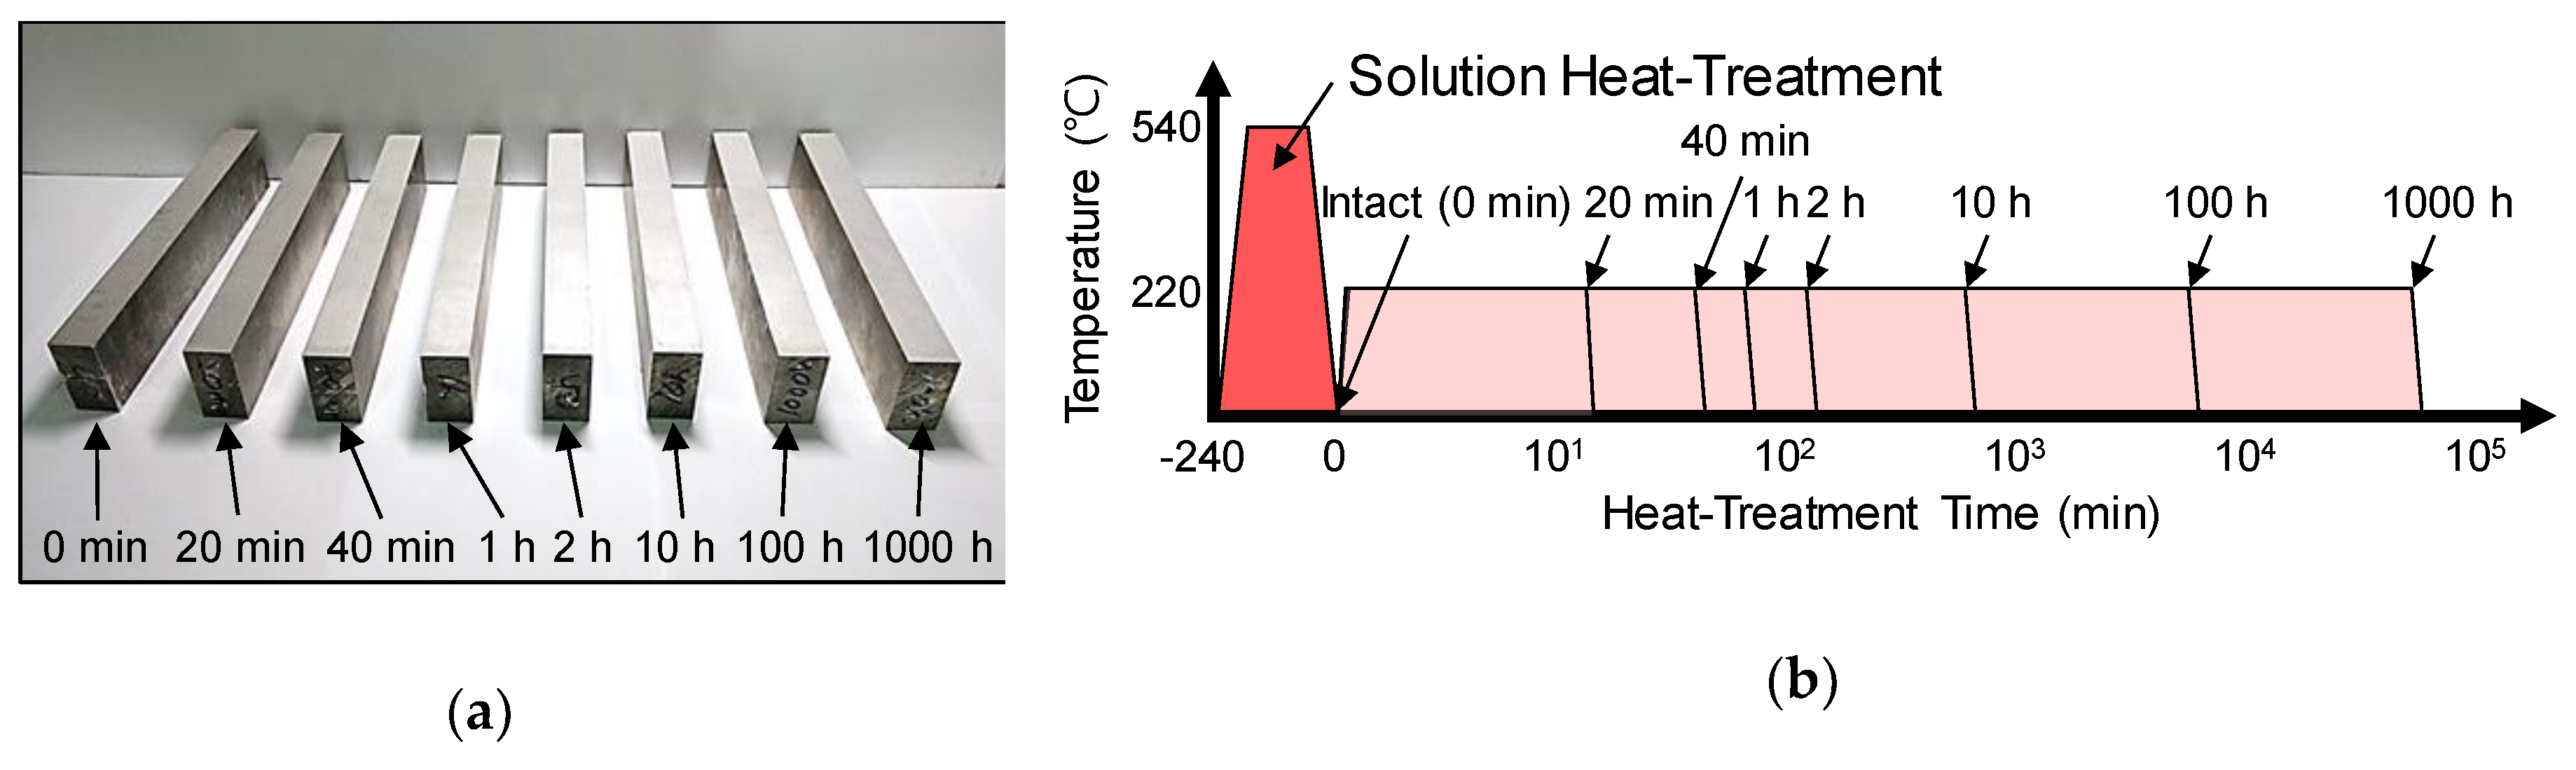
2.1. Thermal-Aged Specimens and Heat-Treatment Processes

The thermal-aged specimens shown in Figure 1a were cut from an aluminum alloy plate (Al6061) by wire-cut electrical discharge machining (WEDM), under uniform conditions to guarantee the same flatness and roughness of the inspected surfaces. The specimens had dimensions of 20 mm × 38 mm × 200 mm. In order to make the specimens feature gradually differing levels of thermal aging, the heat-treatment was conducted with eight different durations as shown in Figure 1b. Firstly, all the specimens were solution heat-treated for 4 h at 540 °C in a muffle furnace and then water-cooled, which plays an important role in transforming the precipitates of the specimens into the quasi-homogeneous state, by putting the pre-existing precipitating microscopic particles back into the solution. After that, the specimens were heat-treated at 220 °C for eight durations: 0 min, 20 min, 40 min, 1 h, 2 h, 10 h, 100 h, and 1000 h. This resulted in the specimens with eight levels of thermal aging.

2.2. Tensile Destructive Tests

For each specimen, two samples were extracted by WEDM to measure their yield strength ( σ Y ) [33], ultimate strength ( σ U ) , and elongation to failure ( ε F ) via tensile destructive tests. Each sample had dimensions of 2 mm × 6 mm × 33 mm. The tensile tests were carried out by following the ASTM E8M standard. Using the MTS Landmark Servohydraulic Test System (MTS Systems Corporation, Eden Prairie, MN, USA), each sample was elongated with a strain rate of 3 mm/min until failure. As a result, two values of each mechanical property were obtained from the two samples for each thermal-aged specimen as listed in Table 1.

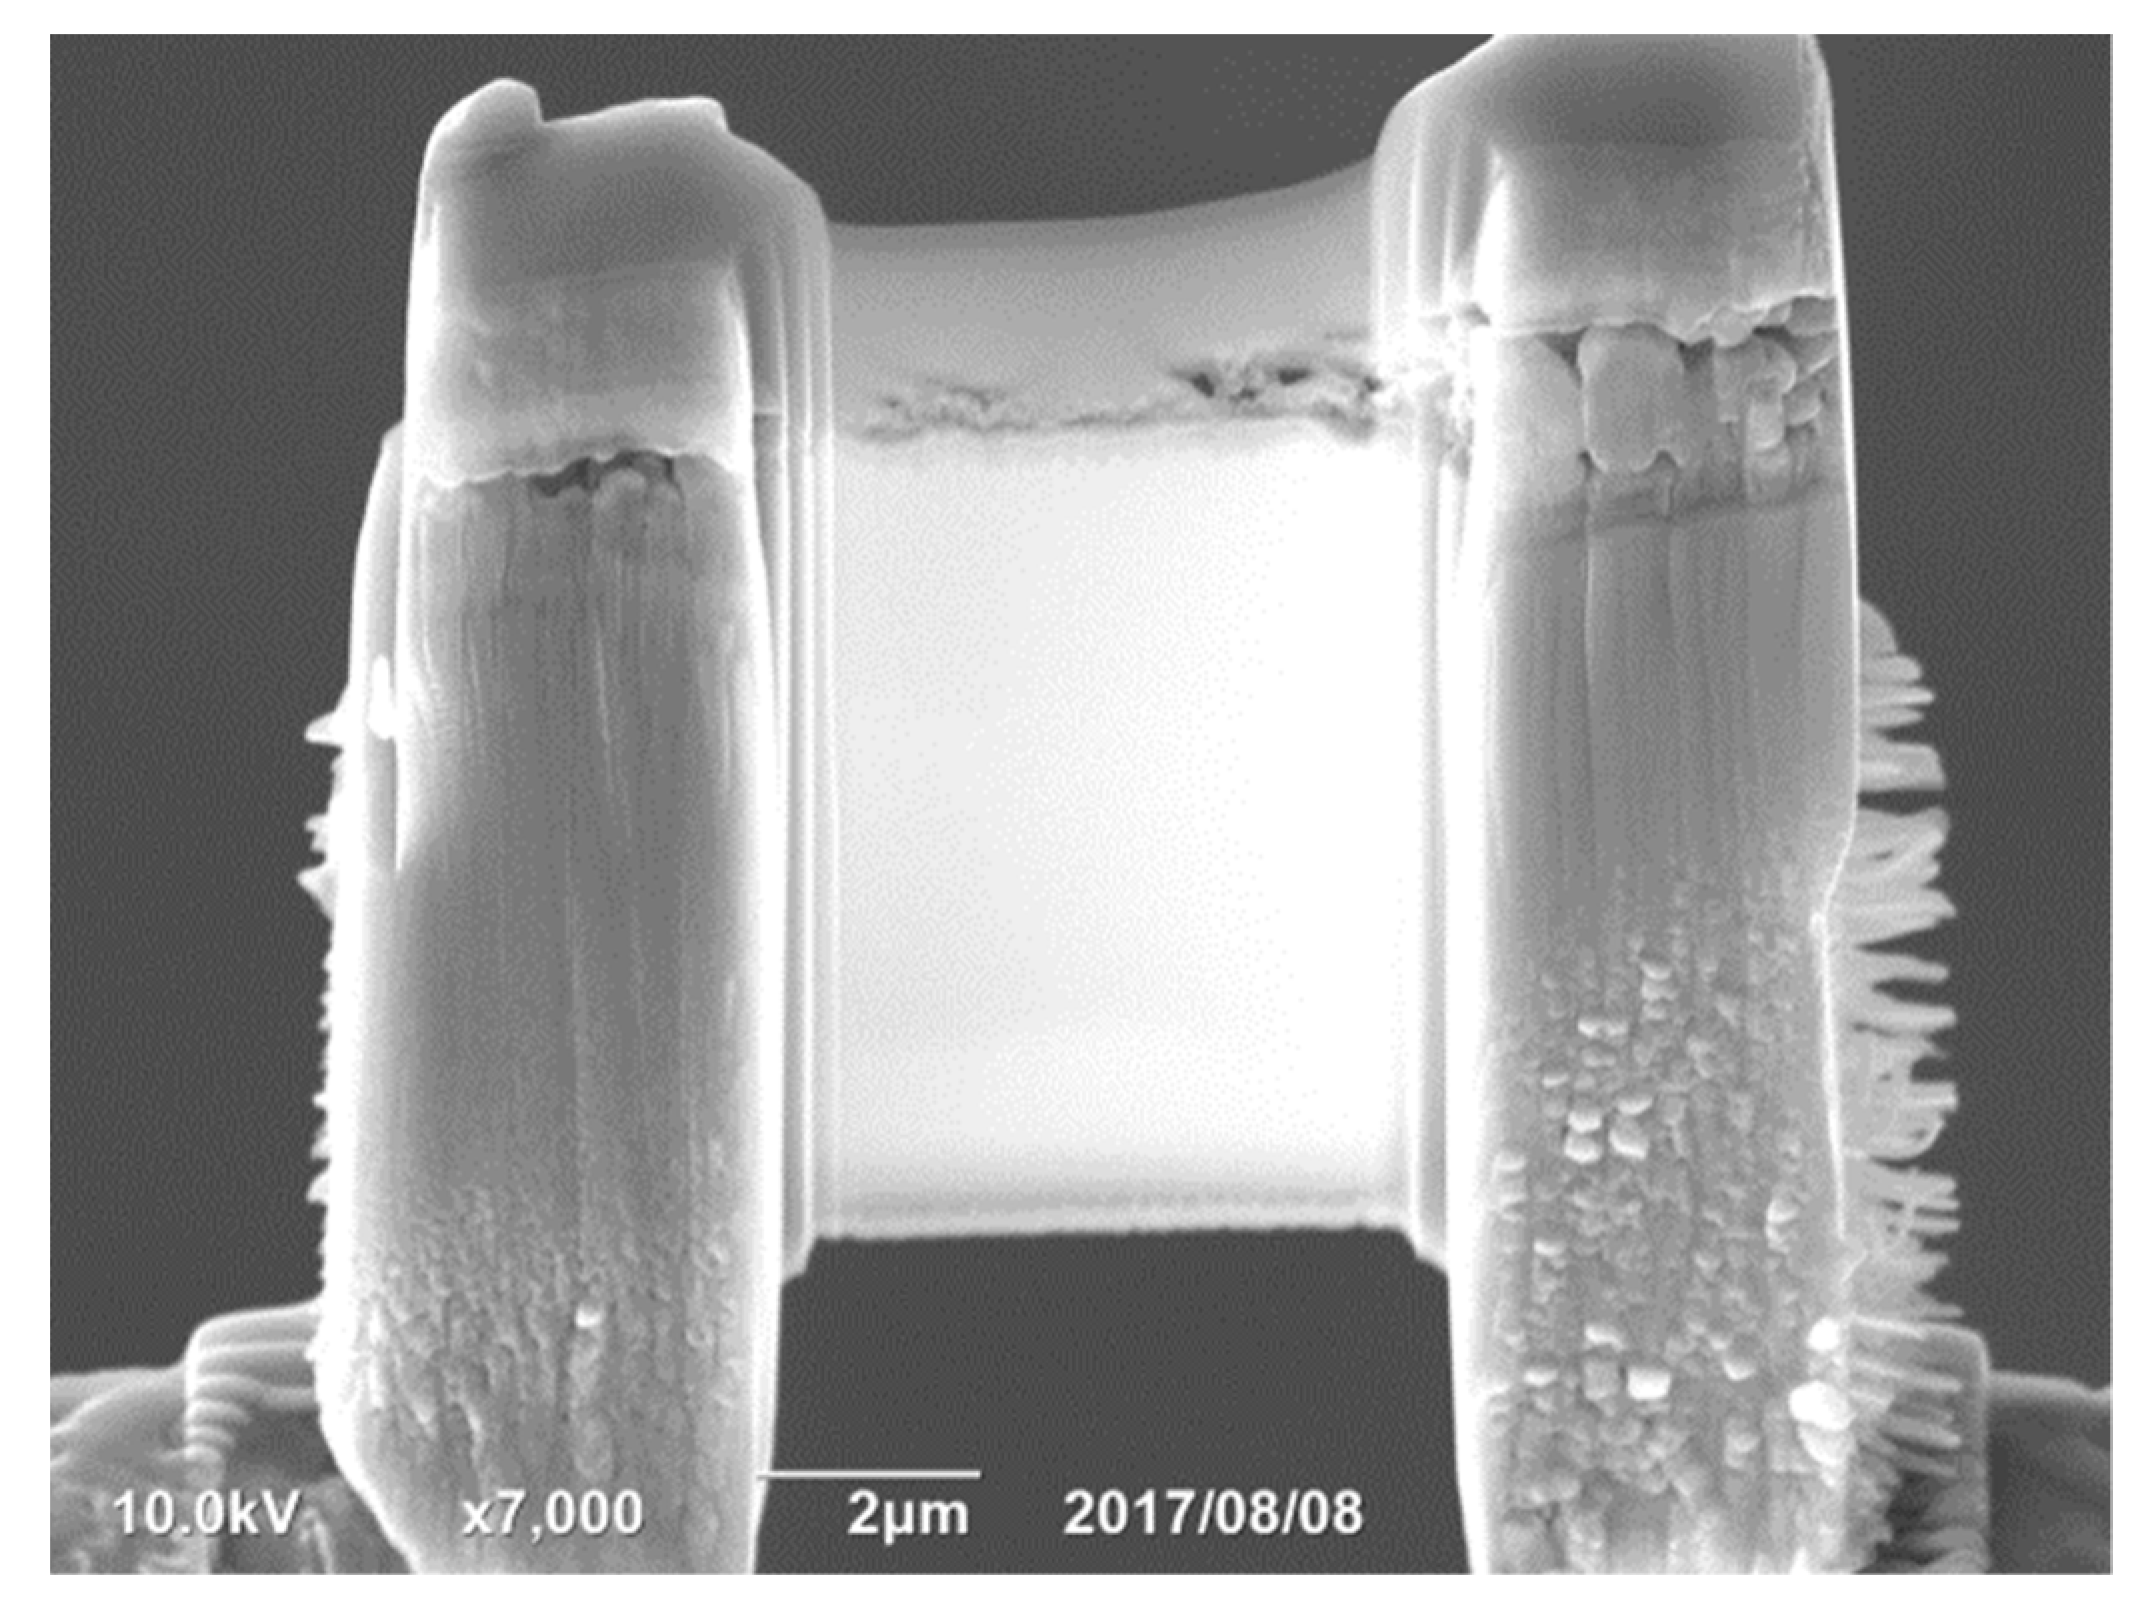
2.3. Transmission Electron Microscopy

The TEM imaging was conducted, to observe the microstructures of the specimens. The samples for the TEM were cut from each specimen and then polished to 0.1 mm, via a focused ion beam (FIB) process as shown in Figure 2. The polished samples were then punched into be the shape of a disk with 3 mm diameter. The disk-shaped samples were next thinned by twin jet electro-polishing (Tenupol-5, Struers, Willich, Germany) in a 25% nitric acid and 75% methanol solution at −25 °C. The TEM was performed on a JEM-2100F (JEOL, Peabody, MA, USA).

3. Methods

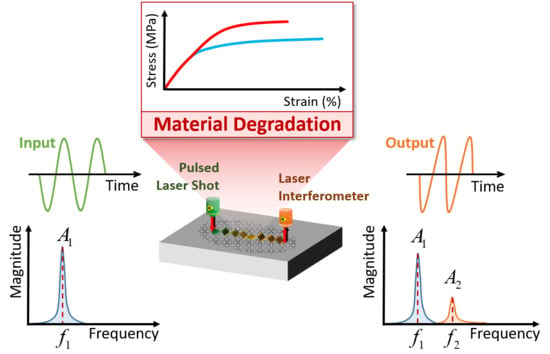
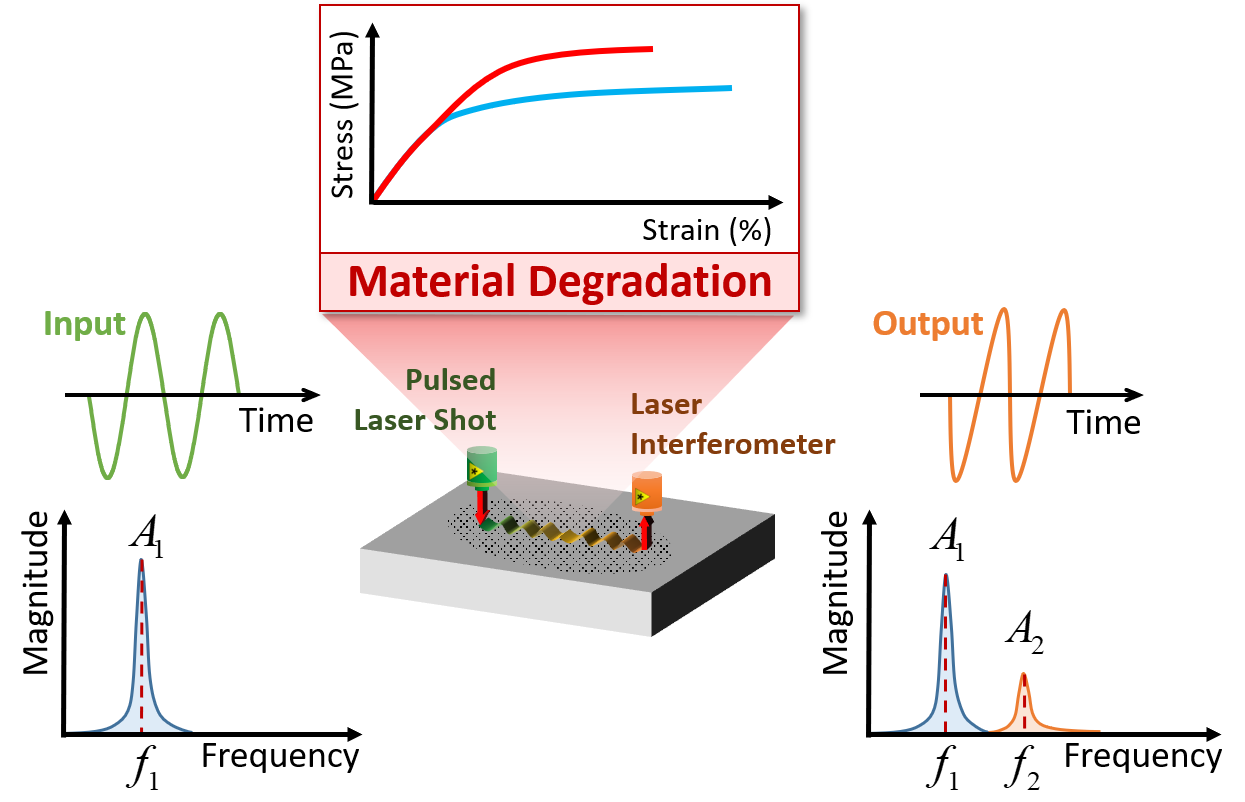
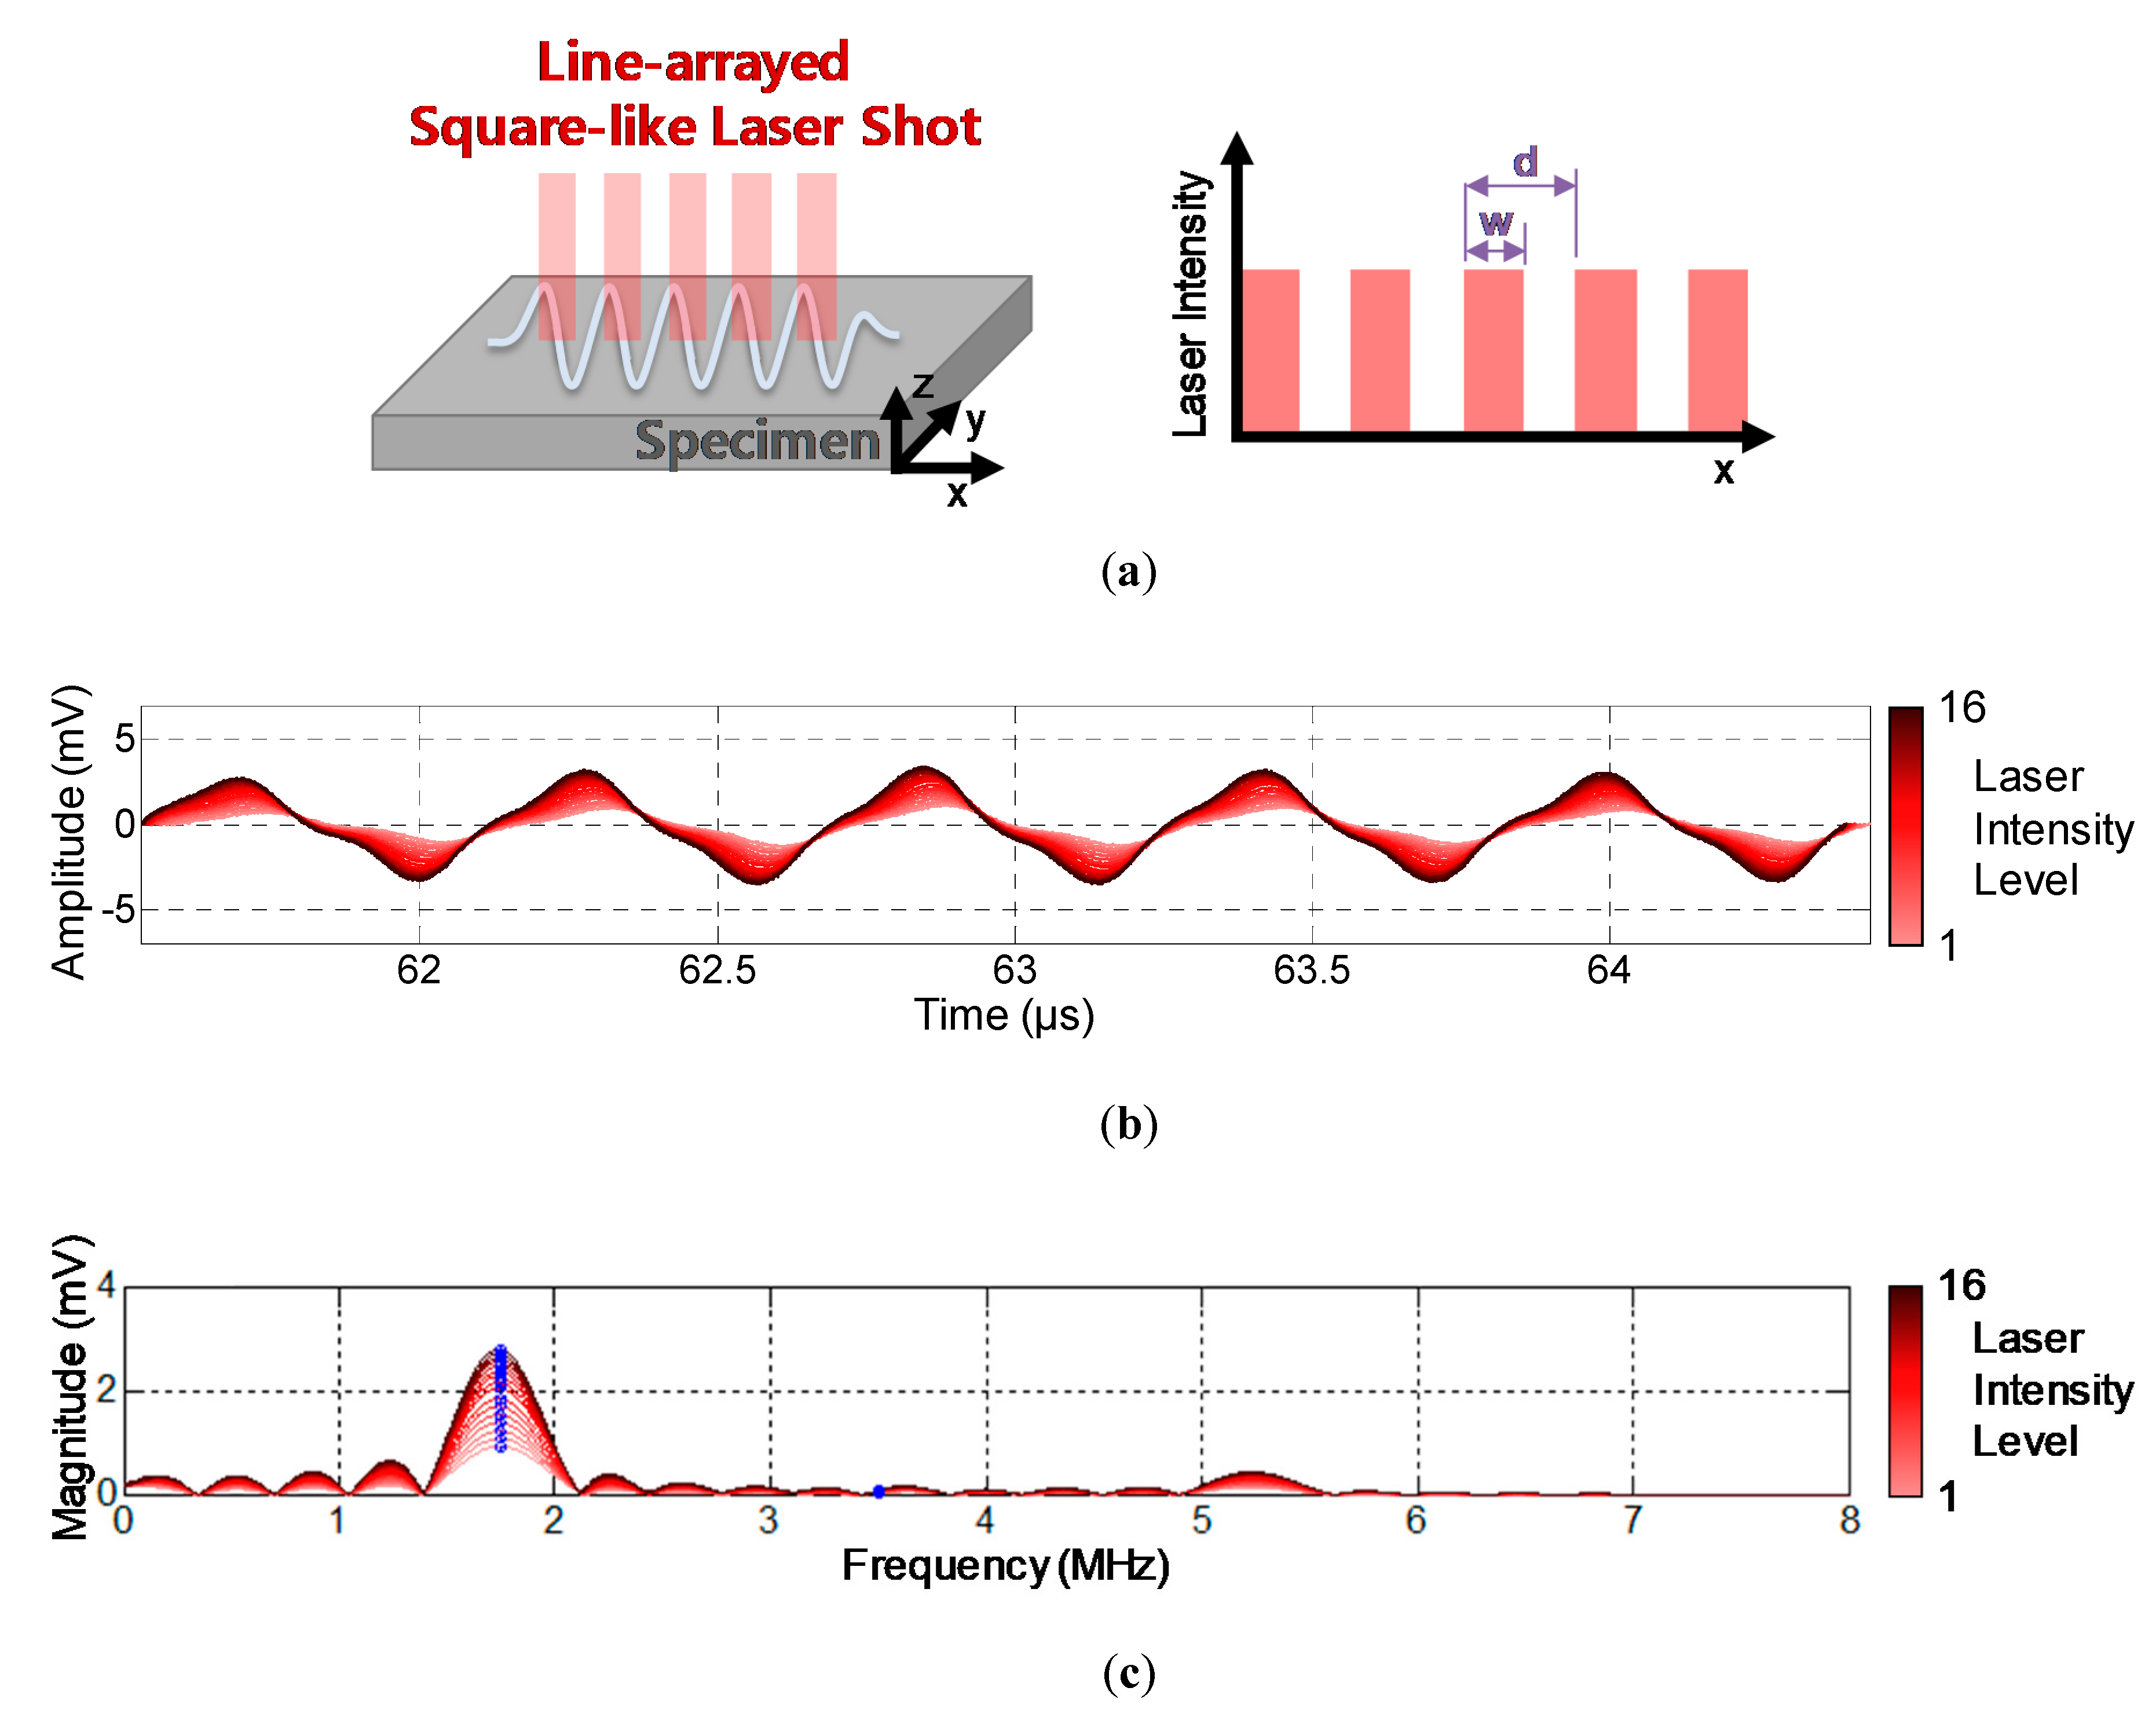
3.1. Laser-Generated Surface Acoustic Waves

The generation and propagation of ultrasounds due to thermal stress from the pulsed laser shot are illustrated in Figure 3a. When a pulse laser shot is irradiated onto the surface of the target, the laser energy is absorbed into its surface. This induces a heating and cooling of the surface. The rapid thermal variation results in a thermal expansion and contraction of the surface, which creates thermal stresses, as shown in Figure 3b. The thermal stresses generate a SAW which then propagates along the surface [3,4]. The characteristics of the SAW, such as its burst count, fundamental frequency, directivity, and focal point, can be controlled by modulating the intensity distribution of the laser, as shown in Figure 3c.
For the acoustic nonlinearity measurement, the tone-burst SAW is favorable because the narrow bandwidth of the tone-burst SAW can better facilitate the distinguishing of frequency components than the broad bandwidth of a single burst SAW. The burst count and frequency characteristics can be modulated by using a line-arrayed slit mask for the expanded laser shot [34,35]. Theoretical and experimental studies about the modulation are well-described in our previous works [36,37]. When the distribution of laser intensity is a single-line Gaussian, the generated SAW has a single fundamental frequency component of a broad bandwidth. Using a single-line laser of square-like intensity distribution, the higher harmonic frequency components appear; however, they still have the broad bandwidth. The multiple-line laser of square-like intensity distribution is appropriate to narrow the bandwidth, as shown in Figure 4. The harmonic frequency components can be modulated by the duty ratio ( γ = w / d ) , where w is the width of the opening and d is the interval between the slit lines [13,36]. With γ = 0.5 , the even-order harmonic frequency components are theoretically zero [37].

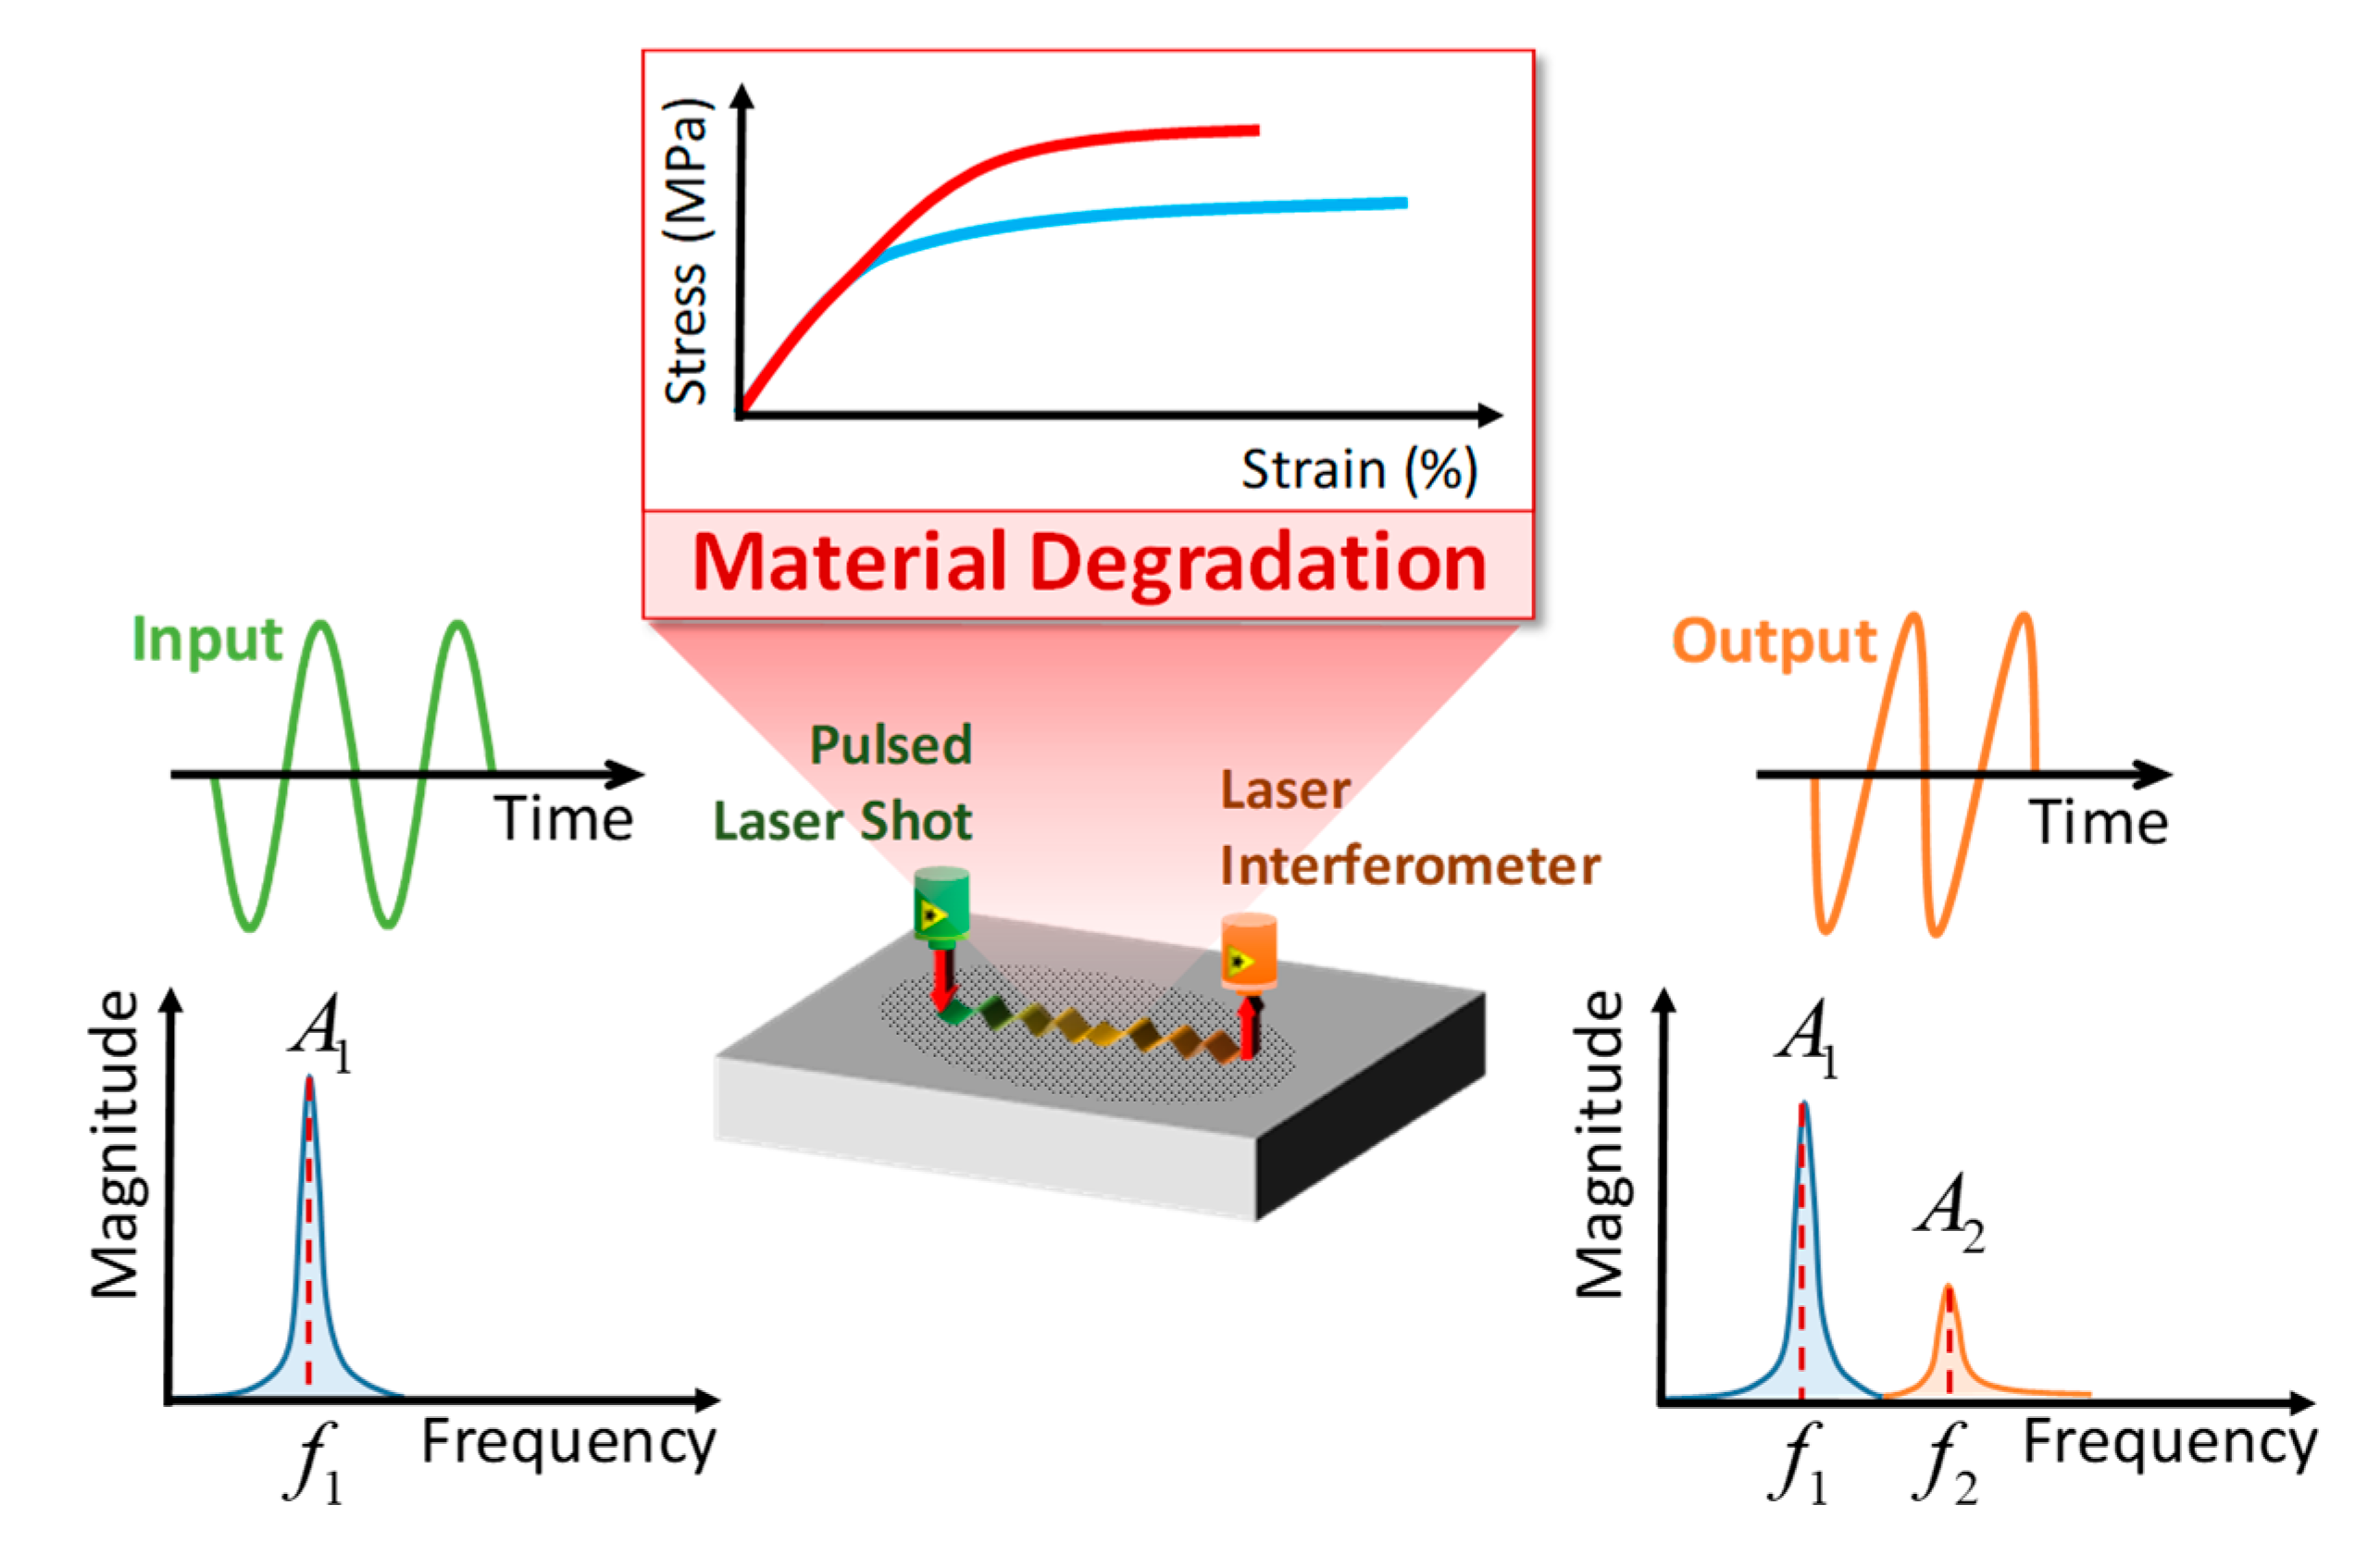
3.2. Acoustic Nonlinearity in the Laser-Generated Surface Acoustic Wave

The laser-generated SAW can have different magnitudes of the second-order harmonic frequency component, according to the microstructural state of the material. The second-order harmonic frequency component increases due to acoustic nonlinearity, which is affected by microstructural change while the laser-generated SAW propagates on the surface, as shown in Figure 5. In other words, the microstructural variation can be indirectly detected via the acoustic nonlinearity measurement. Therefore, the acoustic nonlinearity parameter can be a good indicator for evaluating material degradations because the degradations accompany the microstructural changes.
The acoustic nonlinearity of the bulk acoustic wave can be quantified as the acoustic nonlinearity parameter ( β ) , which is obtained from the magnitudes of the fundamental frequency component ( A 1 ) and the second-order harmonic frequency component ( A 2 ) [7] as follows:
β = 8 x k 2 A 2 A 1 2 ,
where x is the propagation distance and k is the wave number. Similarly, the acoustic nonlinearity parameter of the SAW ( β SAW ) can be derived [14,16,17,28] as
β SAW = 8 k T 2 k S 2 k L 2 x k L 2 k S ( 2 k S 2 k T 2 ) A 2 A 1 2 ,
where k L , k T , and k S are the wave numbers for the longitudinal wave, transverse wave, and SAW, respectively.
When comparing the acoustic nonlinearity of the intact and degraded material, the wave numbers and propagation distance can be assumed to be constant when the measurement scenarios are identical. By cancelling the constant parameters out, the fractional change of the acoustic nonlinearity parameter ( β ¯ ) can be simplified [29,33] as follows:
β ¯ = β degraded β intact β intact = 8 x k 2 A 2 _ degraded A 1 _ degraded 2 8 x k 2 A 2 _ intact A 1 _ intact 2 8 x k 2 A 2 _ intact A 1 _ intact 2 = A 2 _ degraded A 1 _ degraded 2 A 2 _ intact A 1 _ intact 2 A 2 _ intact A 1 _ intact 2 = β degraded β intact β intact ,
where the relative acoustic nonlinearity parameter ( β ) is the magnitude of the second-order harmonic frequency component ( A 2 ) , divided by the squared magnitude of the fundamental frequency component ( A 1 2 ) [23,30,31,33].

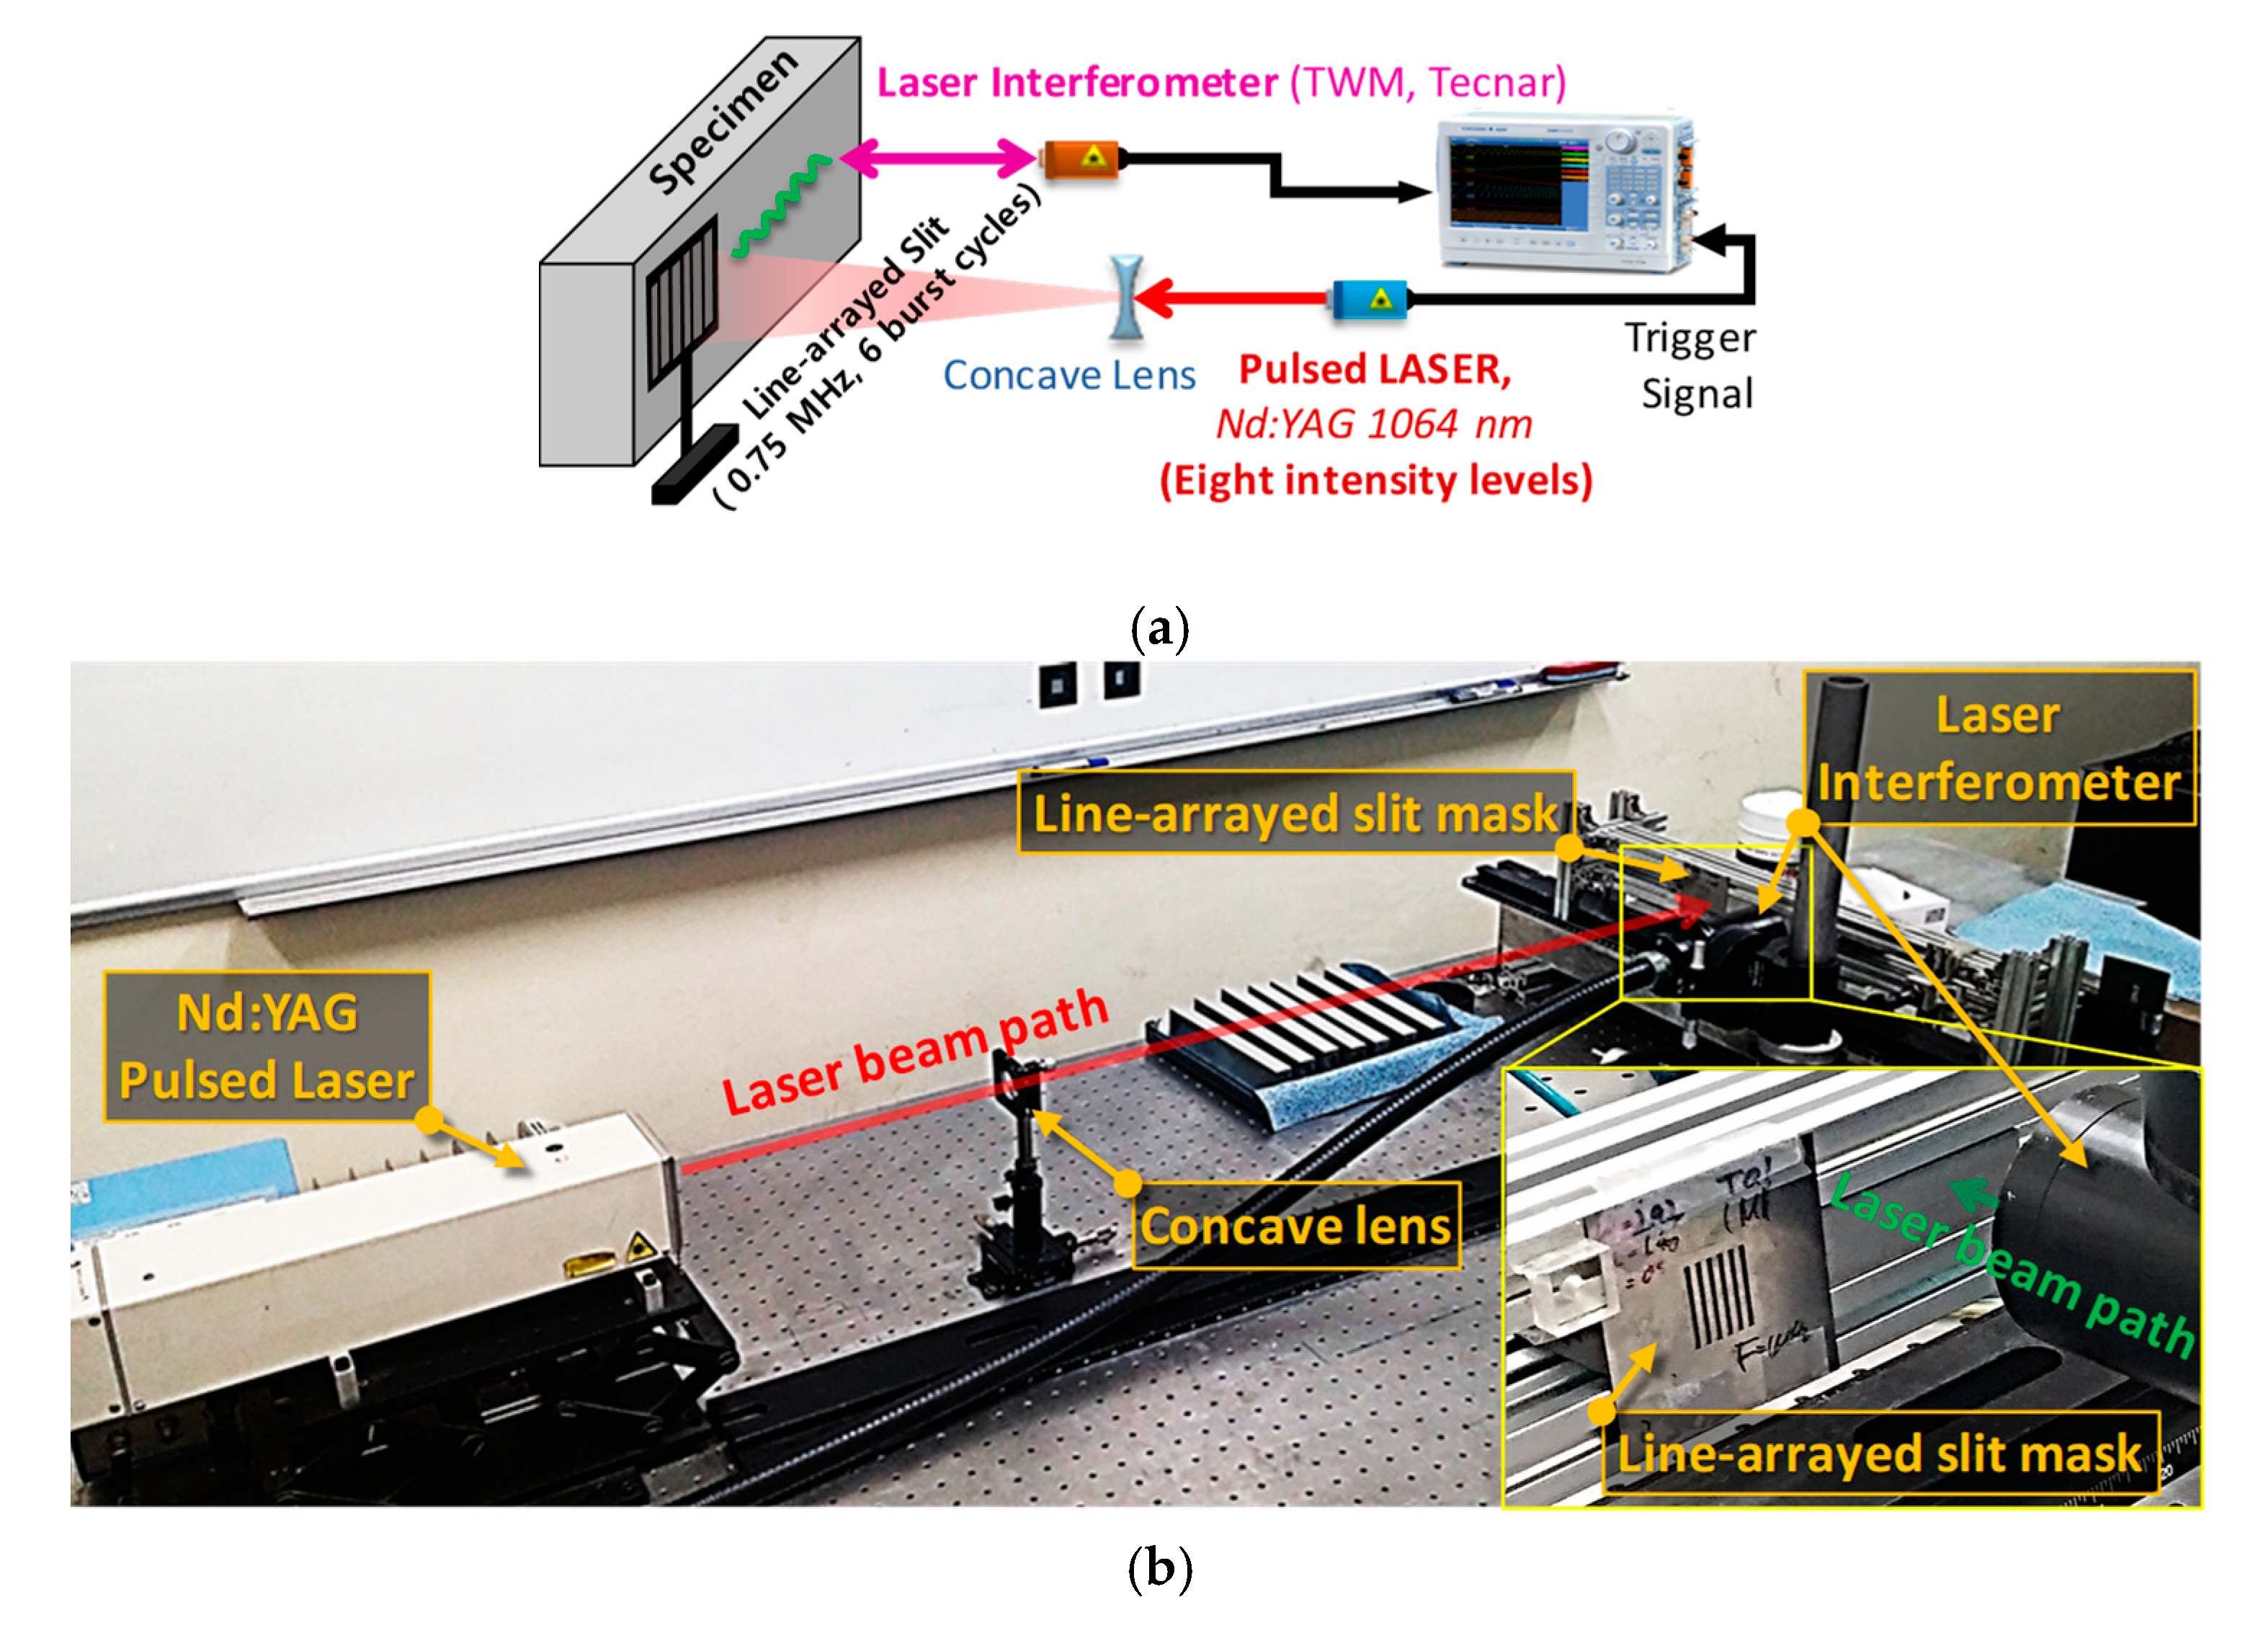
3.3. Experimental Setups for Acoustic Nonlinearity Measurement Using Laser-Generated SAW

The schematic diagram and the picture of the experimental setup for acoustic nonlinearity measurements using the laser-generated SAW are shown in Figure 6. As a fully noncontact NDE method, the SAW is generated by a Nd:YAG pulsed laser shot, with a wavelength of 1064 nm and a pulse width of 5 ns (Spectron Laser Systems, Warwickshire, UK). After the laser-generated SAW propagates across the surface of the target, the SAW is received by a laser interferometer via two-wave mixing in the photorefractive crystal (Tecnar, Saint-Bruno-de-Montarville, QC, Canada).
In order to generate the tone-burst SAW of 0.75 MHz, a concave lens is used to expand the diameter of the laser shot, and the line-arrayed slit mask is used to modulate the line-arrayed intensity distribution of the laser shot on the surface. The six slits of the mask result in a laser-generated SAW with six burst cycles. Since the duty ratio of the slit mask is 0.5, the initial second-order harmonic component can be minimized.

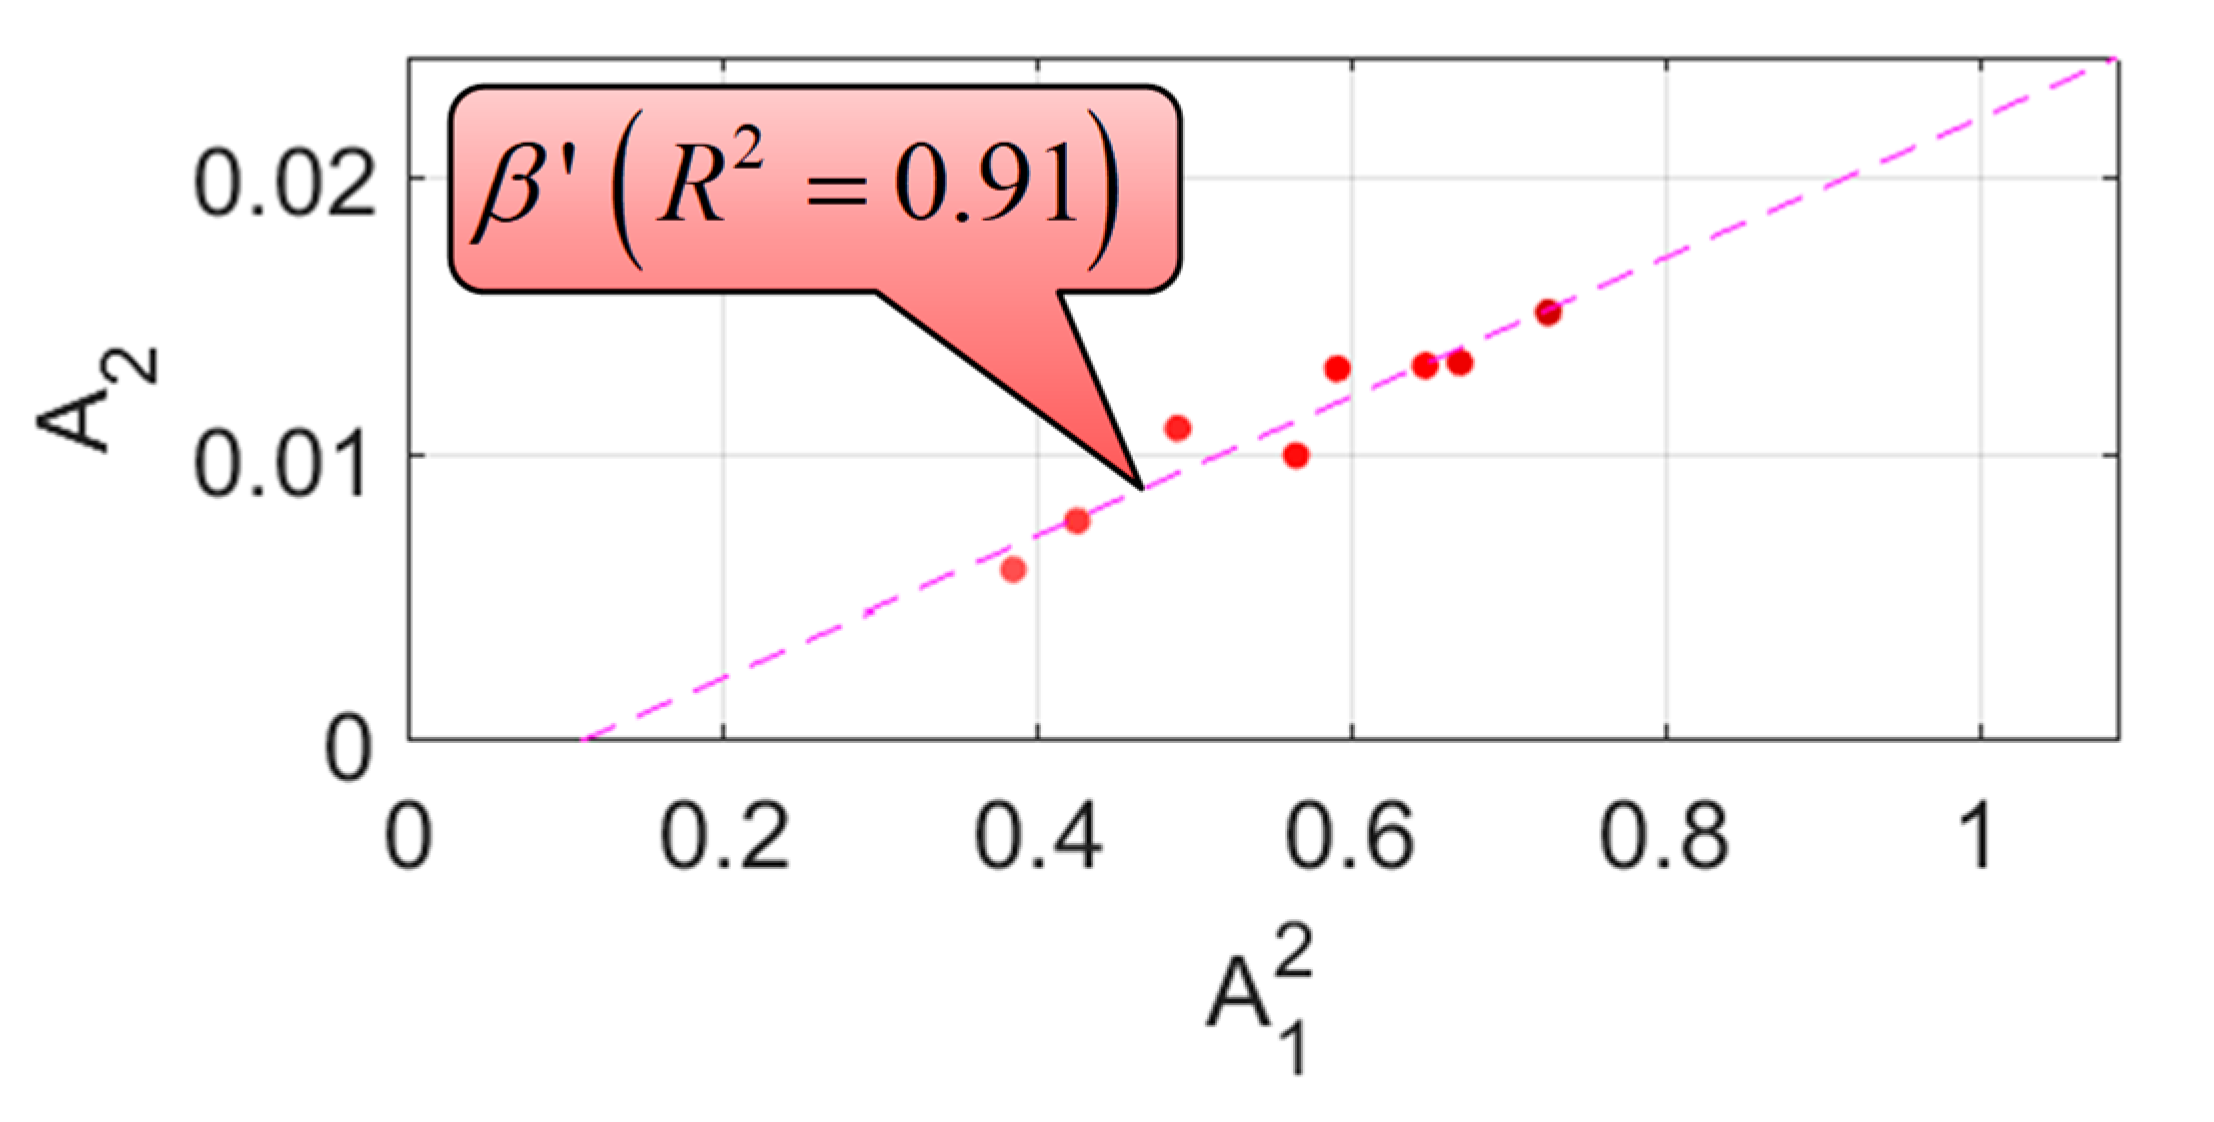
3.4. Acoustic Nonlinearity Measurement Using Laser-Generated SAW

The relative acoustic nonlinearity parameter ( β ) can be obtained by calculating the coefficient (the slope of the fitting line) from the linear regression between the squared magnitude of the fundamental frequency component ( A 1 2 ) and the magnitude of the second-order harmonic frequency component ( A 2 ) . By changing the laser intensity, the magnitude of the frequency components can be adjusted. As the laser intensity increases, the waveforms and their frequency spectra are shown in Figure 7. For each specimen, the eight levels of laser intensity were applied in order to obtain the linear regression coefficient. According to the laser intensity, eight points of the second-order harmonic frequency component magnitude ( A 2 ) were plotted with respect to the squared fundamental frequency component magnitude ( A 1 2 ) , as shown in Figure 8. In the linear regression, the origin ( A 1 2 = A 2 = 0 ) was not included, so as to avoid the measurement system nonlinearity interference [33,38,39]. This acoustic nonlinearity measurement was conducted four times for each thermal-aged specimen.
For each thermal-aged specimen, the variation in the relative acoustic nonlinearity ( β ) was quantified by calculating the fractional change of the relative acoustic nonlinearity parameter ( β ¯ ) between the intact specimen and the thermal-aged specimen, according to Equation (3).

4. Results and Discussion

For each specimen, the four fractional changes of the relative acoustic nonlinearity parameter ( β ¯ ) between the intact specimen and the thermal-aged specimen were calculated, and their average values with respect to the heat-treatment time are listed in Table 2. According to the methods for exciting and receiving SAWs, the fractional changes of the relative nonlinearity parameters were plotted with respect to the heat-treatment time in Figure 9a. Error bars display the maximum and minimum values of the acoustic nonlinearity measurements, which were repeated four times for each specimen. The variation trends of the fractional changes were similar in terms of peaks and troughs regardless of the methods used for exciting and receiving the SAWs, i.e., contact, semi noncontact, or noncontact systems.
The yield strength ( σ Y ) , ultimate strength ( σ U ) , and elongation to failure ( ε F ) with respect to the heat-treatment time are shown in Figure 9a–c. The yield strength and ultimate strength were minimized and the elongation to failure was at a maximum when the acoustic nonlinearity showed its first peak. As the heat-treatment time increased, the acoustic nonlinearity reached a local minimum after its first peak, whereas the yield strength and ultimate strength increased to its highest value. Meanwhile, the elongation significantly dropped. These results show that the acoustic nonlinearity of the laser-generated SAW is sensitive to the critical microstructural changes that degrade the mechanical properties and is thus a useful measurement technique for the noncontact NDEs.
The acoustic nonlinearity variation was caused by the change of the precipitation phase, which is supported by the TEM images. The transition sequence of the precipitation phase in a 6000-series Al-Mg-Si alloy is generally as follows: super-saturated solid solution (SSS) → atomic clusters (co-cluster) → Guinier–Preston (GP, spherical-shaped) → β (needle-shaped) → β (rod-shaped) → β (stable, plate-shaped) [40,41,42,43,44]. The bright field of TEM images taken along the zone axis of [001]Al is shown in Figure 10. This axis is the most representative direction for the observation of precipitates in the heat-treated specimen. In the early stages of the heat-treatment (0–20 min), no clusters or precipitates were observed. The crystallization was only shown in Figure 10a–b. Small transformation from SSSS to spherical-like shape GP occurred in the specimen that had been heat-treated for 40 min, as shown in Figure 10c. In the specimen heat-treated for 1 h, more spherical GP was clearly visible in Figure 10d. The GP can be detected by the first peak of the variation in the acoustic nonlinearity. The precipitates first appeared in the specimen heat-treated for 2 h. A high density of short primary needle-like shape β precipitates was observed in Figure 10e. These results indicate that the precipitation occurred between 1- and 2-h heat-treatments. The precipitation decreased the acoustic nonlinearity after its first peak. Between 2- and 10-h heat-treatments, the yield strength and ultimate strength were maximized [2,41,45] and the elongation to failure was minimized. These critical changes in the mechanical properties can be detected by the local minimum of the variation in the acoustic nonlinearity after its first peak. The well-developed needle-like shape β precipitates were observable in the specimen heat-treated for 10 h, as shown in Figure 10f, which increased the acoustic nonlinearity. The rod-like shape β precipitates were shown in the specimen heat-treated for 100 h. The precipitates were transformed from the needle-like β phase into the rod-like β phase between 10- and 100-h heat-treatments, which decreased the acoustic nonlinearity. On the contrary, the transformation from the rod-like β phase into the plate-shaped β phase increased the acoustic nonlinearity between 100- and 1000-h heat-treatments. These results show that the transformation of precipitates can be detected by monitoring the variation trend in the acoustic nonlinearity.

5. Conclusions

Variations of the acoustic nonlinearity in aluminum alloys, caused by thermal aging, were observed by fully noncontact nondestructive evaluation, using a laser-generated surface acoustic wave (SAW). The aluminum alloys were heat-treated for eight different durations to damage them with gradual thermal aging levels. Their acoustic nonlinearity parameters were measured by exciting the laser-generated SAW of six burst cycles with a line-arrayed pulsed laser shot, and then receiving it via a laser interferometer. As the laser intensity was increased, the waveforms and their frequency spectra were obtained four times for each specimen. From the linear regression between the magnitudes of the frequency components, the relative acoustic nonlinearity parameters were calculated and their fractional changes between the intact specimen and the thermal-aged specimen were compared according to the excitation and reception methods of the SAW. The variation trends of the fractional changes were similar regardless of the methods used: contact, semi noncontact, and fully noncontact. The acoustic nonlinearity variation was also compared to the changes in the mechanical properties: yield strength, ultimate strength, and elongation to failure. The results show a strong correlation between the variation trends in acoustic nonlinearity and mechanical properties. When mechanical properties changed remarkably, the acoustic nonlinearity also significantly varied. The yield strength and ultimate strength were minimized and the elongation was at maximum when the acoustic nonlinearity increased to its first peak. Beyond this, the acoustic nonlinearity and elongation both sharply dropped, while the yield strength and ultimate strength reached their peak values. These results show that monitoring of the acoustic nonlinearity of the laser-generated SAW is sensitive to the critical changes in the mechanical properties. Furthermore, the transmission electron microscopy images support that the acoustic nonlinearity variation depends on changes in the precipitation phase. In conclusion, this study shows that the acoustic nonlinearity measurement, using the laser-generated SAW in a fully noncontact method, is effective to nondestructively evaluate the microstructural changes according to the degradation level.

Author Contributions

K.-Y.J. and H.S. conceived and designed the experiments; J.J. performed the experiments and took TEM images; H.S. analyzed the experimental data and TEM images; J.J. and H.S. wrote the paper; K.-Y.J. revised the paper. All authors have read and agreed to the published version of the manuscript.

Funding

This research was supported by the Nuclear Power Research and Development Program through the National Research Foundation of Korea (NRF) funded by the Ministry of Science, ICT & Future Planning (NRF-2013M2A2A9043241).

Conflicts of Interest

The authors declare no conflict of interest.

References

  1. Brown, K.R.; Venie, M.S.; Woods, R.A. The increasing use of aluminum in automotive applications. J. Miner. Met. Mater. Soc. 1995, 47, 20–23. [Google Scholar] [CrossRef]
  2. Fang, X.; Song, M.; Li, K.; Du, Y. Precipitation sequence of an aged Al-Mg-Si alloy. J. Min. Metall. Sect. B Metall. 2010, 46, 171–180. [Google Scholar] [CrossRef]
  3. Xiao, R.S.; Ambrosy, G.; Zuo, T.C.; Hugel, H. New approach to improve the laser welding process of aluminum by using an external electrical current. J. Mater. Sci. Lett. 2001, 20, 2163–2165. [Google Scholar] [CrossRef]
  4. Xiang, Y.X.; Deng, M.X.; Xuan, F.Z.; Liu, C.J. Experimental study of thermal degradation in ferritic Cr-Ni alloy steel plates using nonlinear Lamb waves. NDT E Int. 2011, 44, 768–774. [Google Scholar] [CrossRef]
  5. Amura, M.; Meo, M. Prediction of residual fatigue life using nonlinear ultrasound. Smart Mater. Struct. 2012, 21, 045001. [Google Scholar] [CrossRef]
  6. Blackshire, J.L.; Sathish, S.; Na, J.; Frouin, J. Nonlinear laser ultrasonic measurements of localized fatigue damage. Rev. Prog. Quant. Nondestruct. Eval. 2003, 22, 1479–1488. [Google Scholar] [CrossRef]
  7. Jhang, K.-Y. Nonlinear ultrasonic techniques for nondestructive assessment of micro damage in material: A review. Int. J. Precis. Eng. Manuf. 2009, 10, 123–135. [Google Scholar] [CrossRef]
  8. Li, W.; Cho, Y. Thermal fatigue damage assessment in an isotropic pipe using nonlinear ultrasonic guided waves. Exp. Mech. 2014, 54, 1309–1318. [Google Scholar] [CrossRef]
  9. Li, W.; Cho, Y.; Achenbach, J.D. Detection of thermal fatigue in composites by second harmonic Lamb waves. Smart Mater. Struct. 2012, 21, 085019. [Google Scholar] [CrossRef]
  10. Valluri, J.S.; Balasubramaniam, K.; Prakash, R.V. Creep damage characterization using non-linear ultrasonic techniques. Acta Mater. 2010, 58, 2079–2090. [Google Scholar] [CrossRef]
  11. Cho, S.W.; Cho, S.H.; Park, C.S.; Seo, D.C.; Jhang, K.-Y. Study on the nonlinear electromagnetic acoustic resonance method for the evaluation of hidden damage in a metallic material. J. Korean Soc. Nondestruct. Test. 2014, 34, 277–282. [Google Scholar] [CrossRef]
  12. Zeitvogel, D.T.; Matlack, K.H.; Kim, J.Y.; Jacobs, L.J.; Singh, P.M.; Qu, J.M. Characterization of stress corrosion cracking in carbon steel using nonlinear Rayleigh surface waves. NDT E Int. 2014, 62, 144–152. [Google Scholar] [CrossRef]
  13. Choi, S.; Seo, H.; Jhang, K.-Y. Noncontact evaluation of acoustic nonlinearity of a laser-generated surface wave in a plastically deformed aluminum alloy. Res. Nondestruct. Eval. 2015, 26, 13–22. [Google Scholar] [CrossRef]
  14. Herrmann, J.; Kim, J.Y.; Jacobs, L.J.; Qu, J.M.; Littles, J.W.; Savage, M.F. Assessment of material damage in a nickel-base superalloy using nonlinear Rayleigh surface waves. J. Appl. Phys. 2006, 99, 124913. [Google Scholar] [CrossRef]
  15. Punnose, S.; Mukhopadhyay, A.; Sarkar, R.; Kumar, V. Characterisation of microstructural damage evolution during tensile deformation of a near-alpha titanium alloy: Effects of microtexture. Mater. Sci. Eng. A 2014, 607, 476–481. [Google Scholar] [CrossRef]
  16. Walker, S.V.; Kim, J.Y.; Qu, J.M.; Jacobs, L.J. Fatigue damage evaluation in A36 steel using nonlinear Rayleigh surface waves. NDT E Int. 2012, 48, 10–15. [Google Scholar] [CrossRef]
  17. Liu, M.H.; Kim, J.Y.; Jacobs, L.J.; Qu, J.M. Experimental study of nonlinear Rayleigh wave propagation in shot-peened aluminum plates-feasibility of measuring residual stress. NDT E Int. 2011, 44, 67–74. [Google Scholar] [CrossRef]
  18. Cantrell, J.H.; Yost, W.T. Effect of precipitate coherency strains on acoustic harmonic generation. J. Appl. Phys. 1997, 81, 2957–2962. [Google Scholar] [CrossRef]
  19. Jhang, K.-Y.; Lee, J.; Lee, T. Acoustic nonlinearity of surface wave in a fatigued aluminum alloy specimen. Mater. Trans. 2012, 53, 303–307. [Google Scholar] [CrossRef] [Green Version]
  20. Jaya Rao, V.V.S.; Kannan, E.; Prakash, R.V.; Balasubramaniam, K. Fatigue damage characterization using surface acoustic wave nonlinearity in aluminum alloy AA7175-T7351. J. Appl. Phys. 2008, 104, 123508. [Google Scholar] [CrossRef]
  21. Liu, P.; Sohn, H.; Kundu, T. Fatigue crack localization using laser nonlinear wave modulation spectroscopy (LNWMS). J. Korean Soc. Nondestruct. Test. 2014, 34, 419–427. [Google Scholar] [CrossRef] [Green Version]
  22. Barnard, D.J.; Dace, G.E.; Buck, O. Acoustic harmonic generation due to thermal embrittlement of Inconel 718. J. Nondestruct. Eval. 1997, 16, 67–75. [Google Scholar] [CrossRef]
  23. Li, W.; Cho, Y.; Lee, J.; Achenbach, J.D. Assessment of heat treated Inconel X-750 alloy by nonlinear ultrasonics. Exp. Mech. 2013, 53, 775–781. [Google Scholar] [CrossRef]
  24. Torello, D.; Thiele, S.; Matlack, K.H.; Kim, J.Y.; Qu, J.M.; Jacobs, L.J. Diffraction, attenuation, and source corrections for nonlinear Rayleigh wave ultrasonic measurements. Ultrasonics 2015, 56, 417–426. [Google Scholar] [CrossRef] [PubMed] [Green Version]
  25. Xiang, Y.X.; Deng, M.X.; Xuan, F.Z. Thermal degradation evaluation of HP40Nb alloy steel after long term service using a nonlinear ultrasonic technique. J. Nondestruct. Eval. 2014, 33, 279–287. [Google Scholar] [CrossRef]
  26. Xiang, Y.X.; Deng, M.X.; Xuan, F.Z.; Liu, C.J. Cumulative second-harmonic analysis of ultrasonic Lamb waves for ageing behavior study of modified-HP austenite steel. Ultrasonics 2011, 51, 974–981. [Google Scholar] [CrossRef]
  27. Shui, G.; Kim, J.Y.; Qu, J.M.; Wang, Y.S.; Jacobs, L.J. A new technique for measuring the acoustic nonlinearity of materials using Rayleigh waves. NDT E Int. 2008, 41, 326–329. [Google Scholar] [CrossRef]
  28. Thiele, S.; Kim, J.Y.; Qu, J.M.; Jacobs, L.J. Air-coupled detection of nonlinear Rayleigh surface waves to assess material nonlinearity. Ultrasonics 2014, 54, 1470–1475. [Google Scholar] [CrossRef]
  29. Cantrell, J.H.; Zhang, X.G. Nonlinear acoustic response from precipitate-matrix misfit in a dislocation network. J. Appl. Phys. 1998, 84, 5469–5472. [Google Scholar] [CrossRef]
  30. Nam, T.; Choi, S.; Lee, T.; Jhang, K.-Y.; Kim, C.S. Acoustic nonlinearity of narrowband laser-generated surface waves in the bending fatigue of Al6061 alloy. J. Korean Phys. Soc. 2010, 57, 1212–1217. [Google Scholar] [CrossRef]
  31. Kim, G.; In, C.-W.; Kim, J.Y.; Kurtis, K.E.; Jacobs, L.J. Air-coupled detection of nonlinear Rayleigh surface waves in concrete—Application to microcracking detection. NDT E Int. 2014, 67, 64–70. [Google Scholar] [CrossRef]
  32. Li, M.; Lomonosov, A.M.; Shen, Z.; Seo, H.; Jhang, K.-Y.; Gusev, V.E.; Ni, C. Monitoring of thermal aging of aluminum alloy via nonlinear propagation of acoustic pulses generated and detected by lasers. Appl. Sci. 2019, 9, 1191. [Google Scholar] [CrossRef] [Green Version]
  33. Seo, H.; Jun, J.; Jhang, K.-Y. Assessment of thermal aging of aluminum alloy by acoustic nonlinearity measurement of surface acoustic waves. Res. Nondestruct. Eval. 2017, 28, 3–17. [Google Scholar] [CrossRef]
  34. Kim, H.; Jhang, K.-Y.; Shin, M.; Kim, J. A noncontact NDE method using a laser generated focused-Lamb wave with enhanced defect-detection ability and spatial resolution. NDT E Int. 2006, 39, 312–319. [Google Scholar] [CrossRef]
  35. Jhang, K.-Y.; Shin, M.J.; Lim, B.O. Application of the laser generated focused-Lamb wave for non-contact imaging of defects in plate. Ultrasonics 2006, 44, e1265–e1268. [Google Scholar] [CrossRef]
  36. Seo, H.; Kim, M.-H.; Choi, S.; Kim, C.-S.; Jhang, K.-Y. Frequency characteristics of surface wave generated by single-line pulsed laser beam with two kinds of spatial energy profile models: Gaussian and square-like. J. Korean Soc. Nondestruct. Test. 2012, 32, 347–354. [Google Scholar] [CrossRef]
  37. Seo, H.; Choi, S.; Jhang, K.-Y. Influence of laser beam profiles on the frequency bandwidth of laser-generated surface acoustic waves. In Proceedings of the 2014 IEEE Far East Forum on Nondestructive Evaluation/Testing, Chengdu, China, 20–23 June 2014; pp. 221–224. [Google Scholar] [CrossRef]
  38. Breazeale, M.A.; Thompson, D.O. Finite-amplitude ultrasonic waves in aluminum. Appl. Phys. Lett. 1963, 3, 77–78. [Google Scholar] [CrossRef]
  39. Matlack, K.H.; Wall, J.J.; Kim, J.Y.; Qu, J.M.; Jacobs, L.J.; Viehrig, H.W. Evaluation of radiation damage using nonlinear ultrasound. J. Appl. Phys. 2012, 111, 054911. [Google Scholar] [CrossRef] [Green Version]
  40. Dutta, I.; Allen, S.M.; Hafley, J.L. Effect of reinforcement on the aging response of cast 6061 Al-Al2O3 particulate composites. Metall. Trans. A 1991, 22, 2553–2563. [Google Scholar] [CrossRef]
  41. Marceau, R.K.W.; de Vaucorbeil, A.; Sha, G.; Ringer, S.P.; Poole, W.J. Analysis of strengthening in AA6111 during the early stages of aging: Atom probe tomography and yield stress modelling. Acta Mater. 2013, 61, 7285–7303. [Google Scholar] [CrossRef]
  42. Murayama, M.; Hono, K. Pre-precipitate clusters and precipitation processes in Al-Mg-Si alloys. Acta Mater. 1999, 47, 1537–1548. [Google Scholar] [CrossRef]
  43. Murayama, M.; Hono, K.; Saga, M.; Kikuchi, M. Atom probe studies on the early stages of precipitation in Al-Mg-Si alloys. Mater. Sci. Eng. A 1998, 250, 127–132. [Google Scholar] [CrossRef]
  44. Song, M. Modeling the hardness and yield strength evolutions of aluminum alloy with rod/needle-shaped precipitates. Mater. Sci. Eng. A 2007, 443, 172–177. [Google Scholar] [CrossRef]
  45. Edwards, G.A.; Stiller, K.; Dunlop, G.L.; Couper, M.J. The precipitation sequence in Al-Mg-Si alloys. Acta Mater. 1998, 46, 3893–3904. [Google Scholar] [CrossRef]
Figure 1. The aluminum specimens heat-treated for 0 min, 20 min, 40 min, 1 h, 2 h, 10 h, 100 h, 1000 h: (a) the picture of the specimens; (b) the gradual heat-treatment process for each specimen.
Metals 10 00038 g001
Figure 2. The sample for transmission electron microscopy after focused ion beam machining.
Metals 10 00038 g002
Figure 3. The process of the generation of a surface acoustic wave; (a) the generation of ultrasounds due to thermal stress by a pulsed laser shot; (b) the rapid thermal variation due to laser energy; (c) the intensity distribution according to optical modulation.
Metals 10 00038 g003
Figure 4. Waveforms of laser-generated SAW of 1.75 MHz and their frequency spectra with respect to the intensity of the line-arrayed square-like laser shot; (a) the intensity distribution of a line-arrayed square-like laser shot; (b) the waveforms of the SAW generated by the line-arrayed square-like laser shots; (c) the frequency spectra of the SAW generated by the line-arrayed square-like laser shots.
Metals 10 00038 g004
Figure 5. The second-order harmonic frequency component generation due to acoustic nonlinearity.
Metals 10 00038 g005
Figure 6. The experimental setup for acoustic nonlinearity measurement using the laser-generated SAW; (a) a schematic diagram of the experimental setup; (b) a picture of the experimental setup.
Metals 10 00038 g006
Figure 7. The laser-generated SAWs with respect to the laser intensity; (a) waveforms; (b) their frequency spectra.
Metals 10 00038 g007
Figure 8. The relative acoustic nonlinearity parameter determined by the linear regression between the squared fundamental frequency component magnitude ( A 1 2 ) and the second-order harmonic frequency component magnitude ( A 2 ) .
Metals 10 00038 g008
Figure 9. Variation in acoustic nonlinearity and mechanical properties according to thermal aging; (a) the fractional change of the relative acoustic nonlinearity parameters between the intact specimen and the thermal-aged specimen; (b) yield strength; (c) ultimate strength; (d) elongation to failure.
Metals 10 00038 g009
Figure 10. The bright field images taken by the transmission electron microscopy; (a) 0 min; (b) 20 min; (c) 40 min; (d) 1 h; (e) 2 h; (f) 10 h; (g) 100 h; (h) 1000 h; the selected area electron diffraction patterns are shown in (a) and (e).
Metals 10 00038 g010
Table 1. Yield strength ( σ Y ) [33], ultimate strength ( σ U ) , and elongation to failure ( ε F ) .
Mechanical PropertyHeat-Treatment Time
0 min20 min40 min1 h2 h10 h100 h1000 h
Yield Strength ( σ Y ) [33] (MPa)1300290231340560508419299
2333300265337521513409329
Average316295248338541511414314
Ultimate Strength ( σ U ) (MPa)1682492417528639579514460
2598507464525581584501454
Average640500441527610581507457
Elongation to Failure ( ε F ) (%)119.4219.6622.4017.377.847.347.647.55
220.6520.1819.5219.366.986.688.026.96
Average20.0419.9220.9618.377.417.017.837.26
Table 2. Averaged relative acoustic nonlinearity parameters according to thermal aging and their fractional change between the intact specimen and the thermal-aged specimen.
Acoustic NonlinearityHeat-Treatment Time
0 min20 min40 min1 h2 h10 h100 h1000 h
LSAW
(Laser to Laser)
β 2.45 × 10−51.47 × 10−53.01 × 10−53.51 × 10−51.42 × 10−53.59 × 10−51.48 × 10−53.31 × 10−5
( β ¯ ) (%)(0.00)(−40.1)(22.7)(43.0)(−42.1)(46.6)(−39.7)(35.2)
LSAW
(Laser to PZT) [33]
β 4.913.505.976.782.576.281.704.01
( β ¯ ) (%)(0.00)(−28.7)(21.6)(38.1)(−47.7)(27.9)(−65.3)(−18.2)
SAW
(PZT to PZT) [33]
β 0.02810.00840.03250.03010.00780.01730.00840.0435
( β ¯ ) (%)(0.00)(−71.4)(17.9)(7.1)(−71.4)(−39.3)(−71.4)(53.6)

