Article

Impact of Local Cathode Electrical Cut-Off on Bath–Metal Two-Phase Flow in an Aluminum Reduction Cell

1
School of Metallurgy, Northeastern University, Shenyang 110819, China
2
Shenyang Aluminum and Magnesium Engineering and Research Institute Co., Ltd., Shenyang 110001, China
*
Authors to whom correspondence should be addressed.
Metals 2020, 10(1), 110; https://doi.org/10.3390/met10010110
Submission received: 10 December 2019 / Revised: 31 December 2019 / Accepted: 2 January 2020 / Published: 10 January 2020

Abstract

:
Many researchers have investigated the impact factors of the bath–metal flow in an aluminum reduction cell using the simulation method. However, only a few have coupled their models with transient electromagnetic force, which makes the model closer to realistic conditions. In this work, coupling with the transient electromagnetic force, a three dimensional bath–metal two-phase quasi-steady flow model for a full 500 kA cell was built, and the model was validated with the metal velocity and the bath–metal interface deformation measurement in industrial cells. The impacts of local cathode electrical cut-off (LCEC) on the melt flow field were simulated according to six industrial cases. We found that the LCEC has little impact on the general pattern of the melt flow field, but the local metal velocity and the interface deformation would be changed to a certain extent. LCEC at positions A2A3 and A10A11 (as introduced in the full text) could suppress the interface hump at the central downstream area of the cell, with the anode cathode distance (ACD) increased by 3% and 7.5%, respectively. LCEC at positions A18A19 and A22A23 would deteriorate the interface hump condition, with the ACD decreased by 4% and 3%, respectively. The solution given in this paper is to cut the cathode flexes partially at abnormal positions to stabilize the melt flow field.

1. Introduction

The electromagnetic force is composed of the electric field and the magnetic field. The electromagnetic field causes a vigorous agitation of the liquid metal layer and fluctuation of the bath–metal interface in an industrial aluminum reduction cell. Due to the high cost of both funds and time for industrial tests, computational simulation has become one of the most useful methods for development of new technology in an aluminum reduction cell. This paper investigates the development of a proper simulation model for the evaluation of the melt flow field to improve the cell magnetohydrodynamics (MHD) stability.
Based on the Navier–Stokes control equation, pioneering researchers developed various simplification theories to calculate the two dimensional steady single phase flow for baths and metals, respectively, such as Hartmann flow [1,2], Poiseille flow [3], and the shallow-water model [4,5,6]. The bath/metal interface profile was computed by considering the simple static balance and the continuous pressure principle at the interface [7]. With the rapid development of computer technology, increasing numbers of researchers have used various types of numerical simulation software to study bath–metal flow in the cell, such as ESTER/PHOENICS [8,9], MHD-Valdis [10,11], CFX [12,13,14], and Fluent [15,16,17], et al. In most of the cases, the static electromagnetic force was calculated from the coupling of the static magnetic field and static electric field outside of the flow model, and imported into the flow model as a momentum source to stir the bath–metal flow [12,13,14,15]. The bath–metal flow was usually simulated by the k-ε turbulent model [12,13,14,15,16,17], and the bath/metal interface profile was tracked by the volume of fluid (VOF) model [14,15,16,17], which was based on the density difference of the bath and metal phases.
According to Hua’s investigation [17], in the aluminum reduction cell, the local induced current density due to melt flow did not change the overall interface deformation. The induced magnetic field generated by the current density variation was about 1/10 of the static magnetic field, and its impact on the interface deformation was negligible. The changed interface shape would influence the ACD under each anode, and forms dynamic electrical field and electromagnetic force in the electrolysis process. For the validation of mathematical models, most of the researchers just measured the metal velocity field, the validation of interface deformation was rarely reported. For the industrial application of mathematical models, Li’s group [15,16], Feng’s group [18,19,20] and Dupuis [11,21] compared difference of the bath–metal two-phase flow field between the traditional flat cathode and novel cathode convex without validation. Bojarevics [10] studied the impact of a non-conductive cathode flex on the melt flow field and interface deformation; however, they did not give any effective solution.
Since the 12 CHALCO 600 kA pilot cell [14,22] start-up in 2012, there are only several 600 kA industrial potlines in China. However, this type of cell still exists in concept design or as pilot cells in other countries [23,24]. Since the first 500 kA potline was put into industrial operation in China in 2011, the 500 kA cell has become the mainstream cell type. There are more than 30 working potlines so far in China, and they occupy a considerable proportion of the global aluminum production capacity. Therefore, research on the physical fields is helpful to understand the technical characteristic of 500 kA cells and to provide a valuable reference for optimizing technical indicators of 500 kA potlines. In this paper, a three dimensional bath–metal two-phase quasi-steady flow model for a full 500 kA cell was developed to simulate the bath–metal flow and interface deformation. The simulation results were validated by the measured metal velocity and interface deformation in the industrial cells. Based on the validated mathematical model, six cases of abnormal state were simulated to evaluate the impact of local cathode electric cut-off (LCEC) in realistic cells, and the solutions were presented to improve the MHD stability of abnormal cells.

2. Model and Description

2.1. Physical Model and Material Properties

A 500 kA aluminum reduction cell installed with 48 anodes (without slots) and 24 cathode groups was chosen as the simulation geometry. The physical model including the bath, metal pad, cathode blocks, cathode bars and ledge profile is shown in Figure 1. The anode cathode distance (ACD) is 0.045 m. The bath height and metal height are 0.18 m and 0.24 m, respectively. The material properties of the bath and metal are listed in Table 1.

2.2. Mathematical Models

2.2.1. Multiphase Model

The bath layer and metal pad are separated naturally due to the density difference in the cell. Thus, most researchers select the volume of fluid (VOF) model to track the bath/metal interface, where the metal is set as the primary phase, and the bath is set as the secondary phase.
The continuity equation can be described as:
α q t + · ( α q u q ) = 0
where t is time, u represents the velocity vector, α is the fluid volume fraction, and subscript q denotes the phase. For bath–metal two-phase flow, the phases obey the following equation:
α b + α m = 1
where the subscript b and m denote the bath phase and metal phase, respectively.
The momentum conservation equation can be described as:
t ( ρ u ) + · ( ρ u u ) = P + · [ μ ( u + u T ) ] + ρ g + F E
ρ = α b ρ b + α m ρ m
μ = α b μ b + α m μ m
where ρ is the density, P is the pressure, μ is the molecular viscosity, and g is the gravity acceleration. F E is the electromagnetic force, which is calculated from the MHD model.

2.2.2. Turbulence Model

According to previous research works, the standard k-ε model was selected to simulate the bath–metal flow field in the cell. The governing equations can be written as follows:
α q ρ q ( k t + u q · k ) = · [ ( α q μ t σ k ) k ] + α q G k α q ρ q ε + S k
α q ρ q ( ε t + u q · ε ) = · [ ( α q μ t σ ε ) ε ] + α q C 1 ε ε k G k α q C 2 ε ρ q ε 2 k + S ε
where k and ε are the turbulence kinetic energy and its dissipation rate, respectively. μ t is the effective turbulent viscosity. Gk is the generation of turbulence kinetic energy due to the mean velocity gradients. S k and S ε are user-defined source term. σ k and σε are Prandtl numbers (Pr) for k and ε, respectively. C 1 ε and C 2 ε are constants set as 1.44 and 1.92, respectively.

2.2.3. MHD Model

The static magnetic field of a 500kA cell was calculated separately, and imported into the subsequent MHD model. In the MHD model, the dynamic electric field was calculated automatically with the variation of melt flow and interface fluctuation. The current and magnetic inductions due to the weak melt flow could be ignored in the cell [17], so the calculation equation of the dynamic electromagnetic force generated by the static magnetic field and dynamic electric field can be simplified as follows:
j = σ E
F E = J × B
where j is the electric current density vector, and σ is the electrical conductivity. E and B represent the electric field and magnetic field, respectively. F E is the electromagnetic force.

2.3. Boundary Conditions

Current density value was set according to the total surface area of the anode bottom. A zero voltage potential was set at the end surface of the cathode bars. The upper surface of the bath was defined as the outflow. The other boundaries, such as ledge, anode side surfaces, and the top surfaces of cathode block were treated as no slip walls for liquid using a standard wall function.
The buoyancy force of the anodic bubbles drives the bath to form local vortices around the anode, but the influence of bubbles is only limited to the very local area around anode instead of the overall bath layer [25]. Thus, in this study the effect of anodic bubbles is ignored.

3. Results and Analysis

3.1. Simulation for Reference State

The melt flow for the reference state is simulated, and the metal flow field and bath/metal interface deformation are shown in Figure 2 and Figure 3, respectively. The distribution of the interface deformation range is shown in Figure 4.
As shown in Figure 2, the overall metal flow field is divided into two large vortices, where the Tapping End (TE) side is clockwise circulation, and the Duct End (DE) side is counterclockwise circulation. Both the velocity and the vortex area on the DE side are slightly faster and larger than those on the TE side. The maximum metal velocity is 0.188 m/s, which appears at the sides of anodes A20–A21. Simulation results also show two small localized reverse vortices at the corners in the downstream of cell (side B), but the influenced area is only limited to the corner anodes. As shown in Figure 3, the interface hump zone is mainly concentrated in the central area of side B (from B7 to B18, with the interface hump height of 0.031 m maximum). The height of the interface hump decreases gradually toward both ends and the upstream of cell (side A). The interface depression zone is mainly located in the central area of side A and the two corners of side B. The interface depression under anode B24 is the most obvious, with a maximum height of −0.047 m. The main cause for this phenomenon might be the significant difference of electromagnetic field between two sides of a cell. The magnetic field and the electromagnetic force of side A are greater than those of side B, with values of 7% and 25%, respectively. The metal pad is pushed toward side B, which contributes to a higher interface height at the central area of side B.
The interface deformation range generally agrees well with the normal distribution. From the simulation results shown in Figure 3, the interface deformation height in most of the area (97.9%) is within the range of ±0.03 m, only 2.3% of the area shows the interface height of below −0.030 m, which occurred at the corner of the DE and side B. The area with an interface height of above 0.030 m is less than 0.1%.
From the analysis above, it can be concluded that there is a significant interface hump at the central area of side B, which tends to cause an excessively low ACD correspondingly. Thus, how to lower the interface hump in this area would be the main motivation for the improvement of the cell MHD stability.

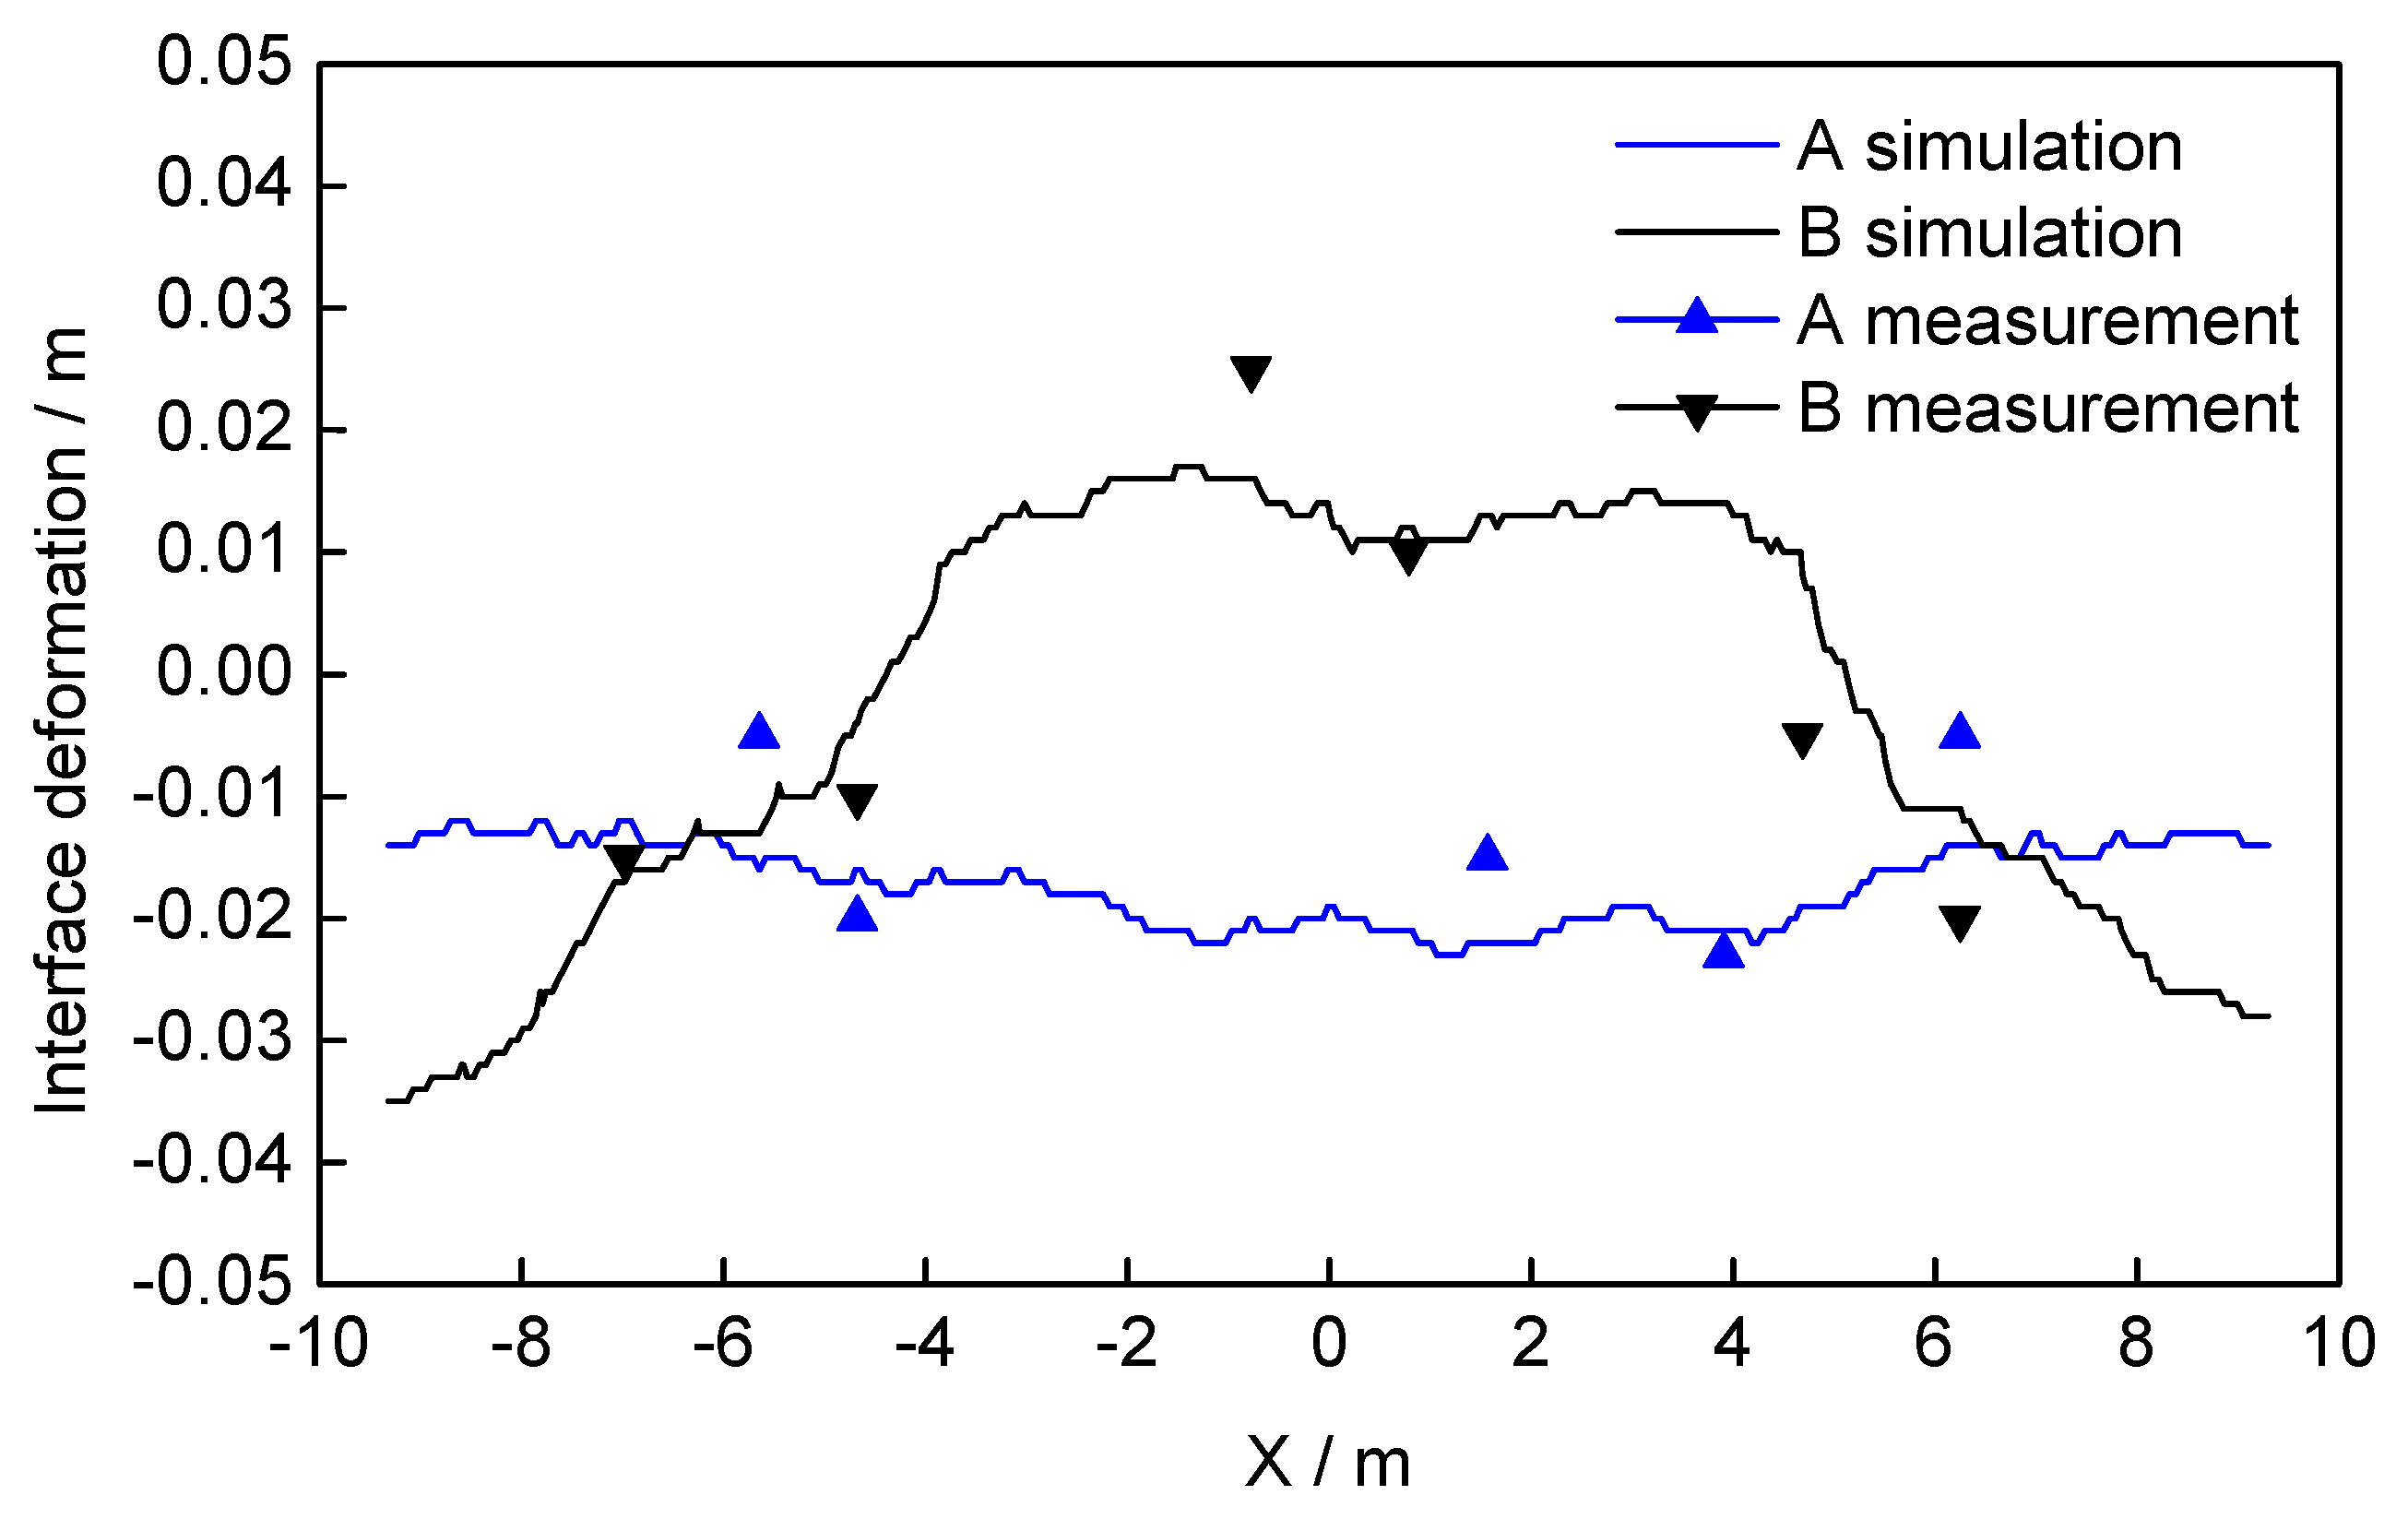
3.2. Model Validation

The simulation results, as introduced in the reference state, were then validated with measurement results in a 500 kA industrial cell. The metal flow field and interface deformation were measured with iron rod dissolution method [26] and multi-points upper height measurement, respectively. The measurement positions and the metal flow velocity vectors are drawn in Figure 5. The comparison of metal flow velocity and interface deformation between the simulation results and measurement results are shown in Figure 6 and Figure 7, respectively.
Data for the validation of metal velocity was sampled from 32 measurement points in a cell. The measurement results show that the maximum metal velocity is 0.174 m/s, which is located between the anode A21–A22 (point 16), and the corresponding simulation result is 0.170 m/s (with a deviation of 3%). The average metal velocity at all 32 measure points is 0.082 m/s, which is close to the average simulation results 0.068 m/s. The velocity directions at most of the measurement points agree well with the simulation results (see Figure 6). Due to the inevitable human error in industrial measurement, and the original low metal velocity of 7, 14, 20–24, 29, and 31 measurement points, it seems that the deviation between the measurement data and the simulation value is great. However, the simulation value is close to the measurement data with high metal velocity, such as the measurement points 4, 16, 17, 24, et al. For the overall metal flow field, both of the simulation results and measurement results show two large vortices.
Measurement points for the interface deformation were located in the anode gaps (drawn as a dark spot in Figure 5), and the measurement points were in the same line with the first anode stub from two sides of the cell. Considering the width of the anode gap (40 mm) and the different height of the anode top surface, it was difficult for the pot tending machine (PTM, NFC Shenyang Metallurgical Machinery Co., Ltd., Shenyang, China, with hammer rod diameter 80 mm) to drill holes on the crust. After 3 h hard work, only 11 measurement points (22 measurement points in the original plan were uniformly distributed in the cell) were successfully drilled with the artificial assistant, with five measurement points at side A and six points at side B. So, the limited data are not enough to draw the measurement curve for the interface deformation. The metal pad height (thickness) was measured by the upper method. The interface deformation at each point was calculated by subtracting the average metal pad height. In the industrial cells, the uneven distribution of the cathode current is inevitable and will lead to certain deviations from the interface deformation of the ideal cell state. In addition to the artificial measurement error, it is inevitable that there is a certain deviation between the interface deformation measurement and the simulation result. However, the measurement results show that the interface height in the central area of side B is higher than that of side A and two ends, and the distribution trend is similar to simulation. So, the measurement results show good agreement with the simulation results.

3.3. Simulation for Abnormal State

Based on the validated two-phase flow model, the MHD stability conditions in an abnormal cell could be simulated. For example, some cathode bars at side A could get high temperature due to excessive current flow, which is probably caused by the damage of the top surface of the cathode block. When encountering this problem, the operation managers often cut off the abnormal cathode flexes directly to prevent cathode damage or cell leakage. In this way, it would make it more difficult for the abnormal cells to run under a steady condition.
In this study, it was assumed that the cathode flexes at positions A2A3, A6A7, A10A11, A14A15, A18A19, and A22A23 at side A were cut off, respectively, to investigate the impact of LCEC on the melt flow field. The simulation results of the metal flow field and interface deformation are shown in Table 2 and Figure 8.
Based on the simulated ACD value under each anode in the reference state, the ACD changing ratios for each anode under six abnormal states were calculated with Equation (10). The ACD changing ratios at side A and side B are shown in Figure 9 and Figure 10, respectively.
C R i = A C D _ A i A C D _ R i
where i is the anode numbering, with a total of 48 anodes. C R i is the ACD changing ratio of anode i. ACD_Ri and ACD_Ai represent the ACD of anode i under the reference state and abnormal state, respectively.
Compared with the simulation results in the reference state (Figure 2 and Figure 3), the metal velocities under anodes A5–A7 increase when the cathode flexes at position A2A3 are cut-off (Figure 8 case 1). The concaved interface becomes worse under anodes A4–A7 and A19–A24, but the concaved interface improves under anodes A8–A17. The metal pad height rises significantly at anodes B1B2, corresponding to the ACD at anodes B1B2, decreasing by 12% (Figure 9 and Figure 10). The interface hump under anodes B5–B19 drops slightly, with the average ACD increasing by 3%, which shows an improvement to the ACD condition in the central area of side B.
When the A6A7 cathode flexes are cut-off, the metal velocity under anodes A5–A7 decreases significantly (Figure 8 case 2). The interface depression drops further under anodes A1–A5 and anodes A11–A20, but rises steeply under anodes A7A8 (where the ACD decreases by 23%). The interface hump under anode B8 and anodes B11–B13 rises slightly, with the corresponding ACD decreasing by 4% (maximum). The ACD under anode B20 decreases by 5%. Thus, the ACD in the central area of side B worsens slightly.
When the A10A11 cathode flexes are cut-off, the metal velocities under anodes A9–A13 increase significantly; this might be related to the originally low metal velocities in this area (Figure 8 case 3). The interface depression under anodes A5–A8 and anodes A13–A19 drops further, but the metal pad height under anodes A1A2 and anodes A21–A24 rises slightly. Moreover, the interface depression under anodes A10A11 rises steeply, with the corresponding ACD decreasing by 30% (maximum). The metal pad height under anodes B1B2 and anodes B20–B23 rises slightly, but the interface hump under B5–B19 drops significantly, with the average ACD increasing by 7.5%. As a result, the interface instability in the cell improves significantly.
When the A14A15 cathode flexes are cut-off, the metal velocities under anodes A12–A16 increase slightly (Figure 8 case 4). The interface depression under anodes A16–A24 drops greatly with the corresponding ACD increasing by 15% (maximum, occurred under anode A19), but the metal pad height under anodes A12–A15 rises greatly with the average ACD decreasing by 28%. Although the overall interface hump under anodes B7–B29 drops significantly with the average ACD increasing by 6%, the interface hump under anodes B11B12 become worse with the corresponding ACD decreasing by 11% (maximum), which would definitely deteriorate the MHD stability of the cell.
When the A18A19 cathode flexes are cut-off, the metal velocity under A17–A19 decreases significantly, but increases slightly under A14–A16 (Figure 8 case 5). Both the interface height under A1–A6 and A10–A18 rise somehow, but the interface depression under A19–A24 drops further, with the ACD increasing by 28% (maximum) under A21. The interface hump under B1–B17 aggravates obviously, with the ACD average decreasing by 4%, and this worsens the interface stability.
When the A22A23 cathode flexes are cut-off, the metal velocity under A19–A21 decreases significantly, but the high velocity area expands from A18–A21 to A16–A21 (Figure 8 case 6). The interface height under A22–A24 and B19–B24 drops slightly. However, the interface depression under A1–A20 rises, with the ACD average decreasing by 3.5%, and interface hump under B1–B18 rises, with the ACD average decreasing by 3%. It is no doubt that the interface fluctuation deteriorates further.
From the analysis above, we can concluded that the LCEC does not affect the overall melt flow field; however, it could change the local metal velocity and interface deformation to some extent. The LCEC at positions A2A3 and A10A11 could lower the interface hump in the central area of cell side B, which is helpful to improve the ACD distribution. While the LCEC at positions A18A19 and A22A23 have negative impacts on the interface deformation, which is consistent with the fact that the anodes changing at A21–A24 have the most sensitivity for cell MHD stability. This might be related to the overall distribution of the two-phase flow field and the magnetic field impact of busbar in an adjacent pot room.
During the management of an aluminum reduction cell, when the excessive high temperature or high current flow at some cathode bars are reported, the manager should first pay close attention to the Fe and Si content in the metal, and monitor the surface of the cathode block during anode changing. Also, the cathode bar temperature, cathode bar current flow, and the local shell temperature should be tracked every day. It is not wise to cut off the cathode flexes at the first time. If the temperature and the current flow of the cathode bars remain stable, and the other parameters are still normal, no treatment is suggested. However, if the cathode bar condition becomes worse, it is suggested to cut off part of the cathode flexes based on the results of computational simulation. The number of cathode flexes that should be cut-off will be different depending on the location.

4. Conclusions

Under the condition of a static magnetic field coupled with a dynamic electric field, a three dimensional bath–metal two-phase quasi-steady flow model for a 500 kA full cell was built to study the impact of realistic LCEC on the melt flow field. Three main findings were achieved:
(1)
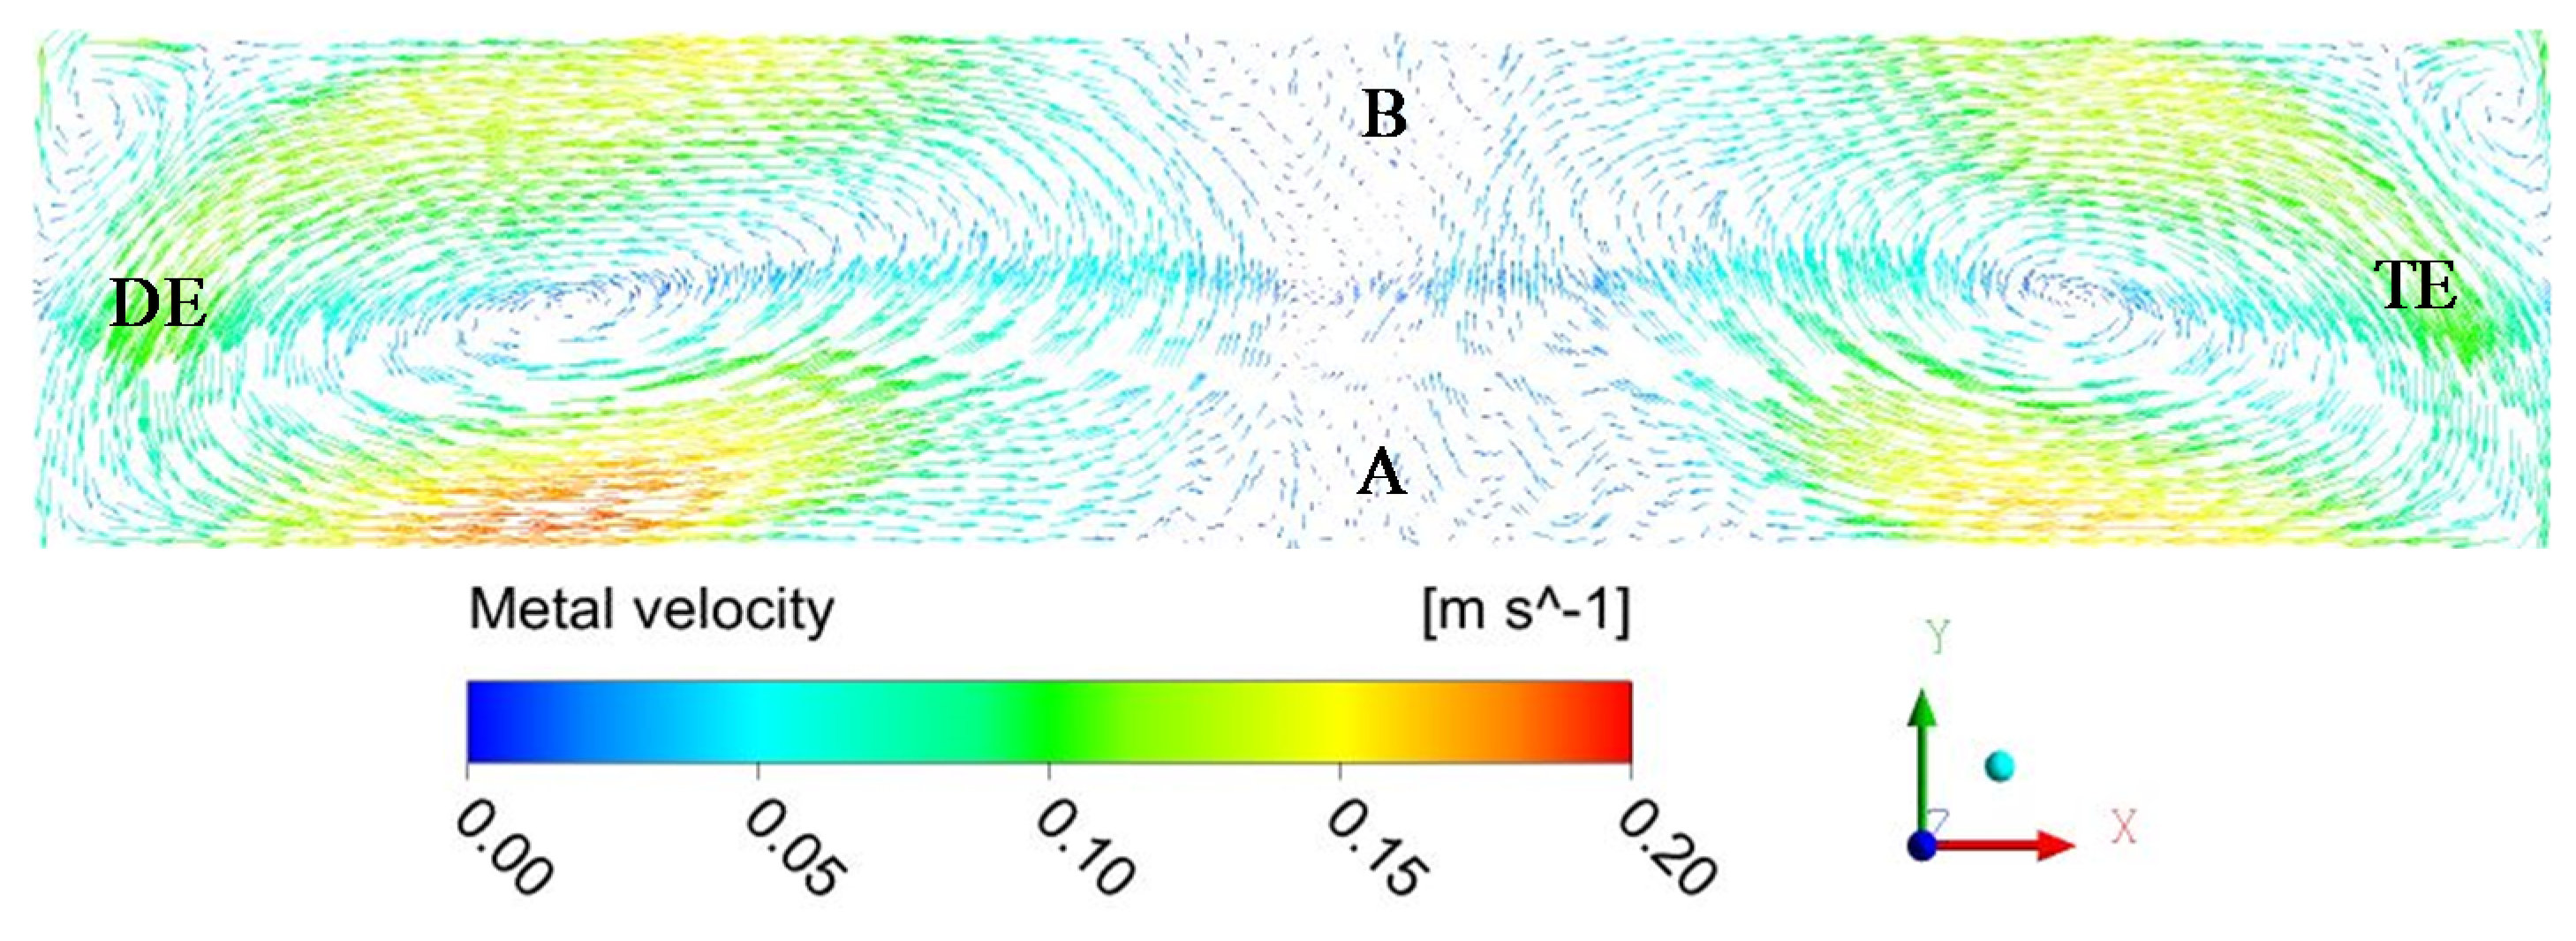
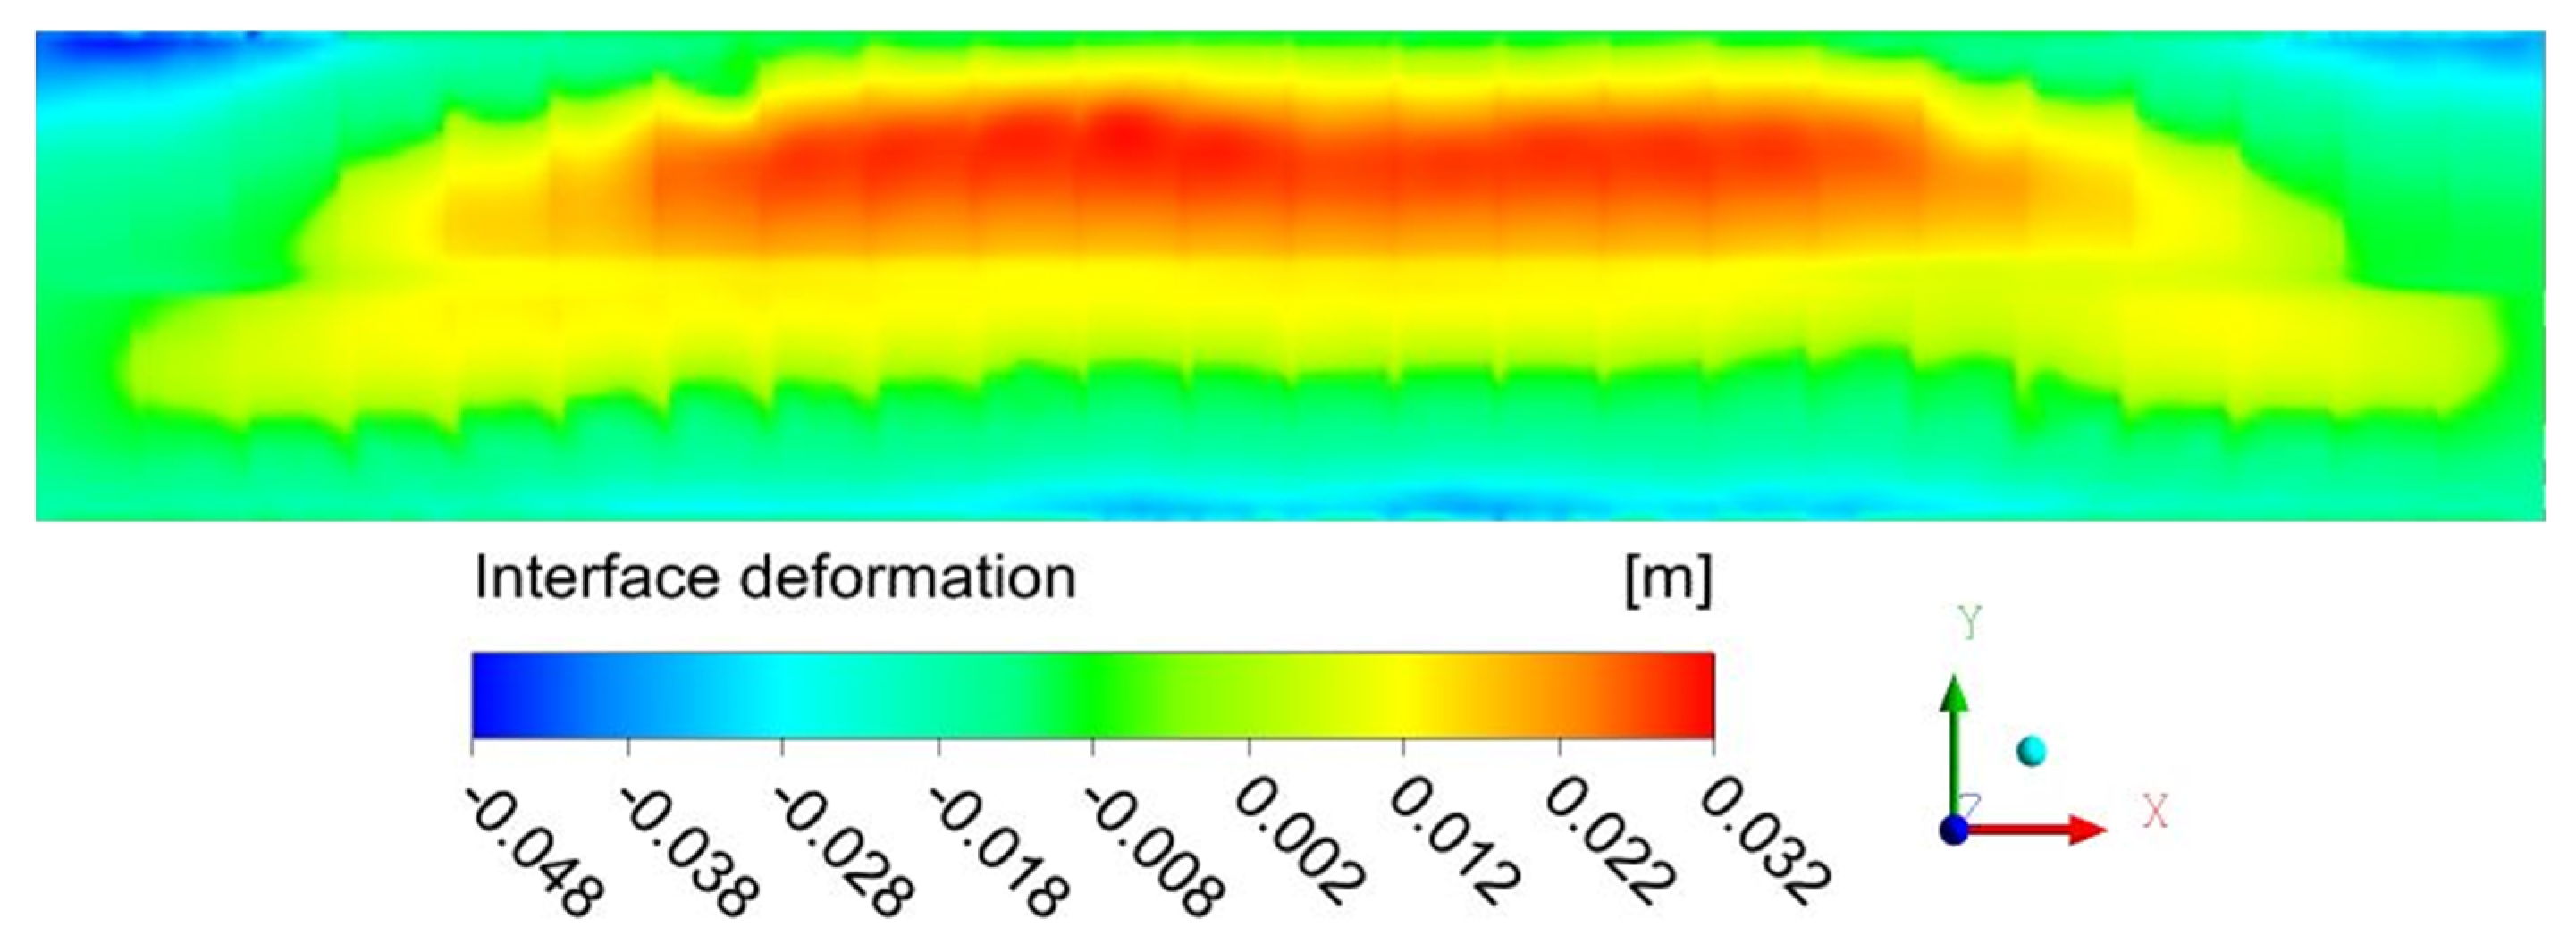
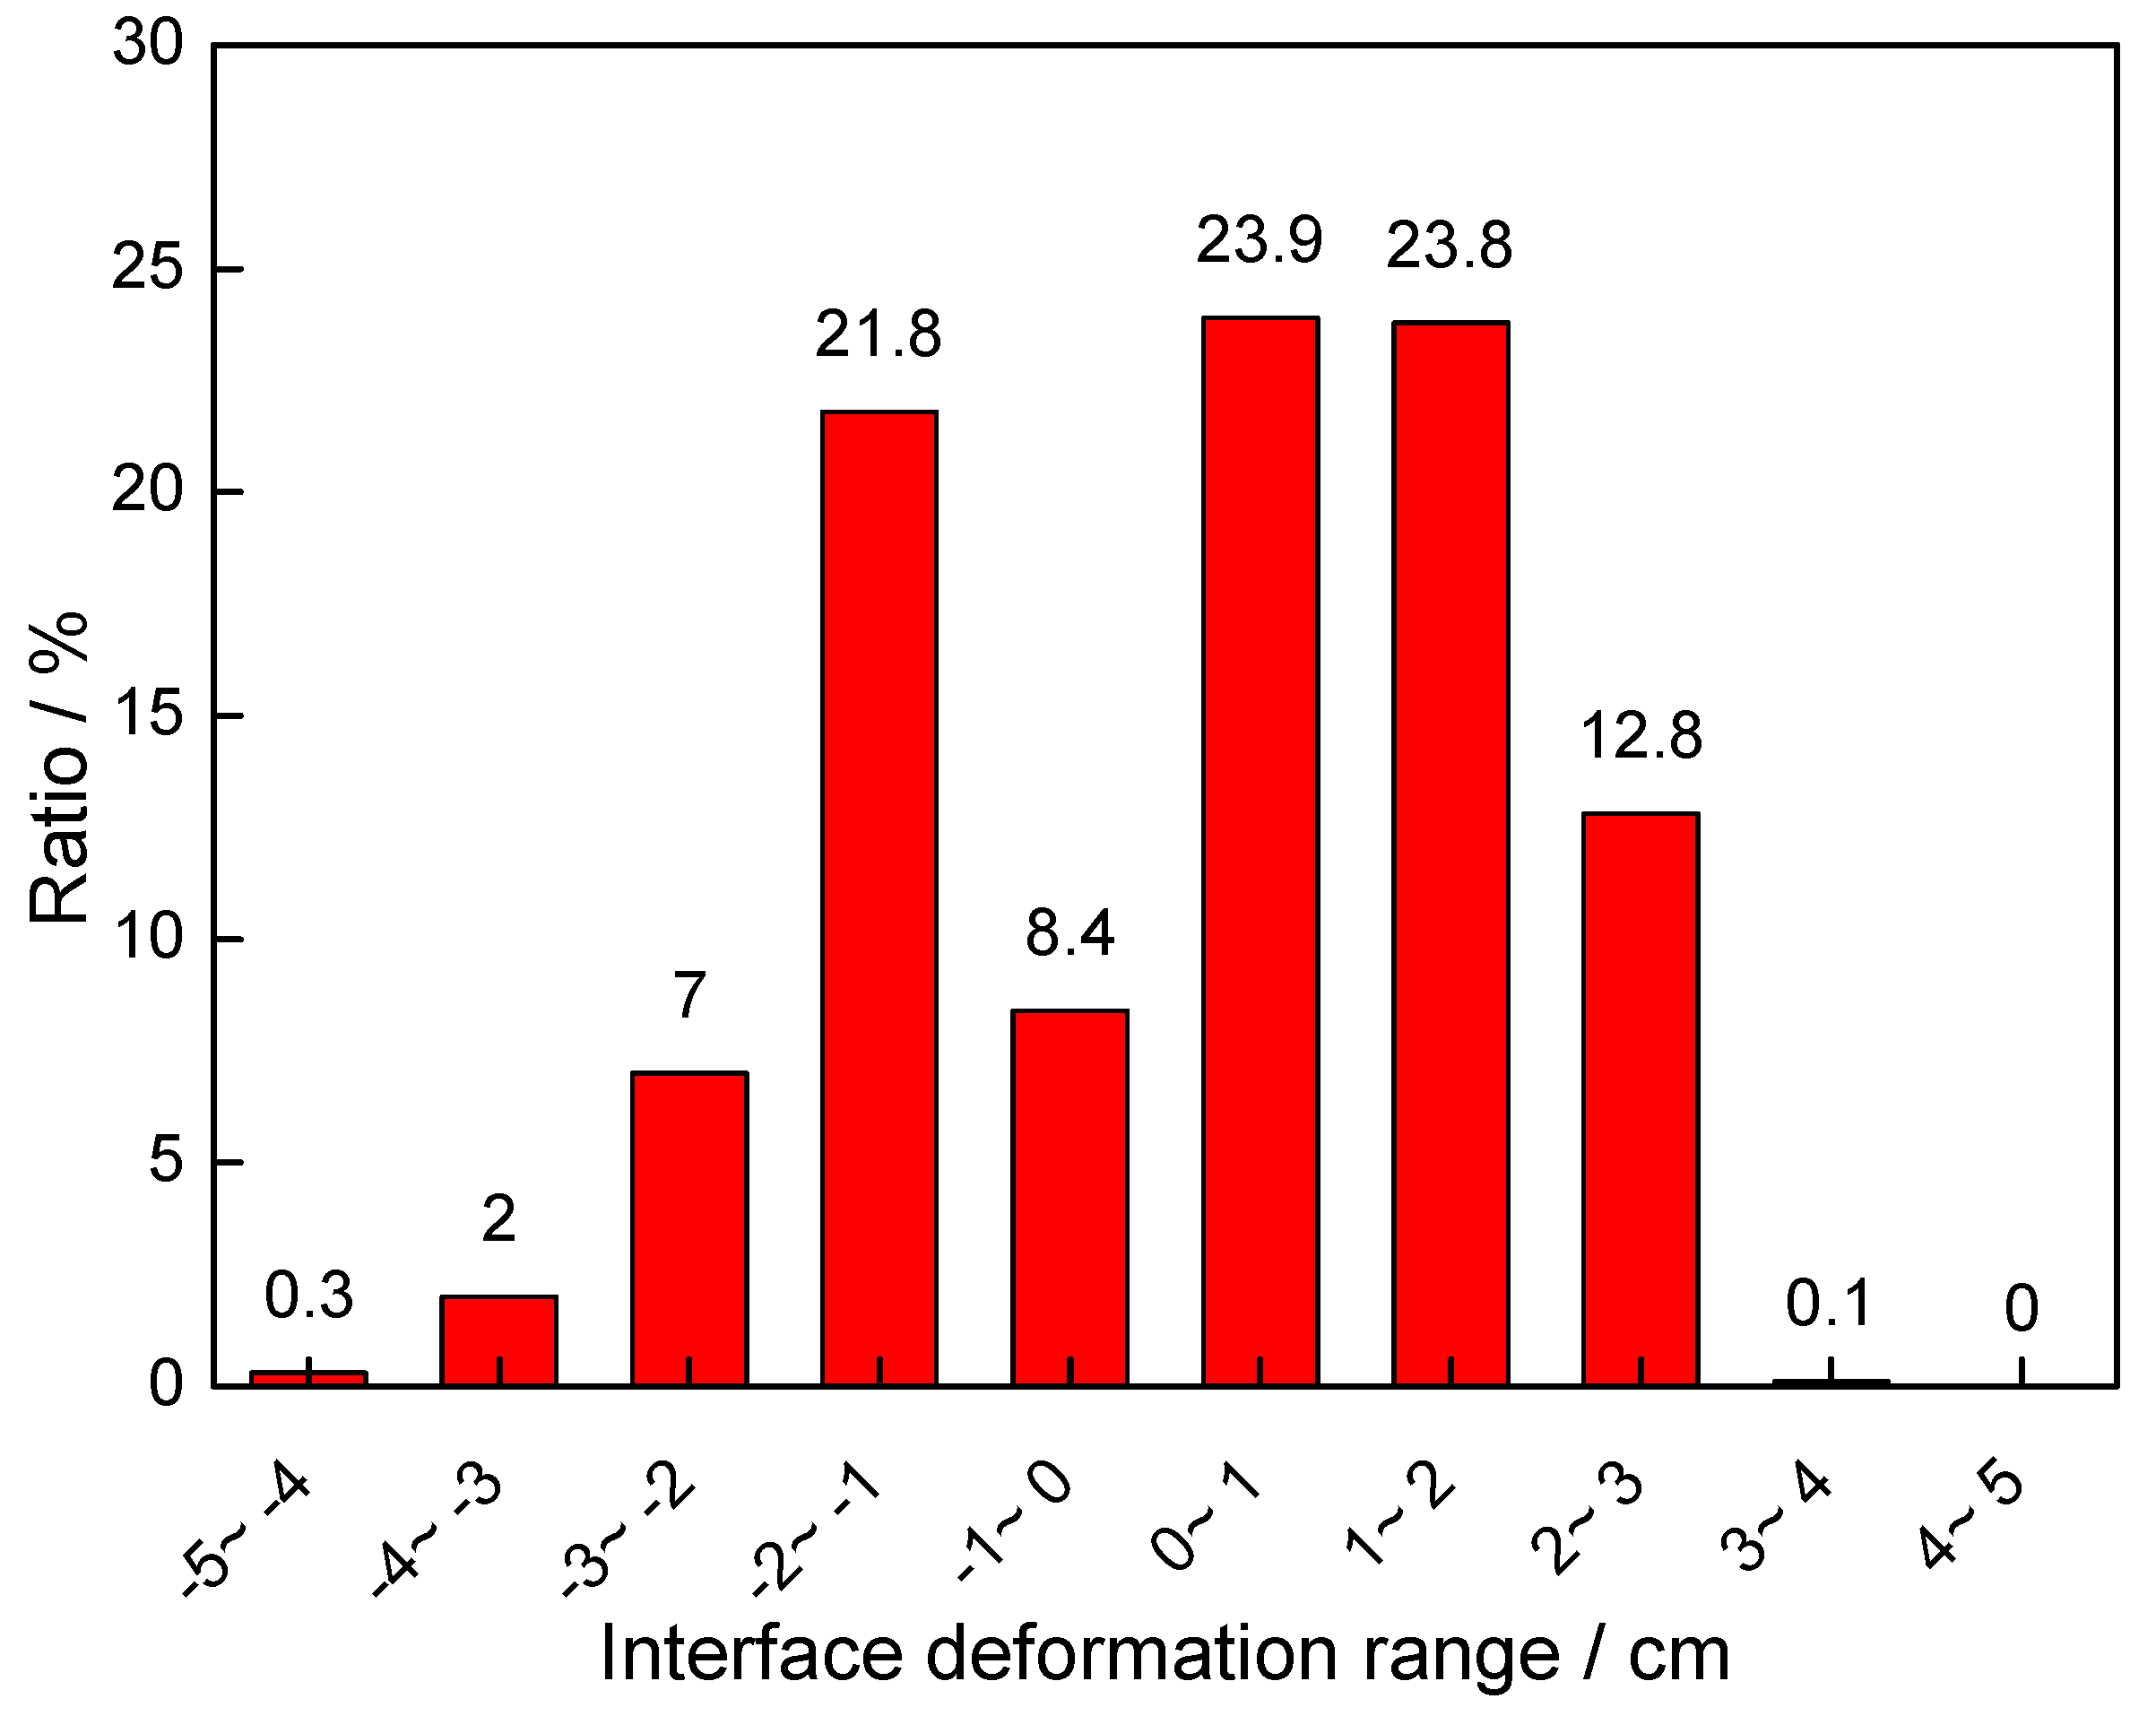
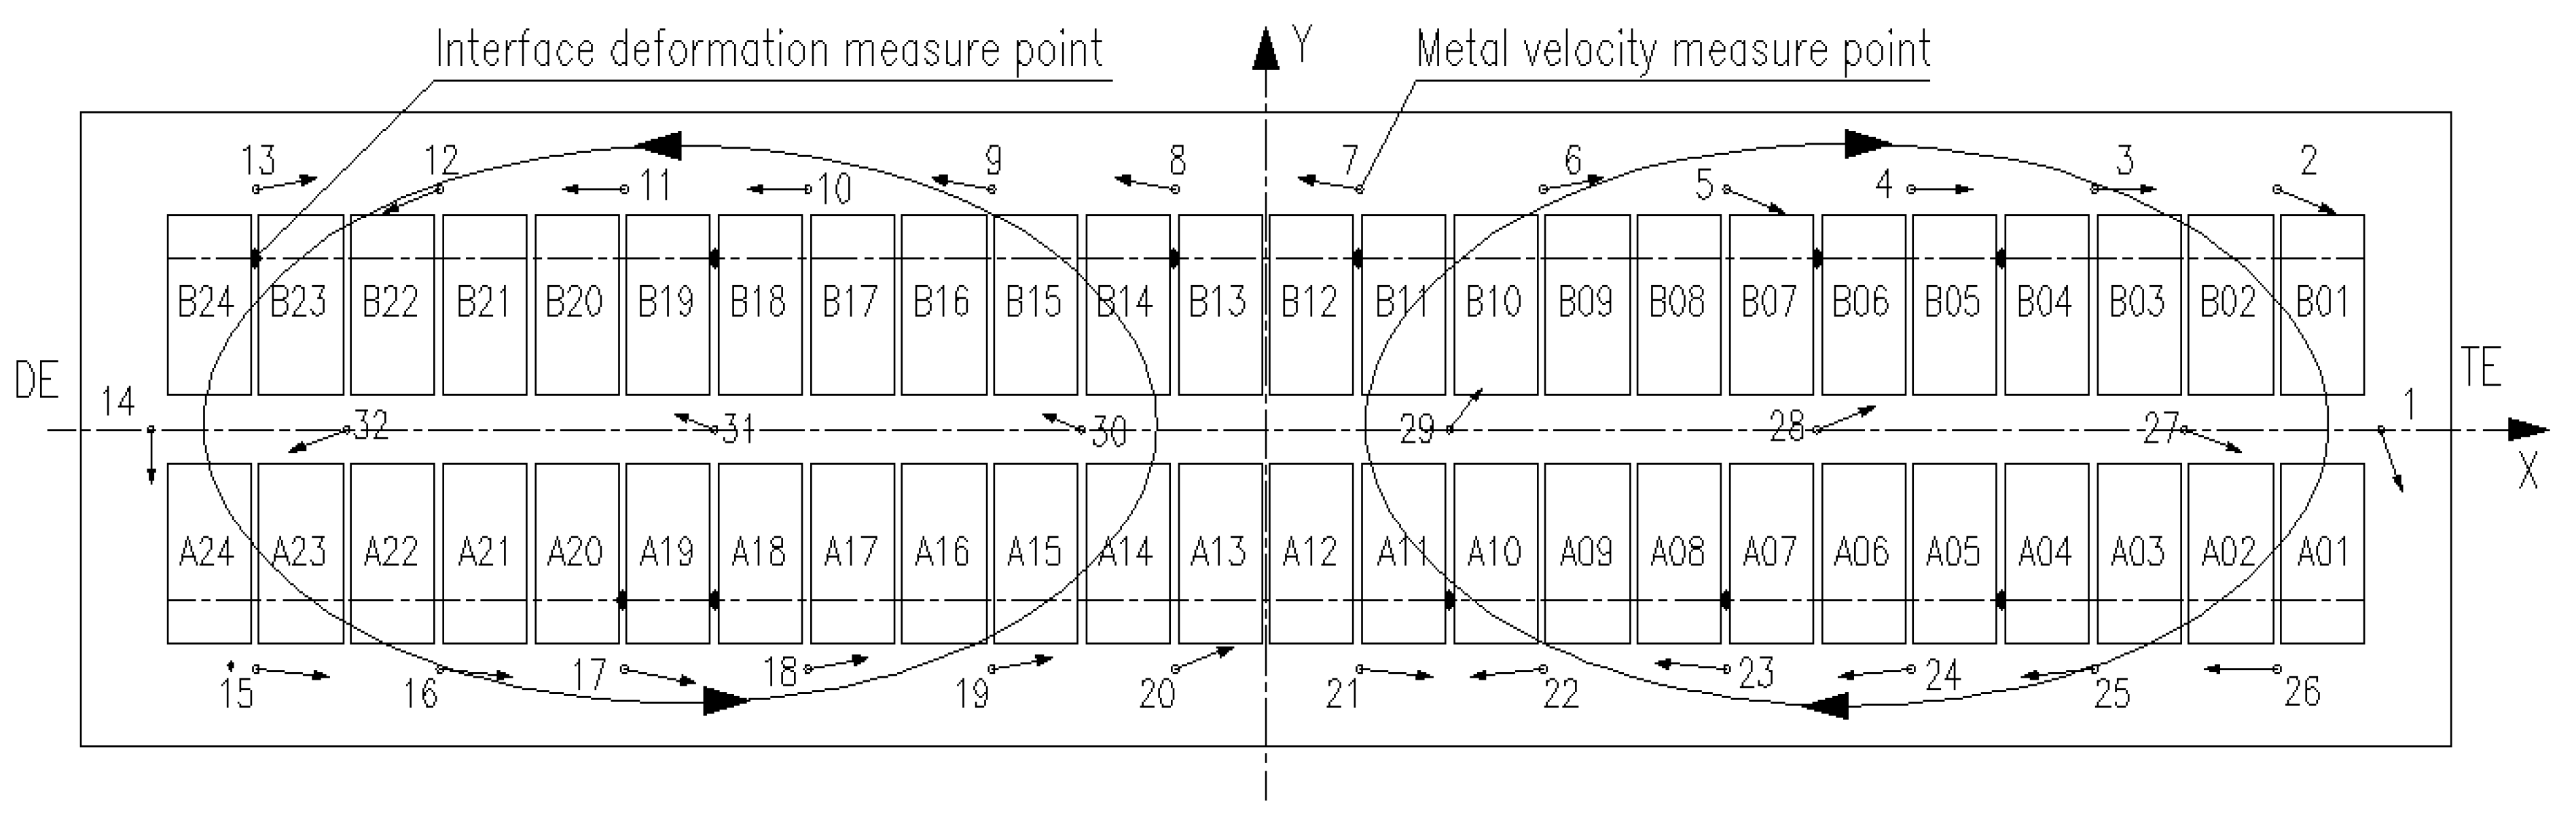
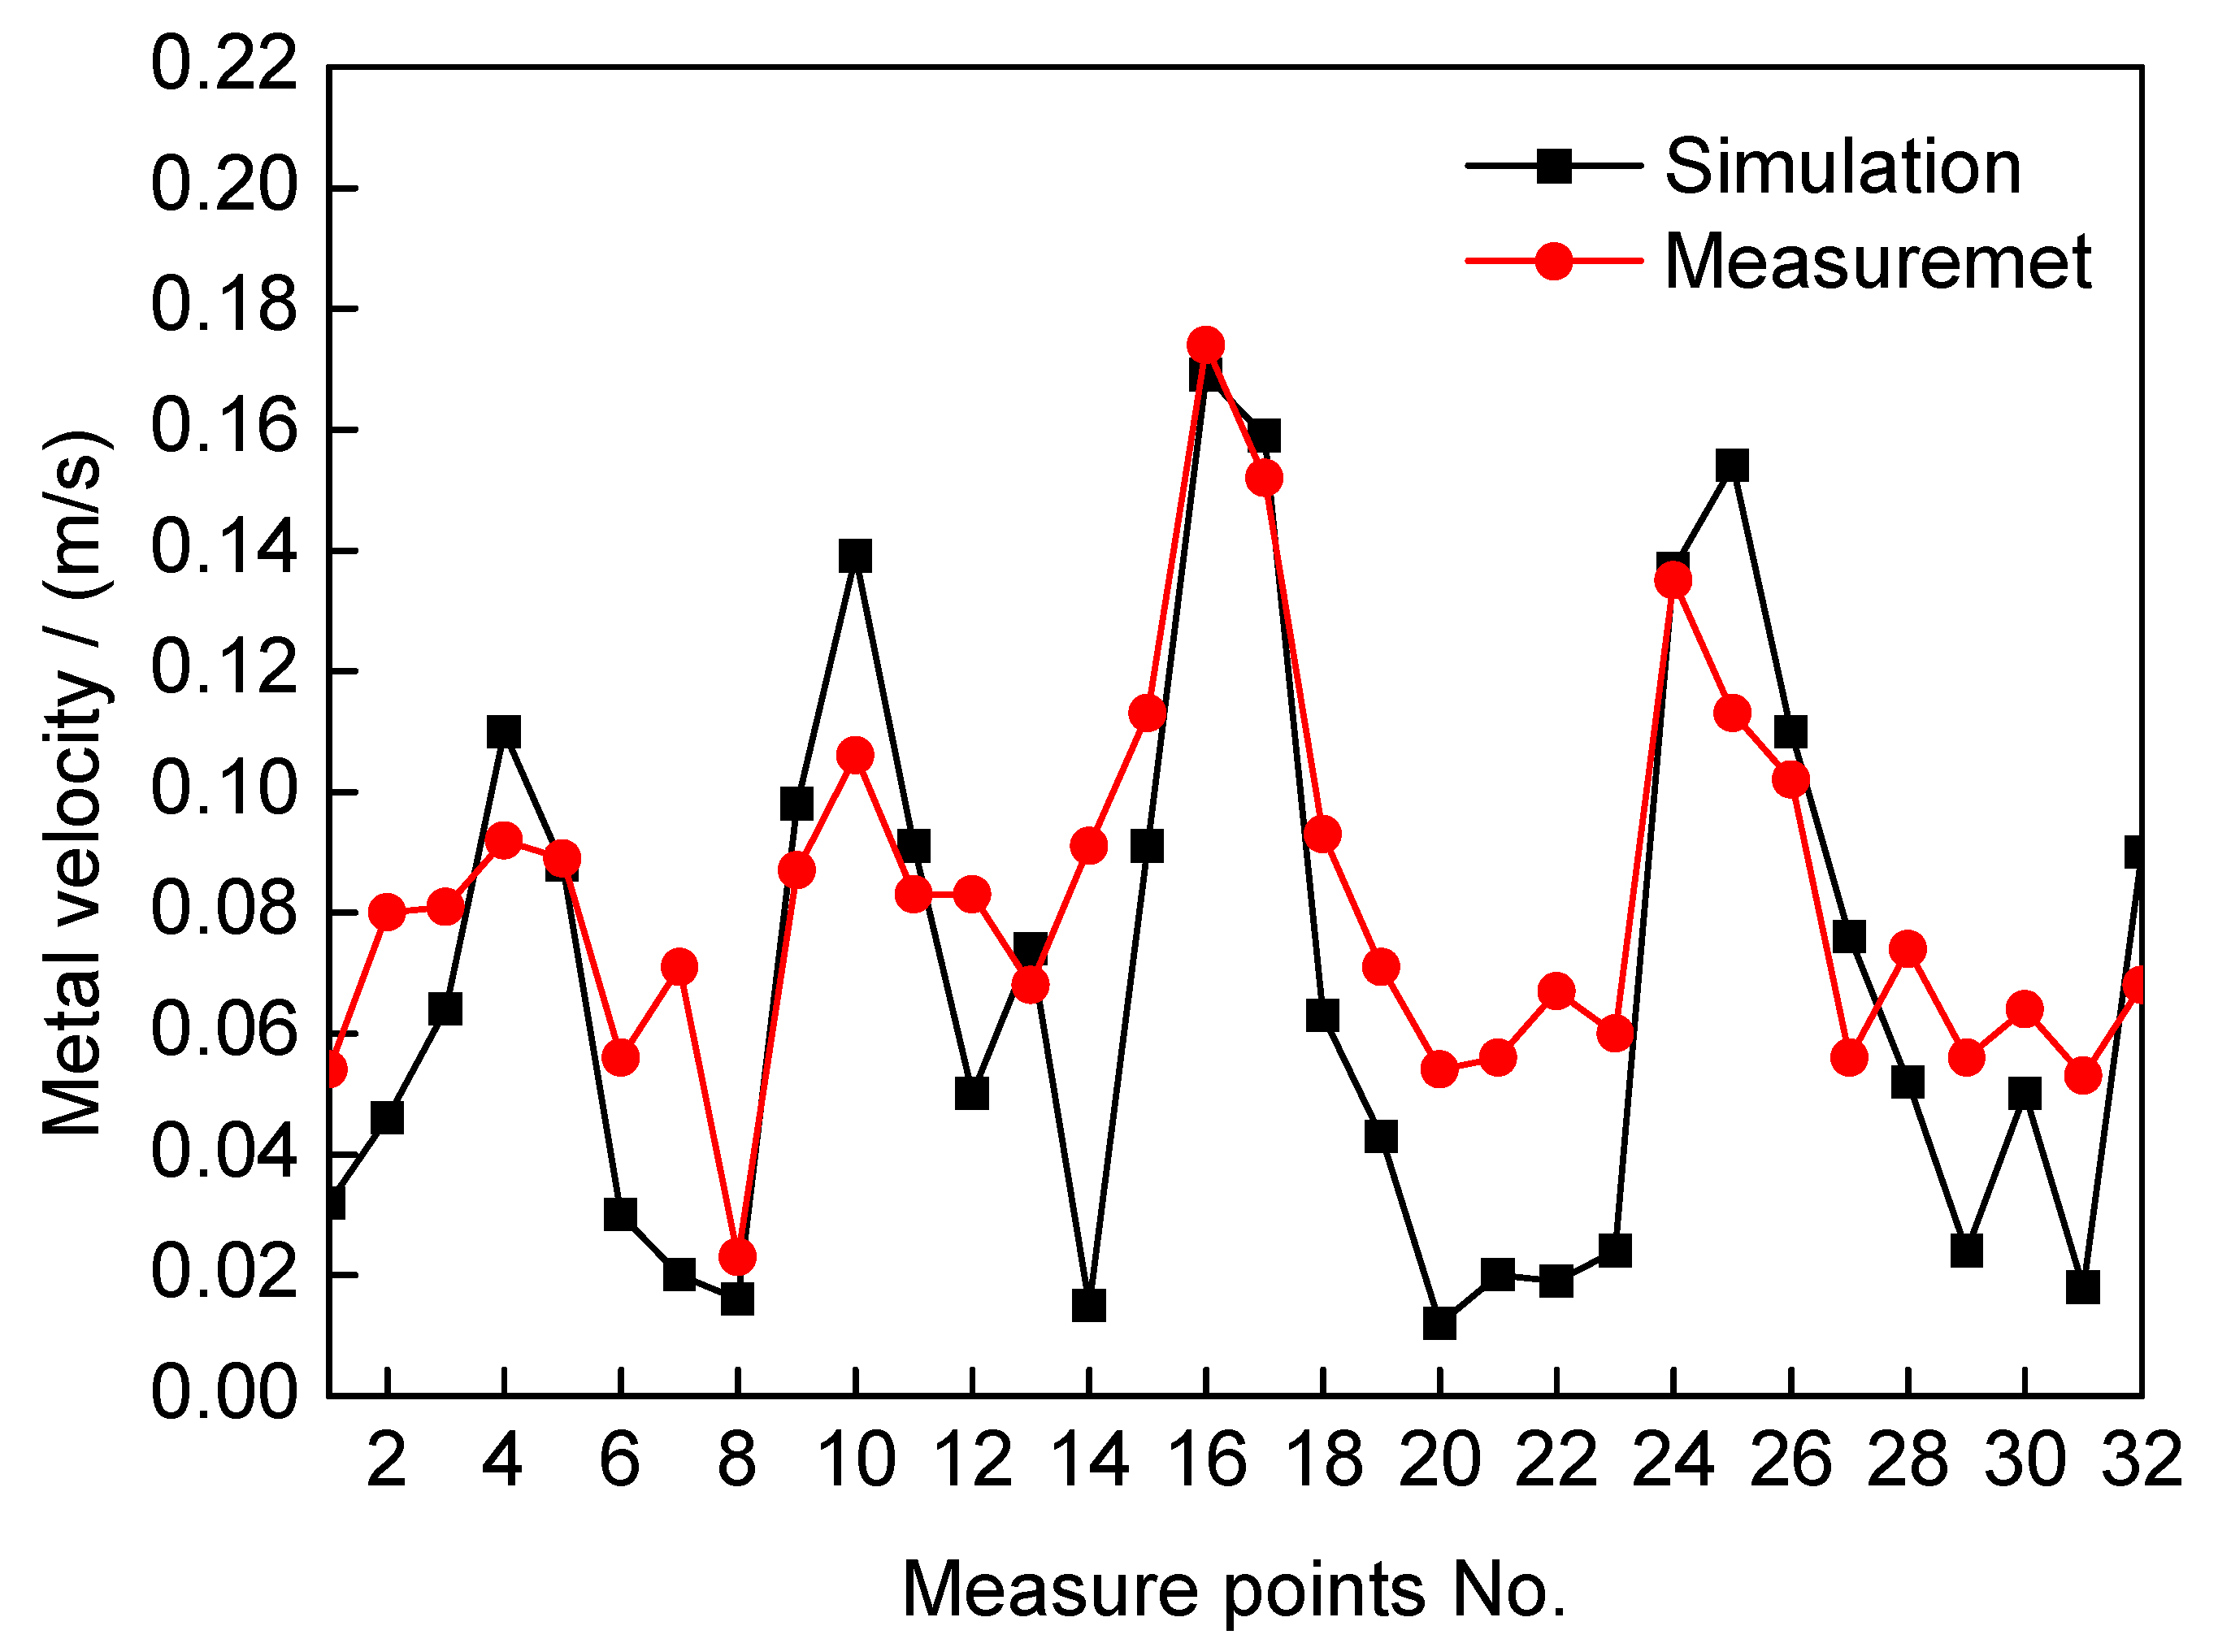
There are two large vortices for metal velocity field in cell, with a clockwise vortex in the TE side, and a counter clockwise vortex in the DE side. Meanwhile, the metal velocity on side A is larger than on side B. There are interface depressions both on side A and two ends of the cell, but an interface hump on the center of side B. The metal velocity and interface deformation measurements show good agreement with the simulation results.
(2)
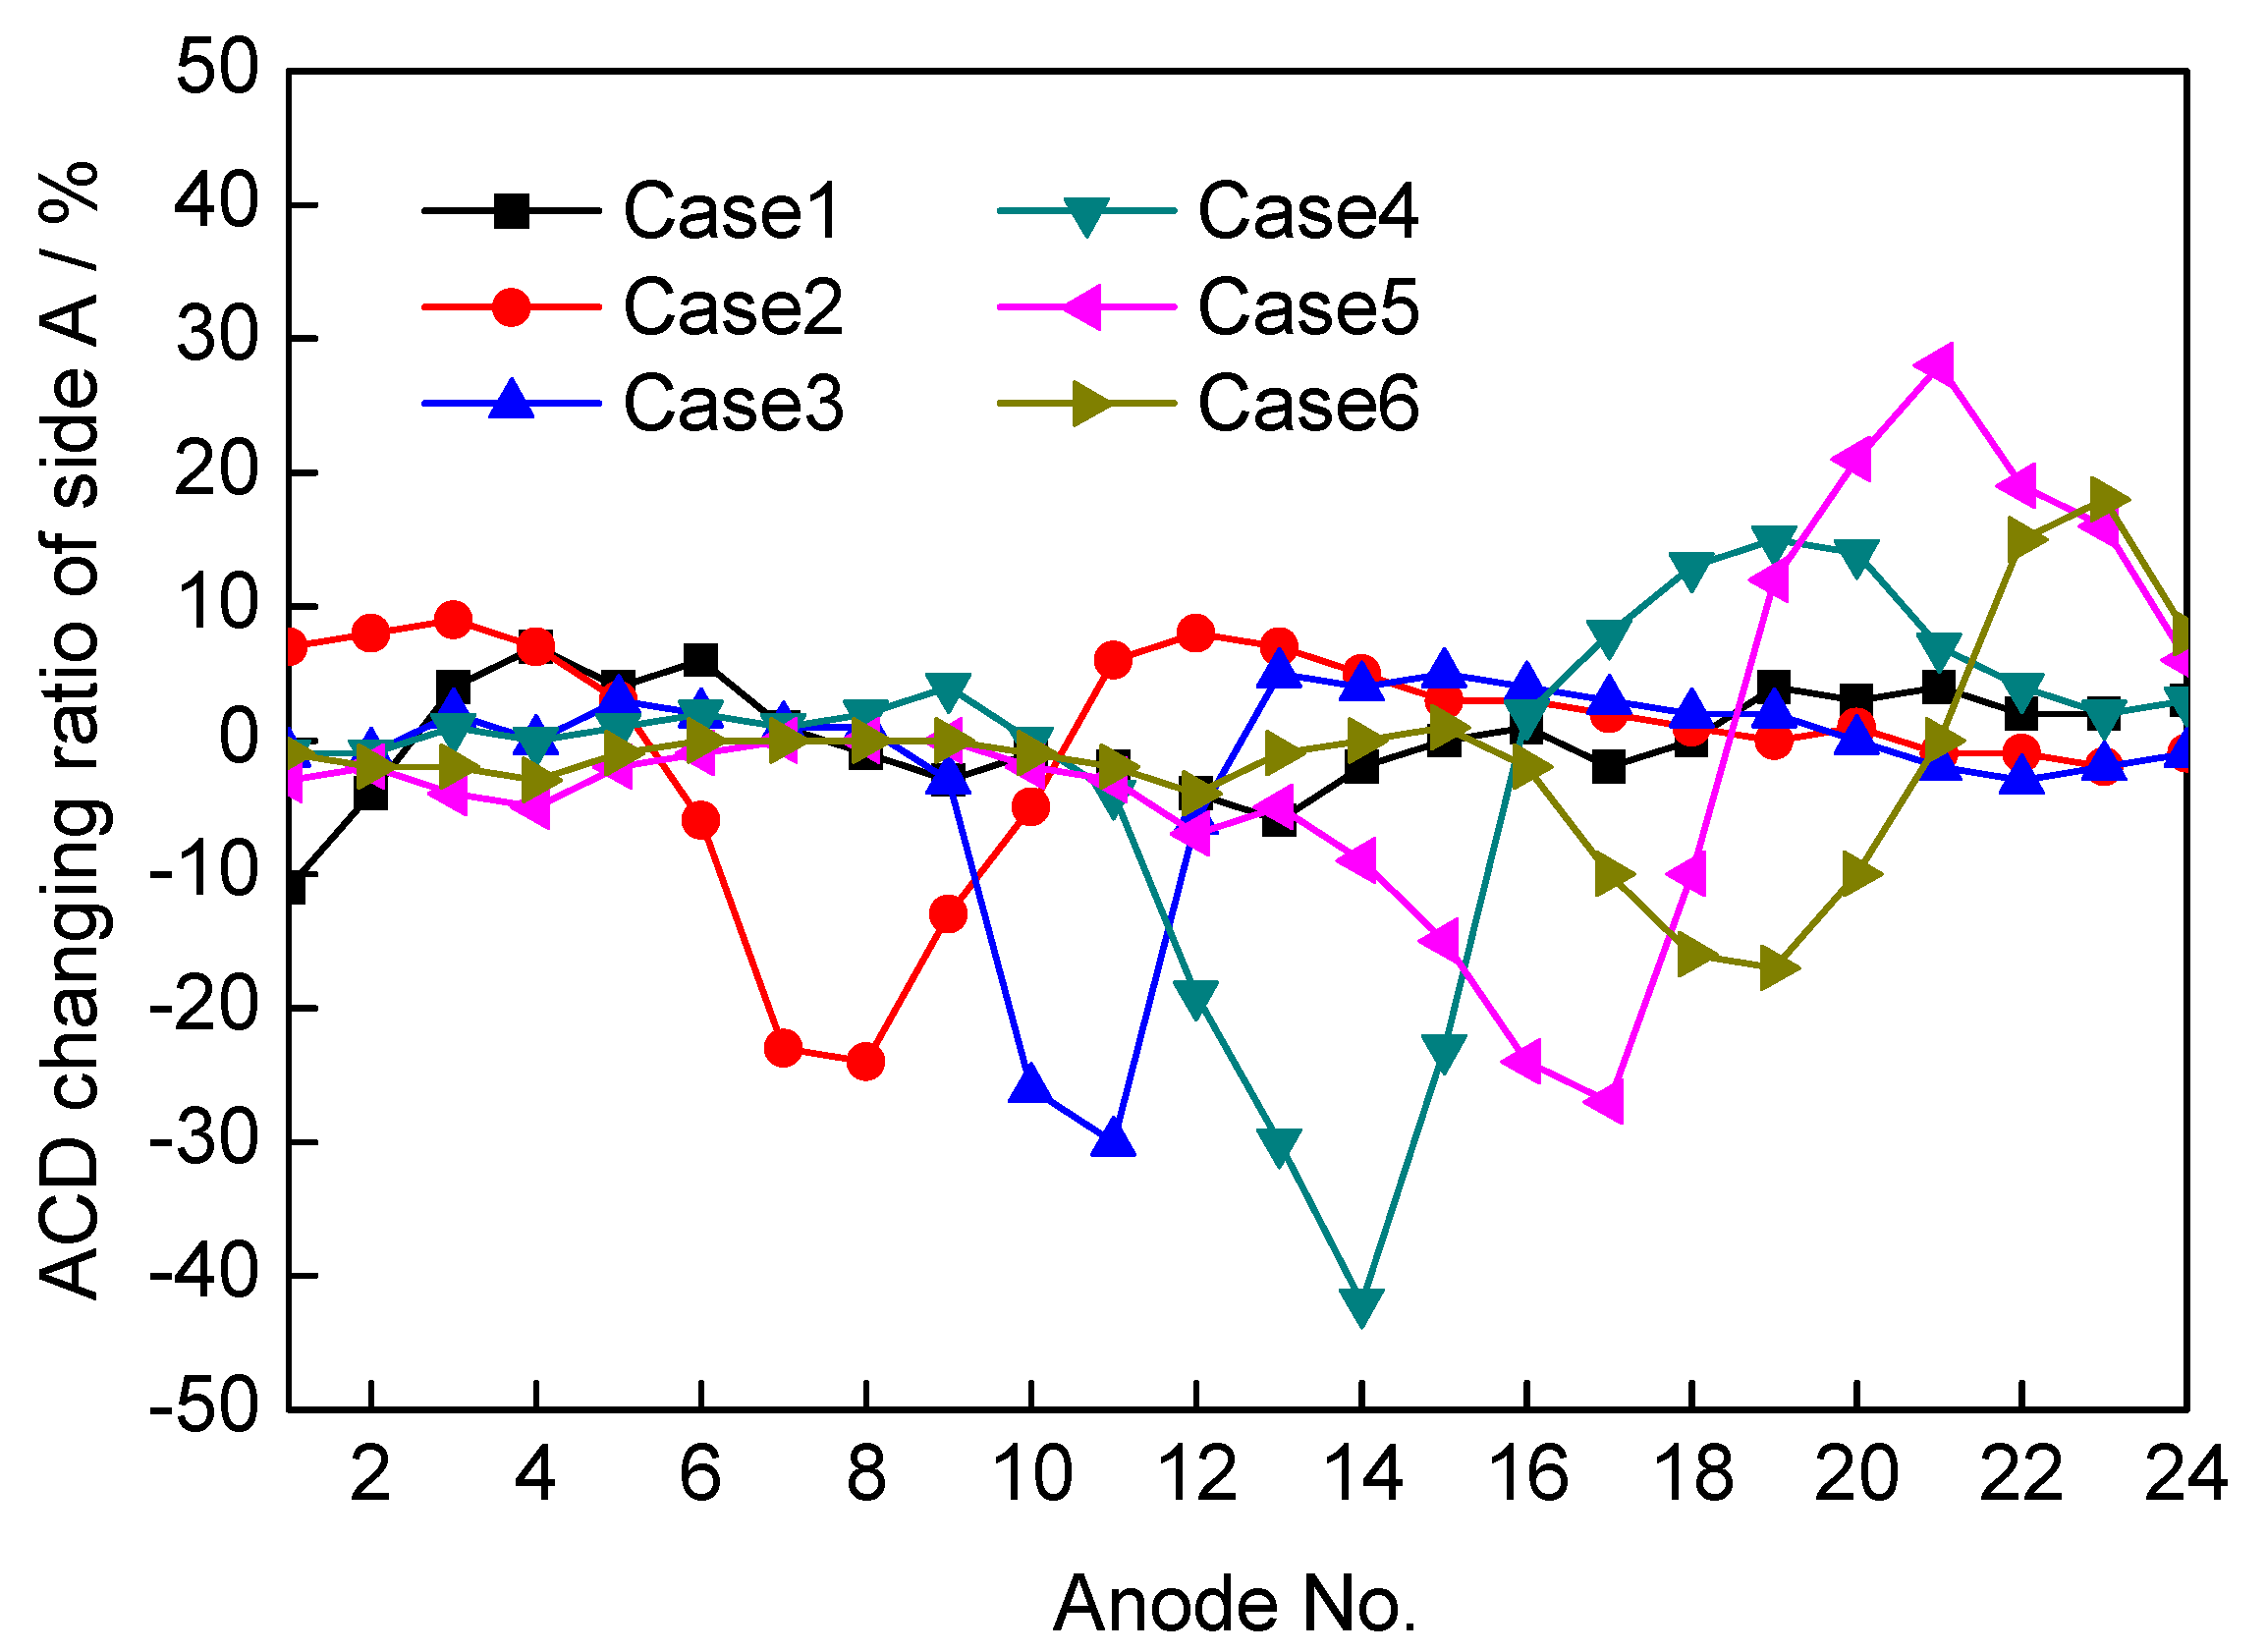
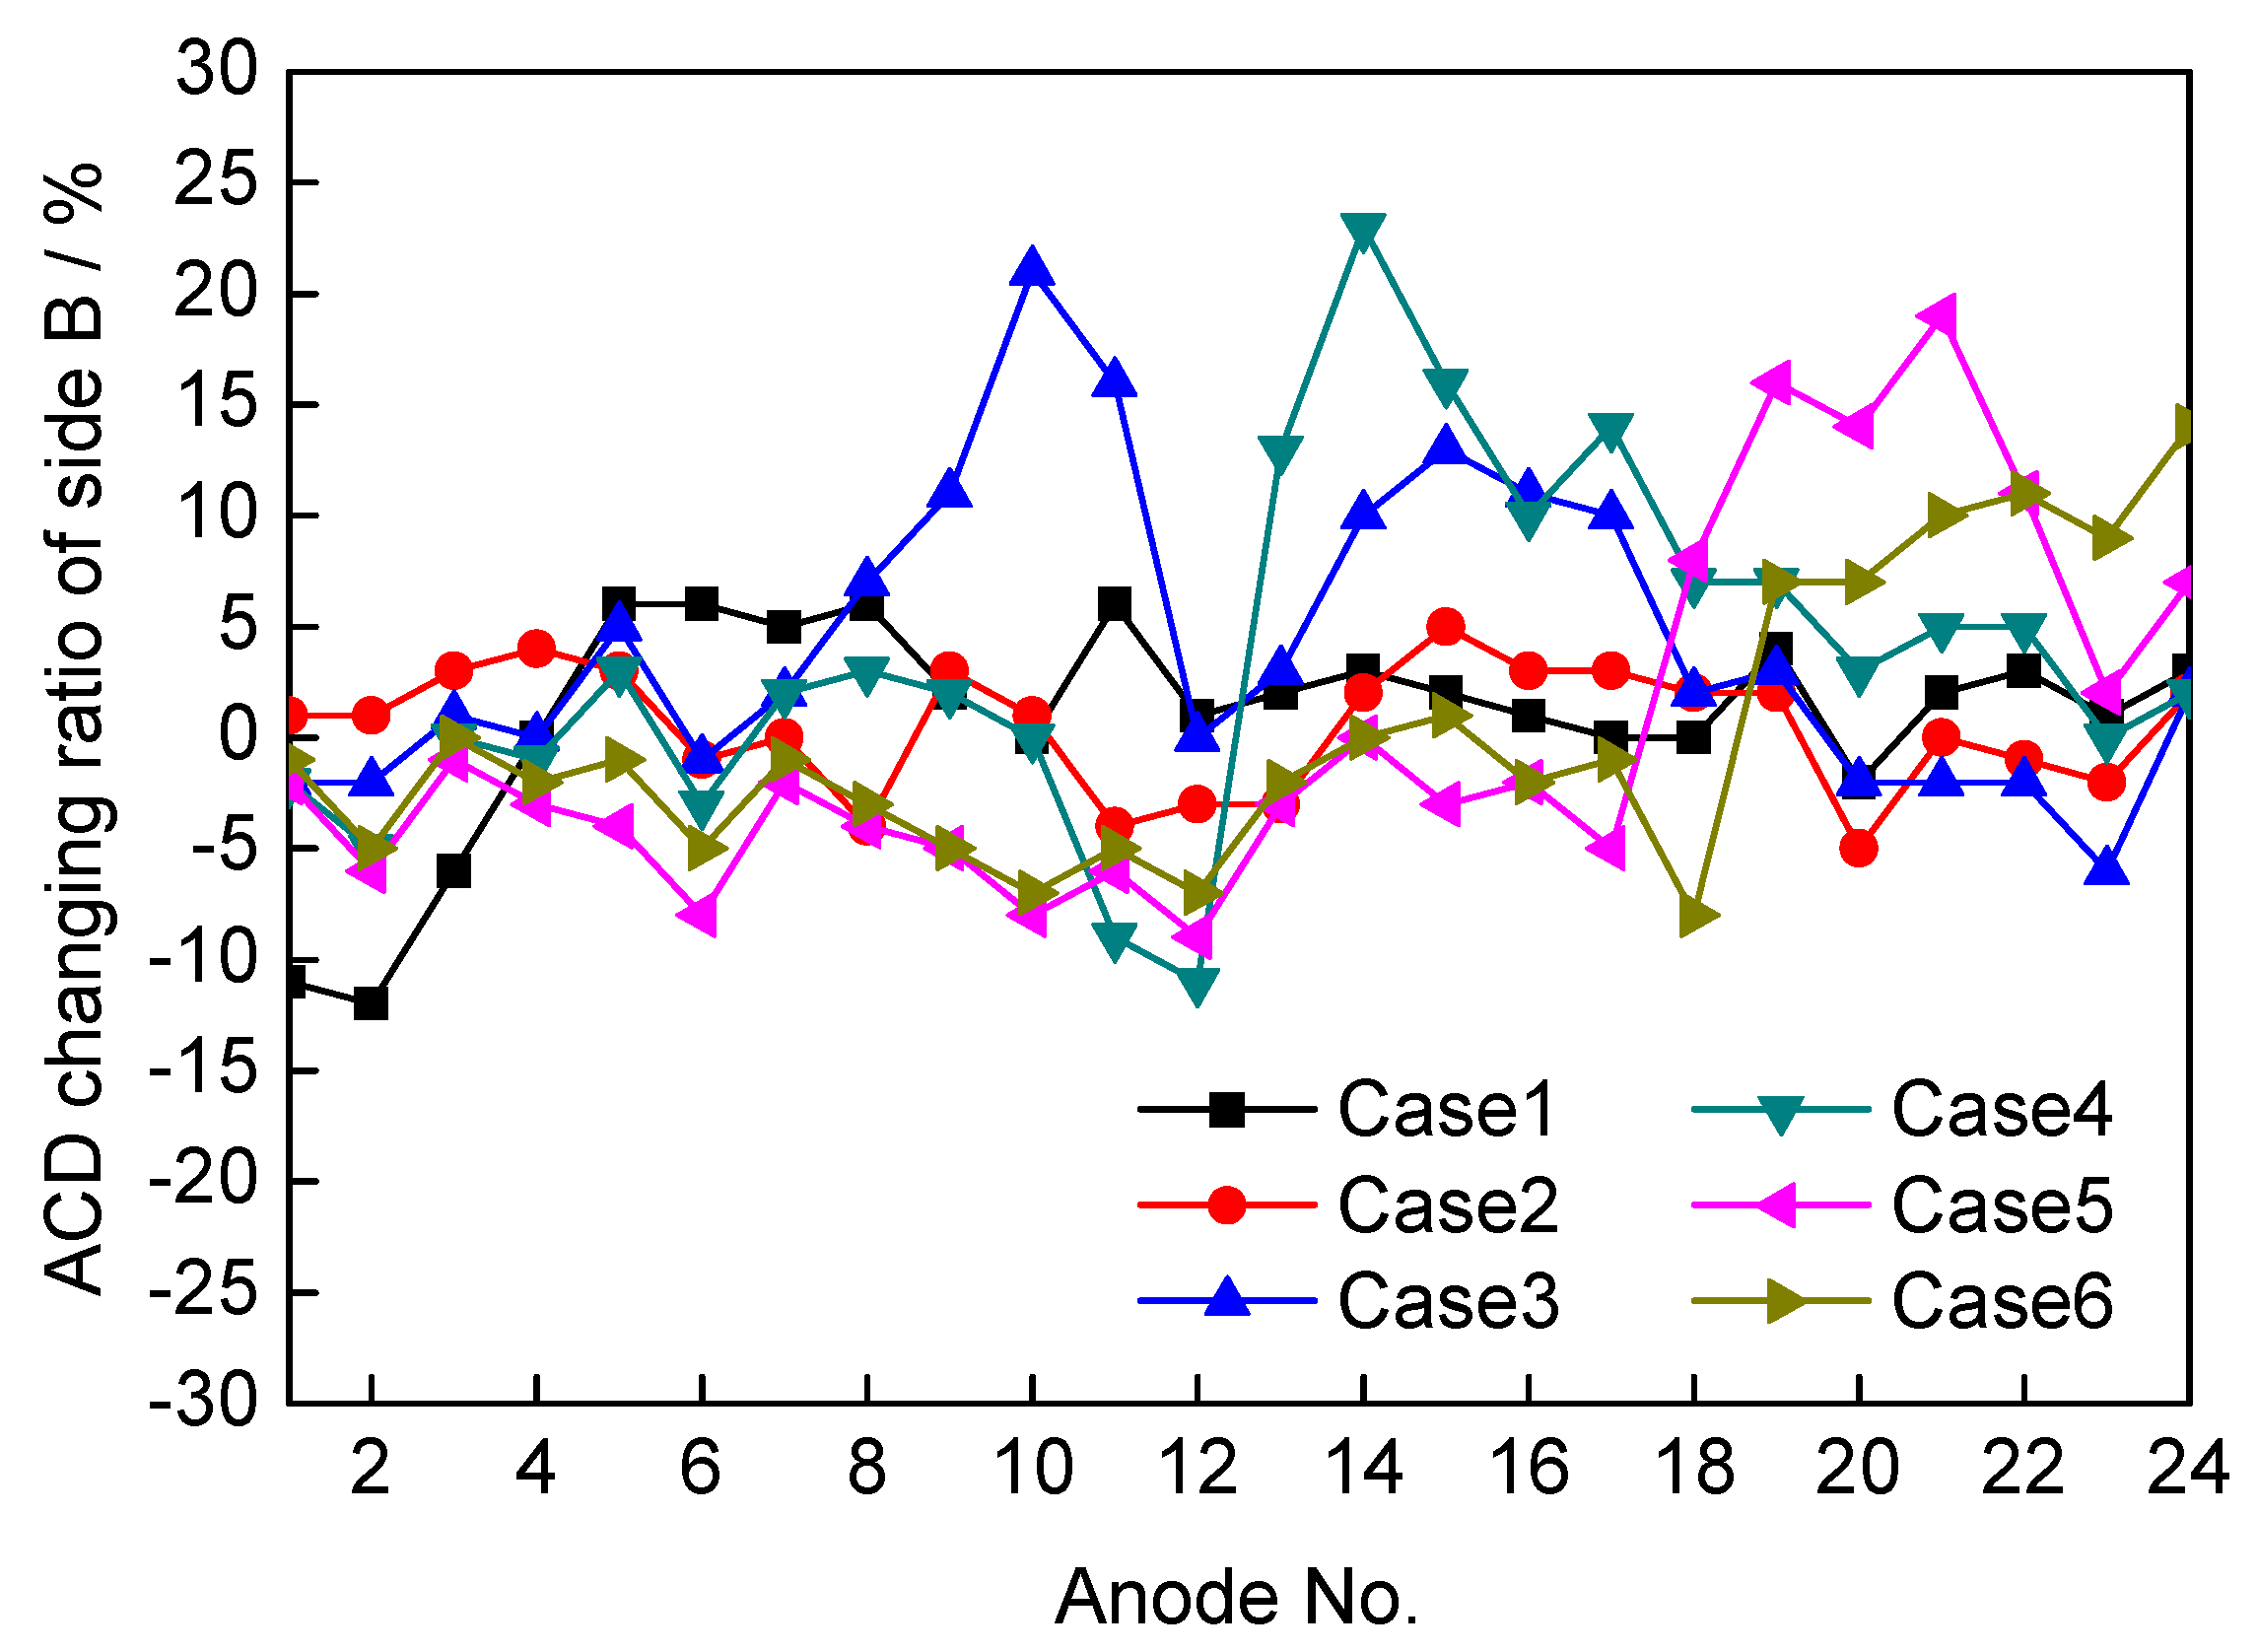
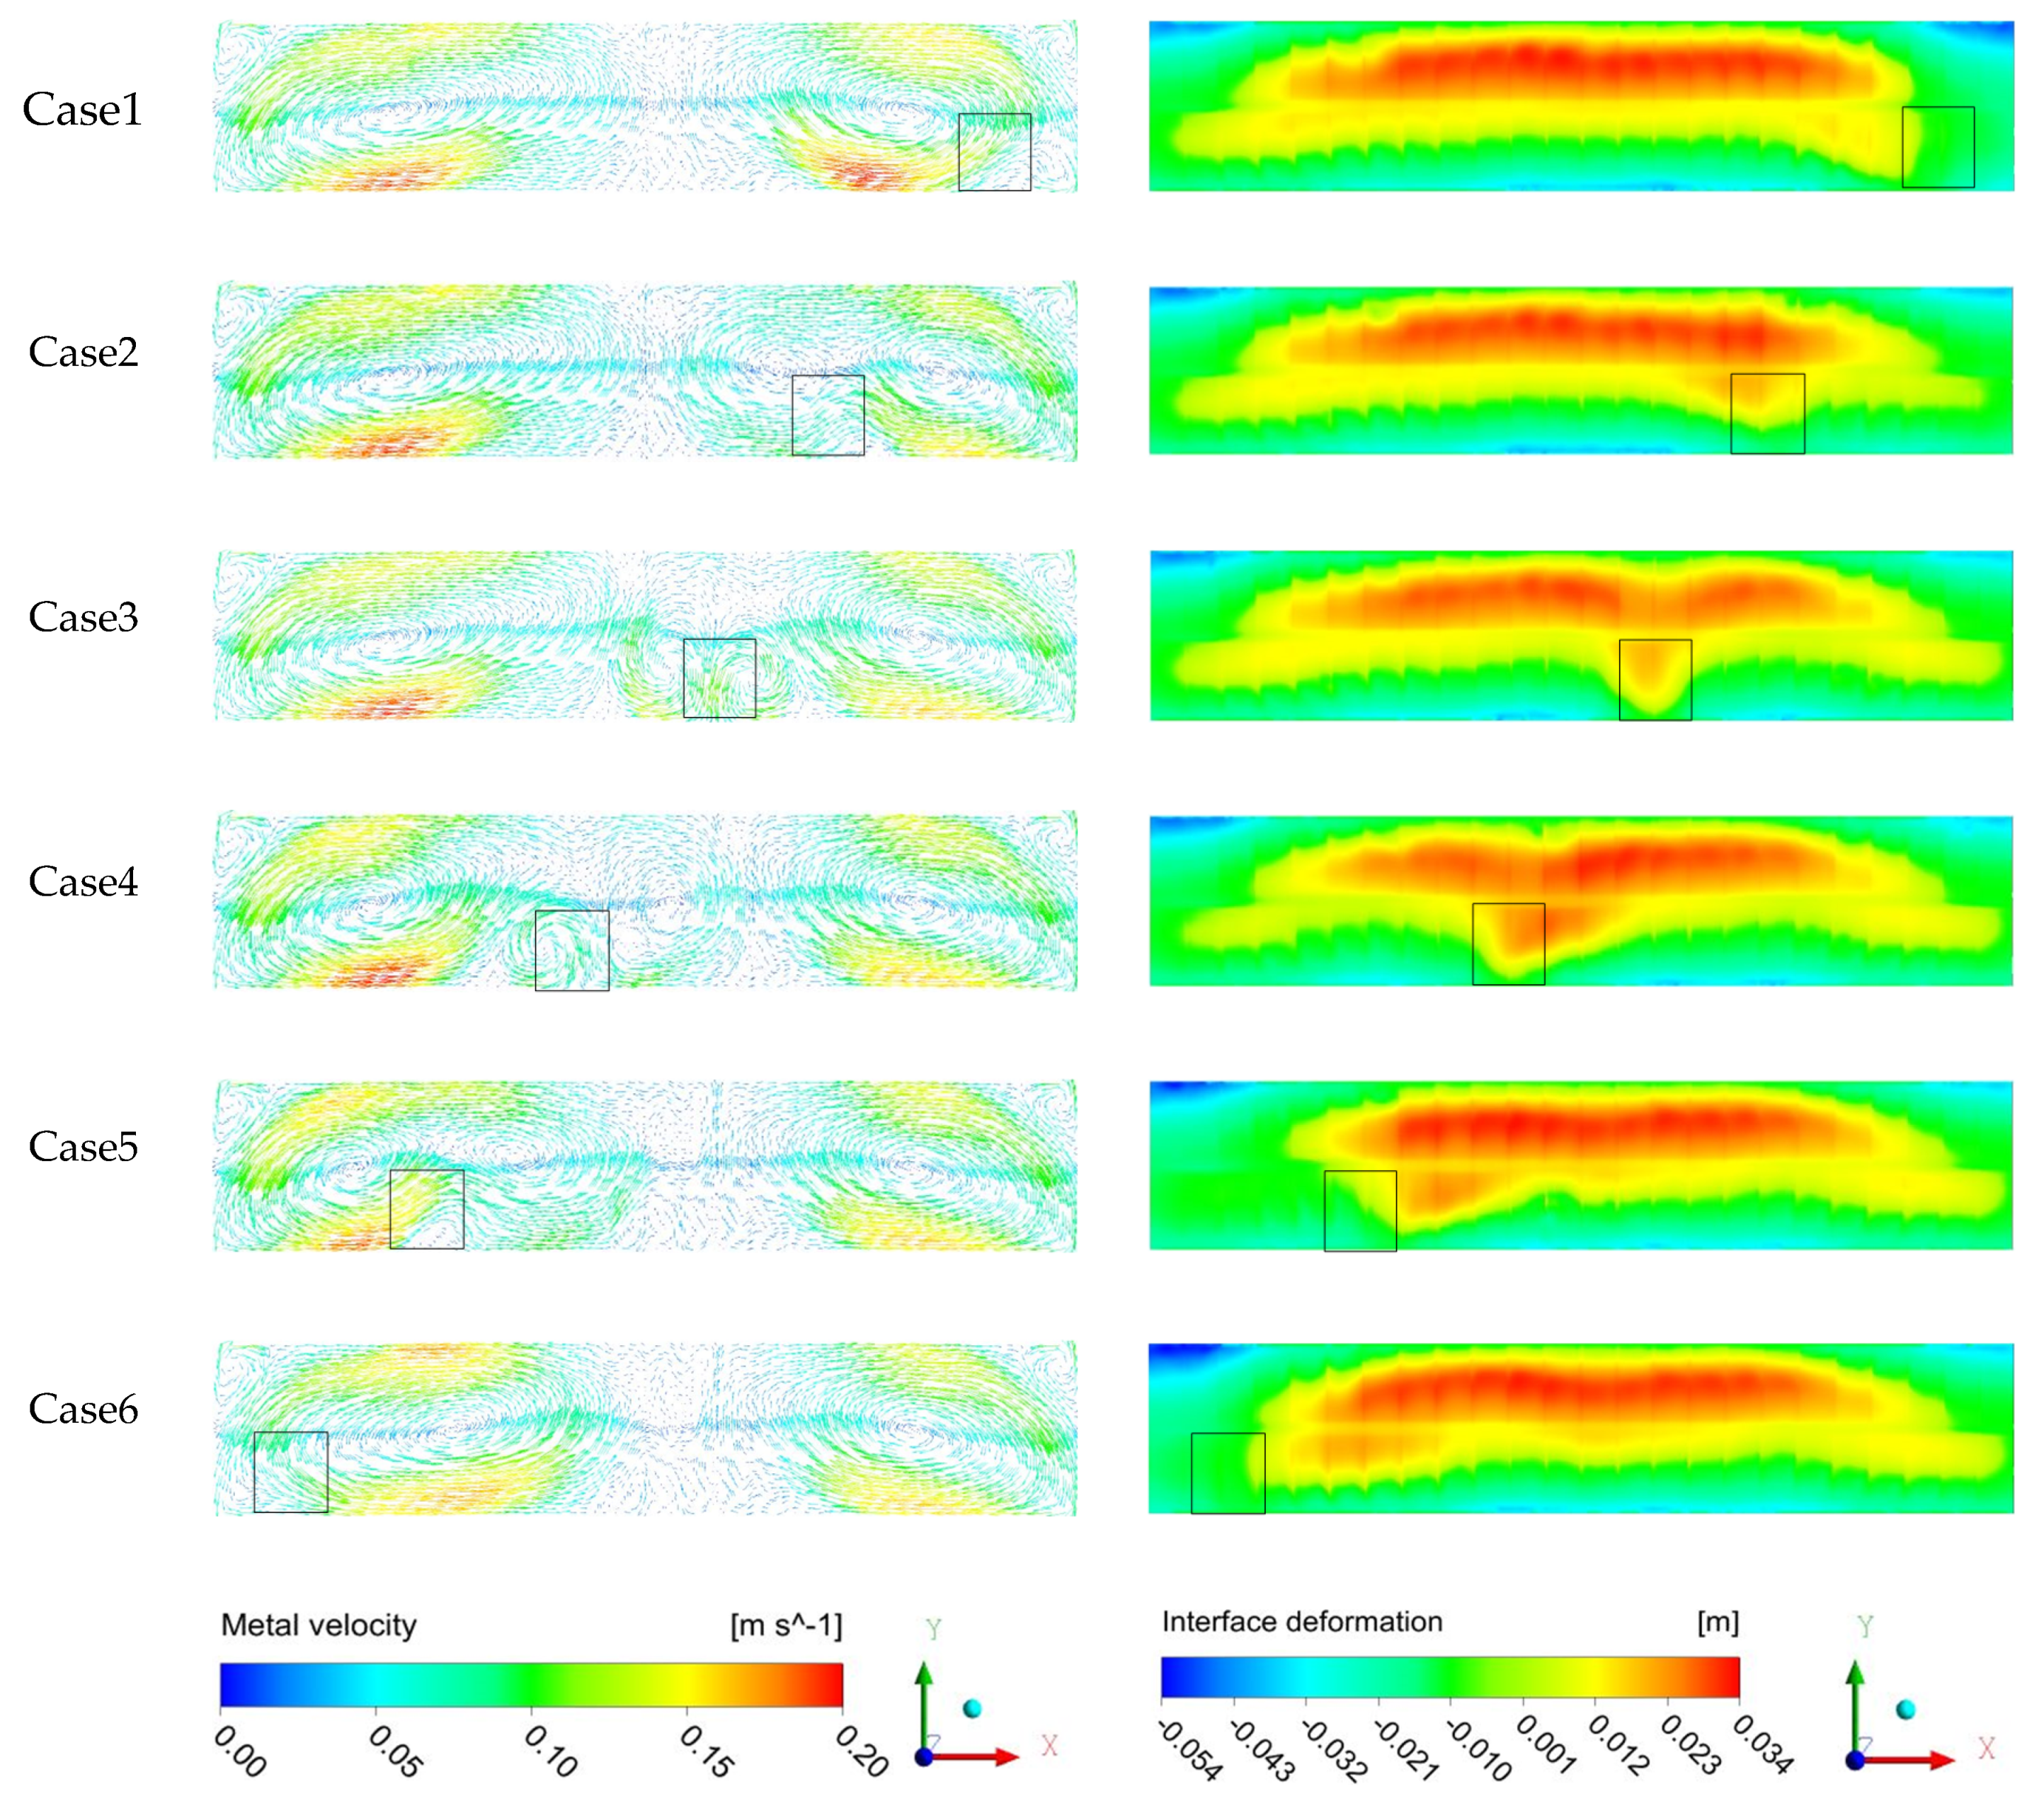
The LCEC could not affect the overall tendency of the melt flow field; however, it could change the amplitude of the local metal velocity and interface deformation to a certain extent. It is helpful to suppress the interface hump on original low ACD zone if cutting off cathode electric on A2A3 and A10A11, with ACD average improvement of 3% and 7.5%, respectively. However, this could deteriorate the interface stability if cutting off the cathode electric on A18A19 and A22A23, with the ACD average decreasing 4% and 3%, respectively. Thus, it would be better to choose different treatments if the excessive current of local cathodes exists in different positions. Meanwhile, the cathode flexes in abnormal positions should be partially cut off step by step, and the number of cathode flex cut-offs should be determined by simulation.
(3)
The quantitative evaluation of MHD stability under abnormal states has certain guiding significance for the safety operation and management of 500 kA potlines. Compared with the uniform distribution of cathode current, the differential distribution of cathode current design may help to suppress the interface deformation and improve ACD distribution for cells.

Author Contributions

F.W. has developed the model and written the manuscript. Q.Z., W.L. and Y.Y. have revised the manuscript. Z.W. has provided valuable guidance. All authors have read and agreed to the published version of the manuscript.

Funding

This research was funded by [National Natural Science Foundation of China] grant number [51434005, 51529401, 51874086], and [CHALCO Young Science and Technology Development Funds] grant number [2018MXJH13]. The APC was funded by [CHALCO Young Science and Technology Development Funds] grant number [2018MXJH13].

Conflicts of Interest

The authors declare no conflict of interest.

Abbreviations

LCECLocal cathode electrical cut-off
ACDAnode cathode distance
MHDMagnetohydrodynamics
VOFVolume of fluid
TETapping end
DEDuct end
PTMPot tending machine
bBath
mMetal

References

  1. Urata, N.; Arita, Y.; Ikeuchi, H. Magnetic field and flow pattern of liquid aluminum in the reduction cells. In Proceedings of the TMS Light Metals, New York, NY, USA, 23–27 February 1975; pp. 233–250. [Google Scholar]
  2. Mori, K.; Shiota, K.; Urata, N.; Ikeuchi, H. The surface oscillation of liquid metal in aluminum reduction cells. In Proceedings of the TMS Light Metals, Las Vegas, NV, USA, 22–26 February 1976; pp. 77–95. [Google Scholar]
  3. Arita, Y.; Ikeuchi, H. Numerical calculation of bath and metal convection patterns and their interface profile in reduction cells. In Proceedings of the TMS Light Metals, Chicago, IL, USA, 22–26 February 1981; pp. 357–371. [Google Scholar]
  4. Moreau, R.; Evans, J.W. Analysis of the hydrodynamics of aluminum reduction cells. J. Electrochem. Soc. 1984, 131, 2251–2259. [Google Scholar] [CrossRef]
  5. Moreau, R.; Evans, J.W. The Moreau-Evans hydrodynamic model applied to actual Hall-Héroult cells. Metall. Trans. B 1988, 19, 737–744. [Google Scholar] [CrossRef]
  6. Zikanov, O.; Thess, A.; Davidson, P.A.; Ziegler, D.P. A new approach to numerical simulation of melt flow and interface instability in hall-heroult cells. Metall. Mater. Trans. B 2000, 31, 1541–1550. [Google Scholar] [CrossRef]
  7. Tarapore, E.D. Magnetic fields in aluminum reduction cells and their influence on metal pad circulation. In Proceedings of the TMS Light Metals, New York, NY, USA, 18–22 February 1979; pp. 541–550. [Google Scholar]
  8. Potocnik, V.; Laroche, F. Comparison of measured and calculated metal pad velocities for different prebake cell designs. In Proceedings of the TMS Light Metals, New Orleans, LA, USA, 11–15 February 2001; pp. 419–425. [Google Scholar]
  9. Severo, D.S.; Gusberti, V.; Schneider, A.F.; Pinto, E.V.; Potocnik, V. Comparison of various methods for modeling the metal-bath interface. In Proceedings of the TMS Light Metals, New Orleans, LA, USA, 9–13 March 2008; pp. 413–418. [Google Scholar]
  10. Bojarevics, V.; Sira, S. MHD stability for irregular and disturbed aluminum reduction cells. In Proceedings of the TMS Light Metals, San Diego, CA, USA, 16–20 February 2014; pp. 685–690. [Google Scholar]
  11. Dupuis, M.; Bojarevics, V. Influence of the cathode surface geometry on the metal pad current density. In Proceedings of the TMS Light Metals, San Diego, CA, USA, 16–20 February 2014; pp. 479–484. [Google Scholar]
  12. Severo, D.S.; Schneider, A.F.; Pinto, E.C.V.; Gusberti, V.; Potocnik, V. Modeling magneto-hydrodynamics of aluminum electrolysis cells with ANSYS and CFX. In Proceedings of the TMS Light Metals, San Francisco, CA, USA, 13–17 February 2005; pp. 475–480. [Google Scholar]
  13. Zhou, P.; Mei, C.; Zhou, N.; Jiang, C.; Cai, Q. Comparison of three turbulent model predictions of metal flow in aluminum reduction cells and industrial measurements (in Chinese). Acta Metall. Sin. 2004, 1, 77–82. [Google Scholar]
  14. Liu, W.; Zhou, D.; Liu, Y.; Liu, M.; Yang, X. Simulation and measurements on the flow field of 600kA aluminum reduction pot. In Proceedings of the TMS Light Metals, Orlando, FL, USA, 15–19 March 2015; pp. 479–482. [Google Scholar]
  15. He, Z.; Xia, T.; Xiong, W.; Shen, Q.; Li, B. Mathematical models for the novel cathode convexes in a reduction cell. J. Metall. 2013, 2013. [Google Scholar] [CrossRef]
  16. Wang, Q.; Li, B.; He, Z.; Feng, N. Simulation of magnetohydrodynamic multiphase flow phenomena and interface fluctuation in aluminum electrolytic cell with innovative cathode. Metall. Mater. Trans. B 2014, 45, 272–294. [Google Scholar] [CrossRef]
  17. Hua, J.S.; Rudshaug, M.; Droste, C.; Jorgensen, R.; Giskeodegard, N. Numerical simulation of multiphase magnetohydrodynamic flow and deformation of electrolyte-metal interface in aluminum electrolysis cells. Metall. Mater. Trans. B 2018, 49, 1246–1266. [Google Scholar] [CrossRef]
  18. Song, Y.; Peng, J.; Di, Y.; Wang, Y.; Feng, N. The impact of cathode material and shape on current density in an aluminum electrolysis cell. JOM 2016, 68, 593–599. [Google Scholar] [CrossRef]
  19. Song, Y.; Peng, J.; Di, Y.; Wang, Y.; Feng, N. Performance of the cathodes with trapezoidal protrusions in aluminum electrolysis cells. JOM 2017, 69, 2844–2850. [Google Scholar] [CrossRef]
  20. Song, Y.; Peng, J.; Di, Y.; Wang, Y.; Feng, N. Metal flow performance in aluminum electrolytic cells with different side-wall types. Can. Metall. Q. 2018, 57, 253–261. [Google Scholar] [CrossRef]
  21. Dupuis, M. Modeling gravity waves in an aluminum reduction cell with OpernFOAM. In Proceedings of the TMS Light Metals, Nashville, TN, USA, 14–18 February 2016; pp. 909–914. [Google Scholar]
  22. Liu, W.; Zhou, D.; Zhao, Z.B. Progress in application of energy-saving measures in aluminum reduction cells. JOM 2019, 71, 2420–2429. [Google Scholar] [CrossRef]
  23. Bazhin, V.U.; Smol’nikov, A.D.; Petrov, P.A. Concept of energy efficiency aluminum production «ELECTROLYSIS 600+». Int. Res. J. 2016, 47, 37–40. [Google Scholar] [CrossRef]
  24. Rene, G.; Andre, C.; Olivier, M.; Bertrand, A.; Andre, M.; Francois, C. Preparation and start-up of ARVIDA smelter, AP60 technological center. In Proceedings of the TMS Light Metals, San Diego, CA, USA, 16–20 February 2014; pp. 797–801. [Google Scholar]
  25. Feng, Y.; Schwarz, M.P.; Yang, W.; Cooksey, M. Two-phase CFD model of the bubble-driven flow in the molten electrolyte layer of a hall-heroult aluminum cell. Metall. Mater. Trans. B 2015, 46, 1959–1981. [Google Scholar] [CrossRef]
  26. Bradley, B.F.; Dewing, E.W.; Rogers, J.N. Metal pad velocity measurements by the iron rod method. In Proceedings of the TMS Light Metals, New York, NY, USA, 24–28 February 1985; pp. 541–552. [Google Scholar]
Figure 1. Physical model of bath–metal two-phase flow in 500 kA cell. TE: Tapping End; DE: Duct End, Side A: Upstream of cell; Side B: Downstream of cell.
Metals 10 00110 g001
Figure 2. Metal flow field distribution of reference state (m/s).
Metals 10 00110 g002
Figure 3. Bath/metal interface deformation of reference state (m).
Metals 10 00110 g003
Figure 4. Interface deformation range distribution of reference state.
Metals 10 00110 g004
Figure 5. Metal velocity measure points position and flow direction.
Metals 10 00110 g005
Figure 6. Metal velocity comparison between simulation and measurement (m/s).
Metals 10 00110 g006
Figure 7. Comparison of interface deformation between simulation and measurement.
Metals 10 00110 g007
Figure 8. Two-phase flow field for six abnormal states of local cathode electrical cut-off (LCEC).
Metals 10 00110 g008
Figure 9. The anode cathode distance (ACD) changing ratios of side A for six abnormal states.
Metals 10 00110 g009
Figure 10. The ACD changing ratios of side B for six abnormal states.
Metals 10 00110 g010
Table 1. Material properties.
PhaseDensityViscosityConductivity
kg·m−3Pa·sS·m−1
Metal2.30 × 1031.18 × 10−34.17 × 10⁶
Bath2.13 × 1032.51 × 10−30.23 × 10³
Table 2. Comparison of two-phase flow field simulation for six abnormal cases of LCEC.
Case No.LocationMetal Velocity (m/s)Interface Deformation (m)
MaxAveMinMax
Case1A2A30.1950.071−0.0480.033
Case2A6A70.1910.067−0.0470.031
Case3A10A110.1960.073−0.0450.030
Case4A14A150.1980.069−0.0460.032
Case5A18A190.1860.069−0.0530.033
Case6A22A230.1750.068−0.0540.032

