Article

On the Influence of Ultrasonic Surface Mechanical Attrition Treatment (SMAT) on the Fatigue Behavior of the 304L Austenitic Stainless Steel

1
Laboratoire d’Etude des Microstructures et de Mécanique des Matériaux, Université de Lorraine, CNRS UMR 7239, 7 rue Félix Savart, 57073 Metz, France
2
LABoratoire d’EXcellence Design des Alliages Métalliques pour Allègement de Structures, Université de Lorraine, 7 rue Félix Savart, 57073 Metz, France
3
Institut Pprime, CNRS-ENSMA, Université de Poitiers, UPR CNRS 3346, Physics and Mechanics of Materials Department, ENSMA, Téléport 2, 1 Avenue Clément Ader, BP 40109, 86961 Futuroscope Chasseneuil CEDEX, France
4
Ecole de Technologie Supérieure de Montréal, 1100 Rue Notre-Dame Ouest, Montréal, QC H3C 1K3, Canada
*
Author to whom correspondence should be addressed.
Metals 2020, 10(1), 100; https://doi.org/10.3390/met10010100
Submission received: 25 November 2019 / Revised: 27 December 2019 / Accepted: 1 January 2020 / Published: 8 January 2020

Abstract

:
The potential of ultrasonic surface mechanical attrition treatment (SMAT) at different temperatures (including cryogenic) for improving the fatigue performance of 304L austenitic stainless steel is evaluated along with the effect of the fatigue loading conditions. Processing parameters such as the vibration amplitude, the size, and the material of the shot medias were fixed. Treatments of 20 min at room temperature and cryogenic temperature were compared to the untreated material by performing rotating–bending fatigue tests at 10 Hz. The fatigue limit was increased by approximately 30% for both peening temperatures. Meanwhile, samples treated for 60 min at room temperature were compared to the initial state in uniaxial fatigue tests performed at R = −1 (fully reversed tension–compression) at 10 Hz, and the fatigue limit enhancement was approximately 20%. In addition, the temperature measurements done during the tests revealed a negligible self-heating (∆t < 50 °C) of the run-out specimens, whereas, at high stress amplitudes, temperature changes as high as 300 °C were measured. SMAT was able to increase the stress range for which no significant local self-heating was reported on the surface.

1. Introduction

In the high cycle fatigue regime, cracks mostly nucleate at the surface of the loaded workpiece. Therefore, the surface or near-surface features such as surface roughness and residual stresses affect the fatigue life of a component. The surface roughness has an influence essentially at the crack initiation stage [1]. Indeed, the presence of surface irregularities leads to high local stresses, which may create a high amount of plastic deformation locally, eventually contributing to crack-type defect creation depending on the intrinsic behavior of the studied material. Furthermore, the presence of residual stresses may affect the crack propagation behavior [2]. While a tensile stress loading promotes crack opening and faster propagation, the introduction of compressive residual stresses can delay or stop crack propagation with the consequence of increasing the total fatigue life of mechanical components. In this context, plastic deformation treatments such as burnishing [3], laser shock-peening [4,5], or hammering [6,7] were used on stainless steels to delay early fatigue crack initiation and growth and increase part performance.
In addition, surface mechanical attrition treatment (SMAT) and ultrasonic shot peening (USP) were used to impart severe plastic deformation (SPD) at the surface of components. The effects of SMAT and similar kind of surface severe plastic deformation techniques on the surface and near-surface microstructure modifications and associated mechanical properties were reviewed in several papers [8,9,10,11,12]. It is noticeable that positive effects on the fatigue behavior were observed on different materials such as Fe- [13,14,15], Ti- [16], or Mg-based [17] alloys. In some cases, the use of these treatments pushed the initiation site underneath the peened surface, thus enhancing the fatigue limit significantly [18,19]. At the same time, the peening energy also strongly influences the treated surface roughness [20] and integrity, which can decrease the fatigue resistance of the components in spite of the nanostructured surface layer and higher compressive residual stresses [16,21,22].
The fatigue resistance of 316L austenitic stainless steels was enhanced by nearly 30% (from 300 to 380 MPa) due to the presence of a superficial refined microstructure delaying crack initiations and a high compressive residual stress impeding crack propagation [13].
The effect of SMAT treatments on the fatigue behavior of the 304L was investigated at room temperature (RT), as well as elevated temperature, by Kakiuchi et al. [23]; the shot-peened specimens exhibited higher fatigue strengths than the untreated ones at both RT and 300 °C. By decreasing or removing the surface topology induced by severe shot peening through a repeening or grinding process, the fatigue life of a shot peened low-alloyed steel can be further improved as shown in the work of Bagherifard et al. [20].
The idea of practicing cryogenic SMAT on 304L comes from the fact that some Fe–Ni–Cr austenitic stainless steels, such as 304L, are metastable and undergo stress- or strain-induced martensitic transformations through severe plastic deformation. Accordingly, the volume fraction of martensite in the SMAT samples increases at lower temperatures [24,25,26]. Although no definitive explanation was given for the influence of martensite (α’) prior to the cyclic loadings [27], its presence is usually reported to be beneficial regarding tensile strength [28]. Also, for a given SMAT processing condition, the use of cryogenic temperature was shown to decrease the surface roughness [25,26], a modification that may result in improved fatigue performance.
In this context, the present paper has two major goals: (i) to investigate the effect of lowering the SMAT temperature on the fatigue behavior of a 304L stainless steel, and (ii) to analyze differences that may exist between rotating–bending and fully reversed uniaxial tension–compression fatigue tests on a 304L stainless steel.

2. Materials and Methods

2.1. Sample Preparation and Surface Treatments

Prior to machining, the 304L cylindrical specimens were fully annealed at 900 °C for 40 min resulting in an average grain size of approximately 40 µm. The fatigue behavior was studied under rotating–bending (RB) and tension–compression (TC) tests. For RB, 6-mm-diameter samples with a gauge length of 25 mm were machined and ground in order to remove the grooves generated by the machining procedure. For TC, 9-mm-diameter samples with a gauge length of 12.5 mm were machined and then polished to a mirror finish. The SMAT was carried out using a machine developed by SONATS company (Carquefou, France) [29]. The samples were treated using a vibrating amplitude of 60 µm with ø2 mm 100Cr6 steel shots. For rotating–bending, the SMAT was carried out for 20 min at two temperatures: (i) at room temperature (RT), or (ii) under cryogenic conditions (CT) at about −100 °C. For tension–compression samples, SMAT was done for 60 min at room temperature.

2.2. Fatigue Tests

Samples were tested in two loading conditions, rotating–bending (RB) and tension-compression (TC). For RB, the fatigue behavior was studied with a loading frequency of 10 Hz and a load ratio of R = −1, in air, at room temperature using an R. R. Moore rotating–bending fatigue test bench (Instron, Norwood, MA, USA). The fatigue limit was estimated from the highest stress amplitude at which no failure occurred up to 106 cycles.
For TC, fully reversed tension–compression (R = −1) fatigue tests were carried out with a loading frequency of 10 Hz, in air, at room temperature on an 810 MTS (MTS systems, Eden Prairie, MN, USA) servo-hydraulic machine equipped with a dynamic loading cell with a maximum capacity of ±100 kN.

2.3. Sample Characterizations

The specimen surface aspect was observed using an LEXT OLS4000 confocal microscope (Olympus, Tokyo, Japan), and the Rq surface roughness parameter was measured using a Mitutoyo SJ-400 probe (Mitutoyo, Kawasaki, Japan). The surface and subsurface hardening states were analyzed on a cross-section using a microhardness test with a measurement step of 50 µm. Phase identification (γ austenite and α’ martensite) was done by EBSD (Electron Back-Scattered Diffraction) technique on specimen cross-sections in order to link the hardening state with the observed microstructural features.
On the RB samples, the surface residual stresses were evaluated using a Proto iXRD X-ray diffraction apparatus (PROTO Manufacturing Inc., Taylor, MI, USA), operating under a 20 kV tension and a 3 mA intensity, before cyclic loading, as well as after fatigue tests on the run-out samples. Two X-ray wavelengths were used to measure the residual stresses in each phase: (i) a chromium tube (Cr = 2.291 Å) for the {211} α’ martensite, and (ii) a manganese tube (Mn = 2.103 Å) for the {311} austenite. Residual stresses were calculated by the classical sin 2 ψ method [30].
On the TC samples, the surface residual stresses were evaluated with a Pulstec µ-X360 X-ray diffraction equipment (Pulstec, Hamamatsu, Japan) operating under a 30 kV tension and a 1.5 mA current. A chromium tube (Cr = 2.291 Å and Cr = 2.085 Å) was selected for the measurements, and the cos α method [30] was used for the calculation of residual stresses in both γ and α’ phases before and after fatigue tests.
In order to quantify the self-heating of the specimens during TC tests, a few samples were painted with black heat-resistant paint to allow a good emissivity, and their surface temperature was measured using an Infratech infrared camera (Infratech, Kennesaw, GA, USA).
Testing conditions and surface treatments used are summarized in Table 1.

3. Results

3.1. Surface Modifications

Several representative examples of the surface topology, as well as their respective measured roughness values, are displayed in Figure 1. Despite a low roughness resulting from the surface grinding (Rq = 0.32 µm), some machining grooves still remained visible on the surface of the RB_G samples (Figure 1a). These grooves were completely removed after 20 min of SMAT at RT (Figure 1b) but not completely for the cryogenic treatment (Figure 1c). Both types of peening conditions induced a considerable increase of the surface roughness (from 0.32 to 3.42 and 1.97 µm). However, SMAT for 20 min at CT significantly reduced the surface roughness compare to the SMAT for the same duration at RT; a reduction of 42% can be noticed (Figure 1c). This is consistent with previous studies [26], which showed that, as the material becomes harder at low temperature, the steel beads impacting the specimen surface generate less pronounced craters. The effect of SMAT is also visible for the TC specimens (Figure 1d,e). Due to mirror-finish polishing, the TC_P samples exhibited an extremely low roughness (Rq = 0.022 µm). The surface aspect of the SMAT for 60 min at RT sample (Figure 1e) was rather similar to the one obtained after 20 min (Figure 1b), except that the longer peening duration generated a reduction in roughness of about 50% (Rq = 1.755 µm).
The hardness values are plotted as a function of the depth for different samples in Figure 2. The horizontal black dotted line defines the initial hardness (210 HV). The SMAT treatment increased the surface and subsurface hardness for all treatment duration and temperature conditions; maximum hardness value was located near the treated surface followed by a gradual decrease toward the specimen core until it reached the initial material hardness. The profile of the curve for the cryogenic treatment had some specific characteristics. Compared to the 20 min room temperature treatment, the use of cryogenic temperature substantially increased the hardness along the first 200 µm, while the hardness was comparatively lower at higher depths. In addition, if the hardened depth is defined as the depth at which the initial hardness of the material is reached, one can see that this depth was 30% lower for the sample treated at CT than for the two other conditions.
The EBSD maps (Figure 2b) show that a large amount of martensite was formed in the CT specimen, whereas this phase is hardly detectable in the sample treated for 20 min at RT. The crossover between the hardness evolution curves (seen in Figure 2a) corresponds to the depth at which the martensitic phase transformation was triggered in the CT processed sample (i.e., about 200 µm below the surface).
It is also interesting to highlight the fact that increasing the RT treatment time from 20 to 60 min did not drastically modify the hardened depth (~500 µm) but increased the maximum subsurface hardness by approximately 20%. Ultimately, the same top surface hardness value as for the CT treatment (~550 HV) was achieved.

3.2. Fatigue Properties

The Wohler curves associated with the three conditions and both types of cyclic loadings are shown in Figure 3. After 106 cycles, if failure did not happen, the tests were considered to be run-out tests and a horizontal arrow is attached to them on the graph. Squares are used for rotating–bending, and circles denote tension–compression. Full symbols illustrate the untreated samples, whereas hollow symbols are used for room temperature SMAT and crossed hollow symbols are used for cryogenic treatments. Except for RB_20 min CT (due to the lack of data), the Stromeyer expression (1) [31] was chosen to fit the experimental results and the constants obtained are given in Table 2.
σ a = σ D + ( c N ) ( 1 m ) ,
where σ D is a value determined from the experimental data, c and m are fitting parameters, σ a is the stress amplitude, and N is the number of cycles. Nonlinear least squares curve-fitting following a Levenberg–Marquardt algorithm was used to determine c and m .
As can be seen in Figure 3, a similar trend was found between RB_G and TC_P, and, as reported in Table 2, the fatigue limits of the initial material were 250 MPa in rotating–bending and 205 MPa in tension–compression, representing a −18% difference. The effect of SMAT on the fatigue life of 304L was not the same depending on the considered fatigue life range; it is more pronounced in the high cycle fatigue regime than in the low cycle one. After SMAT, a rather high increase of the fatigue limits was obtained, the improvements being +28% in RB and +17% in TC. Even though the phases distributions, microstructures, hardness gradients, and residual stresses were different in RB_20 min RT and RB_20 min CT samples, their fatigue behavior was almost identical. Also, the obtained m parameter was significantly higher for the SMAT conditions compared to the initial states due to the smooth form of their S–N curves.

3.3. Surface Residual Stresses

The values of the axial surface residual stresses measured before and after fatigue tests (on non-broken specimens) are compared in Figure 4. The residual stress on the surface of the RB_G sample was approximately −400 MPa (compression) showing that, before SMAT, rather high compressive residual stresses were created by machining followed by grinding, as in the work of Velásquez et al. [32]. After SMAT, the magnitude of the compressive residual stresses was significantly enhanced. However, the temperature at which the SMAT was done only slightly increased the residual stresses, +10% for the γ austenite and +3% for α’ martensite, compared to the SMAT done at RT. It is interesting to note that higher residual stresses were reached in α’ martensite than in the γ austenite (approximately 200 MPa more in martensitic phase than in the austenitic one) which may be attributed to the difference in Young’s modulus of these two phases, as explained in the work of Spencer et al. [28].
For polished TC specimens, due to the fact that the first stages of polishing were similar to grinding in terms of removing the top surface layer, the measured compressive residual stress (−340 MPa) was almost as high as for the ground RB specimens, and no martensite was detected. For the TC sample treated by SMAT for 60 min, no austenite was found, and only the characteristic {211} plan of α’ martensite diffracted, which resulted in a measured residual stresses value of −920 MPa. The magnitude of the residual stresses was significantly higher after 60 min of RT SMAT (TC sample) than after 20 min (RB samples).
Concerning the residual stresses after rotating–bending fatigue, the comparison of the fine and spare textured bars in Figure 4 clearly indicates that the residual stress relaxation after fatigue loading was rather pronounced in the austenitic phase of the SMAT samples (30% and 60% for the RB_20 min RT and RB_20 min CT samples, respectively) but quite limited for the RB_G sample (only a few tens of MPa). The extent of the relaxation for the samples treated by SMAT at cryogenic temperature was much more pronounced than in the RT processed ones, and this applied to both phases. Indeed, for the RB_20 min CT sample, the relaxations were roughly twice those recorded for the RB_20 min RT sample. Decreases of −58% and −36% were measured, respectively, in the austenitic and martensitic phases for the RB_20 min CT, while they were only −28% and −18% for the RB_20 min RT condition.
For the tension–compression fatigue tests, a high relaxation of the residual stresses occurred in the austenitic phase of the polished sample (about −75%), and a diffraction peak of martensite was indexed after 2 × 10⁶ cycles at a stress amplitude of 207 MPa. For the sample treated at RT for 60 min, approximately half of the residual stress was relaxed in run-out tests, leading to a very similar measured value compared to the initial state run-out specimens.
Finally, a rather large error bar can be seen on the graph for the α’ martensite, formed during fatigue loading of TC_20 min RT. The reason is that the amount of martensite was low, and the number of diffracting planes was not high enough to ensure a good confidence on the residual stress measurement. All other measurements showed an acceptable error level.

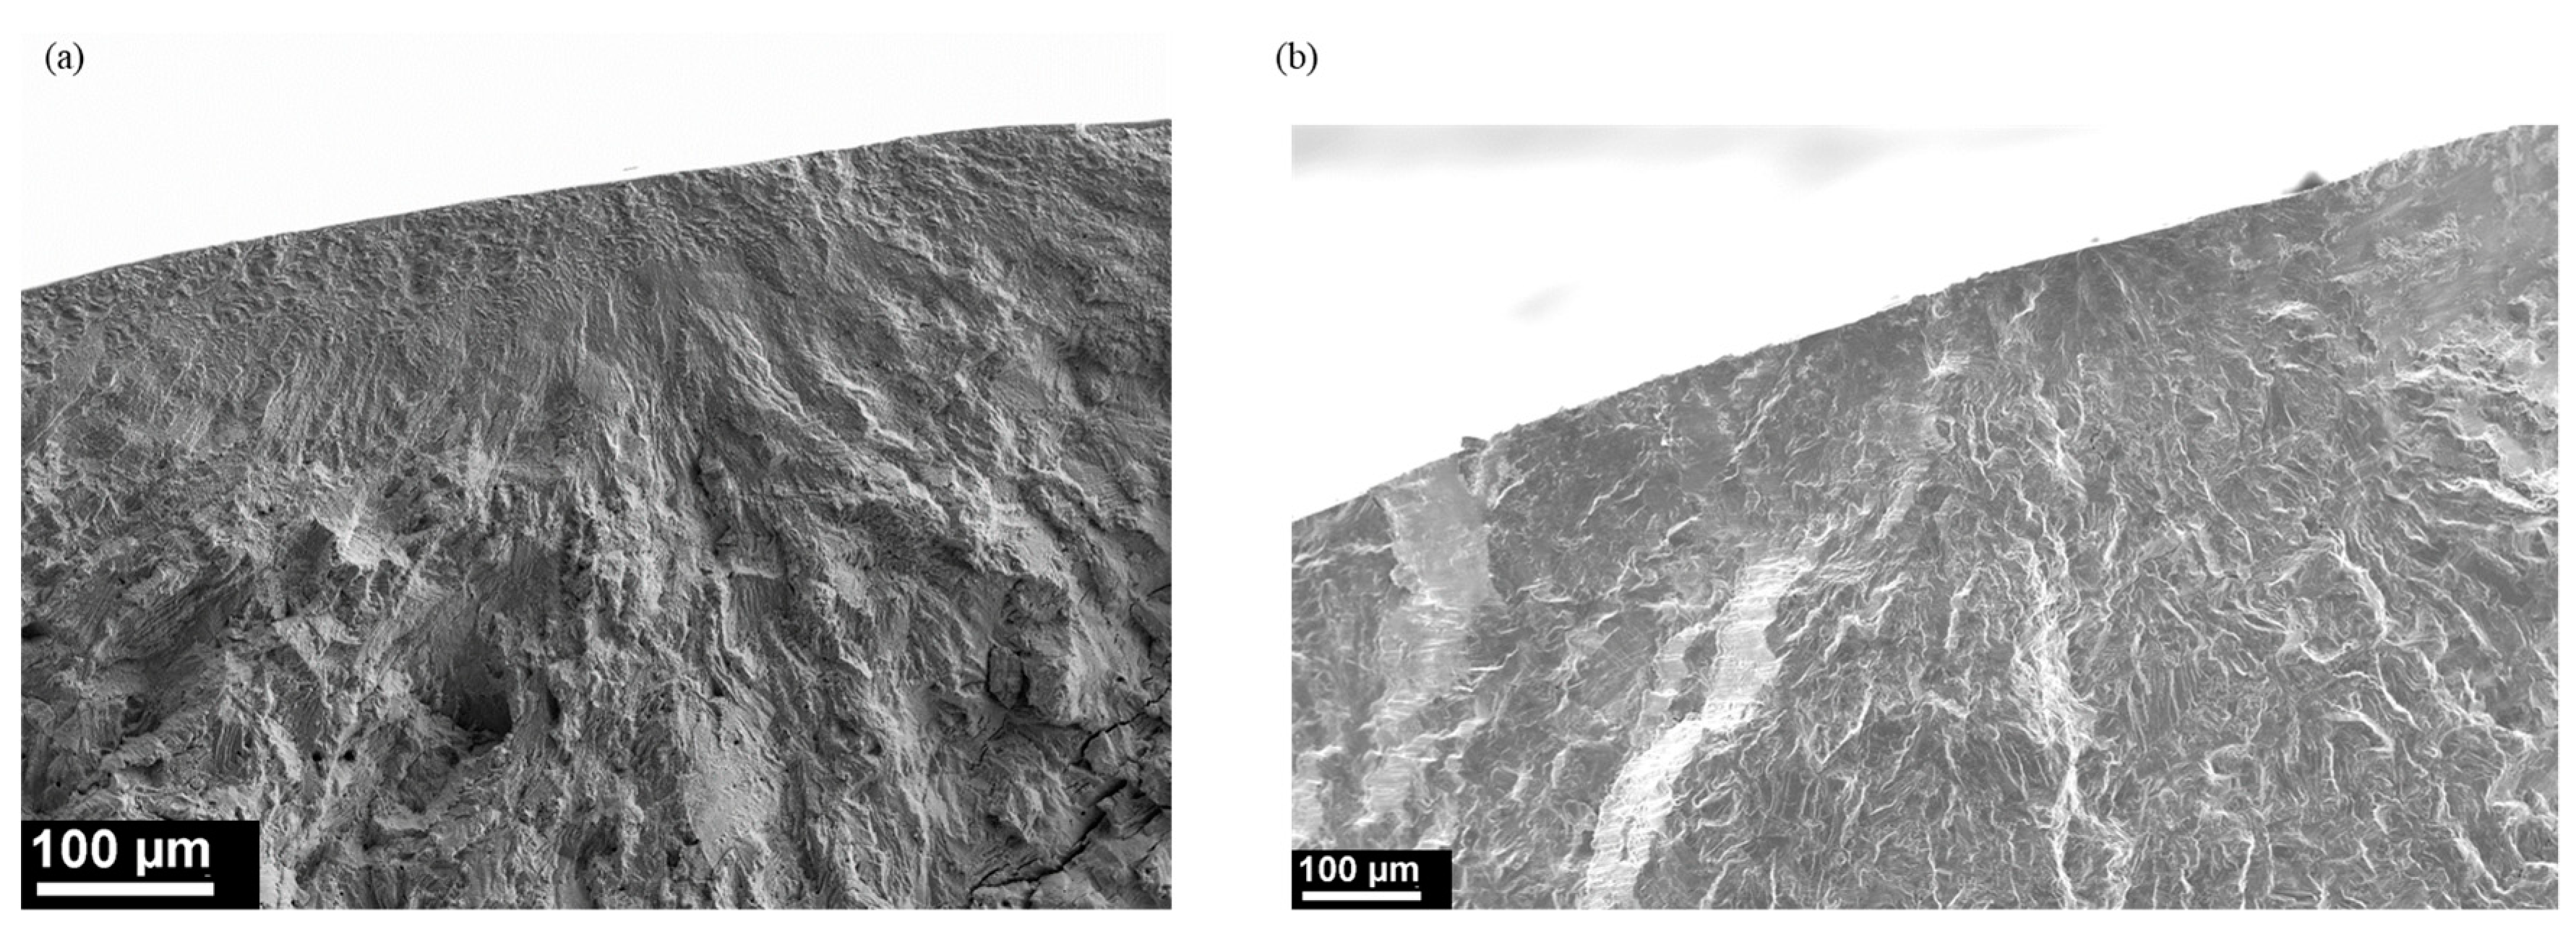
3.4. Fracture Surfaces

Fracture surfaces of different samples that underwent a similar number of cycles to failure (~5 × 10⁴ cycles) were investigated, and different initiation and propagation mechanisms were observed depending on the type of loading and surface treatment.
For instance, under rotating–bending, as shown in Figure 5a–c, all samples exhibited multiple crack initiation spots. These spots corresponded to surface initiation sites for all the tested conditions, and one example of the RB_20 min TC sample is displayed in Figure 6a. After initiation, these cracks could grow simultaneously, culminating in ductile fracture of the sample. This crack propagation behavior was the same for samples both with and without SMAT. Comparatively, under tension–compression loading, for the polished condition, not so many initiation spots were visible, and the main section reduction resulted from the propagation of a single crack (Figure 5d). After SMAT, the TC_60 min RT sample exhibited multiple initiation sites (Figure 5e), but only one main crack (initiation zone highlighted in red) propagated substantially into the core of the sample. It seems that this crack initiated at the surface (as shown in Figure 6b) and that, after a certain number of cycles, the crack propagation path changed between the SMAT-affected sub-surface and the core of the specimen, leading to a water drop-shaped zone on the fracture surface (Figure 5e). Higher-resolution fracture surface analyses are needed to gain a better insight into the crack propagation behavior in both the RB and TC samples, because it is more reasonable to address fatigue damage assessment by estimating fatigue crack growth rates.

3.5. Self-Heating

During cyclic loading, self-heating of the specimens may occur, depending on the stress amplitudes and strain rates imposed during each cycle, which may introduce a high amount of plastic deformation. The temperature measurements showed that the self-heating was homogeneous in the middle of the gage section of the run-out samples. For the broken samples; however, a localized and sharp increase of temperature was observed before the final breakdown. Typical chronograms from these measurements are plotted in Figure 7a, and a temperature variation of almost 50 °C can be observed before rupture (see red curve). The maximum homogeneous temperature values as a function of the applied stress were measured for samples tested in TC (see Figure 7b). The maximum surface temperature evolution with the applied stress amplitude followed an almost linear trend for both polished and 60 min of SMAT at RT conditions. In the fatigue limit stress range, the polished samples (~205 MPa) exhibited a maximum measured temperature of approximately 50 °C, whereas, for 60 min RT SMAT (~245 MPa), this value was higher than 100 °C. Nevertheless, the measured temperature values for the highest stress amplitudes were comparable: 320 °C for the initial state loaded at 260 MPa and 280 °C for the treated samples loaded at 275 MPa. After SMAT, in order to obtain the same level of self-heating, 15% higher stress amplitudes were required.

4. Discussion

Consistently with the results from the literature [13,15,23], the use of SMAT was found to be an efficient way to increase the fatigue resistance of the 304L stainless steel. Enhancements of 28% and 17% were observed in rotating–bending and tension–compression, respectively. Nevertheless, self-heating of the specimens during testing was not anticipated. The temperature evolutions with applied load presented in Figure 7b show almost linear trends with similar positive slopes for both polished and SMAT samples. In the case of the polished samples, a good accordance with the fatigue results obtained on 316 LN stainless steel by Tian et al. [33] can be noted, especially around 260 MPa where the number of cycles to failure and self-heating values were very similar. Also, for the low stress amplitudes related to the endurance limit, such as 200 MPa and 207 MPa, the maximum surface temperature measured during the fatigue tests was less than 70 °C, representing a self-heating that did not exceed 50 °C. After SMAT, the same level of self-heating required a 15% higher applied stress amplitude, confirming the difference of cyclic plastic strain accumulation between the SMAT and the untreated samples for the same applied stress amplitude. Indeed, the surface strain-hardening generated by SMAT pushed the onset of the plasticity at the surface to a higher stress range and delayed the generation of significant self-heating. Regarding the thermal exposure during the tests, the work of Kakuichi et al. [23] showed that the exposure to 300 °C during rotating–bending fatigue at high and low stress amplitudes does not relax the surface residual stresses of a 304L sample ultrasonic shot-peened at room temperature. This would mean that the observed self-heating mainly behaves as a mechanical property reducer and that the key factor governing the residual stress relaxation is the introduction of supplementary plastic strains.
Meanwhile, the presence and magnitude of residual stresses also play a role in RB and TC fatigue behavior and, as shown in Figure 4, different residual stresses values were measured before and after fatigue tests at the surface of specimens. Before fatigue, the different residual stress states are directly linked to the different studied conditions, whereas, after fatigue, relaxations depend on several testing parameters such as the type of loading or the applied stress amplitude. For example, it was shown in Figure 4 that the residual stress relaxation in austenite for the ground specimen after rotating–bending fatigue was only approximately −10% compared to −75% for the tension-compression testing condition. For the same level of stress amplitudes, due to the stress gradients during RB tests, plastic strains can mainly be introduced at the surface region of the specimen, whereas the whole volume of the TC sample can accommodate plastic strains during TC tests, resulting in more residual stress relaxation. The initial residual stresses can also favor the onset of plasticity, especially when significant compressive residual stresses are present in a part that is mechanically loaded at R = −1. The stress applied during the compressive stage of a fatigue test is added to the residual stress, reaching the material elastic limit at or below the surface, resulting in the relaxation of the residual stresses. Both elements can justify the specific behavior in the tension–compression testing condition. At this stage, the sequence of these different mechanisms is not known, as only surface residual stress relaxations were evaluated before and after the tests. Further investigations of the residual stress gradient evolution during fatigue loading are needed to better explain the behavior of the processed part during fatigue tests. Such an investigation will contribute to understanding when, how, and in which way the residual stress gradients relax during fatigue testing, finally providing a better idea of the role of the residual stresses in the fatigue behavior of 304L stainless steel treated by SMAT.
Concerning the comparison of untreated RB with untreated fully reversed (R = −1) TC fatigue tests, the gradient in the applied load within the specimens in RB is commonly used to explain a lower fatigue limit (approximately −10%) in TC [34]; however, in this study, a decrease of −18% of the fatigue limit was observed. The volume effect of the tested samples can be considered to explain this difference. Indeed, the samples tested in RB had a gauge of 6 mm in diameter and 25 mm in length, whereas the TC ones had a diameter of 9 mm with a length of 12.5 mm. Pogorestskii et al. [35] showed that, for 40Kh steel loaded in four-point rotating–bending, larger gauge length and diameter had a detrimental effect on the fatigue limit, and they defined two different coefficients: −0.18 MPa/mm for the length and −4.4 MPa/mm for the radius. If similar behavior can be considered for the 304L stainless steel, an increase of 3 mm in diameter and a decrease of 12.5 mm in length would result in an overall decrease of approximately 5 MPa for the RB fatigue limit. The difference in fatigue limit between RB and TC would consequently be reduced to −15%, which is very similar to the −14.9% or the −11.9% proposed by Palin-Luc et al. [36] on 30NCD16 and XC18 steels, respectively.
For the SMAT conditions, a decrease of approximately −25% of the fatigue limit in TC compared to the RB one was obtained in Table 2 (from 320 to 240 MPa). This difference was significantly larger than for the initial state and could be due to the difference in treatment duration and resulting microstructure and mechanical property gradients. Similarly to the work of Sun et al. [37], one can consider that, after SMAT, the obtained functionally grade material behaves like a composite material composed of a SMAT-affected layer and a bulk core. Considering that the mechanical properties are proportional to the hardness, and by using a simple mixing law, the fatigue limit enhancement by SMAT can be determined as follows:
E n h a n c e m e n t   [ % ] = ( f S M A T × H V S M A T + f b u l k × H V b u l k H V b u l k 1 ) × 100 ,
where f S M A T is the volume fraction of the SMAT-affected layer and H V S M A T is its mean hardness, where f b u l k = ( 1 f S M A T ) and H V b u l k = 210 (as shown in Figure 2a). The data used for the calculation and the obtained estimations are summarized in Table 3. The differences in diameter and hardened depth led to a higher fraction of SMAT-affected layer in the case of RB_20 min RT (16%) than the two other conditions (11.3% for RB_20 min CT and 11.8% for TC_60 min RT). Nevertheless, the difference of mean hardness in the SMAT layer resulted in similar fatigue limit estimations (~267 MPa) for both RB conditions and a lower value for TC (~220 MPa). The estimated fatigue limits were compared to the experimental ones, and the respective errors were calculated.
It is worth remembering that the effect of residual stresses and their variation during fatigue tests were not taken into account here. This approximation underestimates the fatigue limit enhancement by SMAT for all tested conditions. As shown in Table 3, the error of approximation was two-fold higher in RB than in TC. Even by considering the differences in sample geometry and hardening state resulting from the treatment conditions, a difference remains which can only be explained by the loading condition difference. An explanation can be that the most solicited area in RB is the SMAT-affected layer that has enhanced mechanical properties and is under significant compressive residual stress state. These facts suggest that the effect of SMAT would be more significant in RB.
In the case of rotating–bending, the use of cryogenic SMAT provided the same effect in terms of fatigue resistance as the SMAT at room temperature. Thus, despite potential beneficial modifications such as a lower roughness, a higher martensite fraction, and a slightly higher compressive residual stresses, the use of SMAT at cryogenic temperature did not bring the desired additional improvement. It is likely that the beneficial modifications induced by CT SMAT were counter-balanced by other factors linked to the sub-surface or to the surface modifications such as the lower hardness below 200 µm (see Figure 2a) compared to the room temperature treatment. Indeed, as shown in Table 3 for CT SMAT, the high surface hardness (~520 HV) together with the limited affected depth (~350 µm) led to a very similar estimation of the fatigue limit compared to the RT SMAT that was characterized by a lower surface hardness (~450 HV) and a significantly higher affected depth (~500 µm).

5. Conclusions

Different surface mechanical attrition treatments (SMAT) were used in order to investigate their effects on the fatigue behavior of a 304L austenitic stainless steel. The metastable nature of this stainless steel makes it a good candidate for cryogenic treatment. The focus was put on (i) the potential of cryogenic SMAT treatment, and (ii) the nature of the cyclic loading condition during fatigue tests.
  • The use of SMAT for 20 min at cryogenic temperature (CT) led to a lower roughness, a higher martensitic fraction, a higher surface hardness, and higher residual stresses in both phases (γ austenite and α’ martensite).
  • As tested in rotating–bending (RB), the use of SMAT at CT did not bring the expected potential additional improvement in terms of fatigue. Indeed, the fatigue life enhancement was approximately 30% for both cryogenic and room temperature (RT) SMAT compared to the initial ground state.
  • In tension–compression (TC), the use of SMAT at RT for 60 min on polished samples also led to an increase of approximately 20% of the fatigue limit compared to the initial state. However, the fatigue limit was found to be significantly smaller than the 20-min SMAT samples tested in RB (25% less), even if higher hardness and residual stress were reported after treatment. This could be due to more significant relaxations of the surface residual stresses coupled with sample size and SMAT-affected volume ratio effects.
  • The primary and secondary cracks were initiated at the surface of the samples, but the observed crack propagation profiles were different depending on the loading conditions.
  • A negligible homogeneous self-heating (∆t < 50 °C) of the specimens tested in tension-compression at low stress amplitudes was measured, whereas, at high stress amplitudes, much higher local temperature changes (∆t > 300 °C) were measured on the surface of the samples. The SMAT process was able to delay the onset of these local temperature increases to higher stress amplitude values (+10%).

Author Contributions

Conceptualization, M.A. and T.G.; methodology, M.A., P.B., Y.N. and T.G.; validation, C.D. and M.N.; formal analysis, M.A., P.B., Y.N. and T.G.; investigation, C.D. and M.N.; resources, M.A., P.B., Y.N. and T.G.; data curation, C.D. and M.N.; writing—original draft preparation, C.D. and M.N.; writing—review and editing, M.A., R.M., P.B., Y.N. and T.G.; supervision, M.A. and T.G.; funding acquisition, M.A., P.B., Y.N. and T.G. All authors have read and agreed to the published version of the manuscript.

Funding

This study was supported by the French State through the program “Investment in the future” operated by the National Research Agency (ANR), referenced by ANR-11-LABX-0008-01 (Labex DAMAS). M.N. was supported by a Canadian–French Frontenac scholarship during his stay in ETS-Montréal.

Conflicts of Interest

The authors declare no conflict of interest.

References

  1. Maiya, P.S.; Busch, D.E. Effect of surface roughness on low-cycle fatigue behavior of type 304 stainless steel. Metall. Trans. A 1975, 6, 1761. [Google Scholar] [CrossRef]
  2. Webster, G.A.; Ezeilo, A.N. Residual stress distributions and their influence on fatigue lifetimes. Int. J. Fatigue 2001, 23, 375–383. [Google Scholar] [CrossRef]
  3. Huang, H.W.; Wang, Z.B.; Lu, J.; Lu, K. Fatigue behaviors of AISI 316L stainless steel with a gradient nanostructured surface layer. Acta Mater. 2015, 87, 150–160. [Google Scholar] [CrossRef]
  4. Chen, G.; Gao, J.; Cui, Y.; Gao, H.; Guo, X.; Wu, S. Effects of strain rate on the low cycle fatigue behavior of AZ31B magnesium alloy processed by SMAT. J. Alloys Compd. 2018, 735, 536–546. [Google Scholar] [CrossRef]
  5. Nikitin, I.; Altenberger, I. Comparison of the fatigue behavior and residual stress stability of laser-shock peened and deep rolled austenitic stainless steel AISI 304 in the temperature range 25–600 °C. Mater. Sci. Eng. A 2007, 465, 176–182. [Google Scholar] [CrossRef]
  6. Yasuoka, M.; Wang, P.; Zhang, K.; Qiu, Z.; Kusaka, K.; Pyoun, Y.S.; Murakami, R.I. Improvement of the fatigue strength of SUS304 austenite stainless steel using ultrasonic nanocrystal surface modification. Surf. Coat. Technol. 2013, 218, 93–98. [Google Scholar] [CrossRef]
  7. Cherif, A.; Pyoun, Y.; Scholtes, B. Effects of ultrasonic nanocrystal surface modification (UNSM) on residual stress state and fatigue strength of AISI 304. J. Mater. Eng. Perform. 2010, 19, 282–286. [Google Scholar] [CrossRef]
  8. Bagheri, S.; Guagliano, M. Review of shot peening processes to obtain nanocrystalline surfaces in metal alloys. Surf. Eng. 2009, 25, 3–14. [Google Scholar] [CrossRef]
  9. Schulze, V. Characteristics of Surface Layers Produced by Shot Peening. In Proceedings of the Eighth International Conference on Shot Peening ICSP-8 in Garmisch-Partenkirchen DGM, Garmisch-Partenkirchen, Germany, 16–20 September 2002; pp. 145–160. [Google Scholar]
  10. Azadmanjiri, J.; Berndt, C.C.; Kapoor, A.; Wen, C. Development of surface nano-crystallization in alloys by surface mechanical attrition treatment (SMAT). Crit. Rev. Solid State Mater. Sci. 2015, 40, 164–181. [Google Scholar] [CrossRef]
  11. Grosdidier, T.; Novelli, M. Recent developments in the application of surface mechanical attrition treatments for improved gradient structures: Processing parameters and surface reactivity. Mater. Trans. 2019, 60, 1344–1355. [Google Scholar] [CrossRef] [Green Version]
  12. Bagherifard, S. Enhancing the structural performance of lightweight metals by shot peening. Adv. Eng. Mater. 2019, 21, 1801140. [Google Scholar] [CrossRef]
  13. Roland, T.; Retraint, D.; Lu, K.; Lu, J. Fatigue life improvement through surface nanostructuring of stainless steel by means of surface mechanical attrition treatment. Scr. Mater. 2006, 54, 1949–1954. [Google Scholar] [CrossRef]
  14. Uusitalo, J.; Karjalainen, L.P.; Retraint, D.; Palosaari, M. Fatigue properties of steels with ultrasonic attrition treated surface layers. In Materials Science Forum; Trans Tech Publications: Baech, Switzerland, 2009; Volume 604, pp. 239–248. [Google Scholar]
  15. Zhou, J.; Sun, Z.; Kanouté, P.; Retraint, D. Effect of surface mechanical attrition treatment on low cycle fatigue properties of an austenitic stainless steel. Int. J. Fatigue 2017, 103, 309–317. [Google Scholar] [CrossRef]
  16. Kumar, S.A.; Raman, S.G.S.; Narayanan, T.S. Influence of surface mechanical attrition treatment duration on fatigue lives of Ti–6Al–4V. Trans. Indian Inst. Met. 2014, 67, 137–141. [Google Scholar] [CrossRef]
  17. Nikitin, I.; Scholtes, B.; Maier, H.J.; Altenberger, I. High temperature fatigue behavior and residual stress stability of laser-shock peened and deep rolled austenitic steel AISI 304. Scr. Mater. 2004, 50, 1345–1350. [Google Scholar] [CrossRef]
  18. Torres, M.A.S.; Voorwald, H.J.C. An evaluation of shot peening, residual stress and stress relaxation on the fatigue life of AISI 4340 steel. Int. J. Fatigue 2002, 24, 877–886. [Google Scholar] [CrossRef]
  19. Masaki, K.; Ochi, Y.; Matsumura, T. Initiation and propagation behaviour of fatigue cracks in hard-shot peened Type 316L steel in high cycle fatigue. Fatigue Fract. Eng. Mater. Struct. 2004, 27, 1137–1145. [Google Scholar] [CrossRef]
  20. Bagherifard, S.; Guagliano, M. Fatigue behavior of a low-alloy steel with nanostructured surface obtained by severe shot peening. Eng. Fract. Mech. 2012, 81, 56–68. [Google Scholar] [CrossRef]
  21. Tian, J.W.; Villegas, J.C.; Yuan, W.; Fielden, D.; Shaw, L.; Liaw, P.K.; Klarstrom, D.L. A study of the effect of nanostructured surface layers on the fatigue behaviors of a C-2000 superalloy. Mater. Sci. Eng. A 2007, 468, 164–170. [Google Scholar] [CrossRef]
  22. Pandey, V.; Chattopadhyay, K.; Srinivas, N.S.; Singh, V. Role of ultrasonic shot peening on low cycle fatigue behavior of 7075 aluminium alloy. Int. J. Fatigue 2017, 103, 426–435. [Google Scholar] [CrossRef]
  23. Kakiuchi, T.; Uematsu, Y.; Hasegawa, N.; Kondoh, E. Effect of ultrasonic shot peening on high cycle fatigue behavior in type 304 stainless steel at elevated temperature. J. Soc. Mater. Sci. 2016, 65, 325–330. [Google Scholar] [CrossRef] [Green Version]
  24. Olson, G.B.; Cohen, M. A mechanism for the strain-induced nucleation of martensitic transformations. J. Less-Common Met. 1972, 28, 107–118. [Google Scholar] [CrossRef]
  25. Novelli, M.; Fundenberger, J.J.; Bocher, P.; Grosdidier, T. On the effectiveness of surface severe plastic deformation by shot peening at cryogenic temperature. Appl. Surf. Sci. 2016, 389, 1169–1174. [Google Scholar] [CrossRef]
  26. Novelli, M.; Bocher, P.; Grosdidier, T. Effect of cryogenic temperatures and processing parameters on gradient-structure of a stainless steel treated by ultrasonic surface mechanical attrition treatment. Mater. Charact. 2018, 139, 197–207. [Google Scholar] [CrossRef]
  27. Topic, M.; Tait, R.B.; Allen, C. The fatigue behaviour of metastable (AISI-304) austenitic stainless steel wires. Int. J. Fatigue 2007, 29, 656–665. [Google Scholar] [CrossRef]
  28. Spencer, K.; Embury, J.D.; Conlon, K.T.; Véron, M.; Bréchet, Y. Strengthening via the formation of strain-induced martensite in stainless steels. Mater. Sci. Eng. A 2004, 387, 873–881. [Google Scholar] [CrossRef]
  29. Sonats’ Company Website. Available online: https://sonats-et.com/ (accessed on 25 November 2019).
  30. Delbergue, D.; Texier, D.; Levesque, M.; Bocher, P. Comparison of two X-ray residual stress measurement methods: Sin2 ψ and cos α, through the determination of a martensitic steel X-ray elastic constant. In Proceedings of the 10th International Conference on Residual Stresses (ICRS10), Sydney, Australia, 3–7 July 2016. [Google Scholar]
  31. Stromeyer, C.E. The determination of fatigue limits under alternating stress conditions. Proc. R. Soc. Lond. 1914, 90, 411–425. [Google Scholar] [CrossRef]
  32. Velásquez, J.P.; Tidu, A.; Bolle, B.; Chevrier, P.; Fundenberger, J.J. Sub-surface and surface analysis of high speed machined Ti–6Al–4V alloy. Mater. Sci. Eng. A 2010, 527, 2572–2578. [Google Scholar] [CrossRef]
  33. Tian, H.; Liaw, P.K.; Fielden, D.E.; Brooks, C.R.; Brotherton, M.D.; Jiang, L.; Mansur, L.K. Effects of frequency on fatigue behavior of type 316 low-carbon, nitrogen-added stainless steel in air and mercury for the spallation neutron source. Metall. Mater. Trans. A 2006, 37, 163–173. [Google Scholar] [CrossRef]
  34. Papadopoulos, I.V.; Panoskaltsis, V.P. Invariant formulation of a gradient dependent multiaxial high-cycle fatigue criterion. Eng. Fract. Mech. 1996, 55, 513–528. [Google Scholar] [CrossRef]
  35. Pogoretskii, R.G. Effect of test piece length on the fatigue strength of steel in air. Mater. Sci. 1966, 1, 63–66. [Google Scholar] [CrossRef]
  36. Palin-Luc, T.; Lasserre, S. An energy based criterion for high cycle multiaxial fatigue. Eur. J. Mech. A Solids 1998, 17, 237–251. [Google Scholar] [CrossRef] [Green Version]
  37. Sun, Z.; Chemkhi, M.; Kanoute, P.; Retraint, D. Fatigue properties of a biomedical 316L steel processed by surface mechanical attrition. IOP Conf. Ser. Mater. Sci. Eng. 2004, 63, 012021. [Google Scholar] [CrossRef] [Green Version]
Figure 1. Observation of the lateral surface of cylindrical samples with their corresponding Rq roughness values: (a) ground condition, (b) after surface mechanical attrition treatment (SMAT) for 20 min at room temperature, (c) after SMAT for 20 min in cryogenic condition and (d) polished condition, and (e) after SMAT for 60 min at room temperature.
Metals 10 00100 g001
Figure 2. (a) Hardness measurements done on a cross-section of the (i) rotating–bending (RB) specimens treated at room temperature (RT; red) and under cryogenic conditions (CT; blue), and (ii) tension–compression (TC) specimens tested at RT (orange) (0 µm corresponds to the outer surface of the sample). (b) Corresponding EBSD band contrast maps with α’ martensite distributions.
Metals 10 00100 g002
Figure 3. S–N curves obtained at 10 Hz for (i) RB_G (filled black squares), RB_20 min RT (hollow red squares), and RB_20 min CT (crossed hollow blue squares) treated specimens, and for (ii) TC_P (filled gray circles) and TC_60 min RT (hollow orange circles) samples.
Metals 10 00100 g003
Figure 4. Measured residual stresses in the longitudinal direction on the sample surfaces done by X-ray diffraction. Different colors and textures were used to illustrate austenite or martensite and pre- or post-cycled measurements.
Metals 10 00100 g004
Figure 5. Typical fracture surfaces of (a) ground sample tested in rotating–bending, (b) sample tested in rotating–bending after 20 min of SMAT at room temperature, (c) sample tested in rotating–bending after 20 min of cryogenic SMAT, (d) polished samples tested in tension–compression, and (e) sample tested in tension–compression after 60 min of SMAT at room temperature.
Metals 10 00100 g005
Figure 6. Secondary electron SEM pictures of surface initiation sites of (a) sample tested in rotating–bending after 20 min of cryogenic SMAT (corresponding to Figure 5c), and (b) sample tested in tension–compression after 60 min of SMAT at room temperature (corresponding to Figure 5e).
Metals 10 00100 g006
Figure 7. (a) Typical self-heating chronograms measured during TC loading, for breaking samples (in red) and run-out samples (in blue). (b) Maximum stabilized temperature as a function of σa.
Metals 10 00100 g007
Table 1. Summary of all testing and surface treatment conditions with their associated designations. SMAT—surface mechanical attrition treatment.
Testing ConditionRotating–Bending, Air, Room Temperature, 10 Hz, R = −1 (RB)Tension–Compression, Air, Room Temperature, 10 Hz, R = −1 (TC)
Surface Treatment ConditionGround
(G)
SMAT for 20 min at room temperature
(20 min RT)
SMAT for 20 min at cryogenic temperature
(20 min CT)
Polished
(mirror finish)
(P)
SMAT for 60 min at room temperature
(60 min RT)
Fatigue Sample’s NameRB_GRB_20 min RTRB_20 min CTTC_PTC_60 min RT
Table 2. Estimated fatigue limits and fitted constants c and m of Stromeyer expression (1).
Testing ConditionσD (MPa)cm
RB_G2501.360 × 1061.231
RB_20 min RT3202.225 × 1072.060
RB_20 min CT320--
TC_P2058.756 × 1051.218
TC_60 min RT2402.208 × 1061.715
Table 3. Different SMAT conditions with their respective affected volume fraction, mean hardness, and corresponding measured and estimated fatigue limits.
Testing ConditionSample’s Diameter (mm)SMAT Affected Depth (mm)fSMAT
(%)
HVSMAT
(HV)
Estimated
σD (MPa)
Measured
σD (MPa)
Error
(%)
RB_20 min RT60.516298.7266.9320−16.6
RB_20 min CT60.3511.3345.3268.2320−16.2
TC_60 min RT90.5511.8330.8219240−8.8

