1. Introduction
The welfare state enjoys high popularity in European countries, and public opinion is commonly seen to oppose welfare cuts [
1,
2]. At the same time, tax increases are usually very unpopular [
3,
4,
5,
6]. Such a combination of attitudes—sometimes referred to as a something for nothing paradox [
7,
8]—considerably restricts policy makers’ leeway to enact reforms and react to increasing reform pressures. Public opinion is often portrayed as a veto player, blocking any reform attempts [
9]. It is somewhat surprising though that retrenchment took place [
10] and that we have seen recalibration and reforms even in areas of the welfare state that enjoy the highest popularity, such as pensions [
11].
One possible explanation for why reforms are possible are trade-offs between policy areas, i.e., welfare priorities, or also reform packages, which might be supported even if respondents do not support every aspect of it (for other explanations, such as blame avoidance strategies, for example, see [
12,
13]). Support for the welfare state, and, hence, also opposition to retrenchment, might be considerably lower if people are made aware of the costs associated with more welfare state spending [
3,
7,
14]. Moreover, respondents might be willing to accept retrenchment in one area of the welfare state if they have a strong priority to expand spending in other areas of the welfare state [
14]). A higher retirement age might be acceptable if this ensures that pension benefit levels remain stable [
15]. In this paper, we add to these recent trends in welfare attitudes research and explore whether people engage in trade-offs between welfare state spending and redistribution on the one hand and tax increases on the other. Is support for the welfare state and support for redistribution lower if respondents are made aware of the costs and possible tax increases that are related to more welfare state spending?
Using data from a series of survey experiments in the German Internet Panel, we analyse individual spending preferences for different areas of the welfare state and individual support for redistribution. Relying on a survey experiment allows us to raise respondents’ awareness of tax increases if they decide to increase spending or want more redistribution. We find important differences in the effect of tax constraints on attitudes between areas of the welfare state. In line with previous research, tax constraints (i.e., priced items) lead to lower average support for unemployment benefits and lower support for redistribution. In contrast, tax constraints did not affect the high support for more governmental spending on pensions, healthcare, and long-term care. This pattern supports expectations that taxes for economically and socially concentrated benefits are protested most, whereas taxes that confer rather universal entitlement to benefits are protested least [
6]. Finally, we consider whether the effect of tax constraints varies with pre-existing political attitudes or with individual material circumstances. We find little evidence that a pre-existing critical stance on taxes makes respondents more responsive to tax constraints as left and right leaning respondents do not differ in their reaction to the tax treatment. However, we find some support for the expectation that potential beneficiaries and the economically vulnerable who are less likely to pay taxes are less responsive to the tax constraint and maintain their high support despite its costs.
Our contribution here is twofold. First, we add to recent contributions in welfare attitudes research, which has focused on trade-offs between attitudes towards social investment and education, by extending this line of research to other areas of the welfare state, such as pensions and healthcare, and by also examining more general redistribution preferences. Our results clearly show that tax constraints do not have a homogeneous effect on attitudes across different areas of the welfare state and that, in particular, more universal programs, such as pensions or healthcare, are not affected by these tax constraints. Second, we re-emphasize a long-standing claim in the literature that attitudes towards the welfare state are not independent of attitudes towards taxation [
16,
17,
18], and that our understanding of public attitudes might considerably benefit from combining these different strands of the literature (see also [
3,
7]).
2. Theory and Hypothesis
Substantial research on public opinion shows that survey respondents tend to express high degrees of support both for more social spending and for lower taxes when not confronted with potential tradeoffs [
3,
7,
8,
16,
17,
18]. This observation is usually called the “More for Less” or the “Something for Nothing” paradox, and research has attributed these inconsistent attitudes to individuals’ bounded rationality and knowledge and to respondents’ fiscal illusion, i.e., that they are unable to estimate the true costs of the tax and welfare system [
8,
17]. More recent contributions have raised our awareness that such attitudes could also be interpreted as purely rational and that it is the basic idea of free-riding that people want to benefit from a public good, but not to pay for it [
7]. As to the consequences of an increasing awareness for taxes on attitudes, both approaches yield the same expectation. A survey item that asks about increased spending on different social policy programs or for support for redistribution without mention of the policy’s potential cost is likely to yield a higher level of support that the policy would obtain if some costly tradeoff was explicitly mentioned.
Hypothesis 1. Individual support for increasing spending in different areas of the welfare state and support for redistribution drops once trade-offs between the respective policy and tax increases are explicitly acknowledged.
Existing empirical studies support this expectation. On average, support for educational spending [
14] and for day care or libraries [
8], but also for families and social assistance [
7], goes down if respondents are made aware about the costs of increased spending. Nevertheless, we lack studies that also cover other areas of the welfare state where it might be less likely to observe changes in support due to tax constraints. For example, Barnes’ [
3] results suggest that respondents are well aware of the costs of health care and pensions, and only finds delinking of tax and spending preferences for unemployment benefits. In this paper, we argue that it is important to distinguish between different areas of the welfare state and, more importantly, we argue that the effect of tax constraints on attitudes is likely to vary between areas of the welfare state. If benefits of a policy are likely to be concentrated on a comparable few users, and some people might not expect to be a beneficiary of this policy at all, opposition against taxes for these economically and socially concentrated benefits should be strongest. In contrast, if a policy program confers rather universal entitlement to benefits, many people expect to benefit from the program at some point during their life course and deservingness of the recipients is high, tax constraints should have little effect on support for these programs [
6]. Hence, we expect:
Hypothesis 2. Tax constraints lead to lower average support for spending on policies that provide concentrated benefits (such as unemployment benefits of redistribution), but do not affect support for policies that provide rather universal benefit entitlement, such as pensions, healthcare, or long-term care.
In addition to the differences in support between areas of the welfare state, welfare attitudes have been concerned with the individual determinants of spending and redistribution preferences. The literature usually distinguishes two main motives to support the welfare state, self-interest and values. Explanatory power of these constructs seems to be surprisingly weak though. Indicators of self-interest and values usually explain only between 3 percent and 10 percent of the individual variance in individual attitudes towards the welfare state. Moreover, differences in support for the welfare state, between, for example, the net payers and the net receivers of welfare, are surprisingly weak [
19], and also partisan differences on the issue are sometimes less strong than one would expect. Some authors argue that priced items lead to more considerate and accurate measurement of attitudes, which better reflect respondents’ self-interest, but also their partisan agreement [
20]. We focus here on two social or political groups that have gained the most attention in the literature and seem to have the highest relevance for the political economy of reforms: Political ideology and income.
First, we expect that political ideology moderates the effect that tax constraints have on attitudes. When people receive information that is at odds with their pre-existing attitude, their political predisposition, they are supposed to engage in ‘motivated reasoning’: They seek out information that confirms prior attitudes, view evidence consistent with prior opinions as stronger, and spend more time counter-arguing and even dismissing evidence inconsistent with their opinion, regardless of objective accuracy [
21]. Hence, the increased salience of the costs of the welfare state and the anticipation of tax increases should have a particularly strong effect on right-leaning respondents who tend to be much more opposed to high taxes than left-leaning respondents are. Providing information on the tax consequences of increased welfare state spending might provide them with a justification to reduce support for the welfare state and redistribution.
Hypothesis 3. The effect of tax constraints on welfare state attitudes is stronger for right-leaning people than for people with a centre or left-leaning political ideology.
The standard approach to explain support for the welfare state and for redistribution preferences relies on self-interest as the main explanatory determinant: Those that benefit from the welfare state and redistribution will support it, whereas those that pay more in taxes and contributions than they receive in benefits oppose more spending on welfare and redistribution. Accordingly, one’s relative income position is key in shaping individuals’ preferences. The empirical evidence for an income gradient in welfare state and redistribution preferences is surprisingly weak and the conflict between the rich and the poor over the distribution of income and wealth within society is not as strong as theoretical arguments would suggest [
22,
23,
24,
25,
26]. Research has extended the basic model of preference formation to explain the mismatch between theory and evidence. Expectations about social mobility and risk perceptions have been added to the utility function of actors, and other regarding preferences, like altruism and inequality aversion, also shape individual support for redistribution. In this paper, we explore another possible reason and argue that attitudes might be much more accurate and in line with theoretical expectations if the costs of redistribution and welfare policies are acknowledged. More specifically, we expect that the strong support for redistribution and the welfare state among the rich would be particularly reduced if tax constraints are mentioned before respondents state their preference. In contrast, poor respondents should be much less affected by these tax constraints as they usually pay much less taxes.
Hypothesis 4. The effect of tax constraints on welfare state attitudes and support for redistribution is stronger for those with a high income as the rich are most likely to pay the main part of additional taxes.
3. Materials and Methods
This paper relies on data from the German Internet Panel (GIP). The GIP is based on bi-monthly online surveys of a random probability sample of the German population aged 16 to 75. Recruitment was conducted offline with face-to-face interviews. Respondents without computer or internet access were provided with the necessary equipment and training. The response rate in the first waves of the GIP was 42.1%. A study description and more detailed analyses on the representativeness of the GIP can be found in Blom et al. [
27].
We use five different items, which measure support for redistribution and support for more or less welfare state spending. These items are standard questions from international comparative surveys and we rely on the respective wording. The items have been part of different waves of the GIP, resulting in varying case numbers and years of the survey (see
Table 1 for question wording, year of the survey, and number of observations). Respondents could state their attitude towards these items on a 5-Point scale, ranging from ‘spend much less’ to ‘spend much more’, for the four spending items, and on a 5-Point agree-disagree scale, ranging from ‘disagree strongly’ to ‘agree strongly’, for the redistribution item.
The experimental treatment, which we use to prime tax concerns, consists of a reminder that says that respondents should remember that, if they prefer more spending, it might require a tax increase to pay for it. In the redistribution question, respondents are reminded that, if they support measures to reduce differences in income levels, these measures might require a tax increase (for a similar design see [
7,
17]). Such priced items are the standard way to capture spending preferences (for example, in the ISSP), but other items, such as support for redistribution or support for the government’s responsibility, are usually asked unpriced or unconstrained (see also [
3]). Respondents were randomly assigned to answer either the priced or the unpriced survey question. In
Appendix A (
Table A1) we provide balance checks, which suggest that randomization has worked as expected.
Whereas the main part of our analysis will rely on simple comparisons of the differences in average support between the treatment and control group, we are also interested in whether social groups react differently to our treatment. We argued that income, as a proxy for self-interest, and political ideology, as an indicator for the values perspective, are the most relevant moderators in this respect. We use self-reported personal monthly income and distinguish between respondents with an individual net income below 1000 € (low), 1000–2000 € (middle), 2000–3000 € (high), and above 3000 € (very high). We use an 11-point left-right scale to capture respondents’ political ideology. We recode this variable in three groups to identify people with a left political ideology (1–4), a centre political ideology (5–7), and a right political ideology (8–11). We add those that answered ‘don’t know’ as a fourth group.
Moreover, previous research has identified several other individual characteristics, which are correlated with income or political ideology, but also with support for the welfare state [
1,
5,
14,
15]. Therefore, we use gender, age in three age categories (below 35, 36–59, and 60 years and over), education (low, middle, and highest level of school education), and employment status (in work, retired, unemployed, other (i.e., in education, doing housework, on leave)) as further control variables in the multivariate analysis.
4. Results
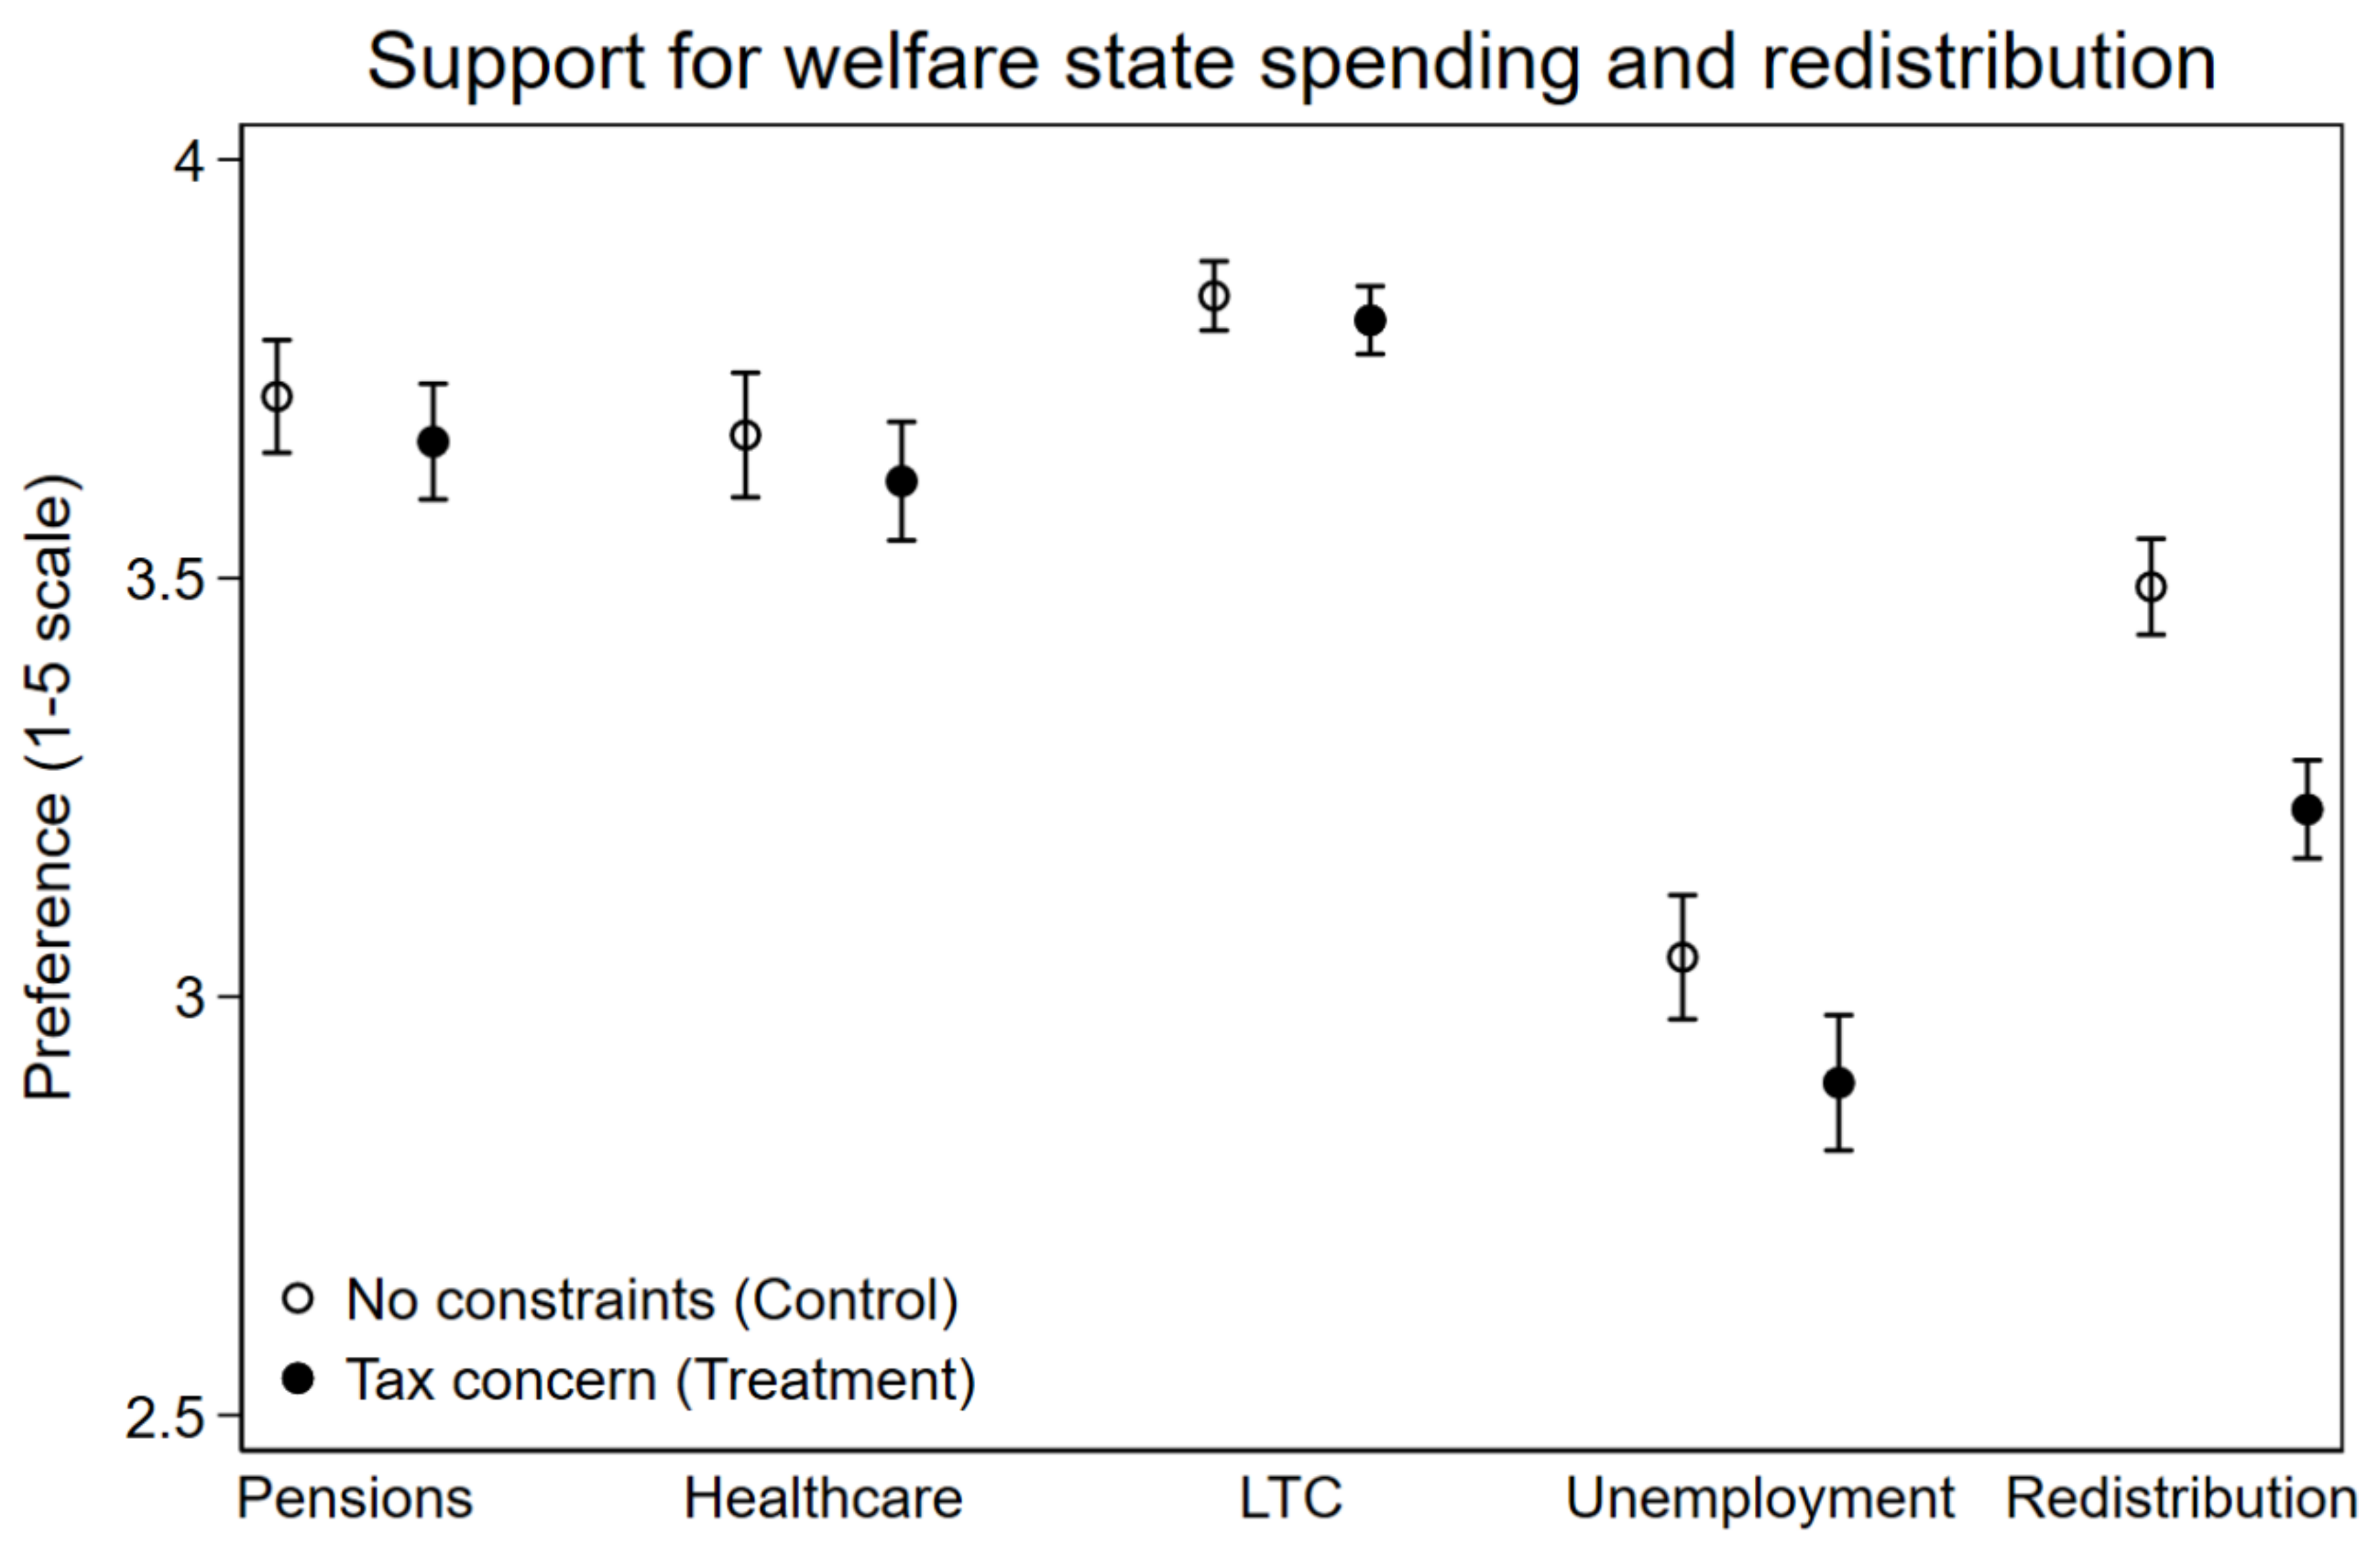
We start our analysis with a simple comparison of the average support for each of the four spending items and the standard question on redistribution preferences and specifically focus on the differences between the unpriced (white dots, control group) and the priced questions (black dots, treatment group). Since we have randomly assigned respondents either to the treatment or control group, this difference tells us something about the causal effect of the tax constraint on attitudes. As
Figure 1 shows, we find the highest support for more spending in the area of long-term care followed by the two areas of the welfare state, which have usually been those with the highest popularity, pensions, and health care. The German public is much more critical about additional spending on unemployment benefits where, on average, respondents would prefer to spend the same as now. Although support for redistribution is measured on a differently labeled scale—a 5-point agree-disagree scale and not a 5-point spending scale—and answers might, therefore, not be directly comparable, the lower support for redistribution compared to healthcare or pensions is in line with what deservingness criteria would suggest, i.e., the old and sick people are perceived as more deserving than the poor.
Our main interest is, of course, how the treatment—mentioning the tax constraint—affects support for spending and for redistribution. In general, our results confirm previous findings that tax constraints reduce support for additional spending in all four policy areas and also lead to lower support for redistribution. The effect on additional spending on healthcare, pensions, and long-term care is very small though and is not significantly different from zero. A t-test further supports the graphical results. Differences in the mean support are small and not statistically different from zero for pensions (−0.05, t-statistic: 1.10, n.s.), healthcare (−0.06,1.05, n.s.), and long term care (−0.03, 1.00, n.s.), whereas the tax constraint leads to lower support for unemployment benefits (−0.15, 2.68, p < 0.01) and less support for redistribution (−0.27, 6.36, p < 0.001). As we have argued, this suggests that support for policies that provide rather universal benefit entitlement and insure against quite common risks (like illness or old age) are not affected by tax constraints and people maintain their strong support for additional spending even if they are made aware of the costs. In contrast, support for policies that provide more concentrated benefits—i.e., to the unemployed or the poor—is significantly lower if tax constraints are mentioned. Here, it seems that there is a large share of people who want something for nothing: Spending for unemployment benefits and for redistribution is only supported if it is for free. One should keep in mind though that our experimental design follows the logic of a priming experiment. We do not assume that respondents in the control group do not take into account the costs of their policy preferences at all, but we do assume that the salience of these tax concerns is higher in the treatment group in which we explicitly mention them. Hence, we cannot completely rule out that the variation in treatment effects between policy areas might also be the result of already existing differences in the salience of tax concerns between these policy areas.
In
Table 2, we confirm these findings by providing the results of five different linear regression models for each of the dependent variables. * We further include a set of covariates and show that the effect of the treatment is robust to the inclusion of these covariates. We do not think that such an alternative estimation strategy, and the inclusion of covariates, is necessary if the treatment has been randomly assigned. Nevertheless, we will use these regression models when we examine whether the treatment has different effects across political ideology or income groups. Therefore, this can be mainly seen as a preparatory analysis and we will only very briefly summarize the main findings, which confirm previous findings in the literature. Political ideology has the expected effect and right-leaning respondents show less support for welfare state spending and for redistribution. For three of the five items, income has the expected effect and the rich are more critical about greater spending for pensions and unemployment benefits than the poor and want less redistribution. In contrast, spending for healthcare and for long term care is equally popular among all income groups.
4.1. Political Ideology, Tax Concerns, and Support for Redistribution
We argued that pre-existing attitudes towards taxation might moderate how people react to the treatment. We expected that, in particular, people with a right political ideology who are more critical about taxes would react the most to the tax constraints. To test whether the treatment effect differs between people with a right and those with a left political ideology, we include an interaction effect between the treatment and the political ideology variable in the linear regression models and then estimate the marginal effect of the treatment for each partisan group (
Table 3). Our analysis shows that left-leaning respondents reduce their level of support if we prime tax constraints and, furthermore, we find such an effect for pension spending preferences. We do not find evidence that respondents with a right political ideology differ significantly in how they react to tax constraints. Contrary to our expectations, tax constraints sometimes even seem to have a weaker effect on spending preferences for right-leaning respondents in particular if we look at spending preferences for pensions and at support for redistribution. Our results, therefore, show that adding tax constraints do not lead to more considerate attitudes, which are more in line with theoretical expectations, but rather decrease partisan differences.
4.2. Income, Tax Concerns, and Support for Redistribution
Previous research has shown that non-users of welfare services are much more likely to want something for nothing and, consequently, reduce their support for welfare much more when made aware of the costs of the welfare state [
8]. Following a similar logic, we expected that those who would be economically much more affected by tax increases, the high income earners, would show stronger reactions to tax constraints and would reduce support for the welfare state and for redistribution more than low income earners. To explore the moderating effect of income on the strength of the tax constraint, we estimate linear regression models for each of the dependent variables and include the respective interaction effects between the treatment and the four income categories. In
Table 4, we provide the marginal effects of the treatment across income groups.
First, we find no difference between the income groups for long-term care (Model 3) as none of the income groups withdraws its support for spending on long-term care when made aware about the tax consequences. For spending on pensions, spending on unemployment benefits, and support for redistribution, we find evidence for the expected moderating effect of income. Higher income leads to stronger negative reactions to the tax constraint. Whereas the low income group does not significantly reduce its support for spending on pensions (+0.105, n.s.), on unemployment benefits (+0.032, n.s.), and for redistribution (−0.161, n.s.), we find stronger negative and often significant reactions to the tax constraint for the other income groups. It seems that, in particular, the middle income group is very sensitive to tax constraints (see also [
31,
32]). Finally, we have to note that support for healthcare seems to be an outlier. Here, the low and middle income groups react strongest to the tax constraints (−0.218 [
p < 0.05] and −0.223 [
p < 0.05]), the high income group is not affected in its support, and respondents with very high income even increase their support in the treatment group. Thus, the observed income gradient in the unpriced item (i.e., high income is associated with lower support) disappears if we look at the priced healthcare item. Particularities of the German health insurance system might provide one possible explanation for this finding. In Germany, high income earners whose income is above a certain threshold have the right to opt out of the statutory contribution and tax financed health insurance and buy private health insurance instead. We must admit, though, that this is more likely to be another reason to be much more sensitive to tax increases for high income earners who would have to pay part of these taxes, but would not benefit from improvements or lower contributions to the public health insurance system. So, whereas we are not able to provide an explanation for this unexpected finding, we will take this puzzle as a starting point to discuss implications for future research in the conclusion.
5. Discussion
This article explored whether support for the welfare state and for redistribution is subject to tax constraints. Are respondents willing to pay for their preferred level of welfare state spending or do they engage in trade-offs when forming their welfare state and redistribution preferences? Following up on a long-standing, but sometimes neglected, line of public opinion research [
7,
17,
18] and contributing to recent trends in welfare state research [
14,
23,
33], we have shown that tax constraints lead to lower aggregate support for the welfare state. But our results clearly show that such trade-offs between spending and taxes do not apply to all areas of the welfare state and might only be relevant for policies that provide concentrated benefits for some people, such as unemployment benefits or redistribution, social investment [
14], or family policy [
8]. In contrast, support for more universal programs, such as pensions, long-term care, or healthcare, are not affected by mentioning their fiscal costs. We will discuss the research and policy implications of these findings.
First, our findings add to recent discussions about the reliability of unpriced items. On the one hand, our results reduce concerns about using unpriced items as we have shown that adding a price tag does not affect support across all areas of the welfare state. Moreover, our subgroup analysis of partisan and income groups shows that priced items do not seem to lead to more considerate attitudes and patterns of attitudes that are more in line with our theoretical expectations. On the other hand, the observed differences between policy areas add much more complexity to this issue and makes it even more complicated to decide whether to use priced or unpriced items. At a minimum, research needs to be aware about these differences when one compares existing findings, which are based on priced items (e.g., spending preferences in the ISSP), and unpriced items (e.g., the government’s responsibility items in the ESS or redistribution preferences in almost all surveys). Of course, our results and some of the unexpected findings, which left us without an explanation, call for more research to improve our understanding of the potential trade-offs respondents might make when forming their attitudes. One problem which arises here is that explicitly adding one constraint or trade-off—in our case, between additional spending and taxes—might encourage respondents to think also about other possible trade-offs. Increasing deficits or cutting other welfare state programs are two other alternatives to finance more spending [
14,
17]. Also, adding a tax constraint raises awareness that someone has to pay for the additional spending, but it remains open to the respondents’ interpretation of who should pay [
23]. Conjoint analysis and vignettes [
33], but also more qualitative methods, are promising methodological techniques to complement the standard survey research in this field [
34,
35].
Second, our findings, together with previous studies on tax constraints, have implications for policy making. It seems that rather universal, ‘old’ social policies, such as pensions or healthcare, retain a high level of support even if their costs are made very salient. In contrast, more needs-based, ‘new’ social policies, such as social investment and childcare support, but perhaps also redistribution, lose quite some support if their costs are salient. For the old policies, this suggests that retrenchment is very difficult as support for spending, and, consequently, opposition to cut backs, remains high even if this leads to higher taxes. For the new policies, policy makers are faced with the challenge that they are popular, but that their popularity and support for their expansion is very sensitive to tax increases as a “something for nothing”-preference is much more common in these areas of the welfare state. Future work should try to develop a better understanding of the specific reasons for this kind of attitude towards new social policies (see for example [
7]) as this might provide important insights under which circumstances such reforms are successful.


