Science Evaluation in the Czech Republic: The Case of Universities


Abstract
:1. Introduction and Related Work
2. Data and Methods

| University name in English | Acronym |
|---|---|
| University of South Bohemia in České Budějovice | Budějovice |
| Czech Technical University in Prague | ČVUT |
| Czech University of Life Sciences Prague | ČZU |
| University of Hradec Králové | Hradec |
| Technical University of Liberec | Liberec |
| Masaryk University | MU |
| Mendel University in Brno | MZLU |
| Palacký University, Olomouc | Olomouc |
| Silesian University in Opava | Opava |
| University of Ostrava | Ostrava |
| University of Pardubice | Pardubice |
| University of West Bohemia | Plzeň |
| Charles University in Prague | UK |
| University of Defense | UO |
| Jan Evangelista Purkyně University in Ústí nad Labem | Ústí |
| University of Veterinary and Pharmaceutical Sciences Brno | VFU |
| VŠB-Technical University of Ostrava | VŠB-TUO |
| University of Economics, Prague | VŠE |
| Institute of Chemical Technology, Prague | VŠCHT |
| Brno University of Technology | VUT |
| Tomas Bata University in Zlín | Zlín |
2.1. Scores
| Result category | “National” fields | Other fields | |||
|---|---|---|---|---|---|
| Jimp | impacted journal article | 10–305 | |||
| Nature or Science article | 500 | ||||
| Jnoimp | refereed journal article | Scopus | 12 | ||
| ERIH | A | 30 | 12 | ||
| B | 20 | 11 | |||
| C | 10 | 10 | |||
| Jref | Czech refereed journal article | list of refereed journals | 10 | 4 | |
| B | book or book chapter | world language | 40 | 40 | |
| other languages | 20 | ||||
| D | conference proceedings paper | 8 | |||
| P | patent | EPO, USA, Japan | 500 | ||
| license-exploited Czech or national patent | 200 | ||||
| other patents | 40 | ||||
| Z | pilot plant, certified technology, variety, breed | 100 | |||
| F | utility model | 40 | |||
| industrial design | 40 | ||||
| G | prototype, functional sample | 40 | |||
| H | results implemented by funding body | 40 | |||
| N | certified methodologies and procedures, specialized maps | 40 | |||
| R | software | 40 | |||
| V | research report with confidential information | 50 | |||
2.2. Renormalization
- (a)
- 115% reduction of excessive growth of results of a certain type. Let X2009 be the total score of results of type X yielded in 2009 and X2010 be the total score of results of type X yielded in 2010. If X2010/X2009 > 1.15, then the scores of all results of type X from 2010 shall be multiplied by factor cx:cx = 1.15(X2009/X2010). This step does not concern Jimp results.
- (b)
- Correction of the proportion between basic and applied research results to eighty-five: fifteen. Let SB = J + B + D be the total score of basic research results and SA = P + Z + F + G + H + N + R + V be the total score of applied research results. (Previous methodologies also included result categories, C—basic research—and L, S, and T—applied research.) Let a85 = 0.85(SB + SA)/SB be the correction factor for basic research results and a15 = 0.15(SB + SA)/SA be the correction factor for applied research results. Then, all results of categories J, B and D shall be multiplied by factor, a85, and all results of categories P, Z, F, G, H, N, R, and V shall be multiplied by factor, a15.
- (c)
- Setting of the proportion among various disciplinary research areas. Let ax = px(SB + SA)/X be the correction factor of research area, X, where SB and SA are defined above, X is the total score of results in research area, X, after the corrections described in the two previous steps, and px is the (desired) research area share from Table 3. The results in each research area shall be multiplied by the corresponding correction factor.
| Disciplinary area | px | |
|---|---|---|
| 1. | social sciences | 7.85 |
| 2. | engineering | 15.60 |
| 3. | mathematics and computer science | 5.16 |
| 4. | physics | 15.08 |
| 5. | chemical sciences | 15.80 |
| 6. | Earth sciences | 5.06 |
| 7. | biological sciences | 12.00 |
| 8. | agriculture | 4.96 |
| 9. | medicine | 10.74 |
| 10. | arts and humanities | 7.75 |
| 100.00 | ||
3. Results and Discussion
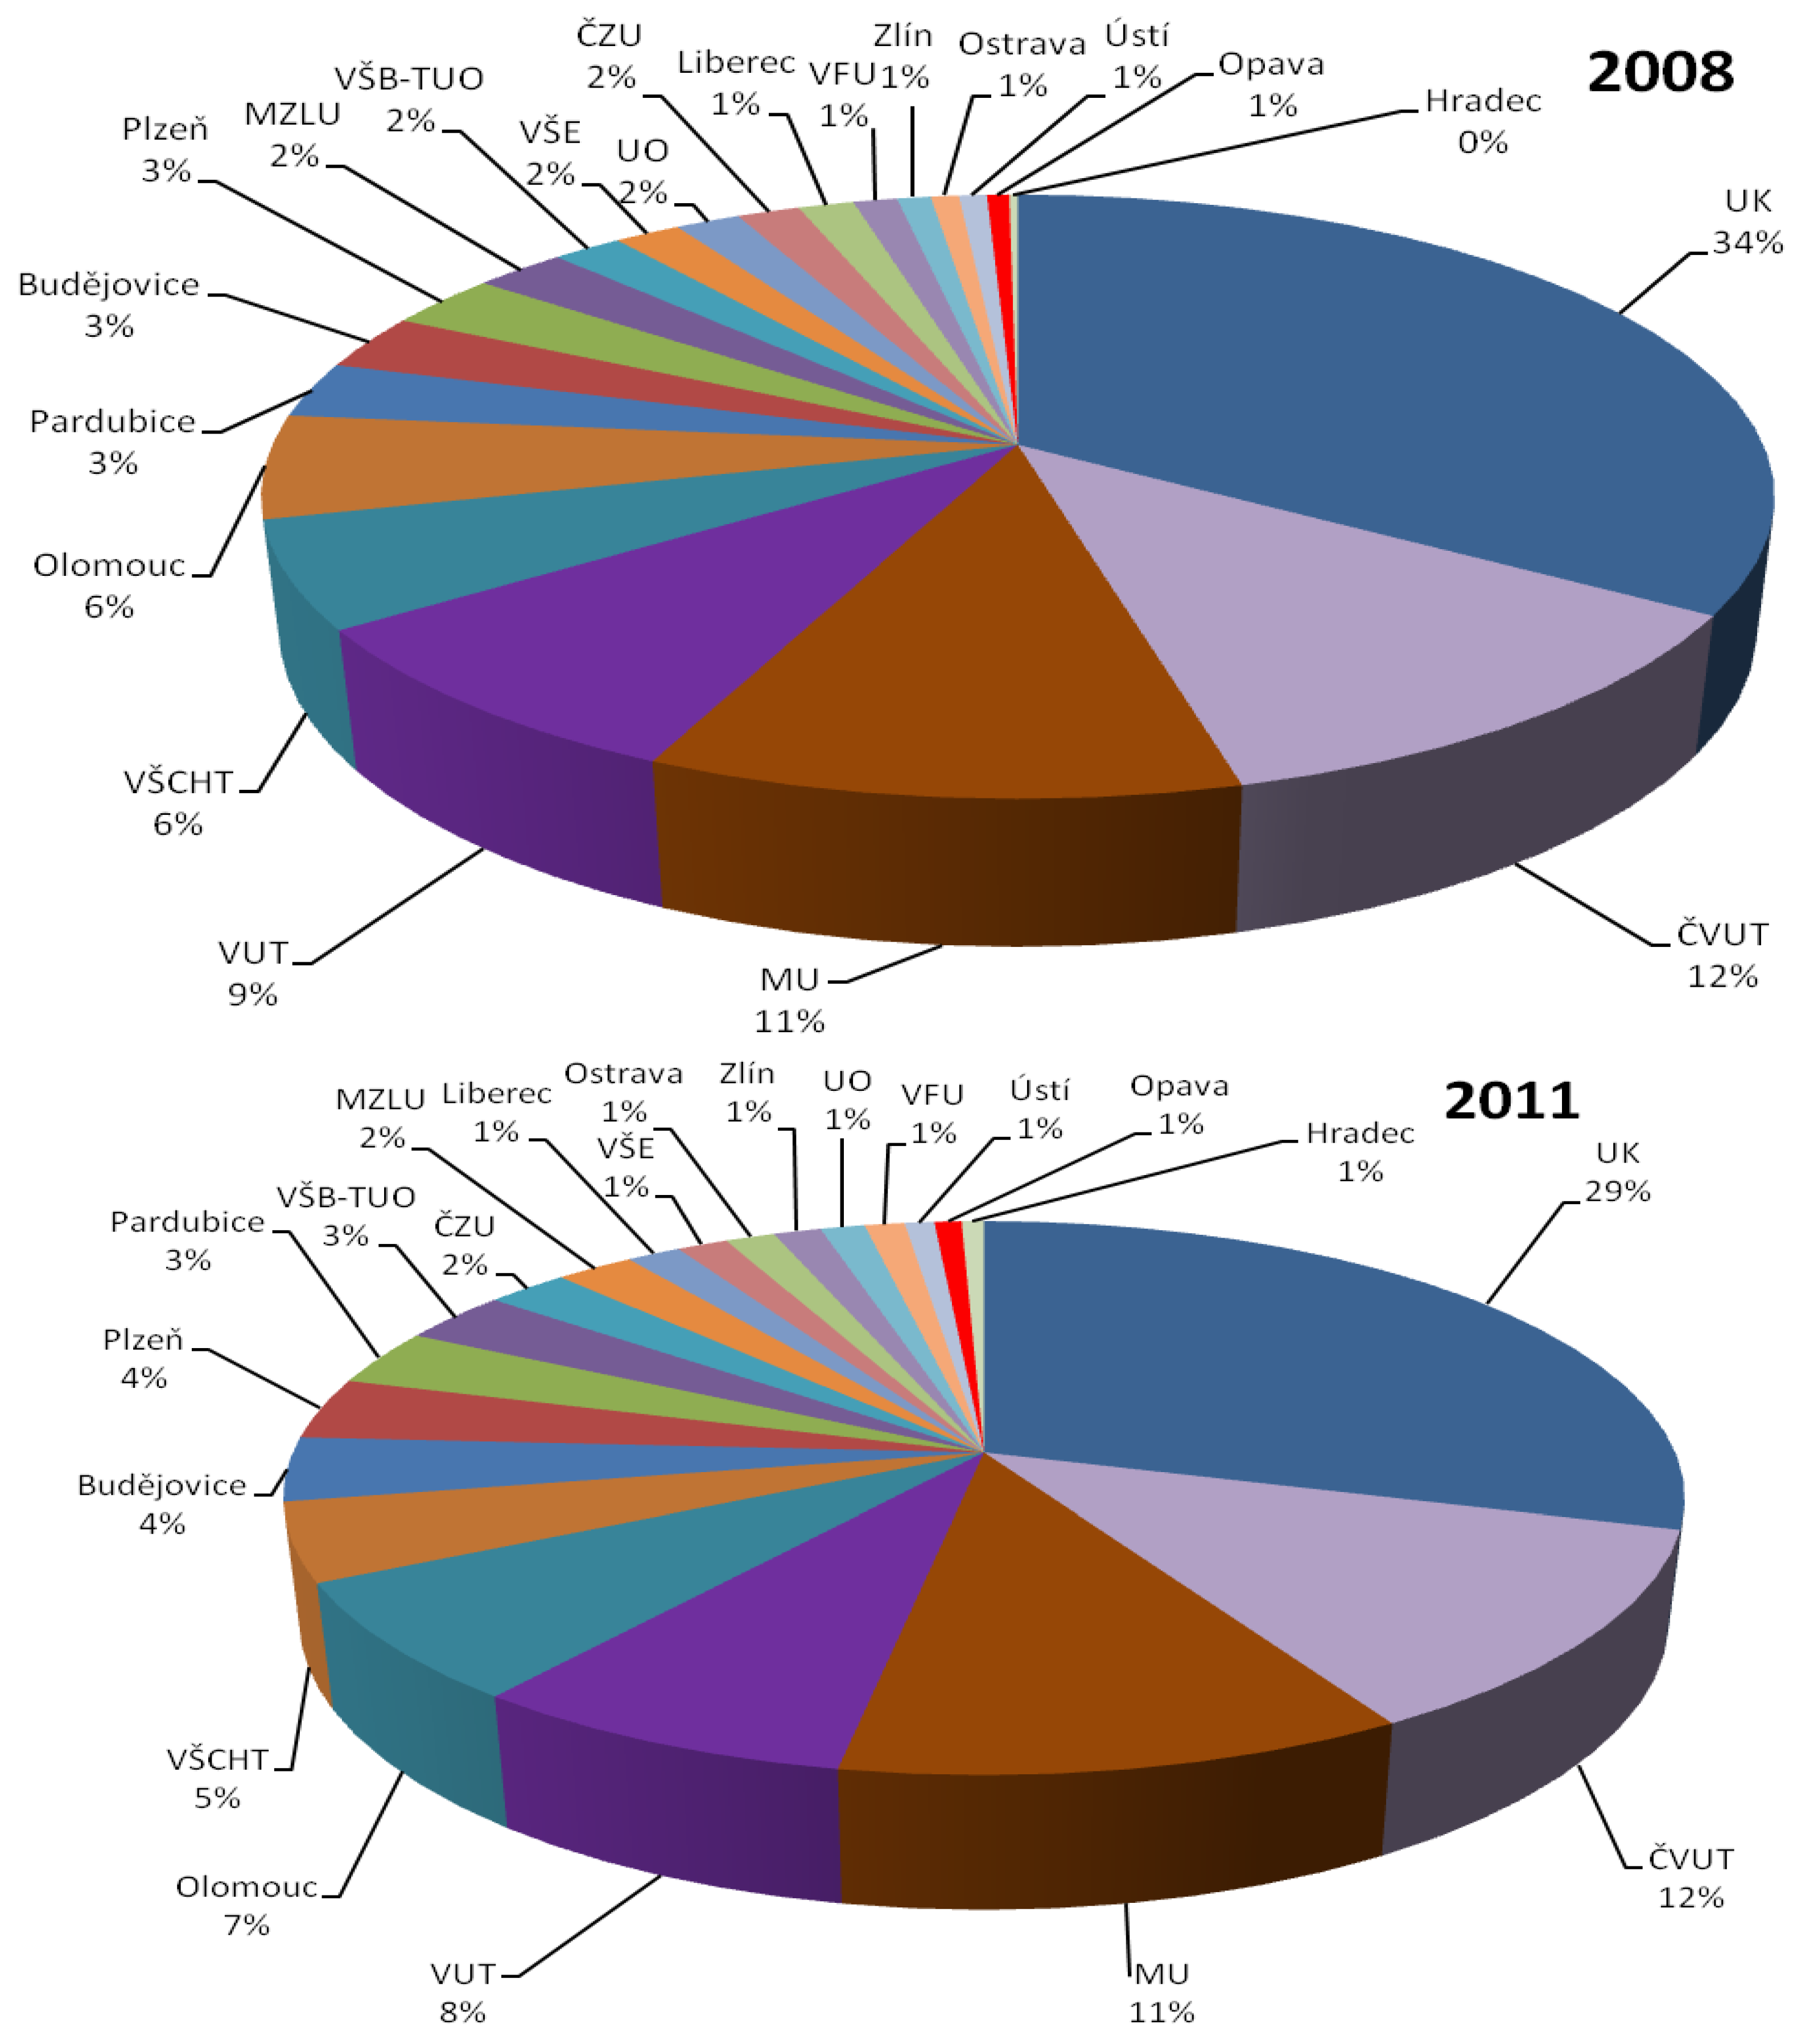
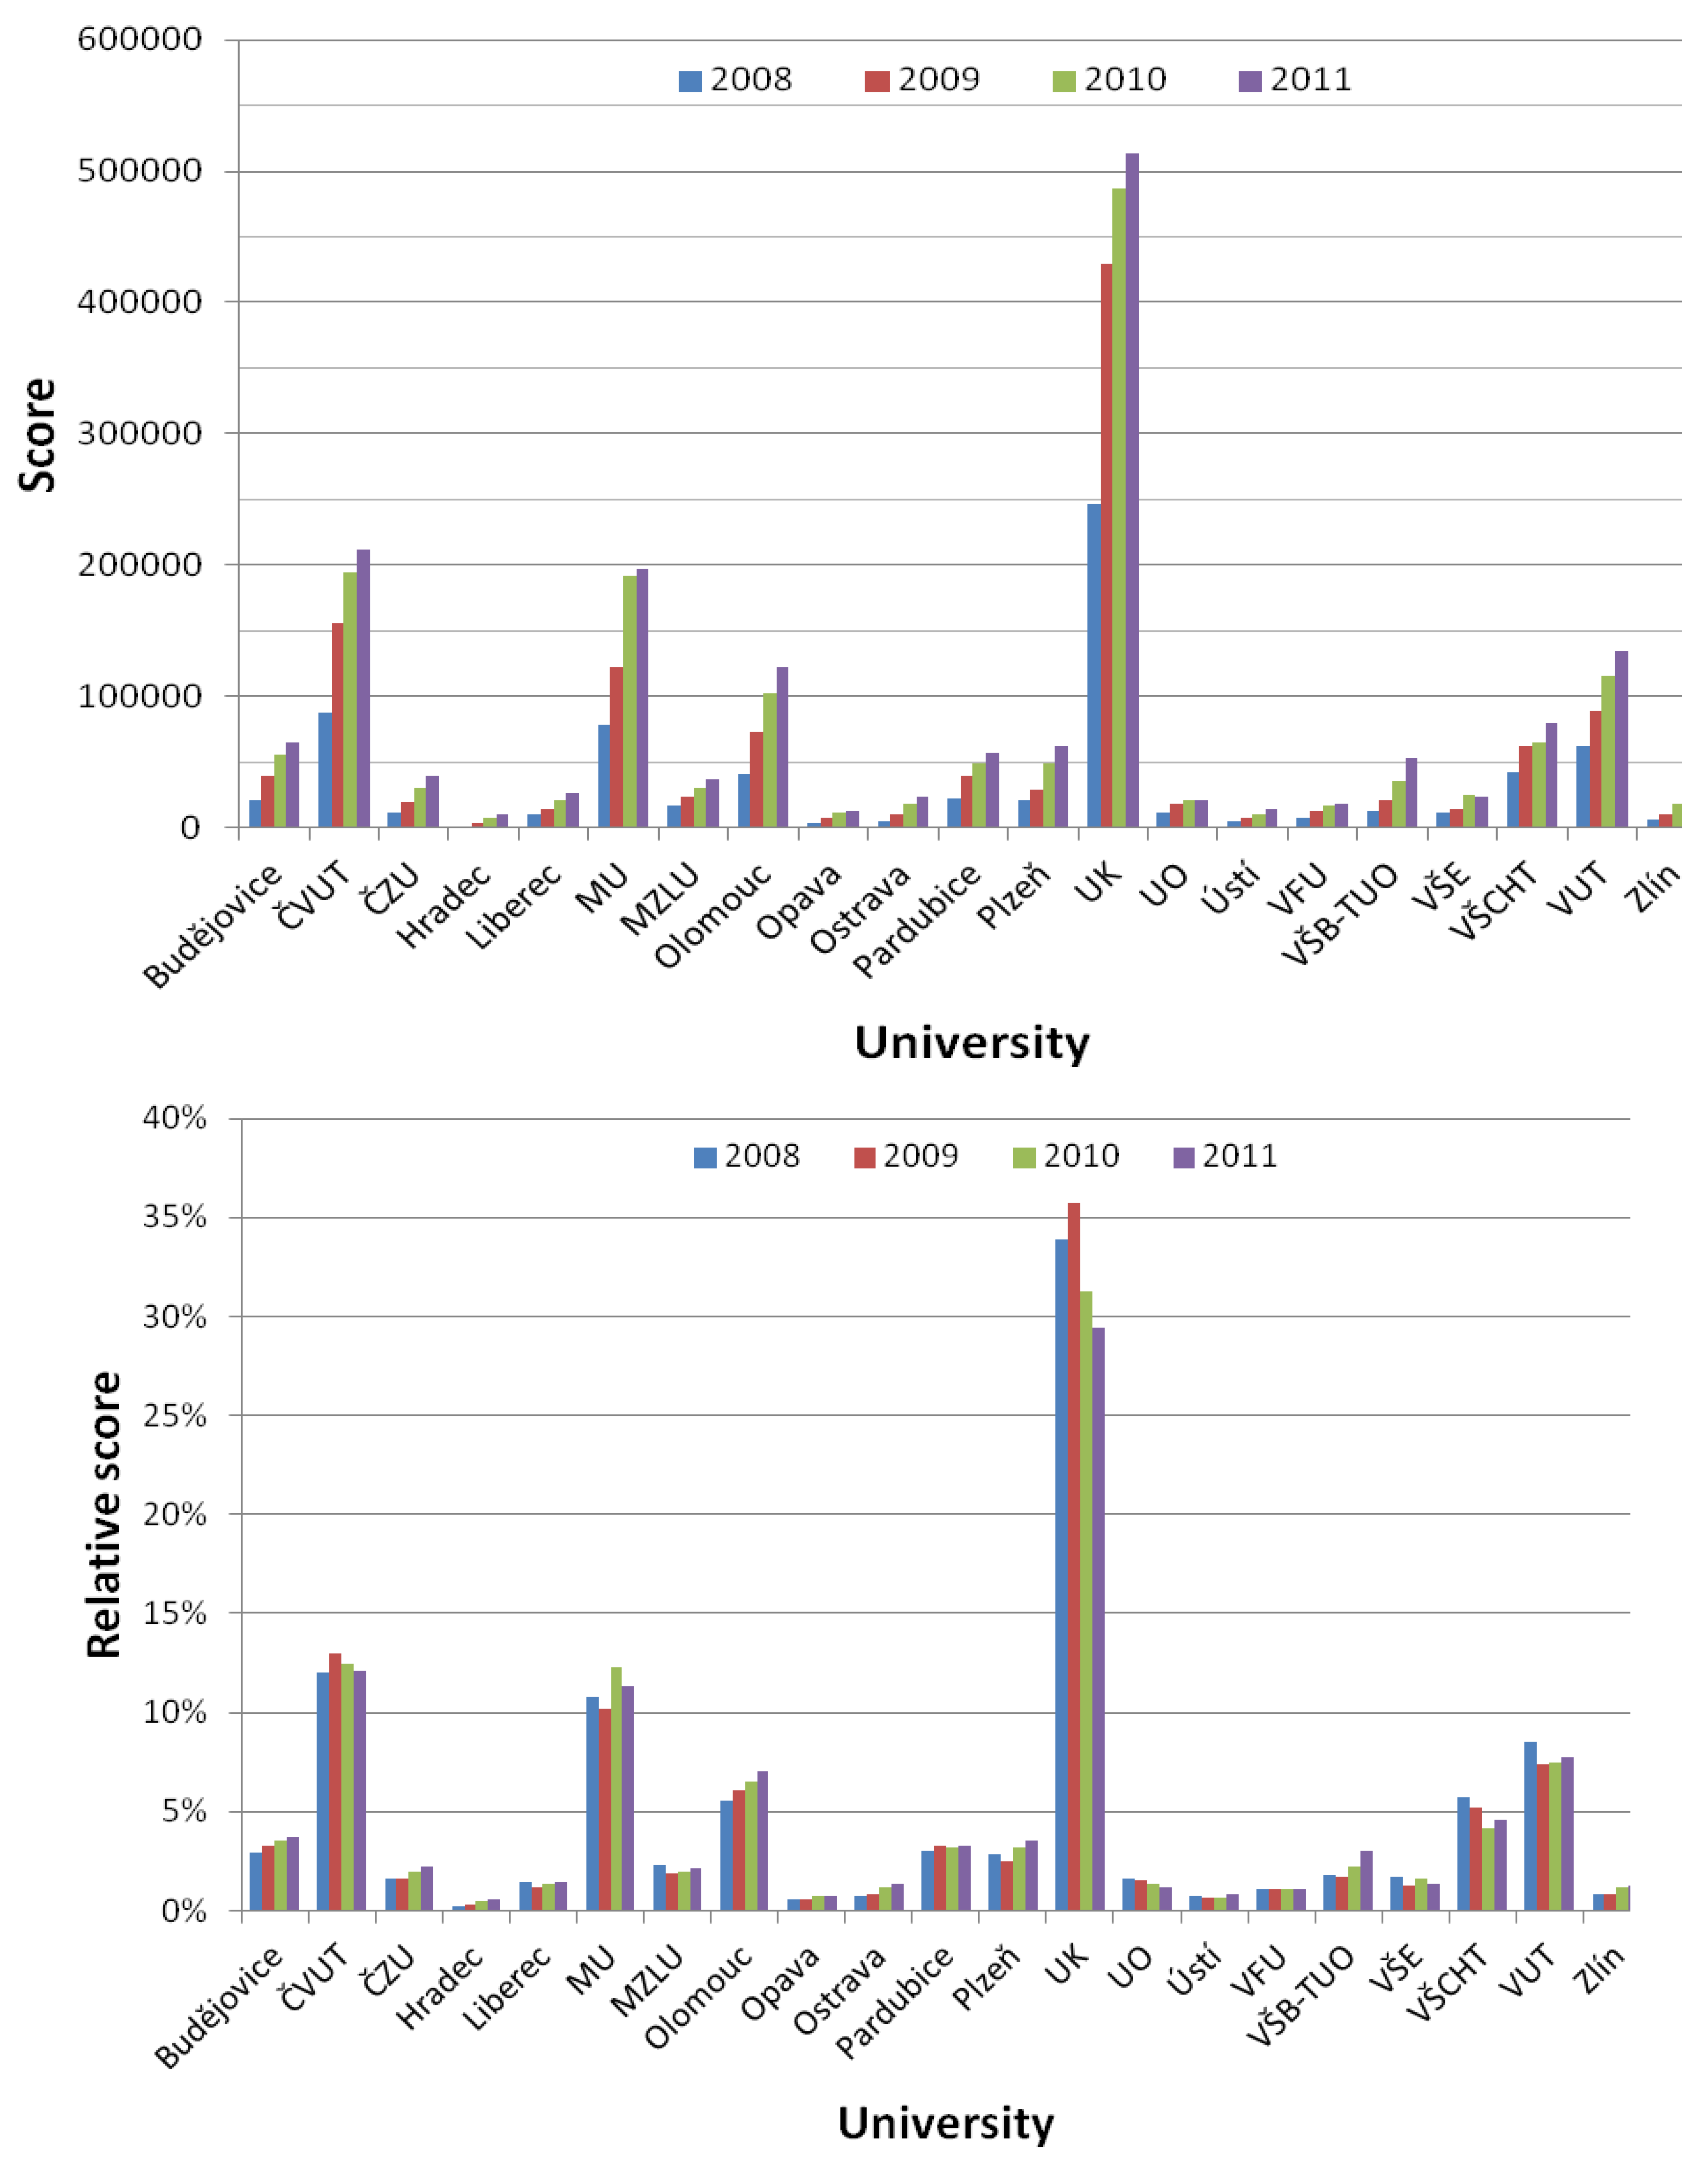
| University | 2008 | % | 2009 | % | 2010 | % | 2011 | % | Δ09 | Δ10 | Δ11 |
|---|---|---|---|---|---|---|---|---|---|---|---|
| Budějovice | 21,440 | 2.95 | 39,082 | 3.26 | 55,586 | 3.55 | 65,244 | 3.74 | 82% | 42% | 17% |
| ČVUT | 87,631 | 12.06 | 155,587 | 12.96 | 194,547 | 13.20 | 211,796 | 12.13 | 78% | 25% | 9% |
| ČZU | 11,561 | 1.59 | 19,023 | 1.58 | 30,097 | 1.86 | 39,261 | 2.25 | 65% | 58% | 30% |
| Hradec | 1,567 | 0.22 | 3,623 | 0.30 | 7,739 | 0.42 | 10,506 | 0.60 | 131% | 114% | 36% |
| Liberec | 10,200 | 1.40 | 14,149 | 1.18 | 21,218 | 1.45 | 25,653 | 1.47 | 39% | 50% | 21% |
| MU | 78,608 | 10.82 | 122,392 | 10.20 | 191,667 | 11.76 | 197,256 | 11.30 | 56% | 57% | 3% |
| MZLU | 17,024 | 2.34 | 23,058 | 1.92 | 30,722 | 1.85 | 37,076 | 2.12 | 35% | 33% | 21% |
| Olomouc | 40,332 | 5.55 | 72,485 | 6.04 | 101,708 | 6.44 | 122,835 | 7.04 | 80% | 40% | 21% |
| Opava | 4,065 | 0.56 | 7,062 | 0.59 | 11,649 | 0.65 | 12,796 | 0.73 | 74% | 65% | 10% |
| Ostrava | 5,135 | 0.71 | 10,318 | 0.86 | 18,683 | 1.08 | 23,417 | 1.34 | 101% | 81% | 25% |
| Pardubice | 21,670 | 2.98 | 39,524 | 3.29 | 49,098 | 3.04 | 56,925 | 3.26 | 82% | 24% | 16% |
| Plzeň | 20,956 | 2.88 | 29,495 | 2.46 | 49,036 | 3.30 | 62,430 | 3.58 | 41% | 66% | 27% |
| UK | 246,366 | 33.90 | 429,261 | 35.77 | 487,227 | 31.25 | 513,338 | 29.41 | 74% | 14% | 5% |
| UO | 11,870 | 1.63 | 18,033 | 1.50 | 21,426 | 1.43 | 20,993 | 1.20 | 52% | 19% | −2% |
| Ústí | 5,113 | 0.70 | 7,753 | 0.65 | 10,794 | 0.65 | 13,999 | 0.80 | 52% | 39% | 30% |
| VFU | 8,080 | 1.11 | 13,423 | 1.12 | 16,599 | 1.09 | 18,838 | 1.08 | 66% | 24% | 13% |
| VŠB-TUO | 12,912 | 1.78 | 20,670 | 1.72 | 35,287 | 2.27 | 52,308 | 3.00 | 60% | 71% | 48% |
| VŠE | 12,126 | 1.67 | 14,750 | 1.23 | 25,529 | 1.31 | 24,030 | 1.38 | 22% | 73% | −6% |
| VŠCHT | 41,734 | 5.74 | 62,164 | 5.18 | 65,174 | 4.22 | 79,556 | 4.56 | 49% | 5% | 22% |
| VUT | 62,100 | 8.55 | 88,667 | 7.39 | 115,882 | 8.10 | 134,934 | 7.73 | 43% | 31% | 16% |
| Zlín | 61,69 | 0.85 | 9,701 | 0.81 | 17,823 | 1.06 | 22,529 | 1.29 | 57% | 84% | 26% |
| 726,658 | 100 | 1,200,220 | 100 | 1,557,490 | 100 | 1,745,720 | 100 | 65% | 30% | 12% |


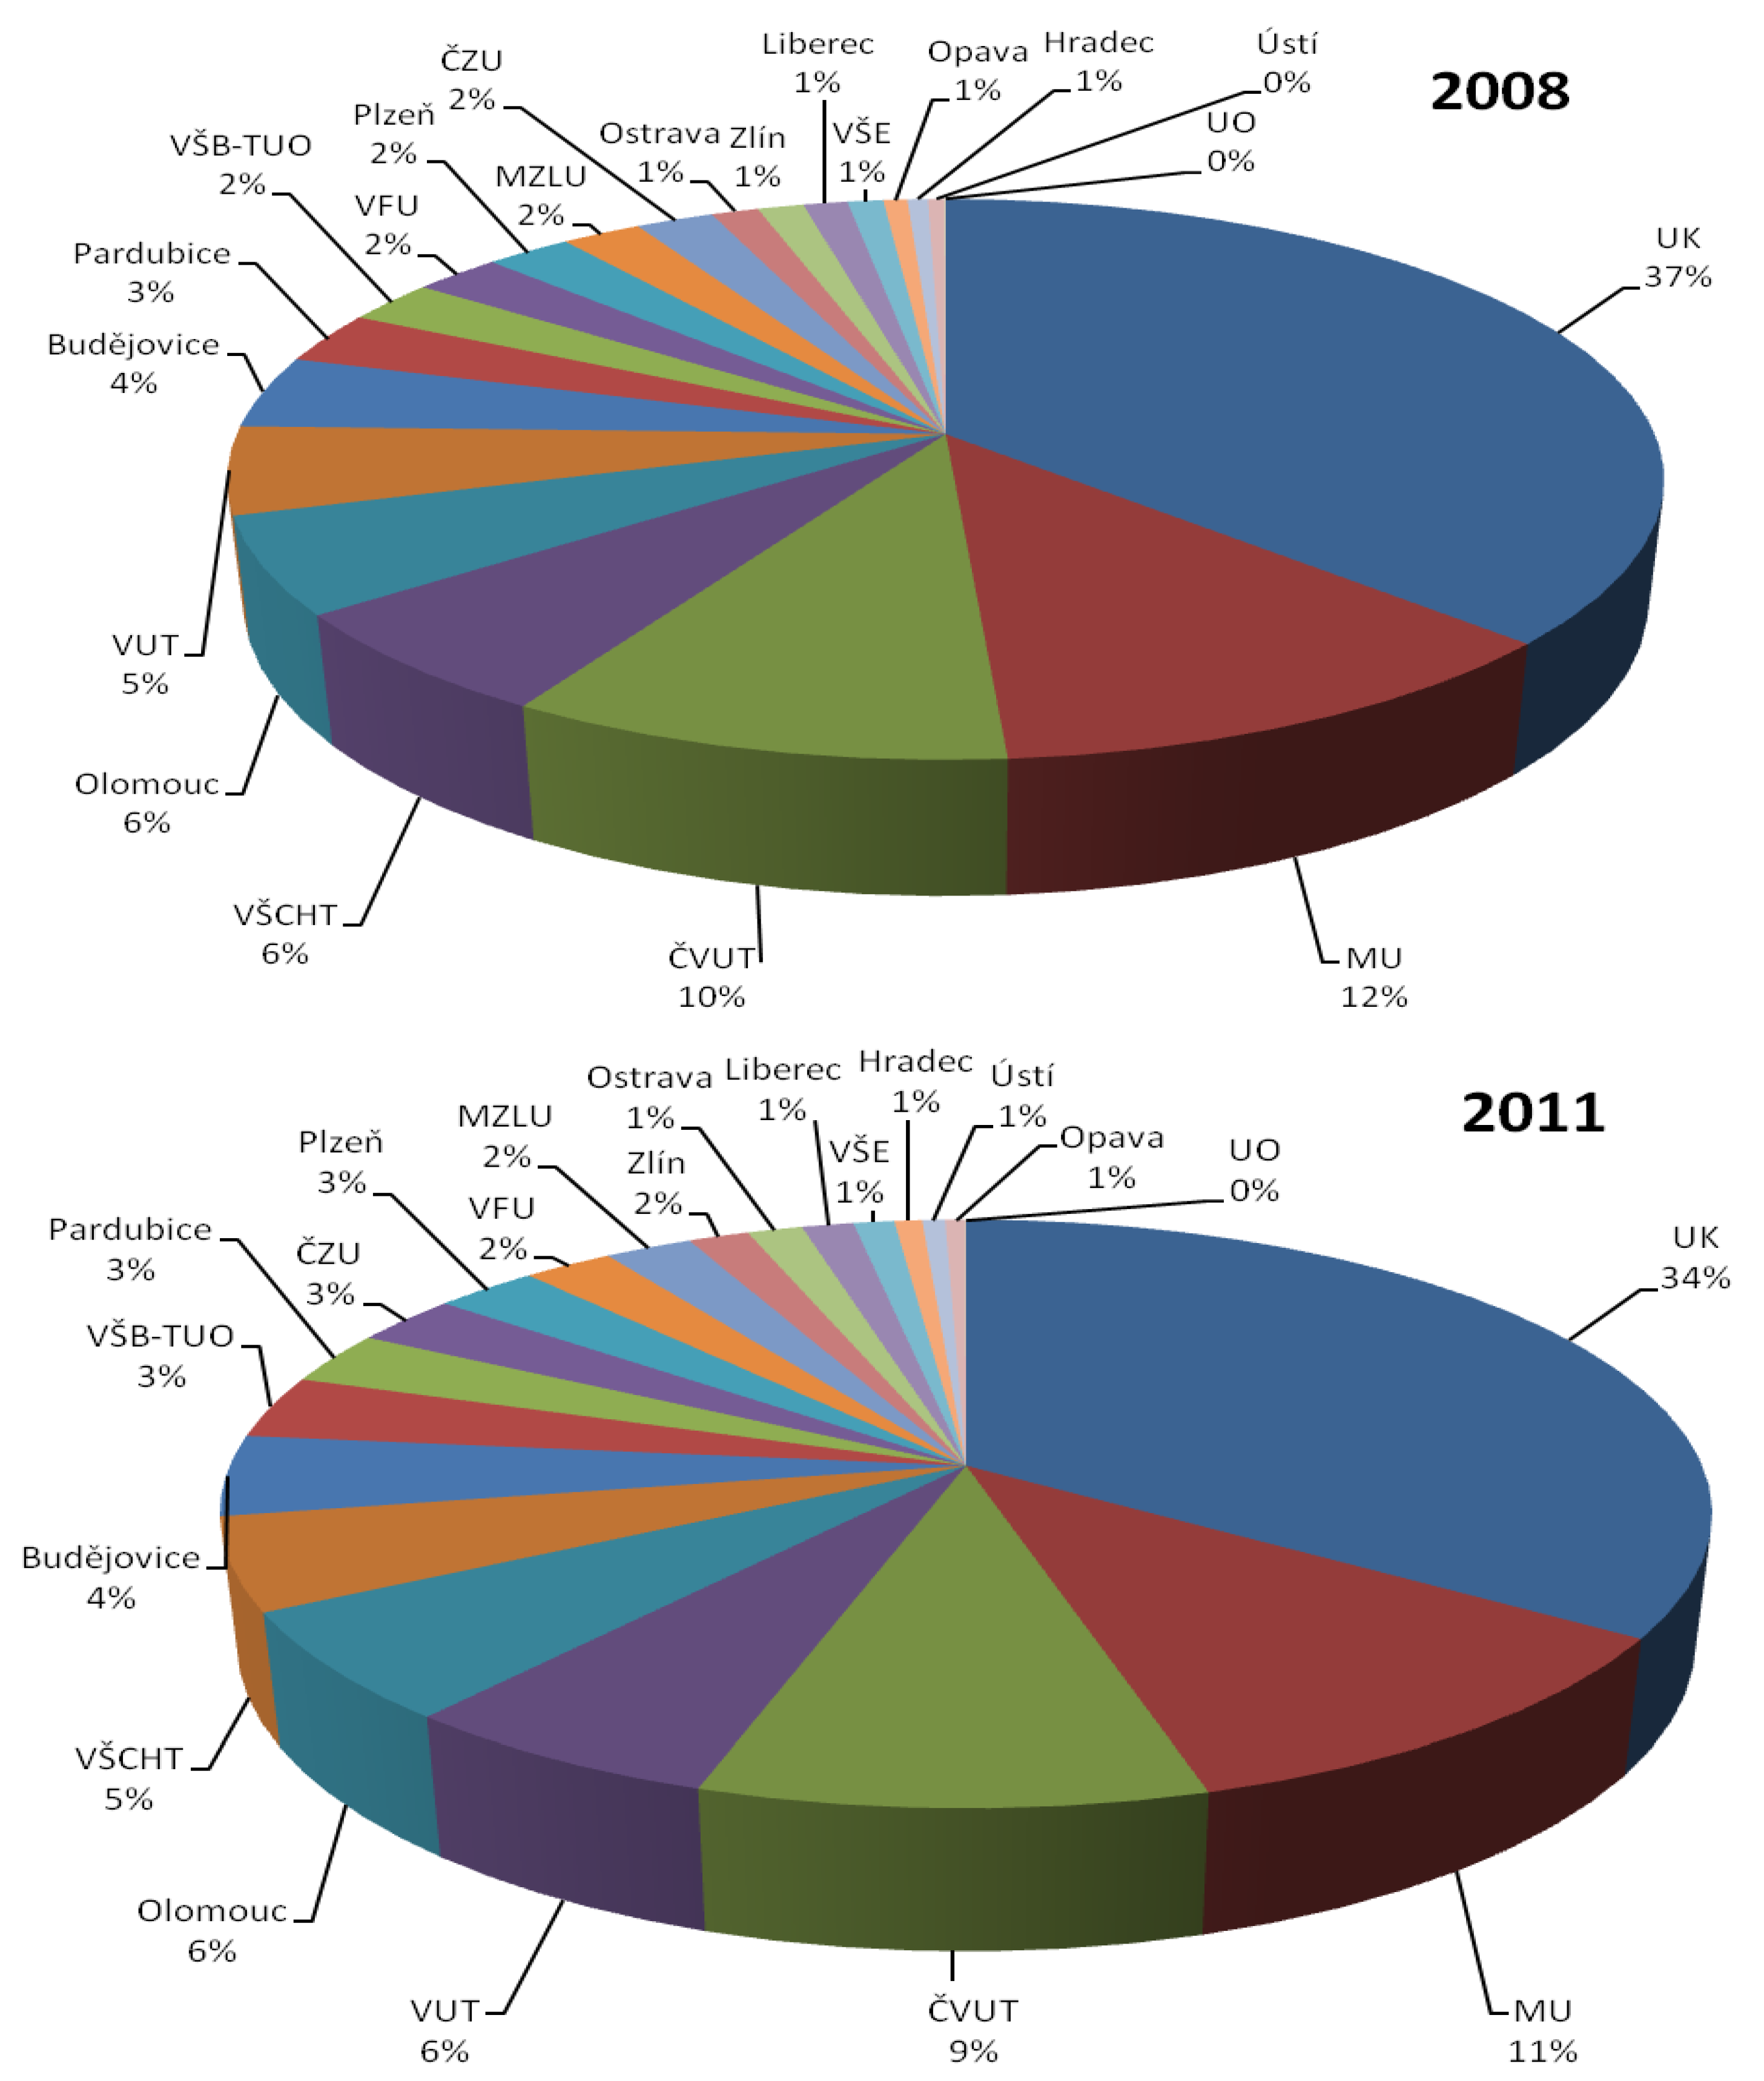
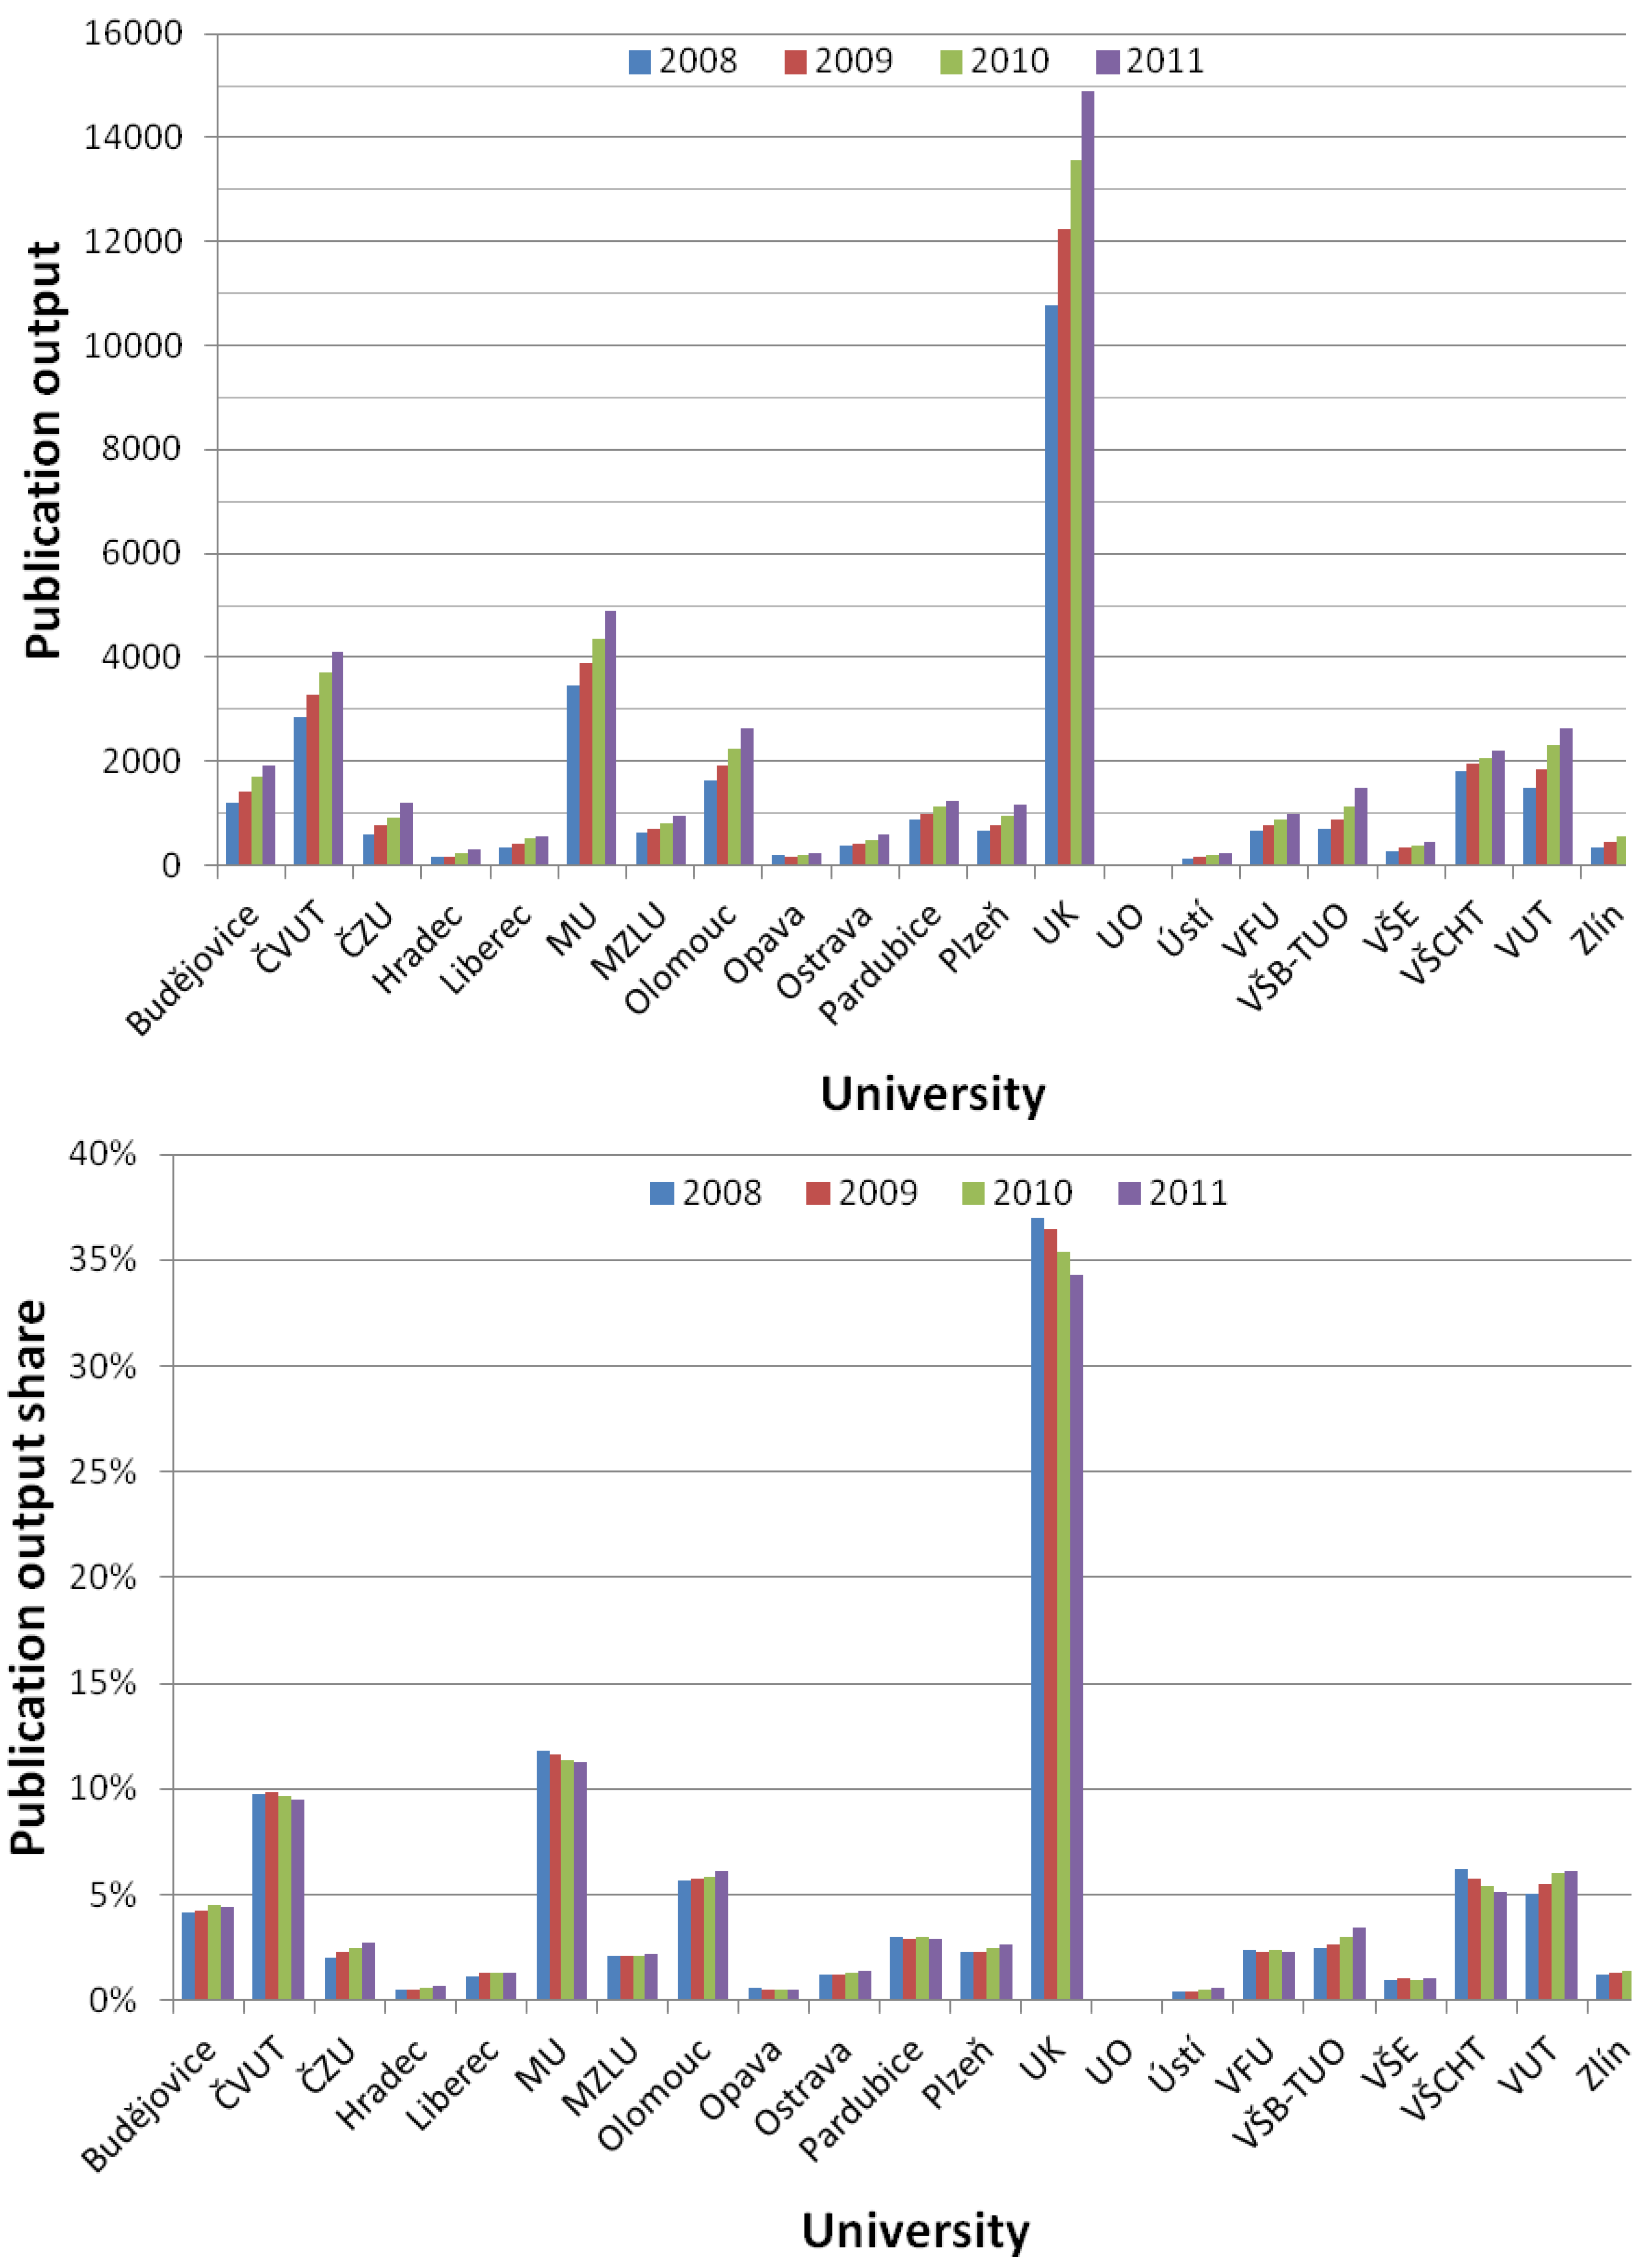
| University | 2008 | % | 2009 | % | 2010 | % | 2011 | % | Δ09 | Δ10 | Δ11 |
|---|---|---|---|---|---|---|---|---|---|---|---|
| Budějovice | 1,216 | 4.17 | 1,417 | 4.21 | 1,715 | 4.47 | 1,929 | 4.44 | 17% | 21% | 12% |
| ČVUT | 2,846 | 9.76 | 3,299 | 9.81 | 3,697 | 9.63 | 4,111 | 9.45 | 16% | 12% | 11% |
| ČZU | 600 | 2.06 | 756 | 2.25 | 932 | 2.43 | 1,186 | 2.73 | 26% | 23% | 27% |
| Hradec | 157 | 0.54 | 172 | 0.51 | 229 | 0.60 | 306 | 0.70 | 10% | 33% | 34% |
| Liberec | 340 | 1.17 | 431 | 1.28 | 507 | 1.32 | 572 | 1.32 | 27% | 18% | 13% |
| MU | 3,457 | 11.85 | 3,902 | 11.61 | 4,347 | 11.32 | 4,883 | 11.23 | 13% | 11% | 12% |
| MZLU | 613 | 2.10 | 697 | 2.07 | 816 | 2.13 | 968 | 2.23 | 14% | 17% | 19% |
| Olomouc | 1,642 | 5.63 | 1,926 | 5.73 | 2,227 | 5.80 | 2,643 | 6.08 | 17% | 16% | 19% |
| Opava | 183 | 0.63 | 180 | 0.54 | 206 | 0.54 | 223 | 0.51 | −2% | 14% | 8% |
| Ostrava | 363 | 1.24 | 422 | 1.26 | 501 | 1.31 | 608 | 1.40 | 16% | 19% | 21% |
| Pardubice | 865 | 2.97 | 983 | 2.92 | 1,136 | 2.96 | 1,252 | 2.88 | 14% | 16% | 10% |
| Plzeň | 663 | 2.27 | 782 | 2.33 | 962 | 2.51 | 1,152 | 2.65 | 18% | 23% | 20% |
| UK | 10,787 | 36.98 | 12,242 | 36.41 | 13,571 | 35.35 | 14,909 | 34.29 | 13% | 11% | 10% |
| UO | 7 | 0.02 | 7 | 0.02 | 7 | 0.02 | 6 | 0.01 | 0% | 0% | −14% |
| Ústí | 129 | 0.44 | 150 | 0.45 | 191 | 0.50 | 252 | 0.58 | 16% | 27% | 32% |
| VFU | 681 | 2.33 | 780 | 2.32 | 895 | 2.33 | 994 | 2.29 | 15% | 15% | 11% |
| VŠB-TUO | 714 | 2.45 | 891 | 2.65 | 1,149 | 2.99 | 1,498 | 3.45 | 25% | 29% | 30% |
| VŠE | 275 | 0.94 | 343 | 1.02 | 373 | 0.97 | 450 | 1.03 | 25% | 9% | 21% |
| VŠCHT | 1,805 | 6.19 | 1,945 | 5.78 | 2,063 | 5.37 | 2,220 | 5.11 | 8% | 6% | 8% |
| VUT | 1,476 | 5.06 | 1,855 | 5.52 | 2,316 | 6.03 | 2,649 | 6.09 | 26% | 25% | 14% |
| Zlín | 353 | 1.21 | 442 | 1.31 | 546 | 1.42 | 671 | 1.54 | 25% | 24% | 23% |
| 29,172 | 100 | 33,622 | 100 | 38,386 | 100 | 43,482 | 100 | 15% | 14% | 13% |
4. Conclusions and Future Work
- –
- The overall research output of the universities under study more than doubled from 2008 and 2011, with virtually all universities increasing their absolute research production each year.
- –
- The production growth seems to be slowing down.
- –
- Charles University in Prague is still the leading research university in both absolute and relative terms, but its relative share in the total research production is decreasing in favor of smaller universities.
Acknowledgments
Conflict of Interest
References
- Vaněček, J. Bibliometric analysis of the Czech research publications from 1994 to 2005. Scientometrics 2008, 77, 345–360. [Google Scholar] [CrossRef]
- Vaněček, J. Patenting propensity in the Czech Republic. Scientometrics 2008, 75, 381–394. [Google Scholar] [CrossRef]
- Vaněček, J.; Fatun, M.; Albrecht, V. Bibliometric evaluation of the FP-5 and FP-6 results in the Czech Republic. Scientometrics 2010, 83, 103–114. [Google Scholar] [CrossRef]
- Gorraiz, J.; Reimann, R.; Gumpenberger, C. Key factors and considerations in the assessment of international collaboration: A case study for Austria and six countries. Scientometrics 2011, 91, 417–433. [Google Scholar]
- Radosevic, S.; Auriol, L. Patterns of restructuring in research, development and innovation activities in Central and Eastern European countries: An analysis based on S&T indicators. Res. Pol. 1999, 28, 351–376. [Google Scholar] [CrossRef]
- Geuna, A.; Martin, B.R. University research evaluation and funding: An international comparison. Minerva 2003, 41, 277–304. [Google Scholar] [CrossRef]
- Hicks, D. Performance-based university research funding systems. Res. Pol. 2012, 41, 251–261. [Google Scholar] [CrossRef]
- Bucheli, V.; Díaz, A.; Calderón, J.P.; Lemoine, P.; Valdivia, J.A.; Villaveces, J.L.; Zarama, R. Growth of scientific production in Colombian universities: An intellectual capital-based approach. Scientometrics 2012, 91, 369–382. [Google Scholar] [CrossRef]
- Buela-Casal, G.; Paz Bermúdez, M.; Sierra, J.C.; Quevedo-Blasco, R.; Castro, A.; Guillén-Riquelme, A. Ranking 2010 in production and research productivity in Spanish public universities. Psicothema 2011, 23, 527–536. [Google Scholar]
- Li, F.; Yi, Y.; Guo, X.; Qi, W. Performance evaluation of research universities in mainland China, Hong Kong and Taiwan: Based on a two-dimensional approach. Scientometrics 2012, 90, 531–542. [Google Scholar] [CrossRef]
- Matthews, A.P. South African universities in world rankings. Scientometrics 2012, 92, 675–695. [Google Scholar] [CrossRef]
- Wu, H.Y.; Chen, J.K.; Chen, I.S.; Zhuo, H.H. Ranking universities based on performance evaluation by a hybrid MCDM model. Measurement 2012, 45, 856–880. [Google Scholar] [CrossRef]
- Abramo, G.; Cicero, T.; D'Angelo, C.A. A sensitivity analysis of research institutions’ productivity rankings to the time of citation observation. J. Informetrics 2012, 6, 298–306. [Google Scholar] [CrossRef]
- Abramo, G.; D'Angelo, C.A.; Costa, F.D. National research assessment exercises: A comparison of peer review and bibliometrics rankings. Scientometrics 2011, 89, 929–941. [Google Scholar] [CrossRef]
- Franceschet, M.; Costantini, A. The first Italian research assessment exercise: A bibliometric perspective. J. Informetrics 2011, 5, 275–291. [Google Scholar] [CrossRef]
- Vanclay, J.K.; Bornmann, L. Metrics to evaluate research performance in academic institutions: A critique of ERA 2010 as applied in forestry and the indirect H2 index as a possible alternative. Scientometrics 2012, 91, 751–771. [Google Scholar] [CrossRef]
- Research and Development in the Czech Republic. Available online: http://www.vyzkum.cz/ (accessed on 1 April 2013).
© 2013 by the authors; licensee MDPI, Basel, Switzerland. This article is an open access article distributed under the terms and conditions of the Creative Commons Attribution license (http://creativecommons.org/licenses/by/3.0/).
Share and Cite
Fiala, D. Science Evaluation in the Czech Republic: The Case of Universities. Societies 2013, 3, 266-279. https://doi.org/10.3390/soc3030266
Fiala D. Science Evaluation in the Czech Republic: The Case of Universities. Societies. 2013; 3(3):266-279. https://doi.org/10.3390/soc3030266
Chicago/Turabian StyleFiala, Dalibor. 2013. "Science Evaluation in the Czech Republic: The Case of Universities" Societies 3, no. 3: 266-279. https://doi.org/10.3390/soc3030266
APA StyleFiala, D. (2013). Science Evaluation in the Czech Republic: The Case of Universities. Societies, 3(3), 266-279. https://doi.org/10.3390/soc3030266