
Article

Driving Patient eWOM: The Role of Perceived Value in Health Care Services

by
Cristina Soare
1,
Florentina Gherghiceanu
1,
Traian Soare
1,*,
Victor Lorin Purcărea
1,
Consuela-Mădălina Gheorghe
2,
Lucia Bubulac
3,* and
Iuliana-Raluca Gheorghe
1
1
Marketing and Medical Technology Department, Faculty of Medicine, “Carol Davila” University of Medicine and Pharmacy, 050474 Bucharest, Romania
2
Modern Languages Department III, “Carol Davila” University of Medicine and Pharmacy, 050474 Bucharest, Romania
3
Department of Family Medicine III, Faculty of Medicine, “Carol Davila” University of Medicine and Pharmacy, 050474 Bucharest, Romania
*
Authors to whom correspondence should be addressed.
Societies 2026, 16(5), 166; https://doi.org/10.3390/soc16050166
Submission received: 9 March 2026 / Revised: 27 April 2026 / Accepted: 15 May 2026 / Published: 19 May 2026

Abstract

Due to the health information asymmetry, the upsurge of Patient Online Communities (POCs) and Patient Social Media groups has increased the importance of electronic word-of-mouth (eWOM) in health care, influencing individuals’ health decisions, as well as a medical organization’s image. This study investigates the association between the multidimensional perceived value of patients and their eWOM intentions in health care services, based on Art Weinstein’s adapted Perceived Value framework. According to this framework, perceived value comprises perceived quality, perceived service outcome, non-monetary costs, and organizational image. Data were collected from 210 Cardiology patients and analyzed using Partial Least Squares Structural Equation Modeling (PLS-SEM). Findings of this study revealed that perceived value is positively associated with eWOM intentions within this sample, which highlights the practical importance of enhancing patient experience. As perceived value improves, it may be associated with increased patient-generated content in the form of eWOM. This study provides practical insights and contributes to the understanding of the patients’ perceived value in engaging in health-related eWOM.

1. Introduction

Understanding how patients perceive and assess health care services has become a major focus of both academic research and managerial practice in competitive and consumer-driven health care markets. The digitalization, the necessity of greater transparency in medical information, patient empowerment, and increased competition brought significant changes in modern health care systems [1,2,3,4]. These advancements have transformed patients’ roles from passive receivers of treatment to active decision-makers. Such transformation was visible in the patient-generated content, in the shape of electronic word-of-mouth (eWOM), which brought also notable contributions to the digital health ecosystems [5,6,7].
Health care services differ from other types of services due to their high credibility characteristics, strong emotional involvement, high perceived risk, and a substantial knowledge asymmetry between providers and patients [8,9]. Even after the health care consumption stage, patients often lack the technical know-how required to objectively assess clinical outcomes [10]. As a result, while making decisions about health care providers, be they specialists or organizations, patients mainly rely on subjective assessments of their service experiences, namely, the functional attributes [11]. This change has been supported by the growth of POCs, health forums, and social media platforms, which allow people to share opinions and experiences that may impact other persons’ health care decisions [12,13]. Thus, eWOM can be considered as a social process embedded within a health care system [14], which may contribute to strengthening the trust in health care services, enhanced perceptions of health service quality or satisfaction, and patient empowerment.
Perceived value has been acknowledged to be a core concept in Marketing and Services Research, which refers to a consumer’s overall evaluation of a service’s usefulness, based on the perceived benefits in comparison to the sacrifices made [15]. Subsequent research extended this conceptualization by emphasizing how value perceptions are subjective, experiential, and multifaceted [16,17]. Therefore, perceived value is a cognitive mechanism used to interpret experiences, defend choices, and decide on future behavioral intentions, especially in health care services, when patients frequently cannot directly assess technical outcomes, due to information asymmetry [18]. Building on this, Weinstein developed a comprehensive framework that conceptualizes perceived value as being made-up of costs for sacrifices, while benefits were defined by perceived quality, perceived service outcome, and organizational image [19]. This framework may be applicable in health care services because patients assess more the functional attributes, such as empathy, accessibility, safety, waiting time, emotional support, and tangible elements [20,21].
Moreover, perceived value has long been known to predict loyalty and satisfaction [22,23,24,25], but its relationship to eWOM has attracted increasing scholarly interest, due to its contributions at multiple levels in the health care field: the applicability of eWOM at micro level refers to the patient shared experience, the eWOM application at meso level may refer to building an organization’s online image or online reputation, whereas the applicability of eWOM at macro level, namely, at system or society levels, may refer to shaping regulations, rules or policies, based on the patients’ needs and perceptions. Similarly, according to the Services Research field, higher perceived value tends to encourage favorable online reviews, and recommendations [26,27], but in health care services, there are still significant gaps in understanding how patients form their perceived value and if there is an association with eWOM engagement. Previous studies have mostly examined individual factors as predictors of patient intentions, such as satisfaction, trust, or service quality [28,29]. Although these studies offer insightful information about health care service experiences, they frequently consider value-related constructs as separate variables rather than considering perceived value as a comprehensive, multifaceted evaluation process in which patients concurrently assess the advantages and disadvantages of health care services [19]. Additionally, although the Marketing scientific literature acknowledges perceived value as a key factor for influencing consumer behavior, empirical studies examining how it directly influences eWOM, especially in health care settings, are limited. Previous studies on perceived value and eWOM have mostly focused on travel, retail, and aviation [26,27,30], whereas studies on health care mostly examined online reviews [31] or patient satisfaction [32] separately rather than linking them into a multidimensional concept.
In an era of digital transparency, where online patient opinions can impact organizational reputation and image [33], and future patients’ decision-making [34], experts must understand this association [35,36]. The current study conceptualizes perceived value as a multidimensional construct comprising perceived quality, perceived service outcome, organizational image, and non-monetary costs, and it aims to investigate the role of perceived value as an antecedent of patients’ intentions to engage in eWOM about health care services. The objectives of this study are twofold as follows: (1) to apply Weinstein’s adapted Perceived Value framework, including perceived quality, perceived service outcome, non-monetary costs, and organizational image in health care services, and (2) to investigate how perceived value in health care services is associated with patients’ intentions to engage in eWOM.

2. Theoretical Background

A theoretical background for understanding online patient behavior in health care services is provided by the combination of Weinstein’s adapted Perceived Value framework with Social Identity Theory [14]. This combination highlights the relational and experiential processes that trigger online patient-generated content [1,37], clarifies the association between the organizational image and eWOM [36,38], and enables researchers to distinguish how different value components shape online communication behaviors [15,39]. In the health care field, where services are mostly credence-based, and patients find it challenging to evaluate clinical quality (technical quality) [40], even after consumption, this approach becomes highly important [41].
Patients’ evaluations of clinical effectiveness, safety, diagnostic accuracy, and treatment efficacy are reflected in perceived quality [42,43,44]. Although technical quality is essential, patients frequently lack the knowledge necessary to assess clinical outcomes directly [45]. As a consequence, patients use functional service attributes, including trustworthiness elements, experts’ communication skills, the presence and accessibility to medical equipment, and organization image, in order to determine the functional quality [46,47,48]. These functional quality cues may affect the likelihood of patients to share online experiences and opinions, implicitly, and engage in eWOM [5,49].
Moreover, the potential results of patient care experience are captured by the perceived service outcome [1,42,50]. Patients’ desire to engage in positive eWOM is often influenced by their overall assessment of care [14,51,52].
According to Weinstein’s Perceived Value framework, costs are perceived as sacrifices [19]. In this study, this perspective was adapted by referring to positive non-monetary costs as benefits. More exactly, in the health care field, non-monetary costs, such as psychological, temporal, and physical sacrifices, are important [15,16,53]. Patients often experience worry, administrative complex accessibility, travel burdens, and waiting times, all of which may lower perceived value [9,54,55], and engage in negative eWOM [5]. If these are being limited or managed properly, then they may become benefits, which would lead to positive eWOM.
A health care provider’s credibility is reflected in its organizational image [36,56,57]. Strong branding increases perceived benefits [40,51,58], and triggers positive eWOM [59].
Patients frequently rely on online reviews and eWOM to reduce ambiguity and make informed decisions because it is challenging to evaluate health care services’ trustworthiness [60,61]. According to research [12,62], patients are encouraged to share their experiences online, not just when they are satisfied, but also when emotional, relational, or process-related aspects of value are dominant [63]. By combining these concepts, perceived value can be considered an important antecedent of eWOM.
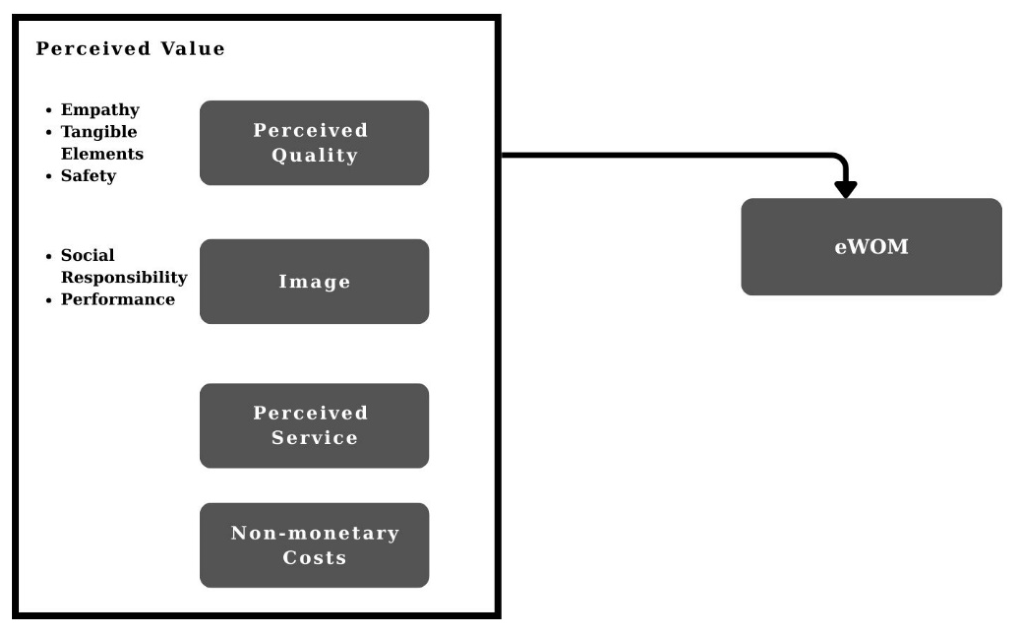
Based on Weinstein’s adapted Perceived Value framework, the current study proposes a model in which patients’ eWOM intentions are associated with perceived value, defined as a multidimensional construct comprising perceived quality, perceived service outcome, non-monetary costs, and organizational image (Figure 1).

3. Materials and Methods

3.1. Study Design and Participants

A cross-sectional design was used to examine the relationship between perceived value and eWOM engagement in a Romanian Cardiology health care private organization. The health care private organization is a medium-sized business practice and is located in Bucharest.
The target population consisted of patients, who needed Cardiology care during March–April 2025. Participants received an envelope containing two predefined forms: an informed consent form and the data collection questionnaire. The informed consent form included the study’s aim, the voluntary condition of participation, the confidentiality of the collected and processed data, and the use of anonymized data for research purposes.
The inclusion criteria of the participants were: (1) aged 18 years or older, (2) having used the organization’s services at least three times because it may help in filtering out initial first-time opinions which do not accurately reflect the service experience, and (3) having access to the Internet or Social Media. Patients with cognitive impairments, who were unable to provide informed consent, and required emergency consultations were excluded. A non-probabilistic, purposive sampling technique was used to select participants, as it allowed for the inclusion of individuals with relevant health care experiences [64].
Initially, the questionnaire was translated into Romanian by one independent translator, and the resulting translation was back-translated into English to verify accuracy and identify potential linguistic inconsistencies. Minor improvements were made to one item of the questionnaire.
Before the main data collection, a pilot study was conducted with five participants in order to evaluate the clarity, relevance, and the comprehensibility of the items of the questionnaire, and to ensure the cross-cultural adaptation of the research instrument [65]. The pilot study participants were asked to complete the questionnaire and provide feedback regarding the wording and the structure of the items [66]. Based on the received feedback, minor revisions were made to improve the clarity of four statements. The participants involved in the pilot study were not included in the main study.
In the main study, a total of 350 respondents were approached, of which 210 completed questionnaires (response rate = 60%) were retained for analysis after screening for completeness of the questionnaire and informed consent. This sample size meets the minimum requirements for structural equation modeling (SEM) [67], ensuring sufficient statistical power (power = 0.70, α = 0.05). The sample consisted of 58.1% women and 41.9% men, with the mean age of 57.62 (SD = 15.49). A total of 46.2% of respondents had a university degree, 59.5% reported being married, and the majority of patients’ motivation was the monthly usual consultation (43.3%).
The socio-demographic profile of patients is depicted in Table 1.

3.2. Instruments

Data were collected using a self-administered questionnaire on paper, developed based on previous research. The self-administered questionnaire consisted of 6 sections, as follows: (1) the first section collected socio-demographic information about the patients, (2) the second section comprised the subdimensions of perceived quality, (3) the third section comprised the subdimensions of image, (4) the fourth section referred to the perceived service outcome, (5) the fifth section collected information about the non-monetary costs, and (6) the sixth section comprised the items of measuring eWOM engagement intention. Patients agreed with the statements of the questionnaire on a 5-point Likert scale, which varied from 1-Strongly Disagree to 5-Strongly Agree. Table 2 summarizes the sources of the instruments and their adapted items from the literature.

3.3. Statistical Analysis

The analyses consisted of two stages, as follows: (1) the data were collected and processed in SPSS version 24 (IBM Corp., Armonk, NY, USA), and frequencies and percentages were used to describe the socio-demographic characteristics of the main study’s sample; and (2) the main study was analyzed in both SPSS version 24 and SmartPLS version 4 (Hamburg, Germany). An Exploratory Factor Analysis was conducted in SPSS, followed by reliability and validity testing and hypothesis testing in SmartPLS. Exploratory Factor Analysis (EFA) was conducted to examine the underlying structure of the questionnaire items, identify coherent factors, and remove any items that did not meaningfully contribute to their intended constructs, thereby ensuring the reliability and validity of the measurement model [72].
To address the potential influence of the Common Method Bias (CMB), which may occur when data on independent and dependent variables are collected from the same source, multiple tests for checking CMB were conducted. First, Harman’s single-factor test was performed in SPSS version 24 to check if a single factor accounted for the majority of the variance. If the test shows that no single factor explains more than 50% of the total variance, then CMB would not be a potential concern [73]. Secondly, the Variance Inflation Factors (VIFs) were calculated in SmartPLS for the formative constructs to examine multicollinearity [67].
Consequently, PLS-SEM was employed to conduct a more in-depth analysis and test the association between perceived value and eWOM. PLS-SEM is a variance-based structural equation modeling approach suitable for theory development [74]. It is commonly applied in prediction-oriented research and in testing theoretical relationships, as it offers flexibility for analyzing complex models [75]. Specifically, PLS-SEM was used for this study because the model had a complex structure, including multiple constructs, higher-order constructs, and indicators that were both formative and reflective [67]. This analysis followed a two-stage approach [67]: (1) the assessment of the measurement model’s reliability, by assessing the internal consistency with Cronbach’s Alpha Coefficient and the Composite Reliability (CR), while the validity of the model was examined with both Convergent Validity through the Average Variance Extracted (AVE), and the discriminant validity was tested using cross-loadings, the Fornell–Larcker criterion and the Heterotrait–Monotrait ratio (HTMT), and (2) the structural model which assessed the association between the latent variables, Perceived Value and eWOM, which included the evaluation of the path coefficient (β), Coefficient of Determination (R2), the predictive relevance (Stone–Geisser Q2), and the effect size (f2). A p-value ≤ 0.05 was considered statistically significant.

4. Results

Following the pilot study, the Exploratory Factor Analysis (EFA) was assessed.

4.1. The Exploratory Factor Analysis

The suitability of the data for EFA was determined by two tests: (1) the Kaiser–Meyer–Olkin (KMO) measure of sampling adequacy, which had a value greater than 0.6 (KMO = 0.94), and (2) Bartlett’s Test of Sphericity, which revealed that the items were correlated (p < 0.05). The two tests emphasized that the study data were suitable for the EFA.
In the EFA, the Principal Component Analysis with Varimax rotation and factor extraction was guided by a fixed number of factors (i.e., 8), and only those with loadings above 0.40 were retained. Initially, all items were included, but several were dropped due to low factor loadings (<0.50) or cross-loadings, indicating that the following items were dropped: EM3, ET6, PS4, PER3, ET4, ET8, SI1, PS3, RS2, CNM4 and CNM6. After item refinement, the final EFA yielded an 8-factor solution with an explained variance of 84.60%, and all retained items loaded on the assigned factors, demonstrating a clean structure and a suitable basis for proceeding with the PLS-SEM analysis.

4.2. Common Method Bias Analysis

In what concerns Harman’s single-factor test, it was revealed that an unrotated factor analysis with a single factor accounted for 48,81% of the total variance. Despite obtaining a value below the threshold of 50%, taking into consideration the limitations of the test, potential method variance can still be a potential problem [73]. As a complementary approach [76,77], to strengthen the assessment, full collinearity VIFs of the formative constructs were also evaluated.

4.3. PLS-SEM Analysis

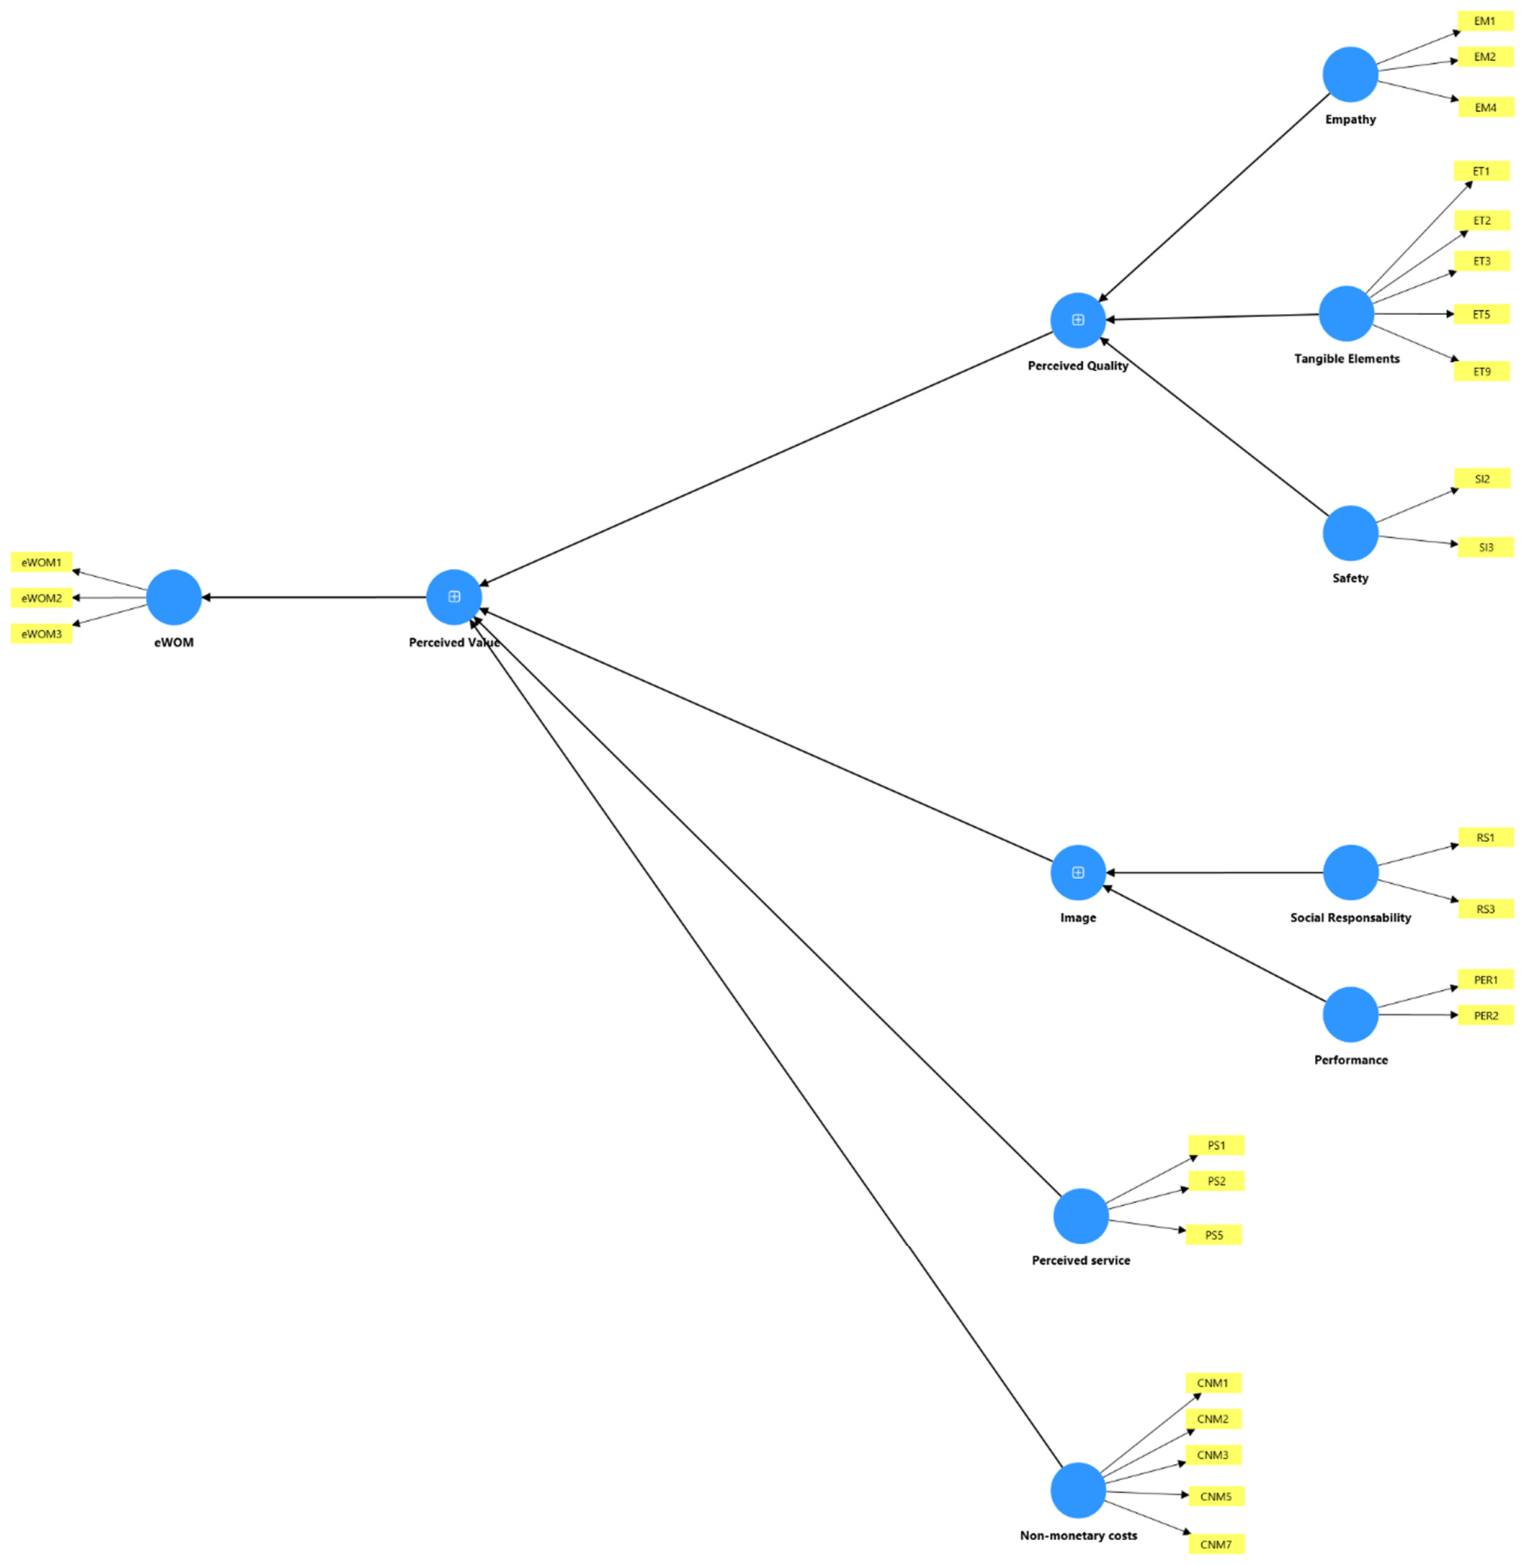
The PLS-SEM model was a formative–reflective third-order (higher-order) construct. The formative second-order construct, Perceived Quality, was composed of the reflective first-order constructs, Empathy, Tangible Elements, Safety, and the second-order construct, Image, was composed of the reflective first-order constructs, Social Responsibility and Performance. Perceived Value was a formative third-order construct, which comprised the formative second-order constructs Perceived Quality and Image, and the reflective first-order constructs Perceived Service Outcome and Non-monetary costs. The eWOM construct was also a first-order reflective construct.
Following the recommendations for higher-order constructs in PLS-SEM [67], the measurement model begins by assessing the reliability and validity of the first-order constructs, then assessing the validity of the second- and third-order constructs. After assessing the measurement model, the structural model is determined.

4.3.1. Measurement ModelReliability and Validity

Reliability and Validity
The reliability of the first-order constructs was evaluated using Cronbach’s Alpha Coefficient and Composite Reliability (CR) values. The outcomes of the factor loadings after EFA, along with the reliability and validity of the constructs, are presented in Table 3. All Cronbach Alpha Coefficient and CR values were higher than the recommended threshold of 0.70 [67]. In addition, the Average Variance Extracted (AVE) values, which measured Convergent Validity, were greater than 0.50, indicating that more than 50% of the variance in the indicators was captured by the construct [67].
Discriminant validity was assessed through cross-loadings, the Fornell–Larcker criterion, and the Heterotrait–Monotrait Method (HTMT). Table 4 depicts the cross-loadings of all the items. It can be observed that all factor loadings exceed their cross-loadings, suggesting discriminant validity. The results of the discriminant validity test using the criterion of Fornell–Larcker and the Heterotrait–Monotrait Method (HTMT) are illustrated in Table 5. According to Table 5, the AVE values are greater than their correlations with the other constructs of the model, and the HTMT values below 0.90 in lenient contexts indicate satisfactory discriminant validity [76,77].
Validating Higher-Order Constructs
Perceived quality and Image were formative second-order constructs, and perceived value was a formative third-order construct. Perceived quality was built on the lower-order constructs—Empathy, Tangible Elements, and Safety—while Image was built on the lower-order constructs—Social Responsibility and Performance.
To assess multicollinearity among the higher-order constructs, Variance Inflation Factors (VIFs) were computed. In formative HOCs, although VIF values ≤ 5 are preferred [76], moderate multicollinearity (VIF > 6) is acceptable if the outer weights are statistically significant [78,79]. In the present study, Empathy and Safety constructs showed moderate collinearity, but were acceptable because their outer weights were significant (Empathy construct: w = 0.45, t = 21.08, p = 0.001; Safety construct: w = 0.47, t = 21.92, p = 0.001) (Table 6). In addition, they were retained because they were theoretically justifiable, and that they should rarely be removed because the formative measurement theory requires that indicators collectively represent the full domain of the construct, as defined in the conceptualization stage [67]. Hence, the second formative higher-order constructs were validated.
In what concerns the formative third higher-order construct, Perceived Value, the VIF values of the constructs Perceived Quality and Perceived Service Outcome showed moderate multicollinearity (VIF > 6), resulting in non-significant outer weights (Perceived Quality construct: w = 0.09, t = 0.38, p = 0.69; Perceived Service Outcome construct: w = 0.40, t = 1.61, p = 0.10) (Table 7). However, if the corresponding outer loadings are sufficiently high (>0.50) and are statistically significant (p < 0.05), then the constructs should be retained, especially if they have theoretical justification [80]. Thus, Perceived Quality and Perceived Service constructs were retained because of their high statistically significant outer loadings (i.e., Perceived Quality construct: λ = 0.73, p = 0.001, Perceived Service Outcome construct: λ = 0.77, p = 0.001). Moreover, the Non-monetary costs construct presented a non-significant weight (w = 0.14, t = 1.30, p = 0.19), but significant substantial outer loading (λ = 0.59, p = 0.001). Therefore, all four dimensions were retained because they contributed to the validation of the Perceived Value construct (Figure 2).

4.3.2. Structural Model

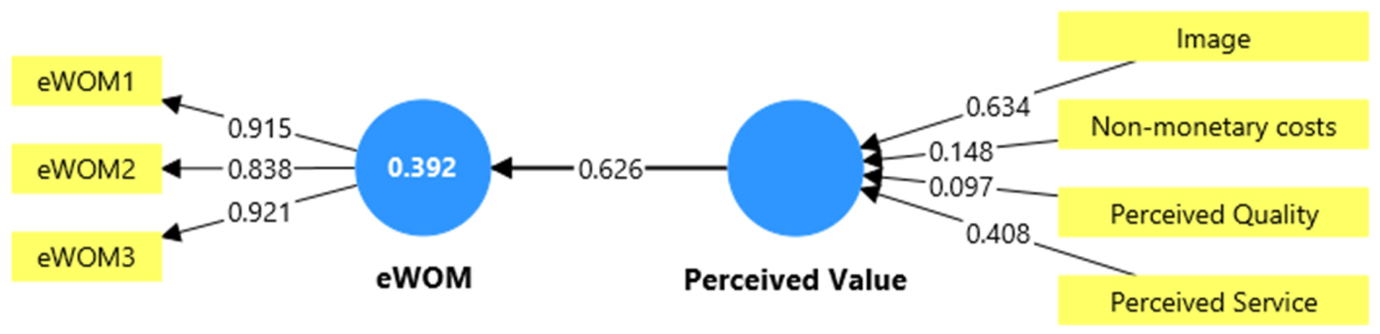
The next step in the analysis was to assess the association between perceived value and eWOM, which was supported, showing a significant positive association between the constructs (β = 0.62, t = 16.78, p = 0.001) for this sample (Figure 3). In this single-site context, the Coefficient of Determination (R2 = 0.39) and the effect size (f2 = 0.64) suggested that perceived value explained a moderate proportion of variance in eWOM, while the predictive relevance (Q2 = 0.35) revealed that the model was acceptable [77].

5. Discussion

The findings of this study indicated that there may be a positive association between perceived value and the engagement in eWOM (β = 0.62, t = 16.78, p = 0.001), suggesting that within this sample, higher perceived value, comprising perceived quality, perceived service outcome, non-monetary costs, and organizational image, was associated with a greater patients’ eWOM engagement. Although perceived value appears to have a relatively large effect size in association with the explained variance of eWOM (f2 = 0.64) [76], it is highly recommended to interpret this finding within the context of the specific sample. Thus, the findings of this study may be a starting point for future research, however they should be interpreted with consideration to the study-specific context and sample characteristics [42].

5.1. Theoretical Contributions

Firstly, it may offer potential preliminary support for the Weinstein’s adapted multidimensional perceived value framework in the health care context [19]. Accordingly, while prior research has explored perceived value in other fields, this study extends its application to credence-based services, such as health care services [81].
Secondly, the findings may contribute to the existing body of literature about eWOM, perceived value, and health care services. Prior research has shown that patients’ online evaluations and service perceptions are associated with their eWOM intentions and health-related decisions [13], while broader eWOM literature suggests that higher perceived value may be associated with greater patient eWOM engagement, often through mediating factors such as satisfaction and attitude [82].
Thirdly, by integrating non-monetary costs, the study extends previous research by emphasizing that positive patient costs, such as reduced waiting time, lower effort, and decreased psychological burden, may also play a role in eWOM engagement. In this study, this finding reinforces the importance of considering both perceived benefits and the positive aspects of patient sacrifices, when examining patients’ perceived value and its potential association with eWOM in Cardiology services [16,54].

5.2. Practical Contributions

From a managerial perspective, within this study, it was highlighted that perceived value may be associated with greater eWOM engagement. Improving perceived value requires attention to the multiple facets of health care services, including service quality, organizational image, perceived service outcome, and non-monetary costs, all of which may be associated with the patients’ eWOM engagement [83].
Service quality becomes essential across both technical and functional attributes of health care services. Health care organizations need to provide high-quality medical care and ensure that tangible elements, such as modern facilities and equipment, are reliable and available. These tangible aspects, combined with functional quality, enhanced patients’ perceived value and comfort during their care [42,81]. At the same time, how staff interact with patients, by showing empathy and reassurance, makes patients feel understood and cared for, which may be linked to more positive reported experiences [41,52,55].
A health care organization’s image may have a significant role in shaping perceived value. A strong image, built on both performance excellence and social responsibility, fosters patient trust and confidence, making patients more likely to engage in eWOM [56,57]. At the same time, reducing non-monetary costs such as long waiting time, complex administrative processes, and psychological stress further may be linked to perceived value. Health care organizations can address these challenges by simplifying administrative processes, implementing online appointment systems, or interacting with patients by email or online consumer relationship management programs, thereby reducing both effort and stress while improving overall patient perceived value [55,83]. Moreover, health care organizations may need to implement active online image and reputation management systems, so as to monitor the patients’ generated eWOM content [84] and to strategically use it in the co-creation value experience of patients [85]. By coordinating improvements in clinical quality, perceived service, non-monetary costs, and organizational image, health care organizations may increase the perceived value, foster loyalty, and encourage positive eWOM, which is a core factor in patient decision making and health care organization reputation [4,86].
At a broader level, the association between perceived value and eWOM engagement may be interpreted as a potential shift toward more participatory and patient-centered health environments [87,88]. However, it should be emphasized that the empirical model of this study is situated at the individual level; therefore, any broader societal implications remain theoretical, as they are not directly examined within the present analysis. From this perspective, based on the fact that eWOM actively contributes to building the aggregated blocks of user-generated content, which accumulates online and remains accessible over time for other users [89,90], in health care, it may become a distribution infrastructure of information. Aggregated eWOM may contribute to the reputational governance mechanisms in the health care field by increasing visibility of patient experiences, which, in its turn, may stimulate improvements in service quality and non-monetary costs. In addition, eWOM information may complement already formal patient satisfaction monitoring systems, offering policymakers and health care specialists real-time insights into the service performance or patient concerns [89].

5.3. Limitations

Despite its contributions, the findings of this study should be interpreted with caution. Firstly, this study extended the application of Weinstein’s Perceived Value framework in an adapted format for the health care context, in a single-site, using a cross-sectional design. This limits the establishment of causal relationships, and the direct transferability of the findings to other health care systems, populations, or cultural settings, and the generalizability of the findings. Longitudinal research would provide more insights into how perceived value and eWOM intentions develop over time in the health care field.
Secondly, in this study, purposive sampling was used to target patients with internet access, which may also limit the generalizability of the findings, particularly to rural populations or those with low electronic health literacy (eHL) [91]. The sampling method might have also introduced selection and volunteer bias, excluding the patients who had discontinued care. Moreover, the study focused exclusively on Cardiology patients from Romania, which may limit its applicability and the generalizability to other health care settings, such as other medical specialties or long-term care, where patient experiences and eWOM engagement may differ substantially [1].
Thirdly, the reliance on self-reported measures may be subject to social desirability or recall bias, and reported intentions might not fully reflect actual online intention. Future research can rely on other online channels, such as Social Media, online reviews, or Patient Online Communities, to provide a more comprehensive overview [83].
Finally, the study did not consider potential moderating and mediating factors. The moderating factors, such as age, health status, prior experience with digital tools, or cultural differences, may influence the association between perceived value and eWOM intentions [92]. Future research could also explore the mediating factors that explain how perceived value is associated with eWOM [93]. Patient satisfaction is among the most frequently mentioned and researched mediators, as perceived value is a key antecedent of satisfaction in the Services field [4]. When patients perceive that health care services provide significant benefits in comparison to the efforts or costs involved, they are more likely to be satisfied and subsequently share eWOM-type messages. Other potential mediators include trust in health care providers and patient loyalty, both of which have been shown to encourage recommendation behaviors and eWOM in health care services.

5.4. Future Research Directions

Despite the limitations, the study offers useful theoretical and practical insights and provides a starting point for future research in order to extend or assess the association between perceived value and eWOM engagement across different other health care contexts. Firstly, health care managers and administrators may use these results to design strategies to enhance perceived value and encourage positive eWOM. Future studies could, therefore, investigate how managerial strategies, as for instance, improvements in service quality, patient communication, and non-monetary costs, translate into positive eWOM among their patients.
Secondly, health care professionals, including physicians and nurses, could use these insights to improve interactions. Future research may examine how interpersonal factors such as empathy, trust, and patient-centered communication influence perceived value and patients’ eWOM intentions.
Thirdly, health policymakers and public health institutions may benefit from understanding how perceived value shapes eWOM communication in the medical field. Future studies could explore how patient experience initiatives, health reforms, or digital health policies support building perceived value and eWOM intention and behavior across different health systems.
Fourthly, developers of digital health technologies, such as telemedicine platforms or patient portals, may shape how patients evaluate health care services, and encourage them to share their experiences online, by designing more user-friendly communication channels that enhance the perceived ease of use and usefulness among patients. At the same time, it is also important to design and implement feedback and rating systems for health care organizations and for the health care information that would facilitate credible eWOM exchange. For health care organizations and for a community, experts of advanced technology may use different analytic methods to identify the antecedents of perceived value and eWOM engagement as aggregated discussions. Further studies may be conducted in order to investigate the use of AI-oriented emotion analysis for monitoring positive or negative eWOM.
Marketing specialists may also benefit from the study’s findings. Future research could examine how marketing strategies that highlight patient value can trigger more positive eWOM. Health care organizations can use patient-centered communication campaigns, by sharing success stories, emphasizing quality of care, and promoting safety and empathy during patient–physician interactions, to build trust and encourage patients to share their experiences online. With the help of AI, predictive analytics, based on eWOM messages, may be implemented in order to anticipate the patient needs, as well as strengthen the online image or reputation of the health care provider.
Digital engagement strategies, including patient portals, Social Media campaigns, and interactive health applications, can provide patients with convenient access to information and support, increasing satisfaction and the likelihood of positive eWOM. Additionally, transparent feedback can reinforce a culture of openness, making patients feel that their eWOM messages are useful.

6. Conclusions

By using Weinstein’s adapted Perceived Value framework, in this study, patients’ perceived value may be associated with greater eWOM engagement in health care services. Thus, in this specific context, greater perceived value in Cardiology services may be linked to improved patient experiences and eWOM engagement.

Author Contributions

Conceptualization, C.S., V.L.P. and I.-R.G.; methodology, C.S., L.B. and I.-R.G.; software, T.S. and I.-R.G.; validation, C.S., T.S. and I.-R.G.; formal analysis, C.S. and I.-R.G.; investigation, C.S., F.G. and T.S.; resources, C.S. and T.S.; data curation, C.S. and I.-R.G.; writing—original draft preparation, C.S., C.-M.G., L.B. and I.-R.G.; writing—review and editing, F.G., C.-M.G. and L.B.; visualization, F.G., V.L.P. and C.-M.G.; supervision, C.S., V.L.P. and I.-R.G. All authors have read and agreed to the published version of the manuscript.

Funding

This research received no external funding.

Institutional Review Board Statement

The study was conducted in accordance with the Declaration of Helsinki, and approved by the Ethics Committee of the private health care organization VMH Heart Medical Consulting S.R.L. (protocol code no. 1; date of approval: 3 March 2025).

Informed Consent Statement

Informed consent was obtained from all subjects involved in the study.

Data Availability Statement

The raw data supporting the conclusions of this article will be made available by the authors on request.

Conflicts of Interest

The authors declare no conflicts of interest.

Abbreviations

The following abbreviations are used in this manuscript:
AIArtificial Intelligence
AVEAverage Variance Extracted
CMB Common Method Bias
CRComposite Reliability
EFAExploratory Factor Analysis
eHLElectronic Health Literacy
eWOMElectronic Word-of-Mouth
f2Effect size
HOCHigher Order Construct
HTMTHetrotrait-monotrait ratio
LOCLower Order Construct
PLS-SEMPartial Least Squares Structural Equation Modeling
POCPatient Online Community
Q2Stone-Geisser Q2
R2Coefficient of determination
VIFVariance Inflation Factor

References

  1. Berry, L.L.; Bendapudi, N. Health care: A fertile field for service research. J. Serv. Res. 2007, 10, 111–122. [Google Scholar] [CrossRef]
  2. Porter, M.E.; Lee, T.H. The strategy that will fix health care. Harv. Bus. Rev. 2013, 91, 50–70. [Google Scholar] [CrossRef]
  3. Bratucu, R.; Gheorghe, I.R.; Purcarea, R.M.; Gheorghe, C.M.; Popa-Velea, O.; Purcarea, V.L. Cause and effect: The linkage between the health information seeking behavior and the online environment—A review. J. Med. Life 2014, 7, 310–316. [Google Scholar]
  4. Ladhari, R.; Michaud, M. eWOM effects on hotel booking intentions. Int. J. Hosp. Man. 2015, 46, 36–45. [Google Scholar] [CrossRef]
  5. Gheorghe, I.R.; Liao, M.N. Investigating Romanian healthcare consumer behaviour in online communities: Qualitative research on negative eWOM. Procedia Soc. Behav. Sci. 2012, 62, 268–274. [Google Scholar] [CrossRef]
  6. Greaves, F.; Ramirez-Cano, D.; Millett, C.; Darzi, A.; Donaldson, L. Harnessing the cloud of patient experience: Using social media to detect poor quality healthcare. BMJ Qual. Saf. 2013, 22, 251–255. [Google Scholar] [CrossRef]
  7. Mwogosi, A.; Mambile, C. Digital ecosystems for healthcare communication and collaboration: A scoping review. Digit. Health 2025, 11. [Google Scholar] [CrossRef] [PubMed]
  8. Dahl, A.J.; Peltier, J.W.; Milne, G.R. Reducing information asymmetry and increasing health value co-creation in a rural healthcare context. J. Consum. Aff. 2022, 56, 512–535. [Google Scholar] [CrossRef]
  9. Lovelock, C.; Wirtz, J. Services marketing: People, Technology, Strategy, 8th ed.; World Scientific Publishing: Hackensack, NJ, USA, 2016. [Google Scholar]
  10. Lin, X.; Wang, M.; Zuo, Y.; Li, M.; Lin, X.; Zhu, S.; Zheng, Y.; Yu, M.; Lamoureux, E.L. Health literacy, computer skills and quality of patient-physician communication in Chinese patients with cataract. PLoS ONE 2014, 9, e107615. [Google Scholar] [CrossRef]
  11. Kim, D.H.; Kim, B.; Jang, S.Y.; Lee, S.G. Association between patient choice of provider and patient-reported experience. Int. J. Qual. Health Care 2023, 35, mzad093. [Google Scholar] [CrossRef]
  12. Hennig-Thurau, T.; Gwinner, K.P.; Walsh, G.; Gremler, D.D. Electronic word-of-mouth via consumer-opinion platforms. J. Interact. Mark. 2004, 18, 38–52. [Google Scholar] [CrossRef]
  13. Shan, W.; Wang, J.; Shi, X.; Evans, R.D. The impact of electronic word-of-mouth on patients’ choices in online health communities: A cross-media perspective. J. Bus. Rev. 2024, 173, 114404. [Google Scholar] [CrossRef]
  14. Araújo, F.; Brandão, A.; Shaikh, A.A. Exploring the influence of patient testimonials on healthcare services: A social identity theory perspective. Eur. Bus. Res. 2025, 37, 532–557. [Google Scholar] [CrossRef]
  15. Zeithaml, V.A. Consumer perceptions of price, quality, and value. J. Mark. 1988, 52, 2–22. [Google Scholar] [CrossRef]
  16. Sweeney, J.C.; Soutar, G.N. Consumer perceived value: The development of a multiple item scale. J. Retail. 2001, 77, 203–220. [Google Scholar] [CrossRef]
  17. Sánchez-Fernández, R.; Iniesta-Bonillo, M.A. The concept of perceived value: A systematic review. Mark. Theory 2007, 7, 427–451. [Google Scholar] [CrossRef]
  18. Gheorghe, C.M.; Purcărea, V.L.; Gheorghe, I.R. The development of a multidimensional Consumer Perceived Value scale in ophthalmology services. Rom. J. Ophthalmol. 2019, 63, 339–345. [Google Scholar] [CrossRef]
  19. Weinstein, A. Superior Customer Value: Strategies for Winning and Retaining Customers; CRC Press: Boca Raton, FL, USA, 2012. [Google Scholar]
  20. Toussaint, J.S.; Berry, L.L. The promise of Lean in health care. Mayo Clin. Proc. 2013, 88, 74–82. [Google Scholar] [CrossRef] [PubMed]
  21. Flavián, C.; Guinalíu, M.; Gurrea, R. The role of perceived usability, satisfaction and trust on website loyalty. Inf. Manag. 2006, 43, 1–14. [Google Scholar] [CrossRef]
  22. Fornell, C.; Johnson, M.D.; Anderson, E.W.; Cha, J.; Bryant, B.E. The American customer satisfaction index: Nature, purpose, and findings. J. Mark. 1996, 60, 7–18. [Google Scholar] [CrossRef]
  23. Oliver, R.L. Whence consumer loyalty? J. Mark. 1999, 63, 33–44. [Google Scholar] [CrossRef]
  24. Caruana, A. Service loyalty: The effects of service quality and the mediating role of customer satisfaction. Eur. J. Mark. 2002, 36, 811–828. [Google Scholar] [CrossRef]
  25. Nguyen, N.X.; Tran, K.; Nguyen, T.A. Impact of service quality on in-patients’ satisfaction, perceived value, and customer loyalty: A mixed-methods study from a developing country. Patient Pref. Adherence 2021, 15, 2523–2538. [Google Scholar] [CrossRef] [PubMed]
  26. Previte, J.; Russell-Bennett, R.; Mulcahy, R.; Hartel, C. The role of emotional value for reading and giving eWOM in altruistic services. J. Bus. Res. 2019, 99, 157–166. [Google Scholar] [CrossRef]
  27. Kim, H.L.; Hyun, S.S. The relationships among perceived value, intention to use hashtags, eWOM, and brand loyalty of air travelers. Sustainability 2019, 11, 6523. [Google Scholar] [CrossRef]
  28. Ai, Y.; Rahman, M.K.; Newaz, M.S.; Gazi, M.A.I.; Rahaman, M.A.; Mamun, A.A.; Chen, X. Determinants of patients’ satisfaction and trust toward healthcare service environment in general practice clinics. Front. Psychol. 2022, 13, 856750. [Google Scholar] [CrossRef]
  29. Amarantou, V.; Chatzoudes, D.; Kechagia, V.; Chatzoglou, P.D. The impact of service quality on patient satisfaction and revisiting intentions: The case of public emergency departments. Qual. Manag. Health Care 2019, 28, 200–208. [Google Scholar] [CrossRef]
  30. Nguyen, L.A.; Hoai, A.T. Exploring the dynamics of perceived value, brand image, and eWOM: A path to loyalty in Vietnam’s low-cost airline industry. Int. J. Aviat. Sci. Technol. 2025, 6, 13–23. [Google Scholar] [CrossRef]
  31. Martin, S.; Greiling, D.; Danninger, B. Patient recommendations as determining factor for the choice of physiotherapists. Int. J. Healthc. Manag. 2021, 14, 641–649. [Google Scholar] [CrossRef]
  32. Fikri, E.N.; Jatmiko, S.W.; Setyawan, A.A. Electronic Word-of-Mouth and Patient Satisfaction in Hospital Services: A Systematic Literature Review and Bibliometric Analysis. J. Manaj. Bisnis Kewirausahaan 2026, 6, 1–20. [Google Scholar] [CrossRef]
  33. Mainardes, E.W.; Borba, E.L.; Dalvi, R.B. The impact of patient experience dimensions on hospitals reputation and electronic word-of-mouth. Health Mark. Q. 2024, 41, 407–437. [Google Scholar] [CrossRef]
  34. Purcarea, V.L.; Gheorghe, I.R.; Petrescu, C.M. Credibility elements of eWOM messages in the context of health care services. A Romanian perspective. J. Med. Life 2013, 6, 254–259. [Google Scholar]
  35. Payne, A.; Storbacka, K.; Frow, P. Managing the co-creation of value. J. Acad. Mark. Sci. 2007, 36, 83–96. [Google Scholar] [CrossRef]
  36. Iglesias, O.; Markovic, S.; Singh, J.J. Co-creation: A key link between corporate social responsibility and brand loyalty. J. Bus. Ethics 2018, 163, 151–166. [Google Scholar] [CrossRef]
  37. Vargo, S.L.; Lusch, R.F. Service-dominant logic 2025. Int. J. Res. Mark. 2017, 34, 46–67. [Google Scholar] [CrossRef]
  38. Walsh, G.; Beatty, S.E.; Shiu, E. Customer-based corporate reputation scale: Replication and shot form. J. Bus. Res. 2009, 62, 924–930. [Google Scholar] [CrossRef]
  39. Holbrook, M.B. Consumer Value: A Framework for Analysis and Research; Routledge: London, UK, 1999. [Google Scholar]
  40. Grönroos, C. Service logic revisited: Who creates value? And who co-creates? Eur. Bus. Rev. 2008, 20, 298–314. [Google Scholar] [CrossRef]
  41. Pauli, G.; Martin, S.; Greiling, D. The current state of research of word-of-mouth in the health care sector. Int. Rev. Public Nonprofit Mark. 2023, 20, 125–148. [Google Scholar] [CrossRef]
  42. Parasuraman, A.; Zeithaml, V.A.; Berry, L.L. SERVQUAL: A multiple-item scale for Measuring Consumer Perceptions for Service Quality. J. Retail. 1988, 64, 12–40. [Google Scholar]
  43. Baker, D.A.; Crompton, J.L. Quality, satisfaction and behavioral intentions. Ann. Tour. Res. 2000, 27, 785–804. [Google Scholar] [CrossRef]
  44. Buttle, F.; Burton, J. Does service failure influence customer loyalty? J. Cons. Behav. 2002, 1, 217–227. [Google Scholar] [CrossRef]
  45. Donabedian, A. The quality of care: How can it be assessed? JAMA 1988, 260, 1743–1748. [Google Scholar] [CrossRef]
  46. Bitner, M.J.; Booms, B.H.; Tetreault, M.S. The service encounter: Diagnosing favorable and unfavorable incidents. J. Mark. 1990, 54, 71–84. [Google Scholar] [CrossRef]
  47. Brady, M.K.; Cronin, J.J. Some new thoughts on conceptualizing perceived service quality. J. Mark. 2001, 65, 34–49. [Google Scholar] [CrossRef]
  48. Morcov, M.; Gheorghe, I.R.; Gheorghe, C.M.; Morcov, M.V.; Sporea, C.; Ghiță, M.; Purcărea, V.L. Marketing Communication and Perceived Health Care Quality: Antecedents of Physiotherapists’ Job Satisfaction. Balneo PRM Res. J. 2023, 14, 622. [Google Scholar] [CrossRef]
  49. Soare, T.; Ianovici, C.; Gheorghe, I.R.; Purcărea, V.L.; Soare, C.M. A word-of-mouth perspective on consumers of family medicine services: A case study. J. Med. Life 2022, 15, 655–660. [Google Scholar] [CrossRef]
  50. Homburg, C.; Koschate, N.; Hoyer, W.D. The role of cognition and affect in the formation of customer satisfaction: A dynamic perspective. J. Mark. 2006, 70, 21–31. [Google Scholar] [CrossRef]
  51. Berry, L.L. Relationship marketing of services—Perspectives from 1983 and 2000. J. Relat. Mark. 2002, 1, 59–77. [Google Scholar] [CrossRef]
  52. McColl-Kennedy, J.R.; Vargo, S.L.; Dagger, T.; Sweeney, J.C.; Van Kasteren, Y. Health care customer value cocreation practice styles. J. Serv. Res. 2012, 15, 370–389. [Google Scholar] [CrossRef]
  53. Cronin, J.J.; Brady, M.K.; Hult, G.T.M. Assessing the effects of quality, value, and customer satisfaction on behavioral intentions in service environments. J. Retail. 2000, 76, 193–218. [Google Scholar] [CrossRef]
  54. Andaleeb, S.S. Service quality perceptions and patient satisfaction: A study of hospitals in a developing country. Soc. Sci. Med. 2001, 52, 1359–1370. [Google Scholar] [CrossRef]
  55. Choi, K.S.; Cho, W.H.; Lee, S.; Lee, H.; Kim, C. The relationships among quality, value, satisfaction and behavioral intention. J. Bus. Res. 2004, 57, 913–921. [Google Scholar] [CrossRef]
  56. Keller, K.L. Conceptualizing, measuring, and managing customer-based brand equity. J. Mark. 1993, 57, 1–22. [Google Scholar] [CrossRef]
  57. Walsh, G.; Beatty, S.E. Customer-based corporate reputation of a service firm. J. Acad. Mark. Sci. 2007, 35, 127–143. [Google Scholar] [CrossRef]
  58. Berry, L.L.; Parasuraman, A. Marketing Services: Competing Through Quality; Free Press: New York, NY, USA, 1991. [Google Scholar]
  59. Bartikowski, B.; Walsh, G. Investigating mediators between corporate reputation and customer citizenship behaviors. J. Bus. Res. 2011, 64, 39–44. [Google Scholar] [CrossRef]
  60. Cheung, C.M.K.; Thadani, D.R. The impact of electronic word-of-mouth communication. Decis. Support. Syst. 2012, 54, 461–470. [Google Scholar] [CrossRef]
  61. Senecal, S.; Nantel, J. The influence of online product recommendations on consumers’ online choices. J. Retail. 2004, 80, 159–169. [Google Scholar] [CrossRef]
  62. King, R.A.; Racherla, P.; Bush, V.D. What we know and don’t know about online word-of-mouth. J. Interact. Mark. 2014, 28, 167–183. [Google Scholar] [CrossRef]
  63. Martin, S. Toward a Model of Word-of-Mouth in the Health Care Sector. J. Nonprofit Public Sect. Mark. 2017, 29, 434–449. [Google Scholar] [CrossRef]
  64. Etikan, I.; Musa, S.A.; Alkassim, R.S. Comparison of Convenience Sampling and Purposive Sampling. Am. J. Theor. Appl. Stat. 2016, 5, 1–4. [Google Scholar] [CrossRef]
  65. Cruchinho, P.; López-Franco, M.D.; Capelas, M.L.; Almeida, S.; Bennett, P.M.; da Silva, M.M.; Teixeira, G.; Nunes, E.; Lucas, P.; Gaspar, F. Translation, cross-cultural adaptation, and validation of measurement instruments: A practical guideline for novice researchers. J. Multidiscip. Healthc. 2024, 17, 2701–2728. [Google Scholar] [CrossRef]
  66. Papachristou, N.; Vasileios, R.; Sarafis, P.; Bamidis, P. Translation, cultural adaptation, and pilot testing of a questionnaire measuring the factors affecting the acceptance of telemedicine by Greek cancer patients. PLoS ONE 2023, 18, e0278758. [Google Scholar] [CrossRef]
  67. Hair, J.F.; Risher, J.J.; Sarstedt, M.; Ringle, C.M. When to use and how to report the results of PLS-SEM. Eur. Bus. Rev. 2019, 31, 2–24. [Google Scholar] [CrossRef]
  68. Lee, D.H. HEALTHQUAL: A multi-item scale for assessing healthcare service quality. Serv. Bus. 2017, 11, 491–516. [Google Scholar] [CrossRef]
  69. Chan, T.J.; Hasan, N.A.M. Students’ Perception of the Selected Facets of Reputation Quotient: A Case of a Malaysian Public University. J. Arts. Soc. Sci. 2019, 2, 66–76. [Google Scholar]
  70. Örgev, C.; Bekar, T. Non-monetary costs, hospital perceived value, and patient satisfaction in health institutions. Int. J. Alanya Fac. Bus. 2013, 5, 87–97. [Google Scholar]
  71. Söderlund, M.; Öhman, N. Assessing behavior before it becomes behavior: An examination of the role of intentions as a link between satisfaction and repatronizing behavior. Int. J. Serv. Ind. Manag. 2005, 16, 169–185. [Google Scholar] [CrossRef]
  72. Yong, A.G.; Pearce, S. A beginner’s guide to factor analysis: Focusing on exploratory factor analysis. Tutor. Quant. Methods Psychol. 2013, 9, 79–94. [Google Scholar] [CrossRef]
  73. Podsakoff, P.M.; MacKenzie, S.B.; Lee, J.Y.; Podsakoff, N.P. Common method biases in behavioral research: A critical review of the literature and recommended remedies. J. Appl. Psychol. 2003, 88, 879–903. [Google Scholar] [CrossRef] [PubMed]
  74. Li, L.; Valero, M.; Keyser, R.; Ukuku, A.M.; Zheng, D. Mobile applications for encouraging blood donation: A systematic review and case study. Digit. Health 2023, 9, 1–15. [Google Scholar] [CrossRef]
  75. Dash, G.; Paul, J. CB-SEM vs PLS-SEM methods for research in Social Sciences and Technology forecasting. Technol. Forecast. Soc. Change 2021, 173, 121092. [Google Scholar] [CrossRef]
  76. Hair, J.F.; Hult, G.T.M.; Ringle, C.M.; Sarstedt, M. A Primer on Partial Least Squares Structural Equation Modeling (PLS-SEM), 3rd ed.; Sage: Thousand Oaks, CA, USA, 2022. [Google Scholar]
  77. Henseler, J.; Ringle, C.M.; Sarstedt, M. A new criterion for assessing discriminant validity in variance-based structural equation modeling. J. Acad. Mark. Sci. 2015, 43, 115–135. [Google Scholar] [CrossRef]
  78. Diamantopoulos, A.; Siguaw, J.A. Formative versus reflective indicators in organizational measure development: A comparison and empirical illustration. Br. J. Manag. 2006, 17, 263–282. [Google Scholar] [CrossRef]
  79. Sarstedt, M.; Hair, J.F.; Ringle, C.M.; Thiele, K.O.; Gudergan, S.P. Partial least squares structural equation modeling: Rigorous applications, better results, and higher acceptance. Long Range Plan. 2019, 52, 167–189. [Google Scholar] [CrossRef]
  80. Ramayah, T.; Cheah, J.-H.; Chuah, F.; Ting, H.; Memon, M.A. Partial Least Squares Structural Equation Modeling (PLS-SEM) Using SmartPLS 3.0: An Updated Guide and Practical Guide to Statistical Analysis; Pearson: London, UK, 2018. [Google Scholar]
  81. Wulan, A.T.M.; Wiyadi, W.; Adji, I.S.; Nasir, M. Analyzing the Impact of Service Quality and Patient Trust on Loyalty: The Mediating Role of Satisfaction in a Healthcare Setting. Int. J. Soc. Sci. Res. Rev. 2025, 8, 136–149. [Google Scholar] [CrossRef]
  82. Pang, H. Identifying associations between mobile social media users’ perceived values, attitude, satisfaction, and eWOM engagement: The moderating role of affective factors. Telemat. Inform. 2021, 59, 101561. [Google Scholar] [CrossRef]
  83. Christanto, B.; Francisca, C.; Nomleni, K.E.J.; Cu, M.V. The Influence of E-Wom and Corporate Reputation on Download Intention. Cap. J. Ekon. Manaj. 2024, 7, 168. [Google Scholar] [CrossRef]
  84. Senyapar, H.N. Healthcare branding and reputation management strategies for organizational success. Tech. Soc. Sci. J. 2024, 55, 26–53. [Google Scholar] [CrossRef]
  85. Samsa, Ç.; Yüce, A. Understanding customers hospital experience and value co-creation behavior. TQM J. 2022, 34, 1860–1876. [Google Scholar] [CrossRef]
  86. Göde, A.; Öztürk, Y.E. The mediating role of physician branding in the effect of Word-of-mouth marketing on hospital preference. BMC Health Serv. Res. 2026, 26, 219. [Google Scholar] [CrossRef]
  87. Liu, H.; Jayawardhena, C.; Shukla, P.; Osburg, V.S.; Yoganathan, V. Electronic word of mouth 2.0 (eWOM 2.0)- The evolution of eWOM research in the new age. J. Bus. Res. 2024, 176, 114587. [Google Scholar] [CrossRef]
  88. Akhter, F.; Hossain, M.R.; Nazia, A. Exploring the Drivers of Patient Value Co-creation Behavior in Online Healthcare: A Mediated Model in the Lens of the Theory of Planned Behavior. J. Risk Anal. Crisis Response. 2025, 15, 27. [Google Scholar] [CrossRef]
  89. Haq, M.D.; Tseng, T.H.; Cheng, H.L.; Chiu, C.M. An empirical analysis of eWOM valance effects: Integrating stimulus-organism- response trust transfer theory, and theory of planned behavior perspectives. J. Retail. Consum. Serv. 2024, 81, 104026. [Google Scholar] [CrossRef]
  90. Ngo, T.A.; Bui, C.T.; Chau, H.K.L.; Tran, N.P.N. Electronic word-of-mouth (eWOM) on social networking sites (SNS): Roles of information credibility in shaping online purchase intention. Heliyon 2024, 10, e32168. [Google Scholar] [CrossRef]
  91. Gheorghe, I.R.; Popa-Velea, O.; Diaconescu, L.V.; Mihăilescu, A.I.; Ioachim, M.F.; Dodaj, A.; Jeleč, M.; Balčytienė, M.; Barsevičienė, S.; Zdrojewska, A.; et al. Electronic Health Literacy Handbook; eHELPED-iT: Bucharest, Romania, 2025; ISBN 978-973-0-43331-9. Available online: https://www.ehelpedit-project.eu/wp-content/uploads/files/eHL-Handbook_en.pdf (accessed on 10 January 2025).
  92. Gheorghe, I.R.; Purcărea, V.L.; Gheorghe, C.M. Consumer eWOM communication: The missing link between relational capital and sustainable bioeconomy in health care services. Amf. Econ. 2018, 20, 684–699. [Google Scholar] [CrossRef]
  93. Mladenović, D.; Rrustemi, V.; Martin, S.; Kalia, P.; Chawdhary, R. Effects of Sociodemographic Variables on Electronic Word of Mouth: Evidence from Emerging Economies; MUNI ECON Working Paper, No. 2022-02; Masaryk University, Faculty of Economics and Administration: Brno, Czech Republic, 2022. [Google Scholar] [CrossRef]
Figure 1. Conceptual framework.
Societies 16 00166 g001
Figure 2. The third-order model in SmartPLS. Note: The blue circles represent the first and second order latent variables and the yellow squares represent the items of each latent variable.
Societies 16 00166 g002
Figure 3. The validation of the relationship between Perceived Value and eWOM. Note: The Perceived Value is a third order latent construct, the eWOM is a first order latent construct; the yellow squares of the Perceived value construct are the second and first order latent constructs, considered as items, and the yellow squares of eWOM construct are its items.
Societies 16 00166 g003
Table 1. The socio-demographic profile of the respondents in the main study.
VariableFrequencyPercentage (%)
Gender
Female12258.1%
Male8841.9%
Marital status
Unmarried2411.4%
Married12559.5%
Divorced2712.9%
Widower3416.2%
Education level
Primary school studies104.8%
High-school studies5526.2%
Undergraduate studies9746.2%
Postgraduate studies4822.9%
Motivation for consultation
Usual monthly consultation9143.3%
Diagnosis consultation6832.4%
Treatment prescription4722.4%
Other41.9%
Table 2. The sources and the adapted measurement instruments.
ConstructSourceItems
Perceived Quality
Empathy[68]EM1: The physician had a polite attitude.
EM2: The physician offered detailed information to me.
EM3: The physician understood my situation.
EM4: The physician was friendly.
Tangible Elements[68]ET1: The medical organization has advanced equipment.
ET2: In the medical organization, consultations are provided by well-qualified staff.
ET3: The medical organization has a comfortable waiting room.
ET4: The medical organization has a comfortable consultation room.
ET5: In the medical organization, the employees’ clothing is clean.
ET6: The medical organization maintains proper cleanliness of the facility.
ET8: The consultation room ensures confidentiality and privacy.
ET9: The consultation room is spacious and clean.
Safety[68]SI: The medical organization provides a comfortable and safe environment for patients.
SI2: I believe that my physician established an appropriate diagnosis for me.
SI3: I believe I can trust my physician.
Image
Social Responsibility[69]RS1: The medical organization supports the social causes in the community it activates.
RS2: The medical organization supports social cause campaigns.
RS3: The medical organization seems to be environmentally friendly.
Performance[69]PER1: I believe my medical organization is strong, given its strong history.
PER2: I believe my medical organization tends to outperform other medical organizations.
PER3: My medical organization has strong prospects for future growth.
Perceived Service Outcome[68]PS1: I believe the medical organization provided an appropriate service to me.
PS2: I believe that, following the medical service, I was prescribed appropriate treatment.
PS3: The improvement in my health is a result of the efforts and treatments prescribed by the medical staff.
PS4: My health has improved after the medical consultation.
PS5: The employees of the medical organization provided information on prevention.
Non-monetary costs[70]CNM1: The time spent in the waiting room was appropriate.
CNM2: I was able to get an appointment with my physician promptly.
CNM3: I had enough time to present my investigation results and analyses to my physician.
CNM4: I easily accessed other medical services in addition to the consultation.
CNM5: The noise in the waiting room was tolerable.
CNM6: The smell in the waiting room was appropriate.
CNM7: The location of the medical organization is geographically accessible.
eWOM[71]eWOM1: I intend to recommend the medical service online.
eWOM 2: I will recommend the medical service online.
eWOM3: I will definitely recommend the medical service online.
Table 3. Item loadings, reliability, and validity.
First-Order ConstructItem LoadingsAlphaCRAVE
Empathy 0.920.930.87
EM10.93
EM20.92
EM40.94
Tangible Elements 0.900.910.72
ET10.85
ET20.86
ET30.88
ET50.79
ET90.86
Safety 0.950.950.95
SI20.97
SI30.97
Perceived Service Outcome 0.910.910.85
PS10.95
PS20.94
PS50.88
Social Responsibility 0.950.950.95
RS10.97
RS30.97
Performance 0.910.910.92
PER10.95
PER20.96
Non-monetary costs 0.910.920.75
CNM10.89
CNM20.88
CNM30.90
CNM50.79
CNM70.85
eWOM 0.870.870.79
eWOM10.91
eWOM20.84
eWOM30.92
Note: Alpha-Cronbach Alpha Coefficient; CR-Composite Reliability; AVE-Average Variance Extracted.
Table 4. Discriminant validity—cross-loadings.
EmpathyNon-Monetary CostsPerceived Service OutcomePerformanceSocial
Responsibility
SafetyTangible ElementseWOM
EM10.9350.4530.7250.3730.3770.7870.2750.477
EM20.9250.5630.7600.4950.5250.7270.4340.554
EM40.9400.5060.7750.4290.4460.7620.3420.521
CNM10.3930.8970.4140.5000.4140.3510.5490.455
CNM20.4680.8890.4870.4850.5420.4300.4950.469
CNM30.6310.9040.6260.4660.4330.5450.5330.521
CNM50.3350.7930.4240.4040.3680.3580.5350.373
CNM70.5100.8510.4460.4330.4290.3740.3970.401
PS10.7420.5460.9500.4780.5240.7840.4920.590
PS20.7630.4810.9400.4040.4470.8330.4040.588
PS50.7380.5210.8830.4810.5430.6840.4000.574
PER10.4320.4920.4480.9590.6800.3900.5520.560
PER20.4640.5230.4940.9600.6820.4060.5410.571
RS10.4770.4980.5440.6860.9760.4520.5200.598
RS30.4720.4900.5230.7010.9770.4370.5280.606
SI20.7870.4570.8170.4190.4710.9780.4290.579
SI30.7980.4820.8040.3910.4160.9750.4150.554
ET10.2770.4740.3800.5590.5730.3330.8530.580
ET20.4890.4840.5590.5420.5060.5100.8650.625
ET30.1990.5390.3080.4860.4310.2450.8830.537
ET50.3100.4240.3520.4100.2970.3560.7920.478
ET90.3190.5360.3690.4170.4480.3770.8630.594
eWOM10.5180.4680.5670.5130.5580.5170.6230.913
eWOM20.4120.4390.5110.5050.5250.4430.5440.841
eWOM30.5510.4750.6080.5600.5650.5850.6110.920
Note: The values in italics are the loadings of the items on their assigned constructs.
Table 5. Discriminant validity using the criterion of Fornell–Larcker and the Heterotrait–Monotrait Method (HTMT).
EmpathyNon-
Monetary Costs
Perceived Service
Outcome
PerformanceSocial
Responsibility
SafetyTangible ElementseWOM
Empathy0.9330.5810.8770.5040.5130.8660.4040.614
Non-monetary costs0.5460.8680.6030.5760.5390.5080.6330.572
Perceived
service
outcome
0.8080.5580.9250.5370.5850.8900.5080.706
Performance0.4670.5290.4910.9600.7610.4440.6230.661
Social
Responsibility
0.4860.5060.5460.7100.9770.4780.5700.677
Safety0.8120.4800.8300.4150.4550.9760.4610.634
Tangible
Elements
0.3800.5780.4680.5700.5370.4320.8520.743
eWOM0.5570.5160.6310.5900.6160.5800.6650.892
Note: Elements in italic are the square roots of the AVE. Below the diagonal, elements are the correlations between the constructs. Above the diagonal, elements are the HTMT values.
Table 6. Second higher-order constructs validation (Perceived Quality and Image).
Second Higher Order ConstructLOCsVIFOuter Weightst Statisticsp ValuesOuter
Loadings
p Values
Perceived QualityEmpathy6.200.4521.080.0010.800.001
Tangible
Elements
1.370.276.670.0010.480.001
Safety6.390.4721.920.0010.840.001
ImageSocial
Responsibility
1.660.5420.210.0010.750.001
Performance1.590.5719.460.0010.790.001
Note: LOCs—Lower-order constructs; VIF—Variance Inflation Factor.
Table 7. Third higher-order construct validation—Perceived Value.
LOCsVIFOuter Weightst Statisticsp ValuesOuter Loadingsp Values
Perceived Quality6.630.090.380.690.730.001
Image1.180.638.030.0010.850.001
Perceived Service Outcome6.780.401.610.100.770.001
Non-monetary costs1.170.141.300.190.590.001
Disclaimer/Publisher’s Note: The statements, opinions and data contained in all publications are solely those of the individual author(s) and contributor(s) and not of MDPI and/or the editor(s). MDPI and/or the editor(s) disclaim responsibility for any injury to people or property resulting from any ideas, methods, instructions or products referred to in the content.