Abstract
The paper presents the motivation, development, and evaluation of an AI-driven framework for media stream impact analysis at the consumption end, employing user reactions monitoring through attention tracking (i.e., eye and mouse tracking). The adopted methodology elaborates on software and system engineering processes, combining elements of rapid prototyping models with interdisciplinary participatory design and evaluation, leaning on the foundation of information systems design science research to enable continuous refinement through repeated cycles of stakeholder engagement, feedback, technical iteration, and validation. A dynamic Form Builder has been implemented to supplement these tools, allowing the construction and management of pre- and post-intervention questionnaires, thus helping associate collected data with the respective tracking maps. The present begins with the detailed presentation of the tools’ implementation, the respective technology, and the offered functionalities, emphasizing the perception of tampered visual content that is used as a pilot evaluation and validation case. The significance of the research lies in the practical applications of AI-assisted monitoring to effectively analyze and understand media dynamics and user reactions. The so-called iMedius framework introduces an integration of innovative multidisciplinary procedures that bring together research instruments from the social sciences and multimodal analysis tools from the digital world.
1. Introduction
Today, Artificial Intelligence (AI) and digital platforms are rapidly transforming the media landscape, affecting personal, societal, and professional activities [1,2]. In this context, various aspects of news production and consumption are considered, with the aim of identifying new opportunities for creating, validating, disseminating, and evaluating accurate, impactful, and engaging journalistic content. In this context, innovative processes and automations are incorporated while enhancing journalists’ literacy and awareness of new capabilities [3,4,5,6,7,8,9,10]. Hence, the scientific field of journalism and media studies seeks new methods to assess the impact of media informational streams on the audiences in qualitative and quantitative terms. The iMedius framework1 (integrating multidisciplinary media impact assessment instruments) introduces an innovative multidisciplinary integration of tools that bring together research instruments from the social sciences and multimodal analysis methods from the digital world [8].
Since the nineteenth century, social science research has been considered fundamental to understanding human societies, culture, and the powerful relations that permeate them [11]. This field seeks to analyze and explain phenomena, such as social inequality, political behavior, and communication, providing interpretive tools for understanding everyday life through qualitative and quantitative approaches [12]. Despite their widespread use, methodological approaches in the social sciences, such as questionnaires, have faced criticism regarding their validity and epistemological grounding [12,13,14]. A central challenge for the field is the risk of obsolescence if it fails to evolve in tandem with the societies it aims to study [11]. The ongoing digitization is transforming the tools we use, making it imperative for research methods to integrate and adapt to technological advancements, which, in turn, leads to methodological innovation. Media Studies, a field that both draws from and extends the relevance of social sciences in the digital era, cannot be left aside from such methodological and applied innovations [15]. In this field, researchers often design and distribute questionnaires to examine variables such as media preferences, audience interaction, perceived credibility of news content, and the spread of disinformation or hate speech [2,3,4,5,6,7,8,16,17]. This type of research yields valuable quantitative data on how individuals consume and interpret news, their emotional responses, and their intention to share content [8,18,19].
In addition to the self-reported information collected through questionnaires, in recent years, efforts to collect qualitative data have increased, such as the recording of content and news consumers’ attention. Monitoring user attention through eye and mouse tracking offers valuable objective data on how individuals interact with content. Gaze tracking allows researchers to capture points of interest, attention span, and visual paths while reading or viewing content [20,21,22]. Similarly, mouse movement tracking acts as an indicator of cognitive processing and provides clues about attentional focus, navigation points, and potential hesitations [23]. For Media Studies, these techniques offer objective behavior measurement and allow the study of non-conscious processes that often escape self-report [11]. Furthermore, in media studies, attention tracking allows for improved content design, understanding patterns of engagement or distraction, and assessing the impact of misleading or offensive content [24]. By combining subjective (questionnaire) and objective (gaze/mouse) data, researchers can achieve a multimodal analysis of behavior, offering a deeper understanding of the user’s relationship with content, within a rapidly evolving digital environment [19].
Artificial Intelligence (AI) provides a set of tools and a transformative force offering new ways to capture, analyze, and interpret user behavior. The convergence of AI with established research practices opens new possibilities for integrating diverse data sources, automating complex processes, and ultimately improving our understanding of how individuals interact with content in a digitized world [25]. For instance, the use of machine/deep learning (ML/DL) and natural language processing (NLP) algorithms allows for faster and more reliable processing of large amounts of data and automated recognition of patterns and trends in user behavior [26]. In addition, AI tools enhance the ability to analyze combined data formats, such as quantitative questionnaire results and qualitative data from gaze and mouse tracking, thus enabling a multi-layered interpretation of user interaction with content [27]. The integration of AI also offers the potential to predict future content consumption trends, personalize user experiences, and improve survey design while facilitating the identification of phenomena such as disinformation or hate speech in real-time, enhancing the validity and scope of social and communication research [28,29].
From the preceding analysis, it becomes clear that integrating AI into the very infrastructure of research tools increases their efficiency and expands their capabilities, making them more adaptive, responsive, and context-aware. This shift represents a fundamental transformation in how studies are conducted, particularly in dynamic fields like media and communication.
In response, this study addresses the growing need for user-friendly, open-access tools by introducing an innovative approach to monitor user behavior analysis and news stream monitoring that merges methodological frameworks from the social sciences with advanced machine learning techniques. Hence, the research questions focus on the development and integration of AI-driven tools intended to enhance media-monitoring-related research outcomes and validate their applicability and usefulness.
The paper is structured to reflect the progression of ideas and developments that underpin the research. It begins with an overview of the technological landscape of media monitoring and user interaction analysis, presenting related work and the targeted innovation. Building on this, the paper outlines the targeted motivation and research objectives, focusing on the need for integrated, open-access tools, and highlights the importance of ethical design and multidisciplinary collaboration. The subsequent section focuses on materials and methods, presenting the envisioned framework along with its ethical considerations and limitations, illustrating the adopted interdisciplinary co-design and evaluation methodology, and outlining a pilot real-world scenario to test iMedius’ actual dynamics. Experimental results and discussion then follow, presenting the implemented modalities and system integration, while elaborating on usability analysis and evaluation, providing experimental findings in qualitative and quantitative terms. A pilot use case analyzing the perception of tampered images through an algorithm-assisted authenticity survey is conducted within the iMedius environment, using pre- and post-intervention questionnaires, offering valuable insights into the tools’ functionalities and usability, though it does not provide definitive, general conclusions for the case study. Hence, research hypotheses and questions are answered and discussed based on the selected data. The paper concludes with a discussion on future directions, summarizing the study’s contributions and outlining opportunities for continued innovation in media research methodologies.
2. Related Work and Targeted Innovation
Currently, individual tools focus on specific aspects of media monitoring, such as attention tracking, misinformation and verification inspection, hate speech detection, sentiment analysis, topic modeling and more [8,10,30,31,32,33,34,35,36,37]. For example, tools equipped with NLP algorithms facilitate the identification of semantic trends or aggressive content, while browser plugin technologies can track user interactions and capture valuable reader cues [30,31,32,33]. Additionally, the estimation of projected and perceived emotions provides insights into audience reactions, contributing to content and user profiling [31,34,35]. Despite their utility, these tools operate in isolation, lacking the integration required for a comprehensive media monitoring platform.
Eye tracking is based either on special equipment (such as Tobii Pro Lab or SMI RED250) or computer camera software (e.g., WebGazer.js, Pupil Labs) [38,39,40]. On the other hand, mouse tracking is mainly performed through tools such as Hotjar, Mouseflow and Contentsquare, which offer heatmaps and user navigation analysis [40]. However, none of these solutions provide the capability to create questions and record attention simultaneously. Typically, this requires combining different tools or developing specialized integrations, which increases complexity and cost.
Extending the above, user interaction insights need to be incorporated to capture the impact of the attempted monitoring, among others, with specific questions that could be part of an integrated survey. The most popular tool in this category is Google Forms, which offers usability but limited features. LimeSurvey an open-source platform that provides more customization, and commercial platforms like SurveyMonkey and Typeform, do support branching logic and fundamental data analysis (but with customization limitations). However, these platforms lack built-in user attention-tracking features [41].
Some platforms, such as iMotions2, Clarity3 from Microsoft and Impala research program4 offer complete solutions for usability research, combining eye and mouse tracking with basic questionnaires. However, there is a lack of unified and accessible tools that pose significant challenges, since in most cases, a combination of tools is required: eye tracking via WebGazer.js and questionnaires via Google Forms or LimeSurvey, which requires technical knowledge to synchronize and process the data [41].
Another major limitation is that many of these solutions rely on expensive equipment or high-end computational resources, which restrict their accessibility for small-scale research teams, media professionals, or academics in underfunded institutions. For instance, traditional eye-tracking technology, used to monitor user attention and engagement, typically requires dedicated hardware and software, presenting financial and logistical challenges [38]. Thus, the ever-increasing complexity of the modern media landscape, driven by the rapid proliferation of digital platforms and the fact that proprietary solutions often lack affordability and comprehensiveness, limit their use primarily to well-funded institutions or organizations. This situation hinders the broader academic community, independent media professionals, and researchers who require robust tools to conduct transparent, scalable, and impactful studies in real-world conditions and scenarios, implicating large and diverse amounts of web users (i.e., monitoring the perception of real news feeds in typical working or house environments).
It is worth noting that, especially today, when advancements in technology enable similar outcomes through conventional web cameras and cost-effective visualization tools, it is concerting that the field still lacks an open-access, integrated solution that brings together attention tracking, interaction analysis, and content evaluation under a unified platform. Undoubtedly, in the process of developing such platforms, the use of AΙ capabilities plays a significant role and has become increasingly important in recent years for Journalism and Media Studies. By bridging the gap between quantitative and qualitative methodologies, AI can facilitate a more nuanced exploration of media dynamics. The literature on AI exploitation in media is extensive, covering both practical applications and theoretical frameworks regarding the transformative role of ICT (Information and Communications Technology) and AI in reshaping journalism workflows [5,6,7,26].
On top of that, additional tools can be utilized to detect news trends, hate speech jeopardies and misinformation prediction, thus leading researchers to investigate featured scenarios of daily news feed risks and challenges. NLP techniques, including topic modeling, text classification, and sentiment analysis, are at the forefront of AI integration in media. These methods allow media organizations to process and analyze vast amounts of textual data, providing insights into emerging trends, audience sentiment, and even public opinion. Techniques such as web scraping and topic modeling play a pivotal role in advancing these objectives. By extracting key topics and providing contextual insights, these methods contribute to indicating information streams that require attention or exhibit research interest. As AI technologies continue to evolve, their integration into journalism and research is paving the way for more precise, impactful innovations. However, there are still several gaps that need to be addressed to realize their potential fully. These gaps stem from technological limitations, ethical considerations, and the need for more robust methodologies for data analysis and content creation [10,29,30,31,32,33,34,35,36,37,38,39,40,41].
More specifically, one of the most promising applications of AI in media tools is the ability to analyze user behavior, which allows for a more comprehensive understanding of how audiences interact with content. By leveraging attention-tracking technologies, such as gaze tracking and mouse tracking, researchers and media organizations can obtain real-time insights into what parts of the content attract the most attention and how users navigate through various media elements [8,41].
Innovative projects like iMotions and WebGazer.js exemplify the integration of AI in user attention tracking and behavioral analysis. Gaze tracking, utilizing webcam-based technology, offers a unique perspective on user interaction by monitoring eye movements and mapping them to the screen coordinates. This provides valuable data on which sections of content users focus on, the duration of their gaze, and the sequence of attention shifts; therefore, it interests multiple scientific fields [42,43,44,45,46]. Mouse tracking, on the other hand, is another highly accurate method for capturing user focus, usually combined with eye tracking in related research of multimodal attention monitoring [47,48,49,50,51]. Every movement of the mouse is tracked across the screen, providing detailed insight into the areas users engage in. The combination of both gaze and mouse tracking in media tools allows for a comprehensive view of user interactions, offering data on attention spans, navigation patterns, and areas of interest [41].
These attention-tracking mechanisms, when combined with multimedia content, offer powerful insights into user engagement across various media formats. For instance, AI can analyze how users interact with different types of content—text, video, images, and interactive elements—providing a richer understanding of their preferences and behaviors. This cross-media analysis is crucial for understanding how different types of media influence audience engagement and attention.
The integration of AI in media tools has reached a significant level of maturity, revolutionizing how media is produced, distributed, and consumed. Driven by advances in machine learning, computer vision, and NLP, AI has become a transformative force, enabling media organizations to automate complex tasks, analyze large datasets, and gain deeper insights into audience behavior.
Tools such as iMotions combine eye tracking with AI-driven sentiment analysis, enabling media professionals to understand viewer engagement on a deeper level. Moreover, the integration of recommendation systems highlights the growing reliance on AI to curate content that aligns with individual user preferences.
Our contributions in this space, particularly in the Gaze Tracking mechanism, have refined the use of browser-based eye-tracking systems. By normalizing and smoothing data to enhance accuracy. Our approach aims to ensure reliable metrics for understanding user attention and interaction patterns. Additionally, integrating web scraping techniques has expanded the scope of data collection to include live monitoring of news streams, providing critical insights into media trends and user behaviors. These contributions represent a significant step toward more responsive and adaptive AI-driven tools.
Despite these advancements, challenges remain. The dynamic nature of news consumption, privacy concerns, and algorithmic biases necessitate continued refinement. AI integration in media must balance efficiency with ethical considerations, ensuring that tools promote fairness and trustworthiness while addressing user needs effectively. In this context, the iMedius framework aims at integrating and elaborating all the implicated techniques and practices, thus offering dynamic multimodal tools combining featured social instruments with algorithmic inspection and analysis services. With social science perspectives [8] and user experience (UX) design and analysis [41] already reported, the current work attempts to elucidate the end-to-end chain, emphasizing the modular architecture that allows adding, replacing, and adapting modalities, while also providing valuable assessment through a real-world pilot configuration and implementation.
3. Research Aims and Motivation
The creation of free or open-access tools for media research is critical for addressing existing gaps in the field. Such tools would democratize access to advanced analytical methods, foster greater transparency in the study of media dynamics, and enable researchers to conduct comprehensive, real-time impact assessments using standard, affordable technology. By removing financial and technical barriers, open-access tools can facilitate more inclusive and objective research, contributing to a deeper understanding of news consumption, user behavior, and the evolving role of media in society.
The need for such tools is twofold: first, it would provide researchers with the means to conduct real-time analyses of news dissemination and user behavior; second, it would enhance the transparency and democratization of media research. Free and open-access tools would allow a broader range of stakeholders—academics, independent journalists, and public-interest researchers—to monitor media impact without prohibitive costs. This access would encourage cross-disciplinary collaboration, promote innovation, and ensure the development of scalable, reliable solutions for studying emerging issues such as misinformation, hate speech, and news personalization. To realize these advancements, a multidisciplinary approach is essential. The development of open-access tools must consider not only the technological and functional challenges but also the legal and ethical ramifications. Safeguarding data privacy and user security is paramount, as media research often entails collecting and analyzing sensitive personal data. Ethical frameworks must guide the design and implementation of these tools to ensure transparent and user-rights-respecting operations.
The key innovations that iMedius pursues include AI-driven social research tools (social instruments), i.e., dynamic questionnaires that can collect subjective perceptions (e.g., specific attitudes, emotional reactions, news dissemination intentions, etc.), AI-assisted gaze and mouse-tracking technologies to measure users’ visual attention and mouse movement when interacting with news content. In addition, the web plugin paradigm is considered for browsing history logging to extract interaction monitoring and reader cues to supplement the whole analysis, following similar research with the associated ethical limitations and technical restrictions [33]. Overall, the envisioned platform incorporates the ability to collect subjective data, allowing a comprehensive analysis of all the implicated information. Thus, the questions the current research intends to answer are framed around the process of integrating services within a dedicated web environment optimized to manage and deliver social (and multidisciplinary) research, aiming to confirm the value and helpfulness of this algorithm-assisted multimodal monitoring tool. To accomplish the envisioned goals, an interdisciplinary participatory framework of iterative analysis, design, development, implementation, and evaluation has been adopted, with the cooperation of the social science and technology research teams, following a human-centric co-creation process deployed in similar research [42,43,44,45,46,47,48,49,50,51]. In this context, the research hypothesis (RH) is that such a multidisciplinary multimodal instrument is not currently available (to the best of our knowledge), and the envisioned functionalities will be of great usefulness to social scientists and associated interdisciplinary research. Next, the research questions (RQ) attempt to analyze the functional requirements, leading to the implementation and pilot assessment of the crafted utilities on a featured scenario of tampered visual content perception analysis:
RH. The envisioned multimodal instrument for social and multidisciplinary research is not currently available, and the respective functionalities will be of great usefulness to social scientists and associated interdisciplinary research collaborations.
RQ1: Can such a platform be developed to provide the envisioned multidisciplinary instruments for real-time news impact monitoring by analyzing user behavior, utilizing technologies such as dynamic questionnaires and visual attention tracking?
RQ2: Will the developed open platform be usable and convenient in real-world scenarios of media studies, ensuring its thorough future utilization by both the research and academic communities, as well as its incorporation in professional media processes?
4. Material and Methods
The current work focuses on the UX design, development, and assessment of an AI-assisted media impact monitoring framework, necessitating the configuration and adaptation of the implicated material and methods accordingly. More specifically, the proposed methodology elaborates on software and system engineering processes, combining elements of rapid prototyping models with interdisciplinary participatory design and evaluation, aligning closely with the iterative principles of the spiral model [52,53,54,55,56,57]. Leaning on the foundation of information systems design science research [58,59,60,61,62], the adopted development process enables continuous refinement through repeated cycles of stakeholder engagement, feedback, iterative technical refinement, and evaluation. Hence, the methodology ensures both the practical relevance and theoretical rigor of the developed solution, instilling confidence in its academic integrity. The convergence of these frameworks supports the creation of innovative, context-sensitive systems that are both functionally robust and responsive to user needs. The subsequent sections present the envisioned framework with its ethical considerations and limitations, elaborating on the configuration details of the methodological interdisciplinary co-design and evaluation. The organization of a real-world scenario on disinformation analysis and its impact on users is also described, emphasizing the perception of tampered visual content that is used as a pilot evaluation and validation case.
4.1. The Envisioned Framework-Ethical Considerations, and Limitations
The process of accurately assessing the impact of media content on diverse audiences requires the development of technological tools and methodologies to support complex multimodal surveys. The primary objective of the developed framework is to enable researchers to gain access to enriched data that provides deeper insights into behavioral studies and media consumption. The main tool of the developed framework is the iMedius Form Builder. It is a versatile form-building tool providing researchers with all the necessary elements to construct multiple types of surveys. A key differentiator from existing form creation systems is its attention-tracking functionality. The term attention tracking describes the combined tracking of both eye and mouse data within surveys. With this functionality, we extract candid data, supplementary to the survey self-reported answers, potentially expanding the research analysis process. Careful consideration is given to implementing tracking algorithms in a privacy-safe and non-intrusive manner. At all stages of data tracking, the Form Builder tool requests the required permissions from the user prior to activation and provides all the necessary information. Moreover, attention tracking is strictly enabled only on attention-enabled elements, avoiding unnecessary tracking during the whole duration of the research study. To ensure participant anonymity and also technical feasibility (associated with data transferring, handling, and storing), no actual image or video data is recorded, and only attention-tracking data points are captured and ingested into the form elements. Among others, this was also a critical point to receive ethical clearance from the research and ethics committee of the host university. More information and technical details about the tracking process are provided in the Section 5.1 Implemented modalities and system integration.
Complementary to the Form Builder, two key tools were also implemented to expand research study capabilities further. First, the Social Media Monitoring toolbox offers a complete and integrated solution for monitoring social media platforms, utilizing web-scraping, topic modeling, sentiment analysis, thematic and contextual labeling, classification, and summarization, thus creating datasets, inspecting data, and extracting semantic information. This add-on utility is designed to support researchers and professionals who work with large volumes of online content and want to understand trends, opinions, and emerging topics. Second, the Browser Tracking Extension is implemented as a lightweight plugin that records and analyzes users’ online activity as they participate in research studies and surveys. An essential aspect of the iMedius framework is the integration of the browser tracking extension into the Form Builder, minimizing disruptions and additional effort for participants (Figure 1). Similarly to the form-building tool, the implementation of the extension is heavily focused on preserving user privacy. Within any study involving browser tracking, participants are informed at all phases of data collection. Moreover, at any given point, they can turn off the extension and delete their extracted data.
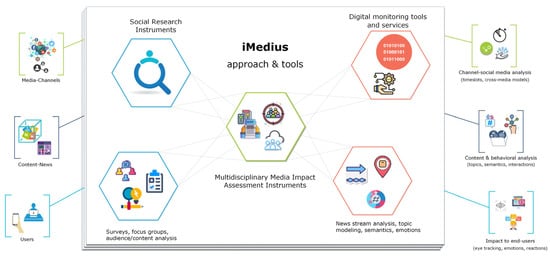
Figure 1.
The conceptual model of the proposed iMedius framework.
The iMedius framework, with an overview of the implicated services, algorithms, practices, and functionalities offered, is depicted in Figure 1. Along with the tools themselves, technical and ethical considerations and limitations were carefully considered and addressed during project implementation. For instance, AI-driven solutions were adopted and properly configured to provide cross-platform execution of the eye-tracking modalities, aiming at minimizing the computational load to allow execution at low-end terminals. While the accuracy of eye-tracking techniques using conventional web cameras can be questioned when compared to specialized equipment, their practical advantages in implicating large and diverse amounts of web users are prioritized, since they are aligned with the current study goals. In addition, AI-driven solutions constantly progress and, given the modular architecture and deployment, related updates with higher performance can also be part of future releases. However, this also sets some limitations concerning the computing terminals and their operating systems that can be used with the iMedius platform. Hence, portable and desktop computers suited for typical office applications are entirely adequate, with mobile devices completely excluded from the current design, not aligning with the proposed scenarios’ requirements (i.e., high screen resolution in viewing and inspecting content, monitoring stability and more). Still, the adopted modular approach (also following responsive web design principles where possible) will allow future adaptation to mobile terminals, depending on the availability of related tools/libraries and the associated research needs. Finally, as already mentioned, much attention was paid to ethical considerations, following all the procedures and rules suggested by the Declarations of Helsinki and related research [8]. The Form Builder employed a proactive nature, informing users before any implicated activity/interaction. The associated questionnaires were shaped and hosted online to be fully anonymized, explaining to candidates that they would agree to the stated terms upon sending their final answers, with a persistent indication that they could quit anytime without submitting any data. All data was fully anonymized, avoiding any visual sequences from being captured by implicated cameras, as already explained. The procedures were carefully crafted and revised with the close collaboration of the social and technological research teams, resulting in the acceptance of the research protocol by the “Committee on Research Ethics and Conduct” of (university name are omitted for peer review), receiving an associated ethical clearance (approval code and date are omitted for peer review).
4.2. The Proposed Methodology: Interdisciplinary Co-Design and Evaluation
As already implied, the proposed platform implementation methodology emanates on the LUCID model (Logical User-Centered Interactive Design), a human-centric iterative co-design and evaluation, deployed with the close collaboration of the social science and technology research teams [54,55,56,57,58,59]. The four repeated phases of analysis, design, development, and evaluation are depicted in the spiral model of Figure 2, outlining the key processes and milestones implicated in the participatory development of the iMedius environment. In short, the process repeats in successive cycles, with design ideas and suggestions by all (multidisciplinary) team members following the analysis findings, and then is passed to the UX design and software engineering teams for back- and front-end authoring, coupled with internal evaluation to optimize the final development. Specifically, in the analysis steps, assessments of requirements and design needs are in place, along with usage scenarios, the logic of the form and data collection, also leading to a protocol regarding Ethical and privacy issues (as already explained). In the design instances, User Interfaces (UI) are designed and elaborated, progressing from low- to high-fidelity prototypes, with the active participation and feedback of social researchers (having also the role of representative users), seeking repeated refinements and optimal development within this rapid prototyping procedure.
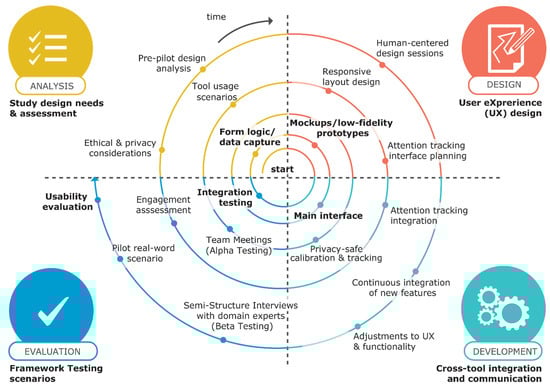
Figure 2.
The adopted interdisciplinary co-design and evaluation methodology with its key milestones in the core component development (Form Builder, Browser tracking extension, social media monitoring toolbox) projected in the followed spiral model.
Following the flow of the spiral model, the flexible layout design of the form elements and the attention-tracking interface design are gradually developed and integrated within the adopted modular architecture. In particular, the development of the modules and the integration of attention tracking with its calibration and the materialization of the privacy-safe monitoring mechanisms are carried out, along with a constant incorporation and elaboration of new optimization features. Additional development considerations and features (not in the core of the current work) include the iMedius Browser Extension and the Social Media Monitoring Toolbox, both of which are complementary modules to enhance digital behavioral data collection. New features and functional updates are selected after intensive and iterative design validation meetings to make the necessary UX adjustments and optimize functionality. The outer helix involves the pilot testing of the application with the configuration of a real-world use case scenario. As already noted, the selected pilot analyzes the impact of tampered images on users visually inspecting the content while also utilizing algorithm-assisted tools, pursuing insightful perception assessment through attention tracking. In fact, the specific scenario emanated from previous news authentication research, evaluating the photo-truth impact through image verification algorithms [34], which actually gave birth to the attention monitoring idea and the iMedius concept. According to the adopted model and the associated process flow of Figure 2, formative evaluation is an integral part of all iterative design cycles, leading to improvements and optimizations [43,44,45,46,47]. However, it is worth highlighting the two final evaluation sessions indicated to follow the platform implementation. The first refers to the integration testing and usability assessment planned to be carried out within the iMedius research team (Alpha testing), in project meetings and dedicated focus groups (as further explained in [41] for the usability evaluation sub-case). The second seeks to receive qualitative feedback by third parties outside the development team (Beta testing), involving domain experts who participated in the 2024 iMEdD International Journalism Forum, on the occasion of a related iMedius-driven workshop5,6.
To comprehensively evaluate the effectiveness and impact of the envisioned tools, a series of semi-structured interviews is suggested and scheduled. Alpha and Beta testing represent two distinct phases in software development that are employed to identify and resolve issues before the release of an application [54,55,56,57,58,59]. As mentioned earlier, the participants of the first phase of the platform evaluation (Alpha Testing) were the research team members. The goal of this co-design and human-centered methodology is to focus on the tools’ adaptation to the expectations of the end users and to improve their performance and usability before their final integration, configuration, and release. The procedure involves online sessions, in which the comments and suggestions are discussed in detail to conclude in a comprehensive assessment of the platform’s functions and usability. This phase contributes the most to the completion of the first version of the platform, as researchers identify weaknesses and strengths, setting the foundations for the next evaluation phase by domain experts, involving media professionals, journalism students, and professional journalists recruited during the research team presence in the Media Village of the iMEdD International Journalism Forum 2024 (Beta testing). The session involves interaction with the platform, followed by semi-structured interviews with people involved in newsroom processes, with a theoretical background in social science or media-related applications and technologies. In these interviews, participants are expected to operate the tools in typical computing terminals (i.e., a laptop computer equipped with a web camera), interact with the platform, and evaluate the offered functionalities of attention tracking in standard survey arrangements. Table 1 presents a set of five (5) interview questions that were collaboratively formed within the iMedius multidisciplinary team to assess how mature, user-friendly, practical, and valuable the platform would be in related media studies.

Table 1.
The questions that formed the basis of the semi-structured interviews for assessing the tools.
4.3. Configuration of a Pilot Real-World Scenario
The subsequent phase of assessing the platform’s efficiency was to design and implement an experimental procedure using the iMedius environment as a data collection tool. The real-life scenario chosen was the verification of content (images) without and with the aid of image forensics applications. Hence, three different images were crafted, one authentic, one created with AI (AI-generated), and one digitally altered, to be exposed and evaluated by the participants (Figure 3). For each image, a series of evaluation steps take place, starting with simple observation and progressing to the use of specialized image analysis tools as color and probability maps (Image Verification Assistant) [36], reverse search results and, where applicable, an AI-driven assessment estimating forgery probability (MeVer Media Annotation and Management Service–MAAM)7 [37]. At each step, participants are asked to state their evaluation of the image’s nature and justify their answer, while their attention is recorded using eye and mouse tracking. This approach allows researchers to extract data about the impact of the tools on their evaluation and cognitive processes, thus providing insightful views of performance, behavior, and visual strategy. The experiment builds on the methodology of a previously published scientific article [34], with the primary objective of assessing people’s ability to recognize the nature of images with or without the use of digital forensics tools. The study focused on the impact of first-generation tools (Image Verification Assistant and Forensically), while it relied only on participants’ responses regarding the authenticity of the images. The present experiment adds attention tracking as a critical factor of analysis, to monitor where participants’ focus and if their behavior changes as the stages progress and new tools are introduced. Moreover, attention-tracking technology is not merely an observation tool but is integrated as a fundamental and structural element of the experimental process. At each stage of the experimental process, the areas on which participants focus are recorded. This detailed monitoring intends to investigate whether the technical tools influence the users’ visual patterns, i.e., whether they shifted their attention to critical or misleading areas of the image. At the same time, it is examined whether there is a correlation between the observation strategy followed by each participant and their final assessment of the nature of the image (authentic, AI genarated or digitally manipulated). Finally, attention tracking is also placed as a means of educational feedback, given that participants gradually become familiar with the use of verification tools through the interactive assessment experience.
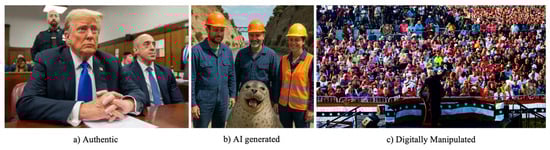
Figure 3.
The three images presented to participants included: (a) an authentic, unedited photo (b) an AI generated image and (c) a digitally manipulated photo altered using photo-editing tools. Each image was selected to represent a different type of visual misinformation.
5. Experimental Results and Discussion
This section presents the results of the current work, including the development and integration of the iMedius environment with the presentation of the crafted eye-tracking and form-building services. The value of the framework is validated through usability analysis and evaluation of its corresponding functionalities, as well as findings and broader research insights from the pilot implementation of the representative use-case scenario, addressing the perception of tampered content. Based on this data, the state research hypotheses and questions are answered and further discussed, highlighting the goals achieved and the true potential of the proposed system.
5.1. Implemented Modules and System Integration
The iterative feedback from social scientists and multidisciplinary researchers highlighted the need for a user-friendly form-building tool. As a result, the design of the iMedius Form Builder focused on providing the functionalities in an easy-to-understand manner, avoiding unnecessary styling design that may cause disruption or confusion. Concerning the development technologies used and the associated software frameworks, the Form Builder was developed using the popular open-source React framework Next.js, which was selected to align with modern development standards, enabling server-side rendering, automatic code splitting and file-based routing. Also, by using the framework’s utility to build reusable components, a modular structure suited for scalability was ensured, a critical point for building production-ready applications. Likewise, eye-tracking functionality was implemented through machine learning solutions. The decision to use machine learning libraries in favor of computationally heavy geometrical analysis was driven by the need to integrate a lightweight, cost-effective tracking tool able to perform correctly without specialized equipment. On top of that, quick calibration processes enable models to retrain and adapt to the conditions of each different experiment, as further explained in a subsequent paragraph. The system is hosted on a virtual machine, ensuring complete control over the deployment environment and independence from third-party cloud tools and services, with a PostgreSQL relational database used for data management.
All features and functionalities of the tools in the iMedius framework have been implemented after careful consideration of the iterative review and feedback processes, extensively described in Section 5.2 Usability and functionality evaluation. In Figure 4, the Form Builder dashboard and the form-building interface are presented. As shown in this figure, the dashboard enables researchers to analyze aggregated statistics regarding form submissions through an interactive pie chart. Similar visualizations are presented for individual forms on their dedicated pages. Statistics visualization is an important feature providing information to facilitate users, increase user interaction and engagement. The dashboard is the main area of the platform for researchers to perform actions related to forms and enable additional functionalities. From there, the form-building interface can be accessed, presenting researchers with a drop area, where they can drag and drop various form elements to construct their survey. Using the tools provided in the drag and drop elements panel, the researcher adds necessary components such as: Title and Paragraph fields to construct form sections and provide instructions or contextual information to the participants, Image Field to add all images that will be used in the study (with or without attention tracking), video sections and various multiple choice or option selection elements, specialized to ensure the necessary structure of data collected from responses.
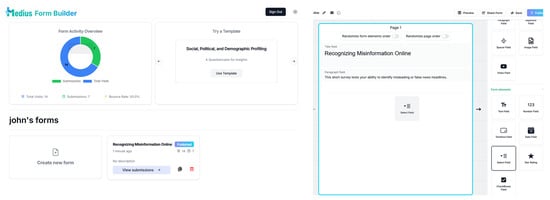
Figure 4.
The iMedius Form Builder dashboard and form-building interface.
Forms with tracking mechanisms differ from basic forms in terms of user interactivity and functionality. To ensure data privacy and security while maintaining computational efficiency and functionality, the tracking algorithms collect data only on specific time intervals during each study. More specifically, each part of the form that requires eye or mouse tracking has a specialized button that enables tracking while informing the user. By enabling an attention-tracking element, users are notified accordingly, and the data extraction process begins. For example, eye-tracking data collection is enabled through selecting to inspect visualized content and images in full size. Selecting this option presents participants with all the necessary information and data privacy instructions. By exiting the attention-tracking process of each element, the survey’s content is automatically revealed, and attention tracking is disabled. Surveys that incorporate attention-tracking mechanisms require additional steps from participants. To ensure high data precision in the data collection process, a dedicated calibration page for eye-tracking algorithms has been implemented (Figure 5). Eye-tracking calibration follows a systematic process of pointing and clicking in various parts of a detailed background to configure the initial algorithm measurements correctly. Our decision to use a background that mimics a real web environment, discarding the typical blank canvas used in calibration processes, was made to increase engagement. Internal testing confirmed improved calibration accuracy with this approach. Extensive testing was conducted to determine an optimal default threshold for calibration accuracy. Participants who do not meet this threshold during calibration are advised to repeat the process. An accuracy value of 89% was selected as the default, offering a balanced trade-off between realistic experiment conditions (e.g., suboptimal lighting, participant movement) and reliable data collection. Researchers can modify this threshold to better suit their study requirements. Notably, our real-world experiments yielded an average calibration accuracy of 95% (±2.1%), significantly exceeding the default threshold. This further validates our decision to set a reasonable minimum value that ensures accurate tracking.
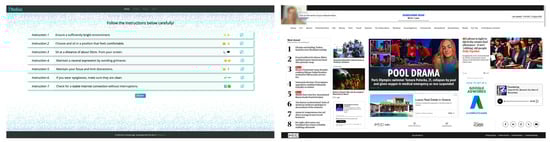
Figure 5.
The eye-tracking calibration process.
Participants are required to conduct this process once per survey, following the instructions carefully in order for the system to analyze and correlate the data collected from mouse and eye movement. Given the utilization of AI algorithms, this data serves as training samples to train the algorithms further and fine-tune them to function correctly in the given test conditions. On all stages of survey submission, pseudo-anonymization techniques are employed to ensure that personal identifiers are not stored or linked to collected data. With this approach, the system prioritizes participant privacy while enabling rich data collection about the surveyed topic.
The Browser Tracking extension (logging browsing history) is designed to work as a complementary tool for the Form Builder (this option is considered optional, not placed in the core of the current research, and is presented here for the sake of completeness). At the form-building stage, researchers can activate the browser extension functionality and enable tracking during form submission. Forms involving the extension will notify the participants and request the required permissions to function. Participants have to apply a simple configuration on the same page as the form, providing a username to enable pseudo-anonymization of the collected data. If users refuse to activate the extension, no data collection process is activated. Moreover, during the survey, participants have the option to opt out of browser tracking and delete all relevant data. In the settings section, participants have full control of their data, enabling them to preview what is recorded, delete undesired collected data or entire sessions. The extension can record a detailed sequence of visited sites, capturing Web URLs and queries, Facebook and YouTube links and generic webpages. Additionally, browser tracking can be extended to incorporate attention tracking, similarly to the Form Builder, providing a complete data collection system designed to capture user browsing behavior, attention patterns, and screen activity during web sessions.
Both the Form Builder and Browser Extension tools utilize the open-source JavaScript library Webgazer.js [39] to perform eye tracking. As a lightweight library, it offers an optimal trade-off between computational costs and tracking effectiveness. WebGazer uses machine learning techniques based on linear and regularized regression models to estimate gaze locations. As previously stated, our integrated, cross-tool attention-tracking approach enables modular development. More specifically, as eye-tracking research advances, the tracking algorithms can be seamlessly updated to both tools, avoiding data synchronization issues and preventing functionality conflicts between different tracking frameworks.
Data visualization is a key factor in efficiently utilizing the extracted data and also assessing its usefulness. By visualizing the results of the surveys correctly, researchers can enrich their analysis, gaining from the best-suited data representation tailored to their needs. The adopted data visualization methodology follows the same principles as those presented in the work of [40]. There are two methods for visualizing data extracted from attention-tracking functionalities—fixation maps and heatmaps. Fixation maps visualize the interaction of participants with the content over time by leveraging the timestamps associated with each data point. In the iMedius framework, heatmaps are provided in a tunable form through adjustable sliders (Figure 6). Heatmaps present a time-intensity summarization of the recorded attention activity (i.e., coloring with more intense colors the areas that gathered users’ attention the most). Researchers can configure the sliders and select the appropriate representation transitioning from raw data points to smoothed heatmaps.
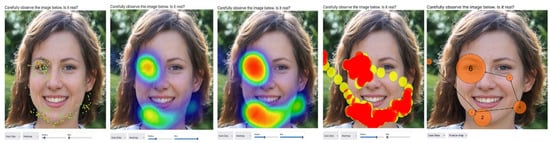
Figure 6.
The visualization (results) of the attention-tracking functionality.
Regarding the iMedius social media monitoring toolbox, it also has a complementary role (especially in the present work), detecting thematic topics or media trends in the pre-intervention phases through its topic modeling capabilities, thus helping better organize the corresponding surveys and monitoring sessions. Topic modeling is the process of using statistical models to automatically discover abstract topics hidden in a collection of documents. In the context of social media, topic modeling is used to make sense of large amounts of unstructured text data by breaking it down into smaller groups that each represent a topic or theme. This allows researchers to explore how different conversations or narratives are formed across a dataset. In social research, this process is beneficial but is often performed manually, especially when the dataset is small. However, this manual approach becomes almost impossible when dealing with large datasets, which are now very common due to the high volume of content generated daily on social media platforms. Therefore, automatic topic modeling is an important step for researchers who want to work efficiently and at scale. The iMedius social media monitoring toolbox supports users throughout this process. It not only offers a simple graphical user interface for applying topic modeling techniques but also provides a full workflow that guides users through each step of the process, making topic modeling more efficient and more accessible.
A comprehensive comparison of various tools for attention tracking and survey creation is presented in the following table. It highlights the key features of the iMedius platform alongside other widely used tools, including iMotions, WebGazer, LimeSurvey, and Google Forms. Table 2 outlines functionalities such as dynamic questionnaire creation, attention tracking (mouse and gaze), and integration with other features. The comparison offers a clear overview of how the iMedius platform stands out in providing an integrated and flexible solution for attention tracking and behavioral analysis, making it a more powerful choice for researchers in this field. As we can see, many of the listed utilities are not even considered in some of the competing tools (listed as NA, i.e., non-Applicable), fact that reveals the superior integration and adaptability that iMedius framework offers, which, according to the literature review and the conducted research, is considered essential for behavioral monitoring in many social science directions.
Table 2.
Comparison of key functionalities across iMedius, iMotions, WebGazer, LimeSurvey, and Google Forms.
5.2. Usability and Functionalities Evaluation
As already stated in Section 4.2, the evaluation of the platform and its functionalities is considered of great importance to ensure that its reliability, usability, and ease of use for the targeted users. This step (Alpha testing) involved assessing the tool based on its content (features) and operations. Iterative internal sessions were organized and conducted within the interdisciplinary research team to obtain feedback on the ease of utilizing the platform and its respective features (survey creation, building questionnaires, and using the attention-tracking mechanisms).
The evaluation of the platform detected a number of issues that had to be addressed to facilitate easy use and match the social science researchers’ expectations. To make the platform more usable and adaptable, different solutions were put in place. The upgrades included a form duplication mechanism, increased character limitations for text inputs, choices for formatting text, and the ability to randomize questions and pages. These changes made the iMedius Form Builder easier to use and more useful for researchers involved in complicated studies.
Specifically, a “Duplicate” option was added, allowing users to copy existing forms for research that requires repetition or comparison across multiple instances. The character limit for text input fields was raised to 2000 characters to facilitate more complicated social science questions, enabling researchers to give more extensive instructions and context to the participants of their studies. Regarding style, basic text formatting choices were added, including bold, italics, line breaks, and list creation. The appearance and clarity of questions were enhanced, particularly for complicated questions. To enable form creators to identify required modifications and ensure the form’s visual appeal and functionality, a “Preview Mode” button was added, allowing the form to be inspected from the respondent’s viewpoint. Furthermore, taking into consideration that randomizing the sequence of questions and pages helps decrease bias and produce reliable and trustworthy data, mechanisms were added to allow users to randomize the sequence of questions and pages.
In terms of the platform’s collaborative nature, a “Share” option was introduced. This feature enables co-researchers to collaborate on constructing things, allowing multiple users to share and work on forms simultaneously. It makes it easier for people to work together, share ideas, and make sure that multiple points of view are taken into account while designing and building the tools, thus making the research process better and more effective. Finally, in addition to the primary form creation process, form templates were added to assist researchers in structuring their forms. In this context, there is the opportunity to broaden the template area with further options as the project progresses and additional effective, validated, and engaging surveys are developed. Some of the points discussed above, including the addition of the “Preview Mode” button, the capability to randomize the sequence of questions and pages, and the introduction of the “Share” feature for collaboration, have been thoroughly examined in a prior study focused in the areas of UX evaluation of the platform through a focus group with subject matter experts [41].
Apart from this formative evaluation and its associated adaptation and debugging processes, all the members of the multidisciplinary iMedius research team (18 in total) were requested in these sessions to answer and discuss the semi-structured interview questions of Table 1, which were mainly crafted to obtain qualitative feedback in the Beta testing. No doubt, this procedure involves a significant amount of subjectivity for several reasons (i.e., most iMedius researchers had prior knowledge of the targeted functionalities from their involvement in the project proposal preparation, and they gradually became more familiar with the desired features over time). Still, it was important to monitor the levels of confidence statistically increasing in all questioning items, with the corresponding variance in the given answers constantly decreasing, thus validating the chain of testing, debugging, updating, and overall progress within the interdisciplinary participatory design.
The Beta testing phase, providing feedback by actual users outside the project team, is essentially the first real-world environment. As already noted, the associated sessions were conducted on the occasion of the 2024 iMEdD International Journalism Forum, where a related iMedius-driven workshop took place and an iMedius stand was placed at the venue, the so-called Media Village, inviting participants to interact with the platform. Specifically, twenty (20) semi-structured interviews were conducted with ten (10) people with a theoretical/social science background (Media Professionals/Journalists) and ten (10) with a background in media technology and software engineering, who provided feedback answering the question of Table 1, after interacting with the platform.
The five (5) questions were aimed at collecting data about the overall value of the iMedius platform and its potential to be utilized in media studies. Responses to Q1 showed that participants had different levels of comfort with using attention monitoring technology for research purposes. Several participants were in favor of the proposal, provided that rigorous data protection procedures are in place. Social scientists stressed the need for honesty and openness, saying that people should know how their data will be used. Technologists said that encrypting and anonymizing data could help with privacy issues by making it easier to use these methods in research. It is interesting to note that none of the answers revealed subjects being downright uncomfortable, which suggests that they would be okay with these technologies in the correct situations.
When people discussed the most significant characteristics of a form-building tool, they mentioned that usability, data analysis capabilities, and privacy were the most important (Q2). Many people noted that ease of use, data analysis features, security and privacy aspects are all equally important. They declared that these characteristics make form-building tools far more valuable and trustworthy. Another significant aspect that arose was the option to customize forms to meet individual needs. Many participants expressed their appreciation for such a feature. These answers show that users are in favor of form-building tools being simple to use and safe, without requiring demanding know-how, so that average users with low technological expertise can efficiently operate them. Social scientists emphasized the importance of the tool being able to adapt to the needs of different types of studies (cross-sectional studies, experiments, etc.). On the other hand, those coming from the technology domain underlined the importance of keeping data safe.
The review of the iMedius Form Builder was enormously positive. Social scientists appreciated the ease of use, while technologists valued the customization and data-driven capabilities (Q3). Everyone who took part in the study found the iMedius platform to be useful, with 17 of them describing it as very useful for creating surveys. Notably, none of the responses reveal that people were unhappy or that the platform lacks practicality and usefulness. This result shows that iMedius can significantly assist diverse groups of researchers and media professionals in executing and collecting data for their studies.
The majority of those who participated in the demonstration of the platforms stated that attention tracking seems beneficial for studying how people consume news (Q4). Most answers characterized this as a desired feature to acquire more insightful information for media studies, expressing the importance of studying the way people interact with news content, so as to optimize it. A participant from the social scientists group stated:
“Attention tracking capabilities are very important because they help us understand how consumers interact with media on a deeper level, which we can then use to improve content and make it more interesting”.
Social scientists also noted that it can help determine how interested or engaged readers are with content. At the same time, technologists emphasized the use of AI services to visualize and interpret this data.
Finally, participants’ experimentation with attention tracking helped us to extract valuable data about its value in media studies (Q5). Most of the subjects supported that the integration of attention-tracking technologies in the Form Builder is beneficial, as it will help them gain a better understanding of how people read news and interact with media.
All interviews mentioned that one of the best aspects of the implemented tool is that it enables more data extraction, which enhances the study of user behavior. The statement of a Media Researcher illustrates the above finding:
“This tool’s power to capture attention will significantly deepen my understanding of users’ behavior by providing insights that would have been difficult to gather otherwise”.
Also, most of the people who took part in the semi structure interviews stated
“they would definitely recommend the products to coworkers or peers in their sector”
And, commenting on the open access, free of charge nature of the tool, added that
“the fact that it is free makes it even more accessible and beneficial for researchers with limited resources”.
It is important to note that none of the participants found the attention-tracking utilities to be non-useful, proving that people really liked the idea of combining forms with attention monitoring in media studies. On top of that, social scientists indicated that combining qualitative and quantitative data can help researchers better understand user experience. On the other side, technology experts argued that acquiring more data can make studies more accurate. In all cases, positive feedback was received, with little or no specific comments indicating critical problems or difficulties in resolving them.
5.3. Pilot Implementation and Assessment: The Case of Tampered Images Perception Analysis
Following its configuration, the pilot real-world scenario focusing on tampered images perception analysis was implemented during three sessions of one and a half hours each, elaborating on previous research [34] with the incorporation of attention-tracking mechanisms. The inclusion of this pilot study in the current work serves to assess the maturity and practical applicability of the developed framework in a real-world media impact analysis scenario, directly addressing research question RQ2. Given the exploratory nature of the study, the small sample size is not intended to draw definitive, generalizable conclusions but rather to serve as an initial step in the tool’s validation.
Using the iMedius Form Builder and the attention-tracking capabilities, the primary goal was to investigate how the progressive provision of information (technical tools, searches, AI detectors of tampered content, etc.) affects participants’ ability to recognize authentic, AI generated, and manipulated images. The participants were 28 students in the fields of Journalism, Digital Media, and Communication in three Greek universities (Ionian University, Aristotle University of Thessaloniki, and University of Western Macedonia).
Initially, participants were informed about the research scope and the inclusion of attention tracking in the survey. They were asked to work on their own laptops and follow carefully a series of instructions. Specifically, they had to ensure a sufficiently bright environment, fit in a comfortable position, keep about 50cm from their screen, maintain a neutral expression by avoiding grimaces, limit distractions, make sure their eyeglasses were clean and check for a stable internet connection without interruptions. After the completion of the calibration process, participants filled out a standardized questionnaire concerning some demographics (e.g., gender, age, educational level, monthly income), their opinions on social and political issues, such as criminality, justice and equality, and their attitudes towards institutions and the media (e.g., trust and credibility).
Participants were then asked to determine the authenticity of a presented image and decide whether it was authentic, AI generated, or digitally manipulated, after inspecting it in full size, with this viewing mode also activating the attention-tracking mechanism. The evaluation process for each image followed a sequential five-step protocol:
- Simple observation: Participants viewed the image without any additional context or tools.
- Color map analysis: Participants viewed color maps highlighting potential areas of alteration on the image.
- Probability map analysis: Participants examined probability maps indicating regions likely to have been generated or altered, along with a forgery probability percentage.
- Reverse image search: Participants were provided with the results of a reverse image search to assess the previous online presence of the image.
- AI probability assessment: Participants were shown the results of an AI probability assessment tool to find out whether the image had been AI-generated or manipulated.
At each step, participants were required to classify the image as authentic, AI generated, or digitally manipulated, and to justify their decision using a predefined set of responses. This self-reported data was integrated alongside the attention-tracking data, allowing for a comprehensive understanding of how participants’ subjective justifications aligned with their visual engagement, as captured by eye tracking and gaze data.
The sequence of image evaluation began with an authentic image, during which only the first four steps were applied (i.e., the AI probability assessment tool was excluded). Then, the presentation of an AI generatedimage and a digitally manipulated image followed, each of which underwent the complete five-step evaluation process.
Initially, participants were asked to observe the authentic image without any prior knowledge. However, only 11 of them recognized it correctly as authentic, a number equal to those who considered it manipulated. However, this first step was the one with the highest accuracy, since the contribution of the color maps led three participants to change their mind and evaluate the image as manipulated rather than authentic. Simultaneously, the analysis of the iMedius platform extracted heatmaps provides additional data about participants’ visual strategies throughout the various steps of the study (Figure 7). Specifically, in Step 1, participants focused closely on Trump’s face and hands, as these areas possess significant diagnostic value; faces indicate asymmetries and unnatural textures, while hands often reveal morphological inconsistencies in deepfake and AI-generated images. Their emphasis indicates an inherent quest for nuanced irregularities within intricate visual characteristics. This behavior is consistent with established research indicating that humans inherently focus on faces and extremities when identifying synthetic modifications [63]. The introduction of Color maps (Step 2) significantly redirected visual attention to the artificial color patterns, resulting in possible over-analysis, thus reducing the number of correct answers. Neither did the probability map (Step 3) nor the reverse image search (Step 4) restore confidence in the authenticity of the image (Table 3). In more detail, in Step 3, participants predominantly focused on the probability map instead of the image under examination. They focused on the tool’s visual indicators of manipulation, suggesting that the system’s technical output more influenced their answer than the content presented, indicating a transition from natural visual interpretation to tool-driven reasoning, which, in the case of an authentic image, may lead to “misdiagnosis”. The introduction of reverse image search results (Step 4) directs focus from the image itself to the contextual metadata, including titles, thumbnails, and source information, as participants pursued external validation (Figure 8). Step 5 (AI probability assessment) was not applied to the authentic image and is therefore excluded from this heatmap interpretation.
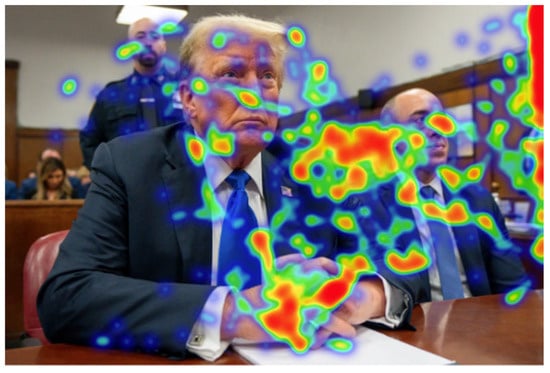
Figure 7.
Attention-tracking results for the authentic image during Step 1 (Simple Observation), based on an eye-tracking heatmap, showing how participants visually examined the image without additional contextual cues or analysis tools.
Table 3.
Classification outcomes for the authentic image (Authentic, AI generated or Digitally Manipulated) across the five-step protocol: simple observation, color map analysis, probability map analysis, reverse image search, and AI probability assessment. Note: Step 5 (AI probability assessment) was not applied in the case of the authentic image.
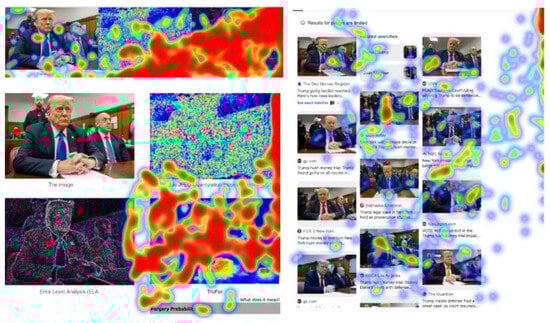
Figure 8.
Attention-tracking results for the authentic image (Steps 2–5), based on eye-tracking heatmaps, illustrating participants’ visual focus during color map analysis, probability map interpretation, reverse image search, and AI probability assessment.
Then, the second image was presented to the participants, and most of them correctly identified it as AI generated, just by simply observing it (Step 1) (Figure 9). Color maps (Step 2) caused a slight decrease in accuracy, possibly due to over-analysis or misinterpretation. The probability map during Step 3 partially corrected the drop, confirming the initial intuitive judgment. Subsequent tools in Steps 4 and 5 (reverse image search and AI probability assessment) did not significantly change the performance, indicating that the recognition was already established (Table 4) (Figure 10).
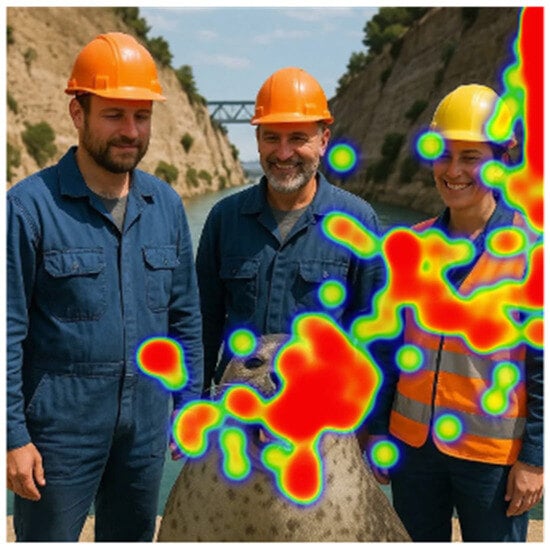
Figure 9.
Attention-tracking results for the Ai generated image during Step 1 (Simple Observation), based on an eye-tracking heatmap, showing how participants visually examined the image without additional contextual cues or analysis tools.
Table 4.
Classification outcomes for the AI-generated image (Authentic, AI generated, or Digitally Manipulated) across the five-step protocol: simple observation, color map analysis, probability map analysis, reverse image search, and AI probability assessment.
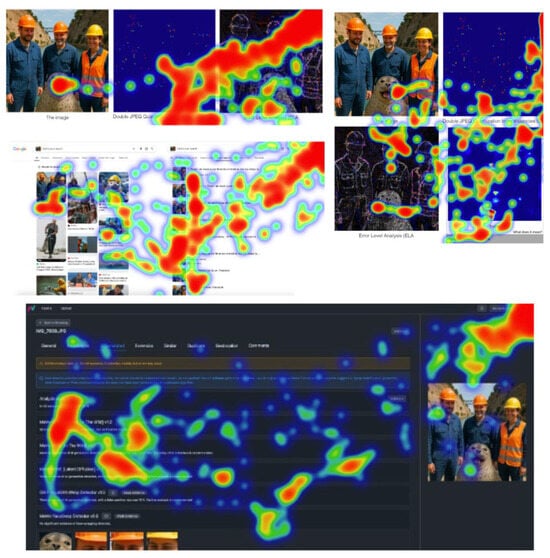
Figure 10.
Attention-tracking results for the AI-generated image (Steps 2–5), based on eye-tracking heatmaps, illustrating participants’ visual focus during color map analysis, probability map interpretation, reverse image search, and AI probability assessment.
The attention heatmap analysis of the AI-generated image depicting the seal indicates a structured evolution in participants’ visual behavior, moving from intuitive inspection to tool-assisted verification. In the initial observation (Step 1), the gaze predominantly concentrated on the seal rather than the human figures. The interest in the unusual element indicates the presence of cognitive dissonance, although it does not imply a definitive suspicion of manipulation at that point. With the introduction of technical cues (Step 2), visual attention was directed toward particular regions indicative of potential tampering. Participants approached these regions with curiosity instead of certainty, suggesting an exploratory rather than diagnostic application of the tool. The incorporation of the probability map (Step 3) enhanced focus on the seal and adjacent facial areas. Gaze patterns indicate that participants actively sought confirmation of their suspicions via tool-generated markers, increasingly depending on the visual guidance offered by digital forensic platforms. In Step 4 (Reverse Image Search), considerable focus was placed on the search results, especially on images depicting alternative versions of the scene. This phase initiated an apparent emergence of doubt, as participants started to contemplate the possibility that the seal may not be associated with the original context of the image. In Step 5, the AI assessment incorporated both the original content and user-generated commentary, or visual evidence sourced from online platforms. Participants systematically compared the suspect image with external findings to obtain definitive confirmation. The impact of collective analysis reinforced their conclusions.
Regarding the third, digitally manipulated image, most participants incorrectly identified it as authentic after simple observation. The use of forensic tools led to a gradual improvement in the evaluation. Specifically, in Steps 2 and 3 (after color and probability maps), a slight increase in accuracy was observed (up to 10%). The reverse image search was decisive, as in Step 4, the accuracy reached 62%, while no participant characterized the image as authentic. In the final step (Step 5), the accuracy declined (~41%), while the responses became more fragmented. The AI probability assessment tool may have created confusion or doubt, rather than enhancing performance (Table 5).
Table 5.
Classification outcomes for the Digitally Manipulated image (Authentic, AI generated, or Digitally Manipulated) across the five-step protocol: simple observation, color map analysis, probability map analysis, reverse image search, and AI probability assessment.
The examination of the heatmaps for the digitally manipulated image reveals a progressive improvement in participants’ visual behavior, following the introduction of external tools and context. In the initial observation (Step 1), attention was broadly dispersed throughout the crowd, lacking a distinct focal point. Step 2 directed focus toward distorted areas within the image. Nonetheless, the gaze was disorganized, as participants searched for indications of manipulation without a coherent visual strategy.
The implementation of the probability map (Step 3) markedly changed visual engagement, suggesting a more intentional effort to identify tampering through the tool’s forensic indicators. In Step 4 (Reverse Image Search), focus shifted to comparative evaluation. Participants conducted a visual analysis of various iterations of the image displayed in the search results, systematically comparing them to detect discrepancies, signifying a shift from internal evaluation to external visual validation. In Step 5, which involves AI probability assessment, significant emphasis was placed on the commentary and associated images. The heatmaps indicate that participants engaged in focused reading of crowd-sourced interpretations and conducted analyses of alternative image versions (Figure 11 and Figure 12).
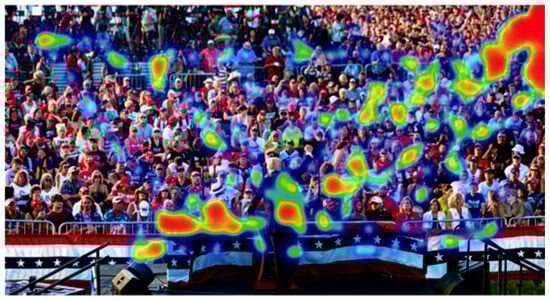
Figure 11.
Attention-tracking results for the Digitally Manipulated image during Step 1 (Simple Observation), based on eye-tracking heatmap, showing how participants visually examined the image without additional contextual cues or analysis tools.
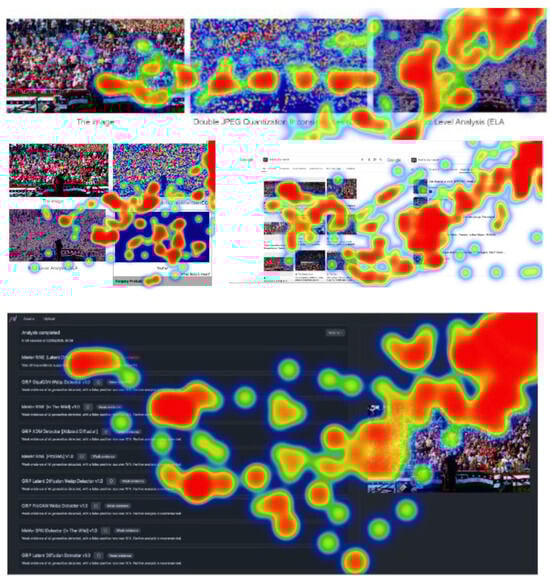
Figure 12.
Attention-tracking results for the Digitally Manipulated image (Steps 2–5), based on eye-tracking heatmaps, illustrating participants’ visual focus during color map analysis, probability map interpretation, reverse image search, and AI probability assessment.
Building on the previous analysis, the correlations between the responses and the justifications provided by participants were investigated. Chi-Square Test of Independence was applied to examine the relationship between the two categorical variables: the type of image classification (Authentic, AI generated, Manipulated) and the justification reasons provided by participants for their previous classification. The Chi-Square Test was performed at each of the five steps in the image evaluation process, with the primary goal of determining whether the distribution of justification reasons significantly differed based on the type of image classification. Specifically, it was tested whether certain justification reasons were more likely to be associated with a particular type of image (Authentic, AI generated, or Manipulated).
The results of the Chi-Square Test indicate significant correlations in the earlier steps of the evaluation process, particularly during the initial steps (Step 1, Step 2, and Step 3), where participants relied more on personal criteria, such as visual, technical, or intuitive assessments, to justify their classification decisions. This suggests that participants’ reasoning was heavily influenced by their individual interpretations and perceptions at these stages.
In contrast, the analysis revealed that Step 4 (Reverse Image Search) had a significant influence on the participants’ decisions, as it provided external information that could either confirm or challenge their personal justifications. This external validation seemed to reduce the reliance on personal criteria, thus leading to stronger correlations between the image classification and justification reasons. However, in some cases, the introduction of external information led to conflicting or inconsistent justifications, indicating that the participants’ reasoning became more diverse and complex when exposed to additional tools.
Finally, Step 5 (MAAM) showed a mixed effect. In some cases, the MAAM platform enhanced the accuracy of participants’ decisions by providing further validation, while in other instances, it caused divergence and inconsistency in justification. These findings suggest that while the MAAM tool can be a helpful aid in decision-making, it may also introduce variability in participants’ assessments due to its complex nature and reliance on multiple factors.
Overall, the Chi-Square Test revealed that the type of image classification was strongly associated with participants’ justification reasons, particularly in the earlier steps of the evaluation process (Table 6).
Table 6.
Statistical tests (Chi-Square) and p-values for the relationship between image classification and justification reasons across evaluation steps. Statistical significance is marked for each step where p-values are below the 0.05 significance threshold.
The overall findings of this pilot study indicate that the introduction of color and probability maps significantly differentiated the responses, enhancing either certainty or confusion, depending on the image and profile of the participant. In the reverse image search step, participants were exposed to similar information, resulting in the alignment of their responses and the reduction of differences in justification. The AI probability assessment tool caused either confidence or doubt, as it was reflected in statistically significant differences in justifications, showing how users did not interpret their results in the same way. The statistically significant correlations in the early stages and their change subsequently confirm that the procedure applied captures the dynamic change in perception and evaluation. The above remarks indicate significantly more insightful analysis perspectives and outcomes compared to baseline studies (i.e., without the incorporation of attention tracking) [34], even in smaller-scale research (i.e., with less population and number of image samples). However, the most important aspect here is that the proposed iMedius platform makes it possible to organize such complicated surveys, incorporating attention-tracking mechanisms with multiple experimental steps to investigate the impact and effect of each different digital forensics tool or practice. With the utilities of randomization, duplication, sharing, and database handling, such forms can be elaborated with expanded numbers of randomly selected images (as in the case of [34]) to diminish any content-related bias, with much more subjects invited and involved, increasing the statistical reliability towards a broader picture, with more concrete and substantial generalization remarks.
5.4. Discussion and Answers to the Stated Research Hypothesis and Questions
Having accomplished the main objective of the current work, which is the end-to-end design, configuration, and implementation of the iMedius integration, the extracted experimental and assessment data can help answer the set hypothesis and questions. The central assumption behind the motivation of this work is that the envisioned media monitoring environment, integrating the combination of form-building management automation with flexible attention-tracking mechanisms and supplemented with further data monitoring and handling modalities, is not currently available, depriving researchers of valuable tools and resources (RH). Hence, there is a vital space to elaborate on these perspectives, incorporating multiple functionalities into a modular architecture, dynamically assembled through an iterative, interdisciplinary, participatory design and refinement process, leaning on the foundation of information systems design science research. Based on the formative evaluation outcomes and the feedback received during the Alpha and Beta testing procedures, the vast majority of the participants, who also represent the targeted audience of multidisciplinary researchers, strongly agreed that the envisioned multimodal instrument is not currently available in social science research. Another remark is that the offered functionalities are of great usefulness to interdisciplinary research collaborations, and especially in the sub-field of media studies. The high approval and usefulness of the tool, as indicated by the participants, reassures us of the project’s success. These findings align with the literature review conducted and the associated analysis phase during project development, revealing that competing applications do not exhibit the desired integration of tools and services, nor do they feature the targeted flexibility, adaptability, and ease of use.
Expanding on the set questions, the developed iMedius framework supports the envisioned multidisciplinary instruments for real-time news impact monitoring by analyzing user behavior, utilizing technologies such as dynamic questionnaires and visual attention tracking (RQ1). A major proof in this direction is that the iMedius platform is in place, it has been successfully utilized in a featured workshop during the iMEdD 2024 International Journalism Forum (gaining favorable comments and future directions feedback), and it also supported the implementation of a pilot use-case scenario, exemplifying the true potential of the iMedius toolset. Furthermore, both the iterative assessment and refinement sessions within the project team (formative evaluation and Alpha testing) and the remarks from the semi-structured interviews (Beta testing) confirmed the proper use and applicability of the crafted functionalities, which have been further demonstrated in a related publication [41].
The combined previous two paragraphs also answer a significant part of the second question (RQ2), verifying that the released platform is open, usable, and convenient in real-world scenarios of media studies, ensuring its thorough future utilization by both the research and academic communities, as well as its incorporation in professional media processes. Indeed, the conducted workshop and pilot scenario discussed above represent real-world cases that can be encountered in media studies research, as well as in digital literacy and training practices within newsrooms and media agencies (i.e., training journalists and broader personnel on how to use digital forensic tools and making them aware of common mistakes they should avoid). Furthermore, compared to baseline studies on evaluating the photo-truth impact through image verification algorithms [34], which were deployed without the use of such sophisticated tools, it has been demonstrated that iMedius introduces deeper analysis perspectives with more meaningful perception and interpretation results. In addition, this was the main reason for incorporating the use-case scenario into the current work: to test the capabilities and limitations of the iMedius framework and also to highlight new, impactful, and more sophisticated visualization and analysis methods. Based on the feedback gained by both the team members (especially those coming from social sciences) and all the implicated participants (i.e., in the iMEdD workshop, the Beta testing, and the pilot use case), the tools are suitable in a broader area of multidisciplinary research, from cognitive and behavioral studies to public communication, marketing, digital literacy, and more.
6. Summary, Future Work, and Conclusions
The current work provides an in-depth presentation of an AI-driven framework that focuses on media content impact monitoring, utilizing attention-tracking mechanisms (primarily, eye and mouse tracking). From the methodological point of view, the combination of rapid prototyping models with interdisciplinary processes of participatory design and evaluation meets the information systems design science research, enabling successive feedback, amendments, and improvements through stakeholder engagement. More specifically, a dynamic Form Builder has been integrated into the core of the development, supplemented with various attention-tracking mechanisms, thereby forming a multimodal social instrument designed to manage pre- and post-intervention questionnaires and link data to tracking maps. The modular architecture of this open web environment, which allows various modalities to be added and adapted to the needs of social science and multidisciplinary research, contributes to the collection of both subjective and objective data, alongside the tracking results. The developed framework emphasizes an innovative approach to monitoring user interactions and behavior, as well as the impact of news streams, binding methodological instruments from the social sciences with advanced algorithm-assisted and machine learning techniques.
The thorough justification, analysis, and documentation of the iMedius motivation, development, and evaluation underscore specific points of successful implementation. Initially, participants in the Alpha and Beta testing procedures (internal team members and external interviewees) provided overwhelmingly positive feedback regarding the need for such an integrated structure and the potential contribution of iMedius to research. Furthermore, the pilot real-world scenario, centered on the verification of tampered visual content, pointed out particular practical applications the framework could have in media environments, both in newsrooms and in research fields. Understanding user behavior through different sources of data can effectively influence the design process of media organizations’ strategies and, thus, contribute to the direction of improving the hurt (in terms of trustworthiness) relationship between professional journalism and its audience.
Future development plans include expanding the iMedius framework to support full mobile compatibility, enabling broader accessibility and cross-platform data collection. To achieve this, careful consideration must be given to adapting the existing machine learning models, employing methods such as knowledge distillation [64] and model quantization [65] to reduce computational cost while maintaining performance. Furthermore, as the Form Builder already supports data format compatibility with modern analytics tools, we aim to expand in this direction by enabling the integration of external tools to complement attention tracking, study creation and behavioral analysis processes.
The progress of AI-assisted tools already maps out a promising landscape regarding the future capabilities of the iMedius framework, especially in light of its customization potential. In this direction, specific additional services are considered and currently investigated, including the use of Large Language Models (LLMs) for communicating with the users/researchers, recording their needs, directing and helping them to serve the concrete scope of their research by recommending the most suitable configuration of test arrangements, (standardized) questionnaires, attention-tracking methods, ethical, data monitoring, and analysis protocols. The gradual expansion of the iMedius repository would enable the construction of a related ground-truth database, thereby helping classify survey needs and types associated with media studies (and broader multidisciplinary research), acquire valuable knowledge, and organize this know-how for developing related automations through paradigm-driven solutions and best practices adoption. In a similar vein, properly adapted LLMs can be elaborated to include targeted types of (statistical) analysis or visualization tools and paradigms. Hence, apart from its obvious usefulness in conducting research, this open multimodal research instrument can further facilitate training and media literacy needs, helping young researchers comprehend the implicated theories through practical means, while also supporting journalists, communicators, and broader media professionals in their associated needs of media impact analysis and users’ reactions monitoring. Most of all, interdisciplinary collaboration and engagement with innovative AI-assisted tools and practices will enable implicated users to become more familiar with AI technologies and their surrounding ethical and societal implications, thus allowing them to contribute to the need for forming multidisciplinary, balanced, and sustainable solutions.
Author Contributions
Conceptualization, A.K., T.S., S.P. and C.D.; data curation, A.K., P.X. and T.S.; methodology, A.K. and C.D.; software, P.X. and S.P.; supervision, S.P. and C.D.; validation, A.K., T.B. and T.S.; visualization, A.K. and P.X.; writing—original draft, A.K., P.X., T.B. and T.S.; writing—review and editing, P.X., S.P. and C.D.; project administration, C.D. All authors have read and agreed to the published version of the manuscript.
Funding
This research was funded by the Hellenic Foundation for Research and Innovation under the National Recovery and Resilience Plan “Greece 2.0” with funding from the European Union–NextGenerationEU (Project number: 15545. No: 77195-28 December 2023). Professor Charalampos Dimoulas is the scientific coordinator for the iMedius project (Integrating multidisciplinary media impact assessment instruments to track news streams, extract semantics and monitor users’ reactions).
Institutional Review Board Statement
The study was conducted in accordance with the Declaration of Helsinki and was approved by the Committee on Research Ethics and Conduct of the Aristotle University of Thessaloniki, Approval Code 171808/2024, 16 July 2024.
Informed Consent Statement
Informed consent was obtained from all participants involved in the study.
Data Availability Statement
All data that are not subjected to institutional restrictions are available through the links provided within this manuscript.
Acknowledgments
The authors acknowledge the valuable contribution and collaboration with all the research team members of the iMedius project: Andreas Veglis, Andreas Giannakoulopoulos, Antonis Gardikiotis, Maria Marsiola, Lazaros Vrysis, Nikos Vryzas, Evanthia Malinaki, Lazaros Apostolidis, Minas Pergantis, Marina Stamatiadou, Efthimis Kotenidis, and Dimos Plakotaris.
Conflicts of Interest
The authors declare no conflicts of interest.
Notes
| 1 | https://imedius.gr/ (accessed on 20 June 2025) |
| 2 | https://imotions.com/ (accessed on 5 July 2025) |
| 3 | https://clarity.microsoft.com/ (accessed on 5 July 2025) |
| 4 | https://www.impala-research.com/ (accessed on 5 July 2025) |
| 5 | https://imedius.gr/en/news/7/ (accessed on 12 June 2025) |
| 6 | https://imeddforum.azurewebsites.net/en/journalism-forum-2024/ (accessed on 5 July 2025) |
| 7 | https://maam.mever.gr/about (accessed on 5 July 2025) |
References
- Kumar, S.; Verma, A.K.; Mirza, A. Digital Transformation, Artificial Intelligence and Society; Springer: Berlin/Heidelberg, Germany, 2024. [Google Scholar]
- Katsaounidou, A.; Dimoulas, C.; Veglis, A. Cross-Media Authentication and Verification: Emerging Research and Opportunities; IGI Global: Hershey, PA, USA, 2019. [Google Scholar] [CrossRef]
- Silveira, P. Fake news consumption through social media platforms and the need for media literacy skills: A real challenge for Z Generation. In INTED2020 Proceedings, Proceedings of the 14th International Technology, Education and Development Conference Valencia, Spain, 2–4 March 2020; IATED: Valencia, Spain, 2020; pp. 3830–3838. [Google Scholar]
- Kostarella, I.; Palla, Z. Sensationalism versus Substance: Exploring “Viral” and “Quality” Journalism in the Greek Public Sphere. J. Media 2024, 5, 1173–1193. [Google Scholar] [CrossRef]
- Kalfeli, P.; Angeli, C. The Intersection of AI, Ethics, and Journalism: Greek Journalists’ and Academics’ Perspectives. Societies 2025, 15, 22. [Google Scholar] [CrossRef]
- Fletcher, R.; Schifferes, S.; Thurman, N. Building the ‘Truthmeter’: Training algorithms to help journalists assess the credibility of social media sources. Convergence 2020, 26, 19–34. [Google Scholar] [CrossRef]
- Cools, H.; Diakopoulos, N. Uses of generative AI in the newsroom: Mapping journalists’ perceptions of perils and possibilities. J. Pract. 2024, 1–19. [Google Scholar] [CrossRef]
- Kostarella, I.; Saridou, T.; Dimoulas, C.; Veglis, A. Can Artificial Intelligence (AI) Spring an Oasis to the Local News Deserts? J. Pract. 2025, 1–21. [Google Scholar] [CrossRef]
- Dierickx, L.; Lindén, C.G.; Opdahl, A.L. Automated fact-checking to support professional practices: Systematic literature review and meta-analysis. Int. J. Commun. 2023, 17, 21. [Google Scholar]
- Vryzas, N.; Katsaounidou, A.; Vrysis, L.; Kotsakis, R.; Dimoulas, C. A Prototype Web Application to Support Human-CenteredAudiovisualContent Authentication and Crowdsourcing. Future Internet 2022, 14, 75. [Google Scholar] [CrossRef]
- Giddens, A.; Sutton, P.W. Essential Concepts in Sociology; John Wiley & Sons: Hoboken, NJ, USA, 2021. [Google Scholar]
- Della Porta, D.; Keating, M. (Eds.) Approaches and Methodologies in the Social Sciences: A Pluralist Perspective; Cambridge University Press: Cambridge, UK, 2008. [Google Scholar]
- Ahmadin, M. Social research methods: Qualitative and quantitative approaches. J. Kaji. Sos. Dan Budaya Tebar Sci. 2022, 6, 104–113. [Google Scholar]
- Bryman, A. Social Research Methods; Oxford University Press: New York, NY, USA, 2016. [Google Scholar]
- Hartley, J. Digital Futures for Cultural and Media Studies; Wiley-Blackwell: Chichester, UK, 2012. [Google Scholar]
- Deuze, M. Life in Media: A Global Introduction to Media Studies; MIT Press: Cambridge, MA, USA, 2023. [Google Scholar]
- McQuail, D. The future of communication studies: A contribution to the debate. Media Commun. Stud. Interv. Intersect. 2010, 27, 27–35. [Google Scholar]
- Steinfeld, N. How do users examine online messages to determine if they are credible? an eye-tracking study of digital literacy, visual attention to metadata, and success in misinformation identification. Soc. Media+Soc. 2023, 9, 20563051231196871. [Google Scholar] [CrossRef]
- Sáiz-Manzanares, M.C.; Marticorena-Sánchez, R.; Martín Antón, L.J.; González-Díez, I.; Carbonero Martín, M.Á. Using eye tracking technology to analyse cognitive load in multichannel activities in university students. Int. J. Hum.–Comput. Interact. 2024, 40, 3263–3281. [Google Scholar] [CrossRef]
- Holmqvist, K.; Nyström, M.; Mulvey, F. Eye tracker data quality: What it is and how to measure it. In Proceedings of the Symposium on Eye Tracking Research and Applications, Santa Barbara, CA, USA, 28–30 March 2012; pp. 45–52. [Google Scholar]
- Holmqvist, K.; Nyström, M.; Andersson, R.; Dewhurst, R.; Jarodzka, H.; Van de Weijer, J. Eye Tracking: A Comprehensive Guide to Methods and Measures; OUP Oxford: New York, NY, USA, 2011. [Google Scholar]
- Brockinton, A.; Hirst, S.; Wang, R.; McAlaney, J.; Thompson, S. Utilising online eye-tracking to discern the impacts of cultural backgrounds on fake and real news decision-making. Front. Psychol. 2022, 13, 999780. [Google Scholar] [CrossRef]
- Liu, Y.; Chen, Y.; Tang, J.; Sun, J.; Zhang, M.; Ma, S.; Zhu, X. Different users, different opinions: Predicting search satisfaction with mouse movement information. In Proceedings of the 38th International ACM SIGIR Conference on Research and Development in Information Retrieval, Santiago, Chile, 9–13 August 2015; pp. 493–502. [Google Scholar]
- Wedel, M.; Pieters, R. Eye tracking for visual marketing. Found. Trends® Mark. 2008, 1, 231–320. [Google Scholar] [CrossRef]
- McAfee, A.; Brynjolfsson, E. Machine, Platform, Crowd: Harnessing our Digital Future; WW Norton & Company: New York, NY, USA, 2017. [Google Scholar]
- Xu, R.; Sun, Y.; Ren, M.; Guo, S.; Pan, R.; Lin, H.; Sun, L.; Han, X. AI for social science and social science of AI: A survey. Inf. Process. Manag. 2024, 61, 103665. [Google Scholar] [CrossRef]
- Novák, J.Š.; Masner, J.; Benda, P.; Šimek, P.; Merunka, V. Eye tracking, usability, and user experience: A systematic review. Int. J. Hum.–Comput. Interact. 2024, 40, 4484–4500. [Google Scholar] [CrossRef]
- Zare, A.; Motadel, M.R.; Jalali, A. Presenting a hybrid model in social networks recommendation system architecture development. AI Soc. 2020, 35, 469–483. [Google Scholar] [CrossRef]
- Ogunseyi, T.B.; Avoussoukpo, C.B.; Jiang, Y. A systematic review of privacy techniques in recommendation systems. Int. J. Inf. Secur. 2023, 22, 1651–1664. [Google Scholar] [CrossRef]
- Schmank, J.; Buchkremer, R. Navigating the Digital Public Sphere: An AI-Driven Analysis of Interaction Dynamics across Societal Domains. Societies 2024, 14, 195. [Google Scholar] [CrossRef]
- Kotsakis, R.; Vrysis, L.; Vryzas, N.; Saridou, T.; Matsiola, M.; Veglis, A.; Dimoulas, C. A web framework for information aggregation and management of multilingual hate speech. Heliyon 2023, 9, e16084. [Google Scholar] [CrossRef]
- Simonov, A.; Valletti, T.; Veiga, A. Attention spillovers from news to ads: Evidence from an eye-tracking experiment. J. Mark. Res. 2025, 62, 294–315. [Google Scholar] [CrossRef]
- Katsaounidou, A.N.; Gardikiotis, A.; Tsipas, N.; Dimoulas, C.A. News authentication and tampered images: Evaluating the photo-truth impact through image verification algorithms. Heliyon 2020, 6, e05808. [Google Scholar] [CrossRef]
- Kotsakis, R.; Dimoulas, C.; Kalliris, G.; Veglis, A. Emotional prediction and content profile estimation in evaluating audiovisual mediated communication. Int. J. Monit. Surveill. Technol. Res. 2014, 2, 62–80. [Google Scholar] [CrossRef]
- Prakash, P.R.; Anuradha, D.; Iqbal, J.; Galety, M.G.; Singh, R.; Neelakandan, S. A novel convolutional neural network with gated recurrent unit for automated speech emotion recognition and classification. J. Control. Decis. 2023, 10, 54–63. [Google Scholar] [CrossRef]
- Zampoglou, M.; Papadopoulos, S.; Kompatsiaris, Y.; Bouwmeester, R.; Spangenberg, J. Web and social media image forensics for news professionals. In Proceedings of the International AAAI Conference on Web and Social Media, Cologne, Germany, 17–20 May 2016; Volume 10, pp. 159–166. [Google Scholar]
- Schinas, M.; Galopoulos, P.; Papadopoulos, S. MAAM: Media Asset Annotation and Management. In Proceedings of the 2023 ACM International Conference on Multimedia Retrieval, Thessaloniki, Greece, 12–15 June 2023; pp. 659–663. [Google Scholar]
- Cullipher, S.; Hansen, S.J.; VandenPlas, J.R. Eye tracking as a research tool: An introduction. In Eye Tracking for the Chemistry Education Researcher; American Chemical Society: Washington, WA, USA, 2018; pp. 1–9. [Google Scholar]
- Peeters, R. The agency of algorithms: Understanding human-algorithm interaction in administrative decision-making. Inf. Polity 2020, 25, 507–522. [Google Scholar] [CrossRef]
- Papoutsaki, A.; Sangkloy, P.; Laskey, J.; Daskalova, N.; Huang, J.; Hays, J. WebGazer: Scalable webcam eye tracking using user interactions. In Proceedings of the 25th International Joint Conference on Artificial Intelligence (IJCAI), New York, NY, USA, 9–15 July 2016; pp. 3839–3845. [Google Scholar]
- Pergantis, M.; Xylogiannis, P.; Vryzas, N.; Papadopoulos, S.; Giannakoulopoulos, A.; Dimoulas, C. UX evaluation and best practices for social research data-collection tools: The case of iMedius FormBuilder. In Proceedings of the CHIGreece 2025, Syros, Greece, 24–26 September 2025. [Google Scholar]
- Lewandowska, A.; Rejer, I.; Bortko, K.; Jankowski, J. Eye-Tracker Study of Influence of Affective Disruptive Content on User’s Visual Attention and Emotional State. Sensors 2022, 22, 547. [Google Scholar] [CrossRef] [PubMed]
- Rosas, H.J.; Sussman, A.; Sekely, A.C.; Lavdas, A.A. Using Eye Tracking to Reveal Responses to the Built Environment and Its Constituents. Appl. Sci. 2023, 13, 12071. [Google Scholar] [CrossRef]
- Abbad-Andaloussi, A.; Lübke, D.; Weber, B. Conducting eye-tracking studies on large and interactive process models using eyemind. SoftwareX 2023, 24, 101564. [Google Scholar] [CrossRef]
- Kohout, S.; Kruikemeier, S.; Bakker, B.N. May I have your Attention, please? An eye tracking study on emotional social media comments. Comput. Hum. Behav. 2023, 139, 107495. [Google Scholar] [CrossRef]
- Beuckels, E.; De Jans, S.; Cauberghe, V.; Hudders, L. Keeping up with media multitasking: An eye-tracking study among children and adults to investigate the impact of media multitasking behavior on switching frequency, advertising attention, and advertising effectiveness. J. Advert. 2021, 50, 197–206. [Google Scholar] [CrossRef]
- Navalpakkam, V.; Churchill, E. Mouse tracking: Measuring and predicting users’ experience of web-based content. In Proceedings of the SIGCHI Conference on Human Factors in Computing Systems, Austin, TX, USA, 5–10 May 2012; pp. 2963–2972. [Google Scholar]
- Kieslich, P.J.; Schoemann, M.; Grage, T.; Hepp, J.; Scherbaum, S. Design factors in mouse-tracking: What makes a difference? Behav. Res. Methods 2020, 52, 317–341. [Google Scholar] [CrossRef]
- Egner, S.; Reimann, S.; Hoeger, R.; Zangemeister, W.H. Attention and information acquisition: Comparison of mouse-click with eye-movement attention tracking. J. Eye Mov. Res. 2018, 11, 10–16910. [Google Scholar] [CrossRef] [PubMed]
- Liakou-Zarda, M.; Tzafilkou, K. Mouse tracking and consumer experience: Exploring the associations between mouse movements, consumer emotions, brand awareness and purchase intent. Behav. Inf. Technol. 2024, 43, 1924–1937. [Google Scholar] [CrossRef]
- Robal, T.; Zhao, Y.; Lofi, C.; Hauff, C. IntelliEye: Enhancing MOOC learners’ video watching experience through real-time attention tracking. In Proceedings of the 29th on Hypertext and Social Media, Baltimore, MD, USA, 9–12 July 2018; Association for Computing Machinery: New York, NY, USA, 2018; pp. 106–114. [Google Scholar]
- Park, Y.; Doo, M.Y. Role of AI in blended learning: A systematic literature review. Int. Rev. Res. Open Distrib. Learn. 2024, 25, 164–196. [Google Scholar] [CrossRef]
- Gulliksen, J.; Hussain, D.; Göransson, B. Collaboration between HCI Design and Software Engineering. In Designing for Usability, Inclusion and Sustainability in Human-Computer Interaction; CRC Press: Boca Raton, FL, USA, 2024; pp. 78–117. [Google Scholar]
- Pressman, S.R. Software Engineering: A Practitioner’s Approach, 7th ed.; McGraw-Hill: New York, NY, USA, 2010. [Google Scholar]
- Sommerville, I. Software Engineering, 9th ed.; Addison-Wesley: London, UK, 2011. [Google Scholar]
- Kreitzberg, C. The LUCID Framework; An Introduction; Cognetics Corporation; Princeton Junction: West Windsor Township, NJ, USA, 2008. [Google Scholar]
- Vaughan, T. Multimedia: Making It Work, 9th ed.; McGraw-Hill Osborne Media: New York, NY, USA, 2014. [Google Scholar]
- March, S.T.; Smith, G.F. Design and natural science research on information technology. Decis. Support Syst. 1995, 15, 251–266. [Google Scholar] [CrossRef]
- Hevner, A.R.; March, S.T.; Park, J.; Ram, S. Design science in information systems research. MIS Q. 2004, 28, 75–105. [Google Scholar] [CrossRef]
- Peffers, K.; Tuunanen, T.; Rothenberger, M.A.; Chatterjee, S. A design science research methodology for information systems research. J. Manag. Inf. Syst. 2007, 24, 45–77. [Google Scholar] [CrossRef]
- Dresch, A.; Lacerda, D.P.; Antunes, J.A.V., Jr. Design science research. In Design Science Research: A Method for Science and Technology Advancement; Springer International Publishing: Cham, Switzerland, 2014; pp. 67–102. [Google Scholar]
- Vom Brocke, J.; Hevner, A.; Maedche, A. Introduction to design science research. In Design Science Research. Cases; Springer International Publishing: Cham, Switzerland, 2020; pp. 1–13. [Google Scholar]
- Gupta, P.; Chugh, K.; Dhall, A.; Subramanian, R. The eyes know it: Fakeet-an eye-tracking database to understand deepfake perception. In Proceedings of the 2020 International Conference on Multimodal Interaction, Utrecht, The Netherlands, 25–29 October 2020; pp. 519–527. [Google Scholar]
- Hinton, G.; Vinyals, O.; Dean, J. Distilling the Knowledge in a Neural Network. arXiv 2015, arXiv:1503.02531. [Google Scholar] [CrossRef]
- Jacob, B.; Kligys, S.; Chen, B.; Zhu, M.; Tang, M.; Howard, A.; Adam, H.; Kalenichenko, D. Quantization and Training of Neural Networks for Efficient Integer-Arithmetic-Only Inference. In Proceedings of the IEEE Conference on Computer Vision and Pattern Recognition (CVPR), Nashville, TN, USA, 11–15 June 2018. [Google Scholar]


Disclaimer/Publisher’s Note: The statements, opinions and data contained in all publications are solely those of the individual author(s) and contributor(s) and not of MDPI and/or the editor(s). MDPI and/or the editor(s) disclaim responsibility for any injury to people or property resulting from any ideas, methods, instructions or products referred to in the content. |
© 2025 by the authors. Licensee MDPI, Basel, Switzerland. This article is an open access article distributed under the terms and conditions of the Creative Commons Attribution (CC BY) license (https://creativecommons.org/licenses/by/4.0/).