Article

Vertical Educational (Mis)match and Inclusive Growth: Theoretical Conceptualizations and Evidence from a European Perspective

by
Pepka Boyadjieva
and
Petya Ilieva-Trichkova
*
Institute of Philosophy and Sociology, Bulgarian Academy of Sciences, 1000 Sofia, Bulgaria
*
Author to whom correspondence should be addressed.
Societies 2025, 15(4), 113; https://doi.org/10.3390/soc15040113
Submission received: 13 January 2025 / Revised: 17 April 2025 / Accepted: 19 April 2025 / Published: 21 April 2025

Abstract

:
The concept of inclusive growth highlights that enhancing human development requires ensuring not only sustainable economic growth but also that its benefits are widely shared. In turn, the problem of skills/educational mismatch looms large because of its (negative) consequences for individual and societal well-being. Against this background, this article studies some effects of skills/educational mismatch on inclusive economic growth. More concretely, it focuses on the relationships between vertical educational (mis)match and some macro characteristics, such as the level of unemployment and poverty indices. Theoretically, in searching for a more comprehensive understanding of skills/educational mismatch, the article draws on the heuristic potential of the capability approach. Empirically, this study relies on data from the 11th round of the European Social Survey, carried out in 2023/2024, and official statistical sources and has applied correlations for the analyses. This study’s findings show that the vertical educational match can be viewed as a sign of inclusive growth. They further reveal that the effects of skills/educational (mis)match at the societal level vary among different occupational groups. Finally, the obtained results demonstrate that vertical—either above or below—educational mismatch is related to capability deprivation at a societal level.

1. Introduction

It is well proven that economic growth positively influences average quality of life: the percentage of people living in extreme poverty was 19 out of 20 people in 1820 and 2 out of 20 people in 2015 [1]. However, it is also acknowledged that considerable income differences across countries leave millions still stuck in poverty and that within-country inequality has risen in many countries [1]. In addition to income inequalities, there are significant inequalities in wealth and opportunities. Inequalities in opportunities capture the existence of important disparities in access to education, health, and financial services, which influence inequalities in income and wealth. However, as prominent authors have shown, the social price of inequalities is very high [2,3]. Recently, mainly inspired by the capability approach, there has been an ongoing discussion on the essence of human development and its measurement, which emphasizes the need to consider a broader array of aspects of both objective and subjective human well-being (e.g., [4]).
The above data and discussion—which clearly show that although economic growth has the power to reduce poverty, it is not enough to overcome inequalities in income, wealth, and opportunities among people nor to enhance human development in all its aspects—serve as a rationale for the development of the concept of inclusive growth. Despite the existence of different definitions of inclusive growth, there is a common understanding that inclusive growth is a multidimensional phenomenon that refers to ensuring not only sustainable economic growth but also that its benefits are widely shared [5,6,7,8].
The problem of skills/educational mismatch looms large because of its consequences for individual well-being and a country’s economic and social development. The greatest attention on the part of both scholars and politicians has been paid to skills mismatch’s effects on individual economic rewards, firms’ productivity, and national economic development [9,10,11]. We assume that the wider social consequences of skills mismatch beyond purely economic ones deserve much more attention from both academic and policy perspectives. In line with this, we will focus on the relationships between skills mismatch (vertical educational mismatch) and macro characteristics (Gini coefficient, level of unemployment, poverty indices, and Inequality-adjusted human development index (HDI)).
The reasons for our selection of the vertical educational mismatch type of skills mismatch as a focus of the analyses presented in this article are both theoretical and methodological. Post-modern societies have moved from compulsory primary and secondary education to massification of higher education and even to building universal higher education systems [12,13]. In this context, it is worth studying whether the existence of a relatively high and stable vertical educational mismatch has negative consequences for both individuals and societies and thus problematizes one of the central values—and rights—in contemporary societies: education. It should also be taken into account that this mismatch could be realized in two forms—the first one refers to situations in which the individual acquired level of education is above the one required in the job, whereas the second form relates to situations when the individual level of education is below the one required in the job. Although vertical educational mismatch, and especially overeducation, is widely studied [14,15], to the best of our knowledge, its influence on inclusive economic growth remains under-investigated.
Against this background, in the following analyses, we will use data from the 11th round of the European Social Survey, carried out in 2023/2024 [16], and from official statistical sources (Eurostat and UNDP [17]). We will perform all the calculations and analyses at the country/macro level.
The article proceeds in the following way. First, after a brief but systematic overview of the previous literature, we suggest an understanding of skills/educational mismatch through the lens of the capability approach. Second, we discuss the essence of inclusive growth and present results from empirical analyses of the associations between vertical educational (mis)match and inclusive economic growth. In the Section 7, we summarize our main arguments and outline some directions for further studies.

2. A Systematic Glimpse at Previous Literature

The term skills mismatch is very broad and is used to characterize various types of labor market imbalances, such as vertical mismatches (educational and skills mismatch), horizontal mismatch (educational and skills mismatch), skills/education underutilization, over (education, qualification, and skilling), under (education, qualification, and skilling), skill shortages, and skills obsolescence [15,18,19]. Skills mismatch has also been defined at different levels. Thus, at a macro level, it captures the gap between the supply and demand for skills, whereas, at the micro level, it refers to situations when the level of employees’ skills differs from what is required for their job [9].
We agree with McGuinness et al. [15] that the various concepts of skills mismatch are very different in the way they are measured, in their determinants and consequences. As a consequence, we deliberately focus our analysis on one form of skills mismatch. More concretely, we will study vertical educational mismatch as a type of skills mismatch that refers to imbalances (in their two directions—above and below) between an individual’s education and the education required for the job where they are employed.
There is a substantial body of literature on skills mismatch and their different forms, the most studied of which remains educational mismatch [14,15]. This research can be roughly divided into five groups: (1) discussions of theoretical approaches and concepts, (2) studies on the consequences of skills mismatch, (3) explanations of cross-country differences in skills mismatch, (4) research on the determinants of skills mismatch, and (5) policy implications from skills mismatch for policymakers and social partners (professional organizations and trade unions) (see also [20]). There are some reviews of the literature that summarize the concepts and methods of measurement used and provide international evidence on trends in vertical skills/educational mismatch (with a focus on overeducation), its determinants, and its consequences, especially in relation to earnings (e.g., [15,21,22]). Below, we will briefly focus only on the first three of the identified five groups of the previous literature on skills mismatch as the most relevant to this article.
From a theoretical point of view, there are several approaches that outline different perspectives for understanding and investigating skills mismatch. Authors also differentiate between the demand (from the perspective of firms) and supply (from the perspective of individuals) sides of skills mismatch [9,10].
Well-known human capital theory (HCT) [23,24] views education and training as crucial investments in human capital and defines their increase as a crucial factor for economic growth. It focuses on the productive potential of human beings and assumes that individuals are responsible for the reallocation of their resources in line with economic incentives, as well as that they take into account potential risks and uncertainties when making decisions. Within this perspective, the level of human capital (acquired through formal and non-education, informal learning, or on-the-job training) is the main determinant of earnings. That is why Roosmaa et al. [10] outline that human capital theory regards educational mismatch as a temporary phenomenon, which could be neglected as it is corrected by the market. In turn, McGuinness emphasizes that the overeducation phenomenon does not necessarily defeat HCT as it is plausible that workers will be overeducated in the short run but, in the long term, will find a job that matches their skills [21]. It should be outlined that the economy of human development, which grows out of the early human capital literature, tries to overcome the focus on the labor market returns to schooling and training. It extends beyond the reduction in human capital to cognitive ability by acknowledging the role in the labor market of such character skills as goals, motivation, and preferences [25]. It also recognizes the multiplicity of skills and both the market returns and the non-monetary benefits of multiple skills, such as health, social engagement, trust, altruism, happiness, life satisfaction, and risk aversion [26].
The job competition model [27], positional theory [28], and credentialist theory [29] look for alternative conceptualizations of skills mismatch by taking into account macro-structural elements and the extent to which graduates’ professional realization is dependent not on an individual’s human capital alone but is structured by existing inequalities and opportunities. Thus, a graduate’s position in the labor market becomes relational, contextual, and, most importantly, conflictual [30]. This perspective leads to another explanation of overeducation. In McGuinness’s [21] interpretation, according to the human capital theory, if an individual witnesses that another person participates in education, s/he would be less likely to be involved in education as supply would be higher and the return less, whereas the job competition model assumes that the same individual would be more likely to participate as education will be a means to protect their position.
Although these approaches provide a better understanding of educational mismatch, they focus mainly on its relationship with productivity and individual economic benefits. As we shall lay out in the following, we believe that the capability approach offers a more holistic basis for understanding skills mismatch because, instead of focusing on achieving growth for its own sake, it puts stress on enhancing the quality of life [30].
Regarding the streams in the previous literature that look at the determinants of skills mismatch and their cross-country differences, Bergin et al. [31] outline the existence of limited evidence on the drivers of cross-country differences in overqualification. In their study, Verhaest and van der Velden [32] use several variables to explain cross-country variations in graduate overqualification among OECD countries, such as educational composition, quality of education, R&D expenditure, measures of output, unemployment gaps, and employment protection legislation. They find that cross-country differences in overeducation are explained by the quality and orientation of the educational program, the business cycle, and the relative oversupply of highly skilled labor, but not by employment protection legislation. The study of Verhaest et al. [33] reveals that cross-country differences in vertical mismatch are largely explained by labor market imbalances.
There are few studies that focus on how skills/educational mismatch differs in countries characterized by different income levels. For example, Handel et al. [34] find that overqualification is the main concern in low-income countries, whereas Sparreboom and Staneva [35] emphasize the importance of underqualification of the youth population. Bergin et al. [31] also examine skills mismatch in low- and middle-income countries. They have found that although many of the factors influencing skills mismatch in developed and middle-income countries are the same, the impacts tend to have quite different directions—for example, a growth in per capita GDP and a reduction in unemployment lead to a reduction in overqualification in developed labor markets, but not in middle-income countries. With this article, we want to extend the research on how skills/educational mismatch differs in countries characterized by different income levels by suggesting that (and investigating how) both vertical-above and vertical-below educational mismatch are associated not only with GDP growth but also with the inclusiveness of this growth.
Roosmaa et al. [10] have analyzed the impact of educational mismatch on salaries and have convincingly shown that there are substantial differences in skills/educational mismatch between occupational groups.
Studies on the consequences of skills/educational mismatch refer mainly to jobs’ economic rewards. McGuinness et al. [15] emphasize that the effect on wages is one of the most studied aspects of overeducation, and there is evidence showing that there is a wage penalty for overeducated individuals relative to individuals with the same education in matched employment. Other studies that have investigated graduates in some concrete countries also revealed that there are significant wage penalties for overeducation; thus, each year of overeducation leads to a decrease in wages of 8% in the Netherlands [36] and a reduction in hourly pay in the United Kingdom [37].

3. Theoretical Considerations

3.1. Skills/Educational Mismatch Through the Lens of the Capability Approach

This article makes use of the capability approach as a theoretical basis. The capability approach is first introduced by the Nobel-prize-winning economist Sen and the political philosopher Nussbaum [38,39,40]. It extends beyond human capital theory in the case of education and is also one of the leading paradigms for the analysis of a person’s well-being [41]. Freedoms and opportunities that people have in choosing a life they have reason to value are at the centre of this approach. Sen [42] perceives ‘capability’ as a kind of freedom that refers to one’s ability to achieve various combinations of functionings that s/he can compare and judge against each other in the light of what s/he has reason to value. In turn, the concept of ‘functionings’ reflects the various things that a person may value being or doing. More concretely, functionings are the achievements and accomplishments that a person has reason to value. Without going into details about the essence of the capability approach1, below we briefly present a perspective for understanding and studying skills and skills mismatch based on this approach.
Bryson [30] highlights several advantages that the capability approach provides in studying skills: because multidimensional well-being cannot be reduced to any single thing, such as income or happiness; it regards education as central to human flourishing; it stresses that skill alone is not enough to ensure well-being; and it offers an approach for analyzing the purpose of skill and its achievement.
From the capability approach perspective, skills are “central ingredients of capabilities” and “major sources of well-being and flourishing in society” [26] (p. 344, emphasis added). If we have in mind the recognized skills (for example, the credential for acquired qualification), they could also be regarded as desired functioning, i.e., achievement [30].
Skills have both intrinsic and instrumental value. Their intrinsic value reflects the understanding of skills possession as an integral part of human development, as far as having skills contributes to one’s well-being and can function as a stimulus for further improvements in people’s lives [45]. In turn, the instrumental value of skills relates to their role in increasing people’s capabilities for gaining better occupation, employment, and income, which can improve living standards [45]. Acknowledging both the intrinsic and instrumental value of skills means that skills mismatch should also be regarded as having both intrinsic and instrumental aspects and consequences.
According to Støren and Arnesen [46], unemployment is the most severe form of skills/education–job mismatch. Within the capability approach, it is acknowledged that unemployment may have different reasons, and it can also be a result of individual refusal to accept a job, which does not ensure a capability-enhancing activity [47]. From this perspective, involuntary or externally forced unemployment should be defined as the most damaging form of skills–job mismatch.
Reflecting on the consequences for individuals stemming from involuntary unemployment, Sen [39] (p. 94) outlines that it “is not merely a deficiency of income that can be made up through transfers by the state…; it is also a source of far-reaching debilitating effects on individual freedom, initiative and skills… it leads to losses of self-reliance, self-confidence and psychological and physical health”. Massive unemployment leads to diverse penalties other than low income, such as loss of freedom and social exclusion, skill loss, psychological harm, ill health, motivational loss, loss of human relations, and loss of social values and responsibility [48]. Taking into account this view of unemployment as a cause for capability deprivation which extends beyond income deficiency, we propose to view skills mismatch as an imbalance or a lack of correspondence between individuals’ skills and those skills required in the labor market, leading to capability deprivation with wider consequences at the individual and societal levels than reduced economic benefits alone.
It is beyond doubt that, out of all the types of skills mismatches, the concept of overeducation—which was introduced in 1976 in a study based on US experience—has received the most attention in the literature (see [20]). However, understanding the essence and findings of this phenomenon remains not so easy and unequivocal, mainly because of measurement issues and difficulties in adequately capturing the relationship between occupations and their educational requirements [20].
We argue that the very term “overeducation” is incorrect, as it reduces the complexity of benefits from education to the labor market. We further claim that when a person has a job that requires a lower level of education, this does not mean that s/he is overeducated because s/he can use the acquired education in other social spheres. It is important to emphasize that the capability approach conceives education as one of the dimensions of human life and human development, which is important both for its own sake and for its contribution to the expansion of capabilities in other spheres of life [40,49]. Skills/educational mismatch is not an absolute phenomenon; it always refers to a concrete job and depends on individual job preferences. To account for education–job discrepancies, we will use the term “vertical skills/educational mismatch” instead of “overeducation”. We also acknowledge that there are two forms of vertical skills/educational mismatch: when the individual skills are either above or below the level required for a given job. We designate the first situation as vertical-above skills/educational mismatch and the second as vertical-below skills/educational mismatch.
Relying on the above theoretical discussion, we define vertical educational mismatch as a lack of correspondence between one’s level of acquired education, on the one hand, and the level of education required for a job, on the other, which can lead to capability deprivation with wider consequences for the individual (such as their well-being or active citizenship) and societies (e.g., inclusiveness of economic growth). In this article we focus only on some aspects of capability deprivation for societies.

3.2. Inclusive Growth

There is still no consensus in the literature on a common understanding of inclusive growth. It should be noted that there are some other concepts that seem to approximate inclusive growth. The “pro-poor” concept tries to capture the mean growth rate of those below the poverty line [50,51], while the World Bank’s concept of “shared prosperity” refers to increasing the incomes and welfare of the bottom 40 percent of society [1].
The concept of inclusive growth highlights that growth with equity is possible and that growth, inequality, and poverty reduction are interrelated [5,6]. McKinley [52] argues that inclusive growth requires achieving sustainable growth that expands economic opportunities and ensures broader access to these opportunities for all members of society. Anand et al. [53] highlight that sustainable growth, which is effective in reducing poverty, needs to be inclusive. The definition of inclusive growth suggested by Cerra [1] has three components: it is strong economic growth that is also inclusive and sustainable. In turn, inclusion refers to benefit-sharing, opportunity, participation, and empowerment.
Recently, inclusive growth has moved to the forefront of the policy agenda. In response to growing inequalities in income and other dimensions of well-being, the OECD launched an initiative on Inclusive Growth in 2012. Its objective was to encourage and support governments in finding ways to make economic growth more inclusive and beneficial for different socioeconomic groups [54]. The World Economic Forum released its “Inclusive Growth and Development Report 2017” with the aim to provide a practical guide for policymakers and stakeholders seeking to develop a strategy of greater synergy between economic growth and fairer living standards for all [55]. The idea of inclusive growth has also received a prominent place in the UN 2030 Agenda: for example, the SDG 8 points to “promoting sustained, inclusive and sustainable economic growth, full and productive employment and decent work for all”.
The European Commission [56] also emphasizes the link between a high-employment economy and social cohesion, which means empowering people, investing in skills, and fighting poverty, thus helping people to manage change and build a cohesive society. Considering the impact of the COVID-19 pandemic on rising inequality and poverty rates, a recent World Bank report [57] alerts that inclusive growth is at a crossroads and urges countries in Europe to develop special policies to ensure a green, resilient, and inclusive recovery.
Following Cerra et al. [7], we accept that inclusive growth is a multidimensional phenomenon that refers to strong and sustainable economic growth, which is accompanied by shared improvements in well-being among all social groups. Our understanding is in line with Hay et al. [58], who argue for a need to shift from growth to development and well-being. They emphasize that inclusive growth must take into account the full range of ways (not only market-based) of exclusion from participating in and sharing the benefits of both economic growth and development [58].
Several authors, mainly economists, have suggested different ways of measuring inclusive growth. They refer to accounting for poverty [1,7,52], income inequalities [1,53], and access to and inequalities in education, health, and finance resources [7,52]. Mitra and Das propose an Inclusive Growth Index (IGI) [59]. Their measure includes twenty-four indicators, which are classified into four components: expansion, sustainability, equity in access, and efficiency of economic activities and institutions. The UN Trade and Development Organisation [60] has also developed an IGI with four pillars (economy, living conditions, equality, and environment) and 27 indicators. In general, all suggested measures of inclusive growth refer to income growth and income distribution. Based on this, in the following analysis, we will use the Inequality-adjusted HDI, the Gini coefficient of equivalized disposable income, the level of unemployment, the at-risk-of-poverty rate by poverty threshold, the persons at risk of poverty or social exclusion, and the in-work at-risk-of-poverty rate as measures of the inclusiveness of economic growth.
At a theoretical level, human capital has been viewed as a main factor for economic growth. However, several empirical studies have found no relationships or even negative relationships between growth and human capital (e.g., [61,62]). This has led researchers to focus more on the balance between the supply and demand of level and type of skills and to argue that the mismatch between the supply and demand of skills influences the growth–education relationship [63]. The existence of vertical educational mismatch—both above and below—signals that the acquired educational level is not a correct measure of human capital it does not take into account whether the individuals’ skills and knowledge associated with it are utilized in their jobs. Furthermore, the differences in the benefits and productivity between employees who are matched and those who experience vertical skills/educational mismatch [9,64,65] represent a threat to equality of opportunities and just benefits sharing and thus to inclusiveness of growth.
Taking into account the brief review of the existing literature and the outlined capability approach perspective towards (vertical) skills/educational mismatch, in this article, we focus on the relationship between vertical educational (mis)match and inclusive growth by asking the following research questions (RQ)s:
RQ1 
How does vertical educational (mis)match relate to inclusive economic growth?
RQ2 
Do the associations of vertical educational (mis)match and inclusive growth vary among different occupational groups?
Generally, in regard to our RQ1 we expect that the situation of vertical educational match will be positively associated with the indicators of inclusiveness of economic growth.
In relation to our RQ2, we expect that the associations between vertical educational (mis)match and inclusive growth will vary among different occupational groups.

4. Data and Research Strategy

4.1. Data and Measures

In order to measure vertical educational (mis)match we have used the most recent data from the 11th round of the European Social Survey, carried out in 2023/2024 [16]. This is a biannual cross-national survey, which is representative of all people aged 15 and over resident within private households in each country where it is implemented, regardless of their nationality, citizenship or language. Respondents in Round 11 were asked questions during face-to-face interviews following a mixed-mode approach implemented in Round 10 because of pandemic-related restrictions2. There are 31 countries that have participated in this latest round of the survey. However, at the moment of the analyses, only data for 24 of them were available: Austria, Belgium, Croatia, Cyprus, Finland, France, Germany, Greece, Hungary, Iceland, Ireland, Italy, Lithuania, the Netherlands, Norway, Poland, Portugal, Serbia, Slovak Republic, Slovenia, Spain, Sweden, Switzerland and the United Kingdom. Thus, we have used data from these 24 European countries and limited the age of respondents to 25–64 years. This age range was chosen so as to give everyone a chance to attain their highest level of education and to have some experience with the labor market. We have also limited these data to those who reported having performed paid work in the last 7 days. We worked with an analytical sample comprised of 18,896 individuals and applied design weight when we calculated the proportions at the country level.
Analyzing the literature on skills mismatch, Muñoz de Bustillo Llorente et al. [66] outline that, although the incidence of education and skill mismatch using different methodologies is weakly related, the influence of overeducation on labor market outcomes seems to be quite consistent, regardless of the measures which are used. The most widely applied methods for measuring skills/educational mismatch are workers’ self-assessment (e.g., [20,67,68]), the realized matches approach (e.g., [10,66]), and the job analysis approach [69].
Aiming to be as objective as possible while simultaneously covering as broad a part of the country’s population as possible, we will use the realized matches approach. This is a statistical method that defines “[t]he required education level as a function of a measure of central tendency of the educational level of the workers, job, comparing afterwards the education of the employees with such benchmark” [66], (p. 980). The approach estimates the required level of education using a central tendency measure of the distribution of the required level of education for a particular occupational group, such as the mean or the mode. There is an educational mismatch if the actual education of the worker is greater than this threshold.
We have selected the realized matches approach as it is indicated to acknowledge skills upgrading because of technological change or new formal qualification requirements [70]. Additionally, the mode is used as a threshold instead of the mean in order to account for critiques that suggest that the use of the mean could lead to asymmetry in the estimation of the mismatch because it is less sensitive to outliers [66].
Following Roosmaa et al. [10], we calculated the modal level of education based on four ISCED 2011 categories of workers (ISCED 0–2 primary education and less; 2 upper-secondary; 3 post-secondary non-tertiary; 4 short-cycle tertiary education and higher) separately for each ISCO-08 two-digit occupation group3 in each country. In the next stage, we compare the attained level of education (AttainedEdu) of each individual with the modal level of education for his/her occupation (ModalEduOcc), which resulted in three categories:
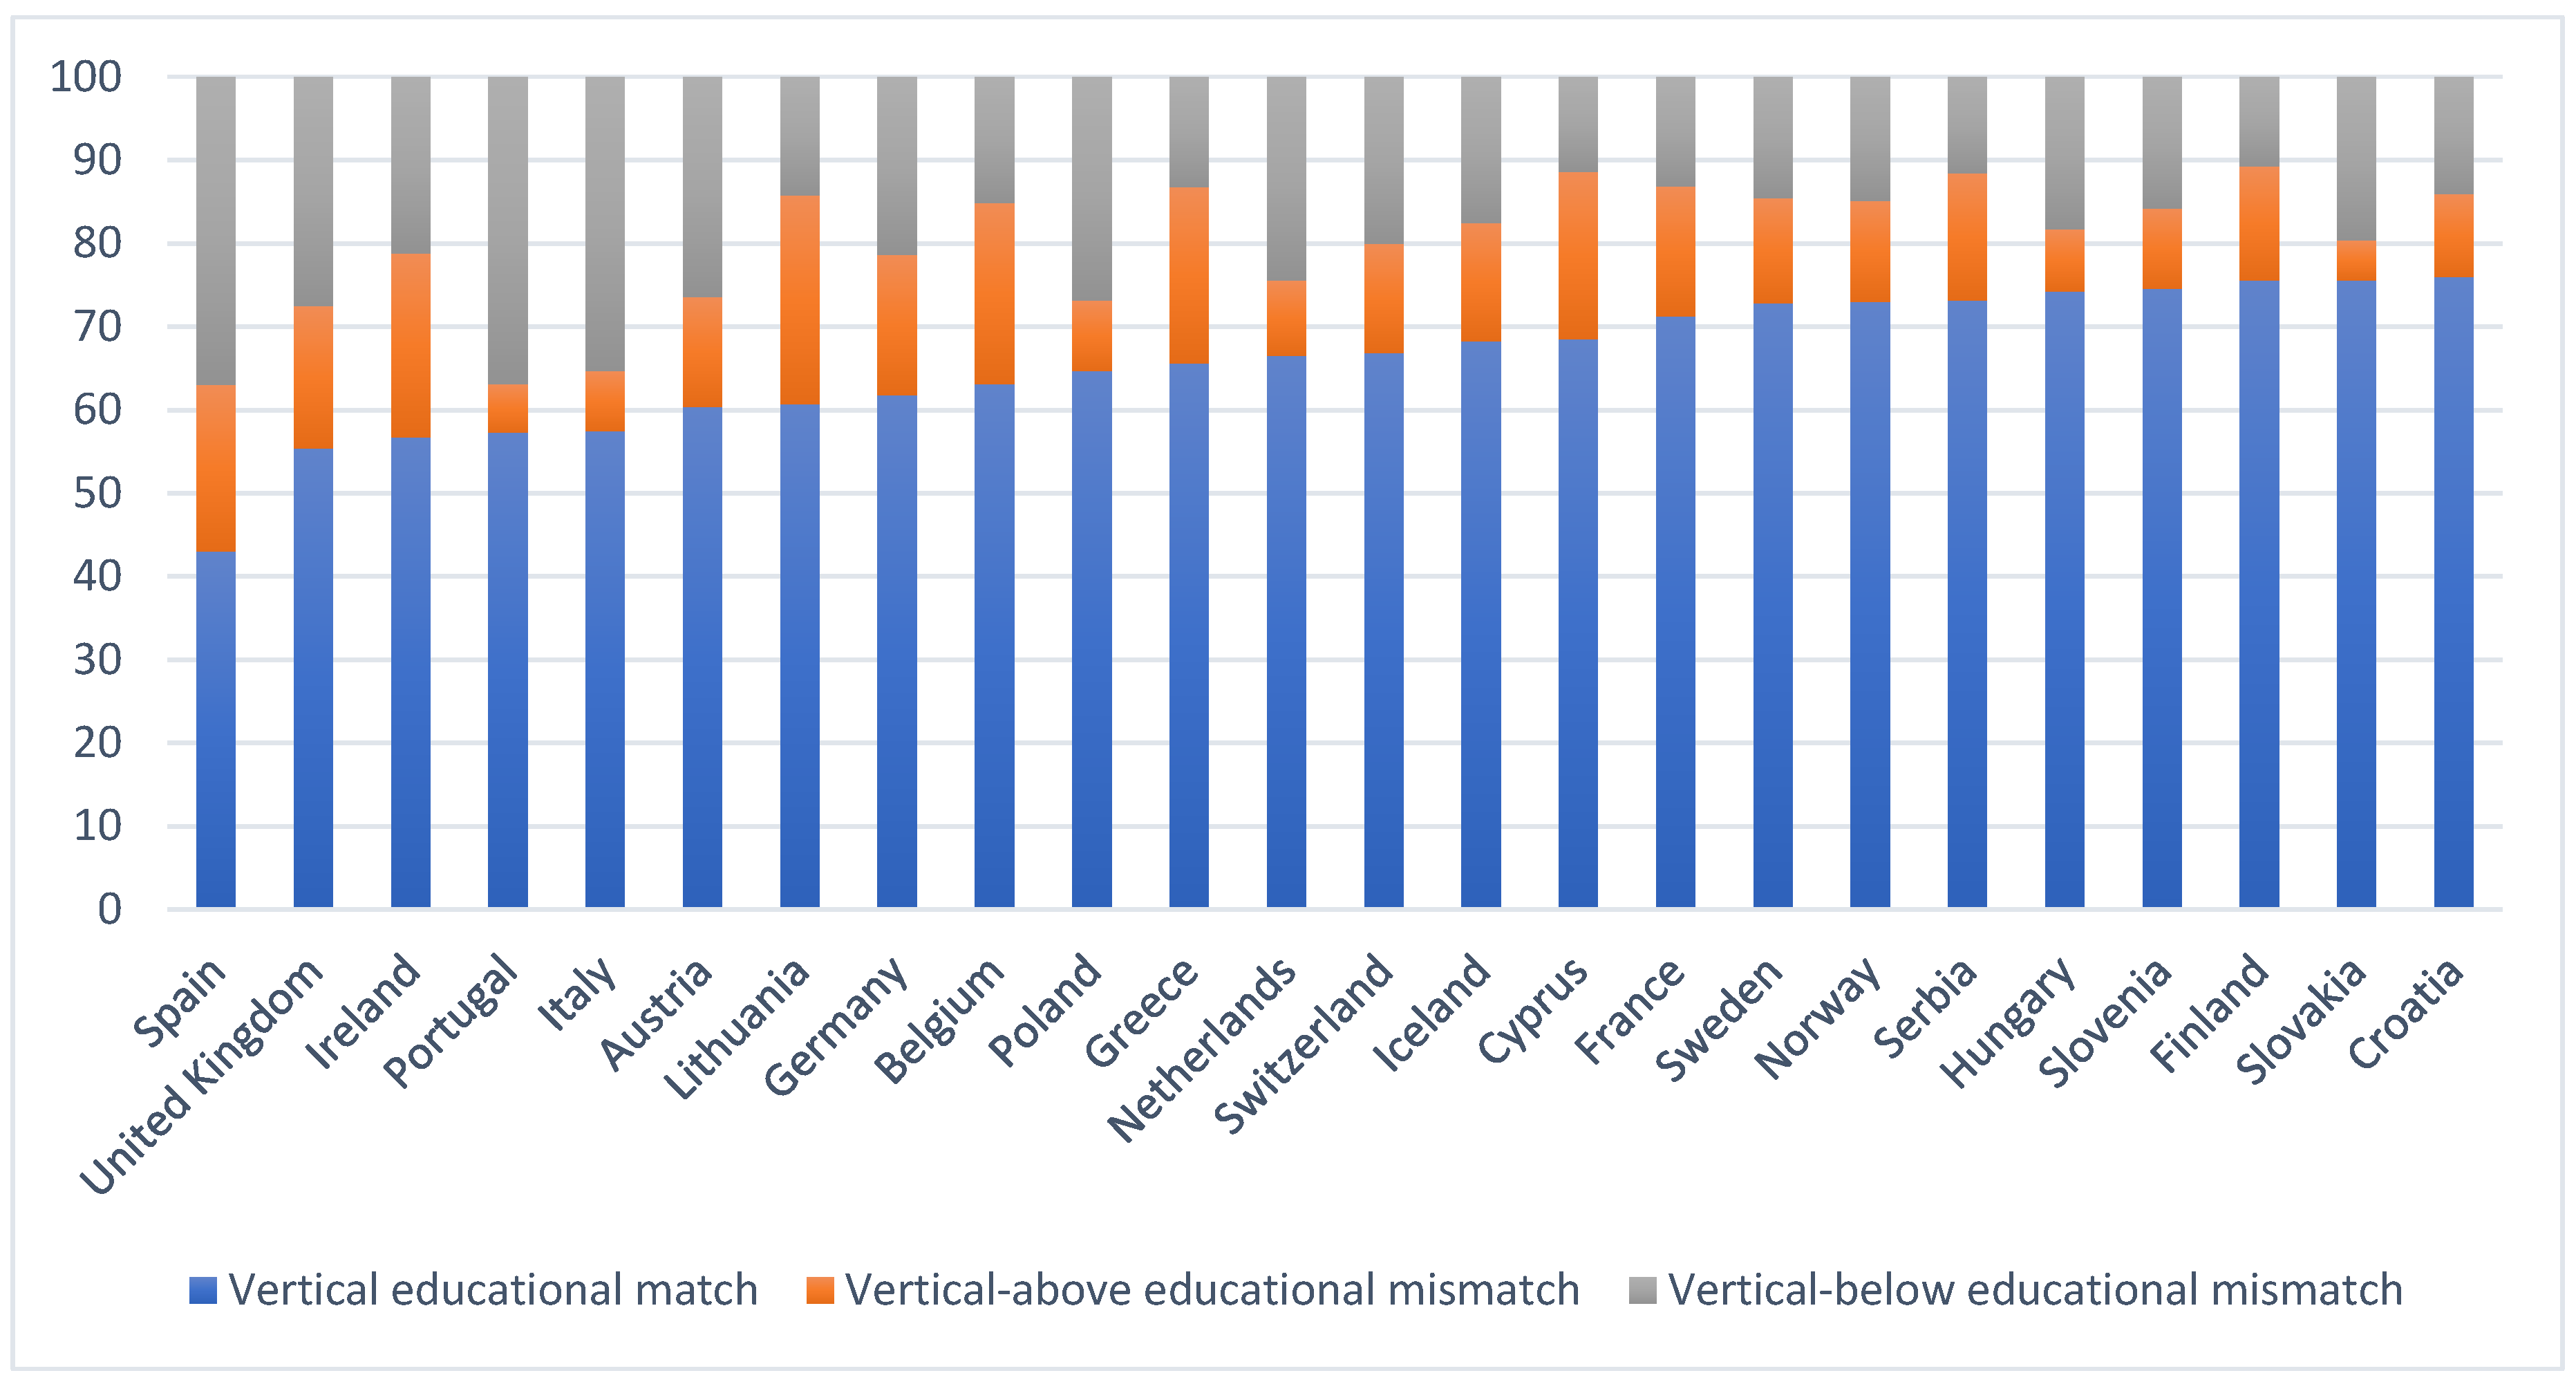
  • If AttainedEdu = ModalEduOcc, they are defined as matched.
  • If AttainedEdu > ModalEduOcc, we classify the individuals as being vertically mismatched above.
  • If AttainedEdu < ModalEduOcc, we classify them as vertically mismatched below.
We argue that this classification is more in line with the capability approach instead of talking about over and undereducation.
GDP as a measure of economic progress has been criticized for not considering such important aspects of growth as its distribution, unpaid domestic labor, or its negative effects on the environment [71]. Recently, there has been a clear tendency to expand research on the so-called Beyond-GDP agenda (e.g., [72,73,74]. Relying mainly on the human development paradigm and the capability approach, the Beyond-GDP agenda tries to suggest additional measures to better capture the multidimensionality of people’s and societies’ well-being.
In its 20th Human Development Report, the UNDP introduced the Inequality-adjusted HDI to take into account the losses in human development due to inequality in health, education, and income [75]. A report by the International Commission on the Measurement of Economic Performance and Social Progress also emphasizes the importance of assessing inequalities in a comprehensive way [71]. The authors critically assess the limits of GDP as a measurement of the well-being of societies, highlighting, for example, that GDP overlooks economic inequality (i.e., the fact that most people can be worse off even though average income is increasing).
In order to overcome some of the limitations of GDP as an indicator of societies’ well-being, we pay attention to the inclusiveness of economic growth—more concretely, to inequalities in people’s well-being and social inclusiveness. In this regard, we rely on the following measures: Gini coefficient of equivalized disposable income, level of unemployment, at-risk-of-poverty rate by poverty threshold, people at risk of poverty or social exclusion, in-work at-risk-of-poverty rate and the Inequality-adjusted HDI. We have included several measures of poverty in order to capture its different aspects. Thus, some authors (e.g., [76]) suggest that the at-risk-of-poverty rate by poverty threshold measures the depth of poverty, whereas the indicator persons at risk of poverty or social exclusion actually measure the width of poverty. To the best of our knowledge, there are no previous studies on the relationship between skills/educational mismatch, and most of the identified in this article measures of inclusive economic growth. Some studies (e.g., [31]) have found a positive association between overqualification and the unemployment rate.
To measure the inclusiveness of economic growth, we use the following indicators, taken as of 2023 from official statistical sources (See Table A1 in Appendix A for the indicators’ values):
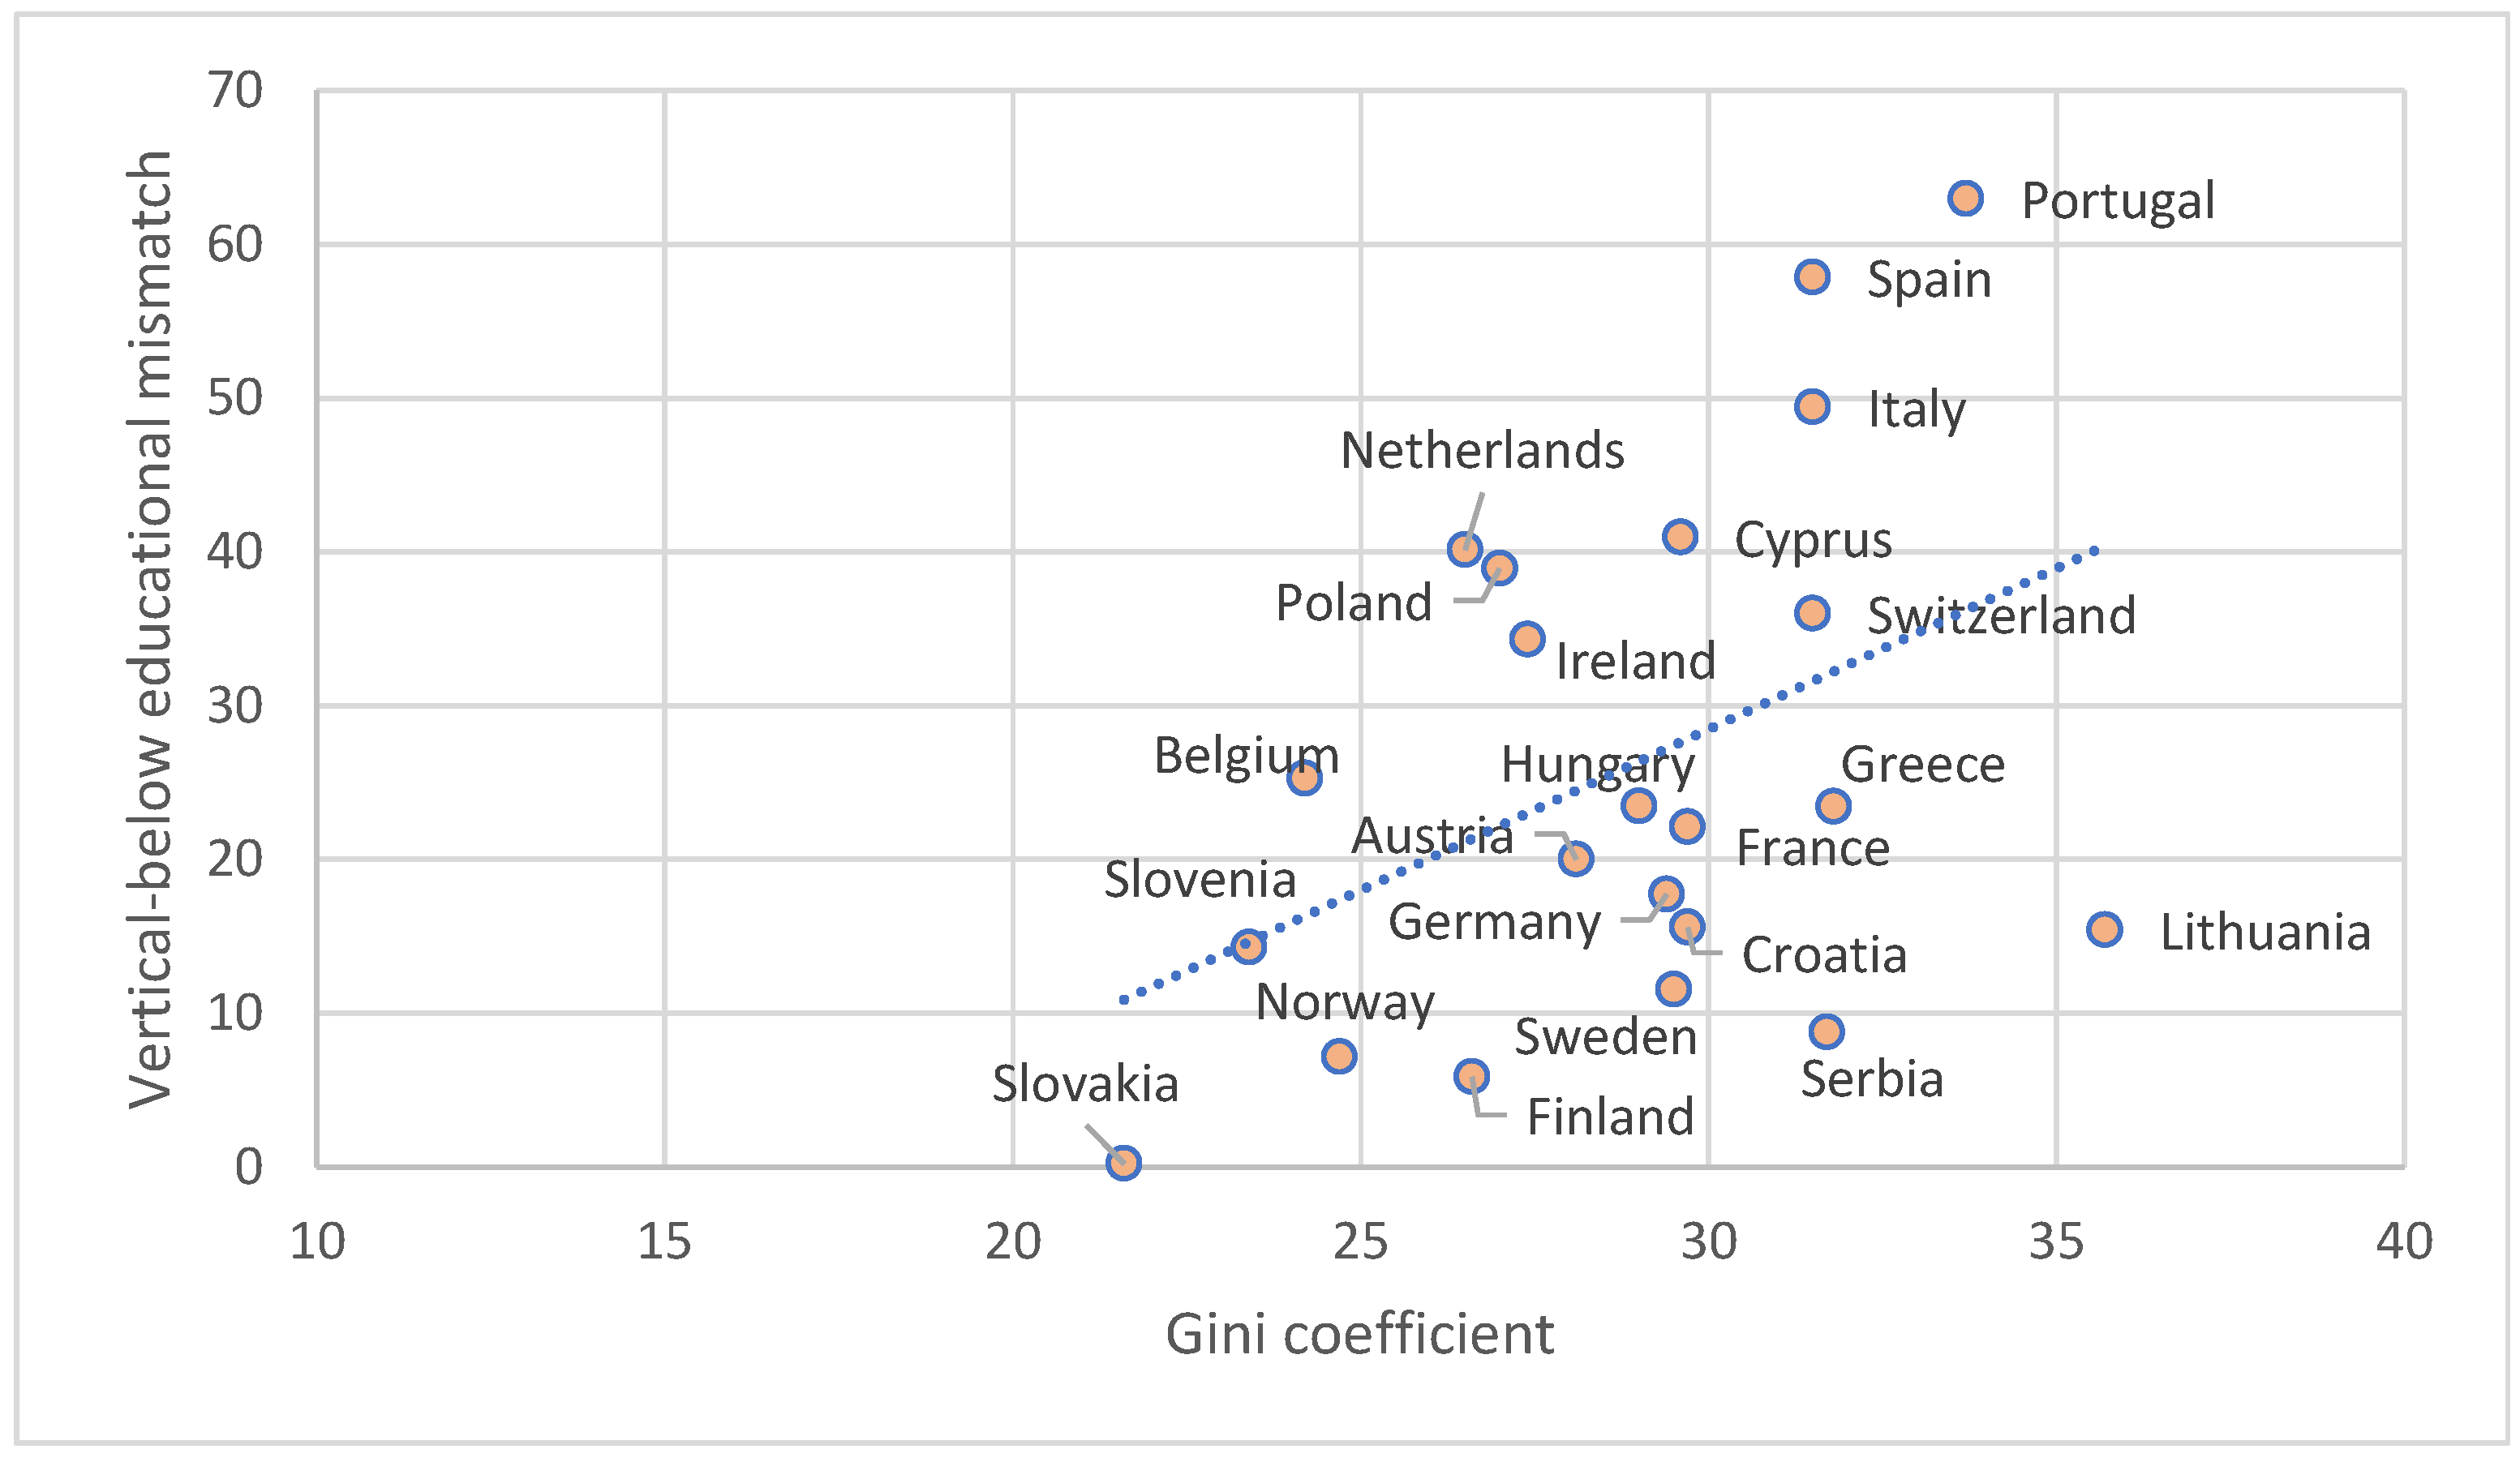
  • Gini coefficient of equivalized disposable income. It is considered to be the best-known and the most common measure of income inequality, and the higher the Gini coefficient, the more unequal the income distribution in a given country is [76,77]. More specifically, it ranges between 0 and 100 and gives the extent to which the distribution of income within a country deviates from a perfectly equal distribution. A value of 0 means that income is distributed equally across the population, whereas 100 means that only one person receives all the income in the country (https://ec.europa.eu/eurostat/statistics-explained/index.php?title=Living_conditions_in_Europe_-_income_distribution_and_income_inequality#Income_inequality). Source: Eurostat. Data code: ilc_di12 [Accessed on 11 April 2025].
  • At-risk-of-poverty rate by poverty threshold. It is an income and living conditions indicator, which measures the at-risk-of-poverty rate (cut-off point: 60% of median equivalized income after social transfers). Its unit of measure is a percentage; the higher it is, the greater is the poverty in a given country. Source: Eurostat. Data code: ilc_li02 [Accessed on 11 April 2025].
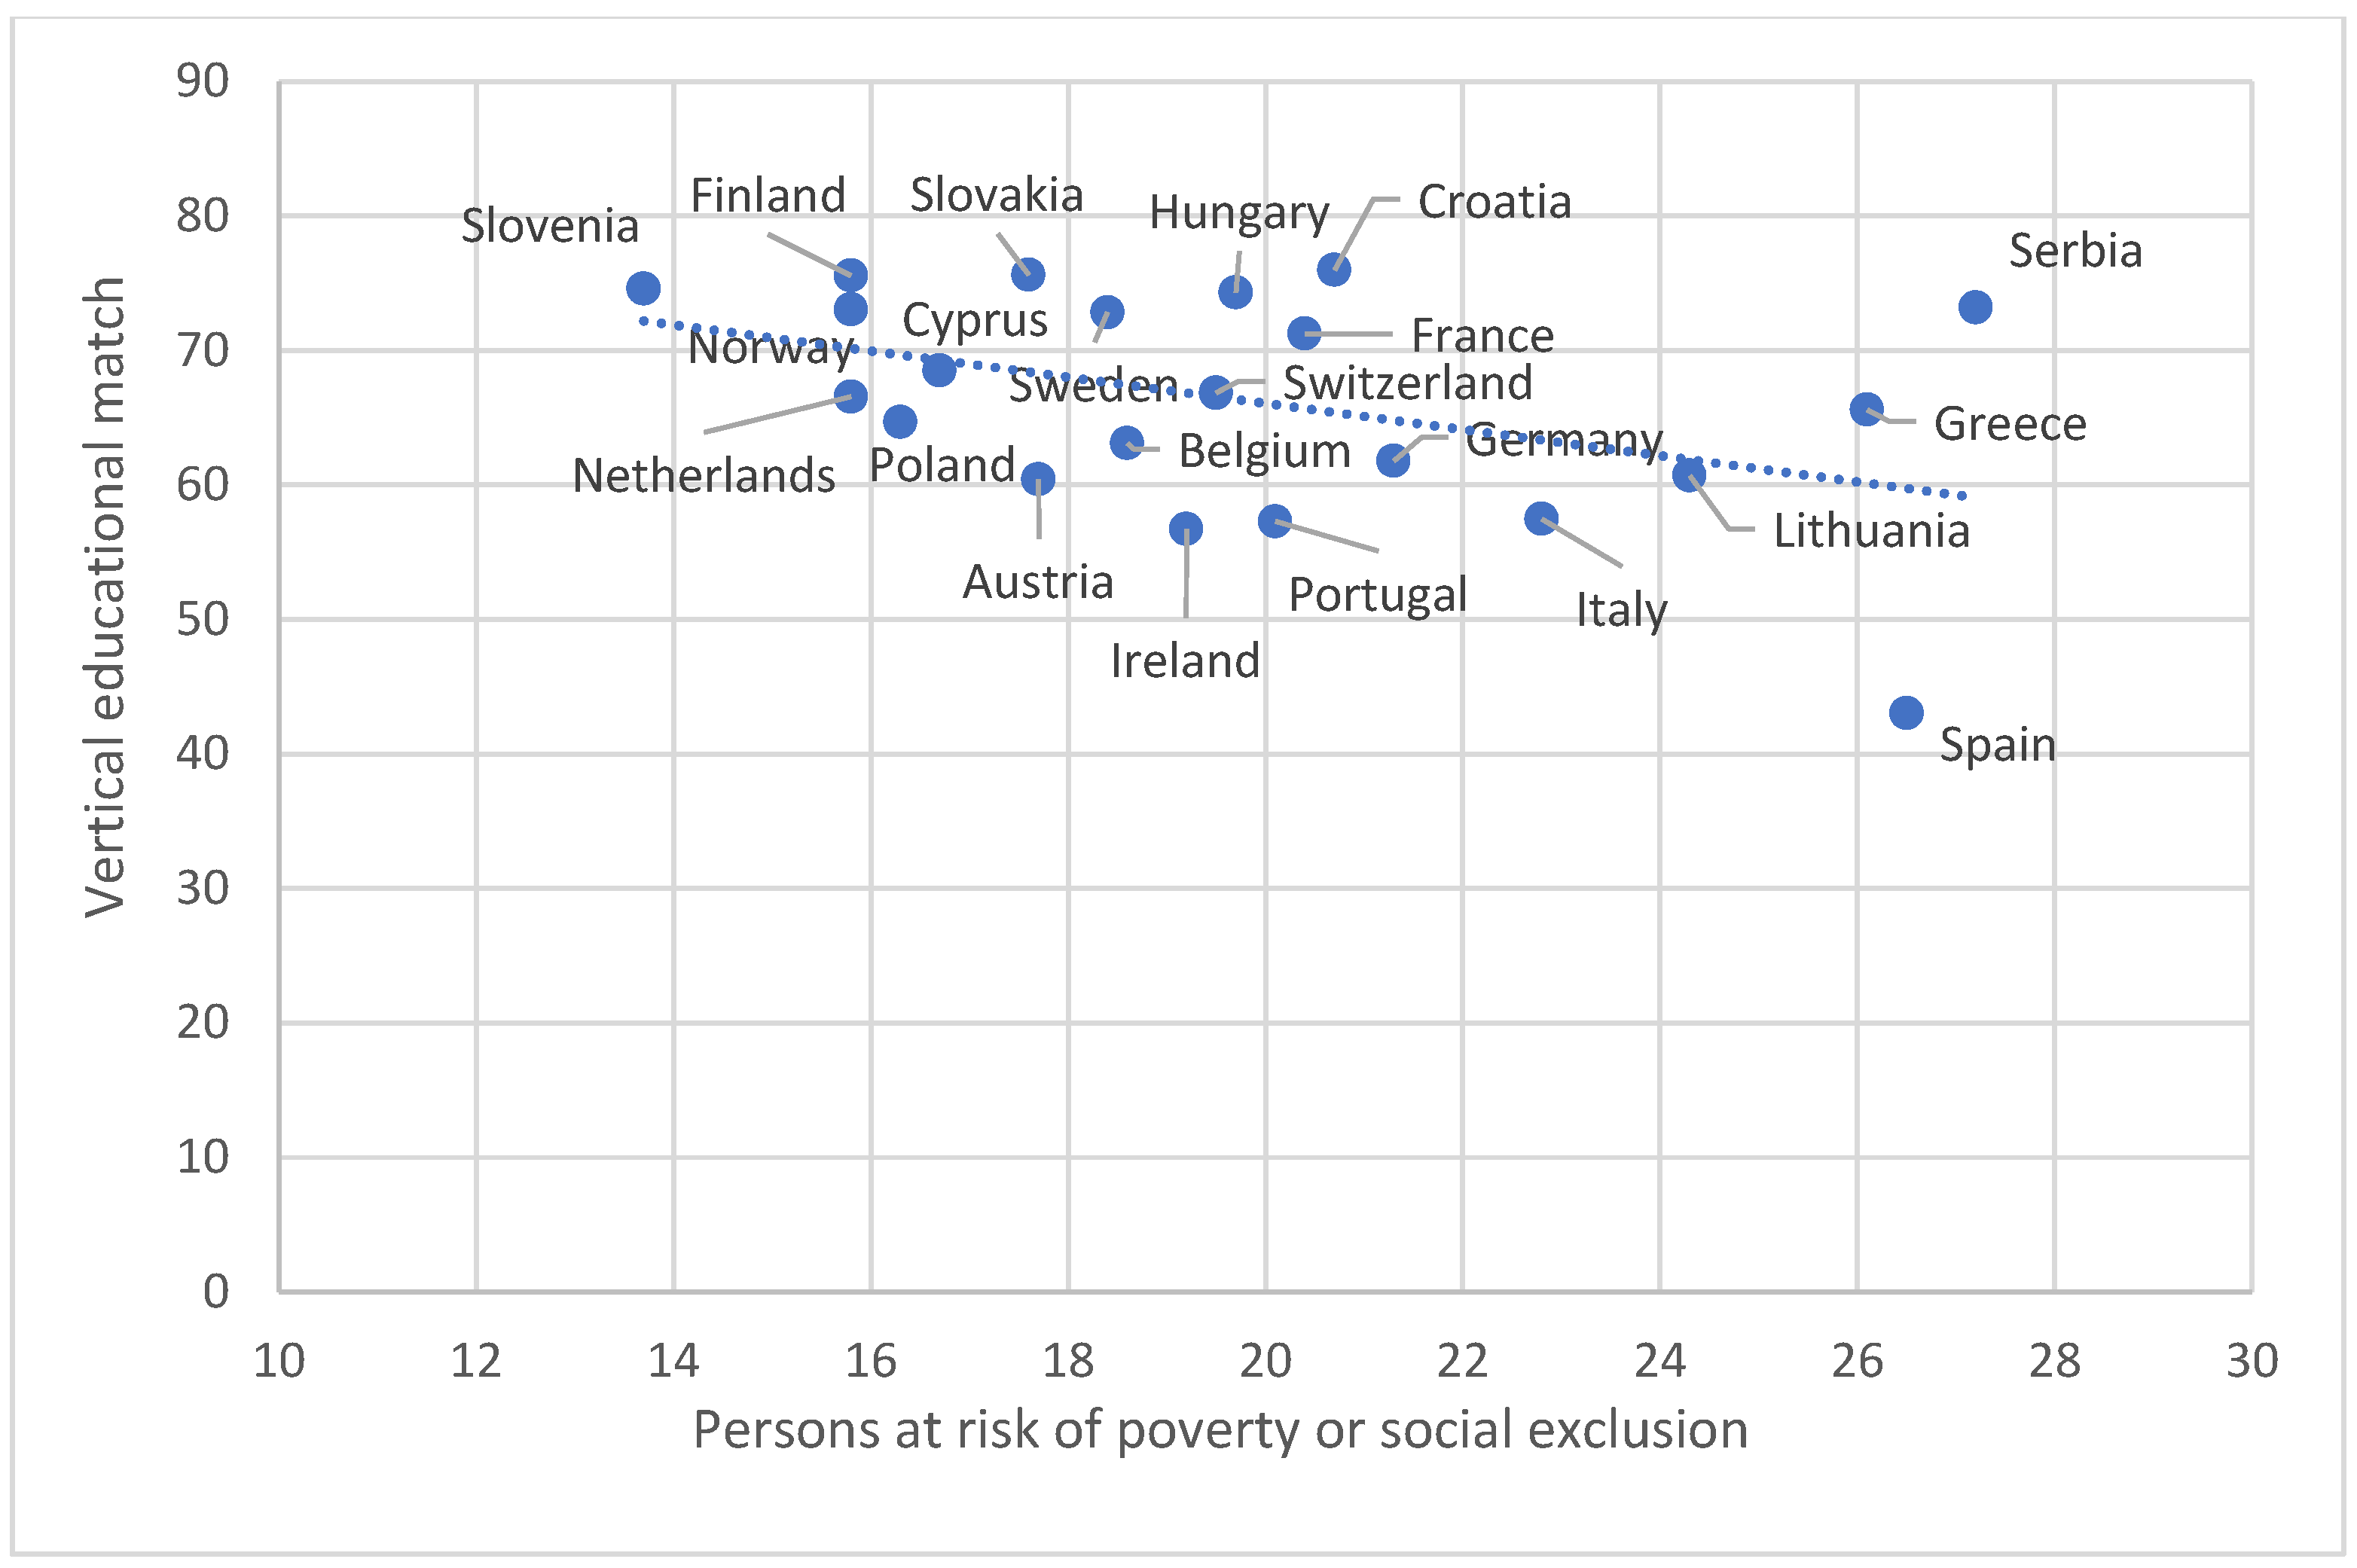
  • People at risk of poverty or social exclusion. It is used as a measure of poverty linked with the EU2030 targets. Its unit of measure is also a percentage. Source: Eurostat. Data code: ilc_peps01n [Accessed on 11 April 2025].
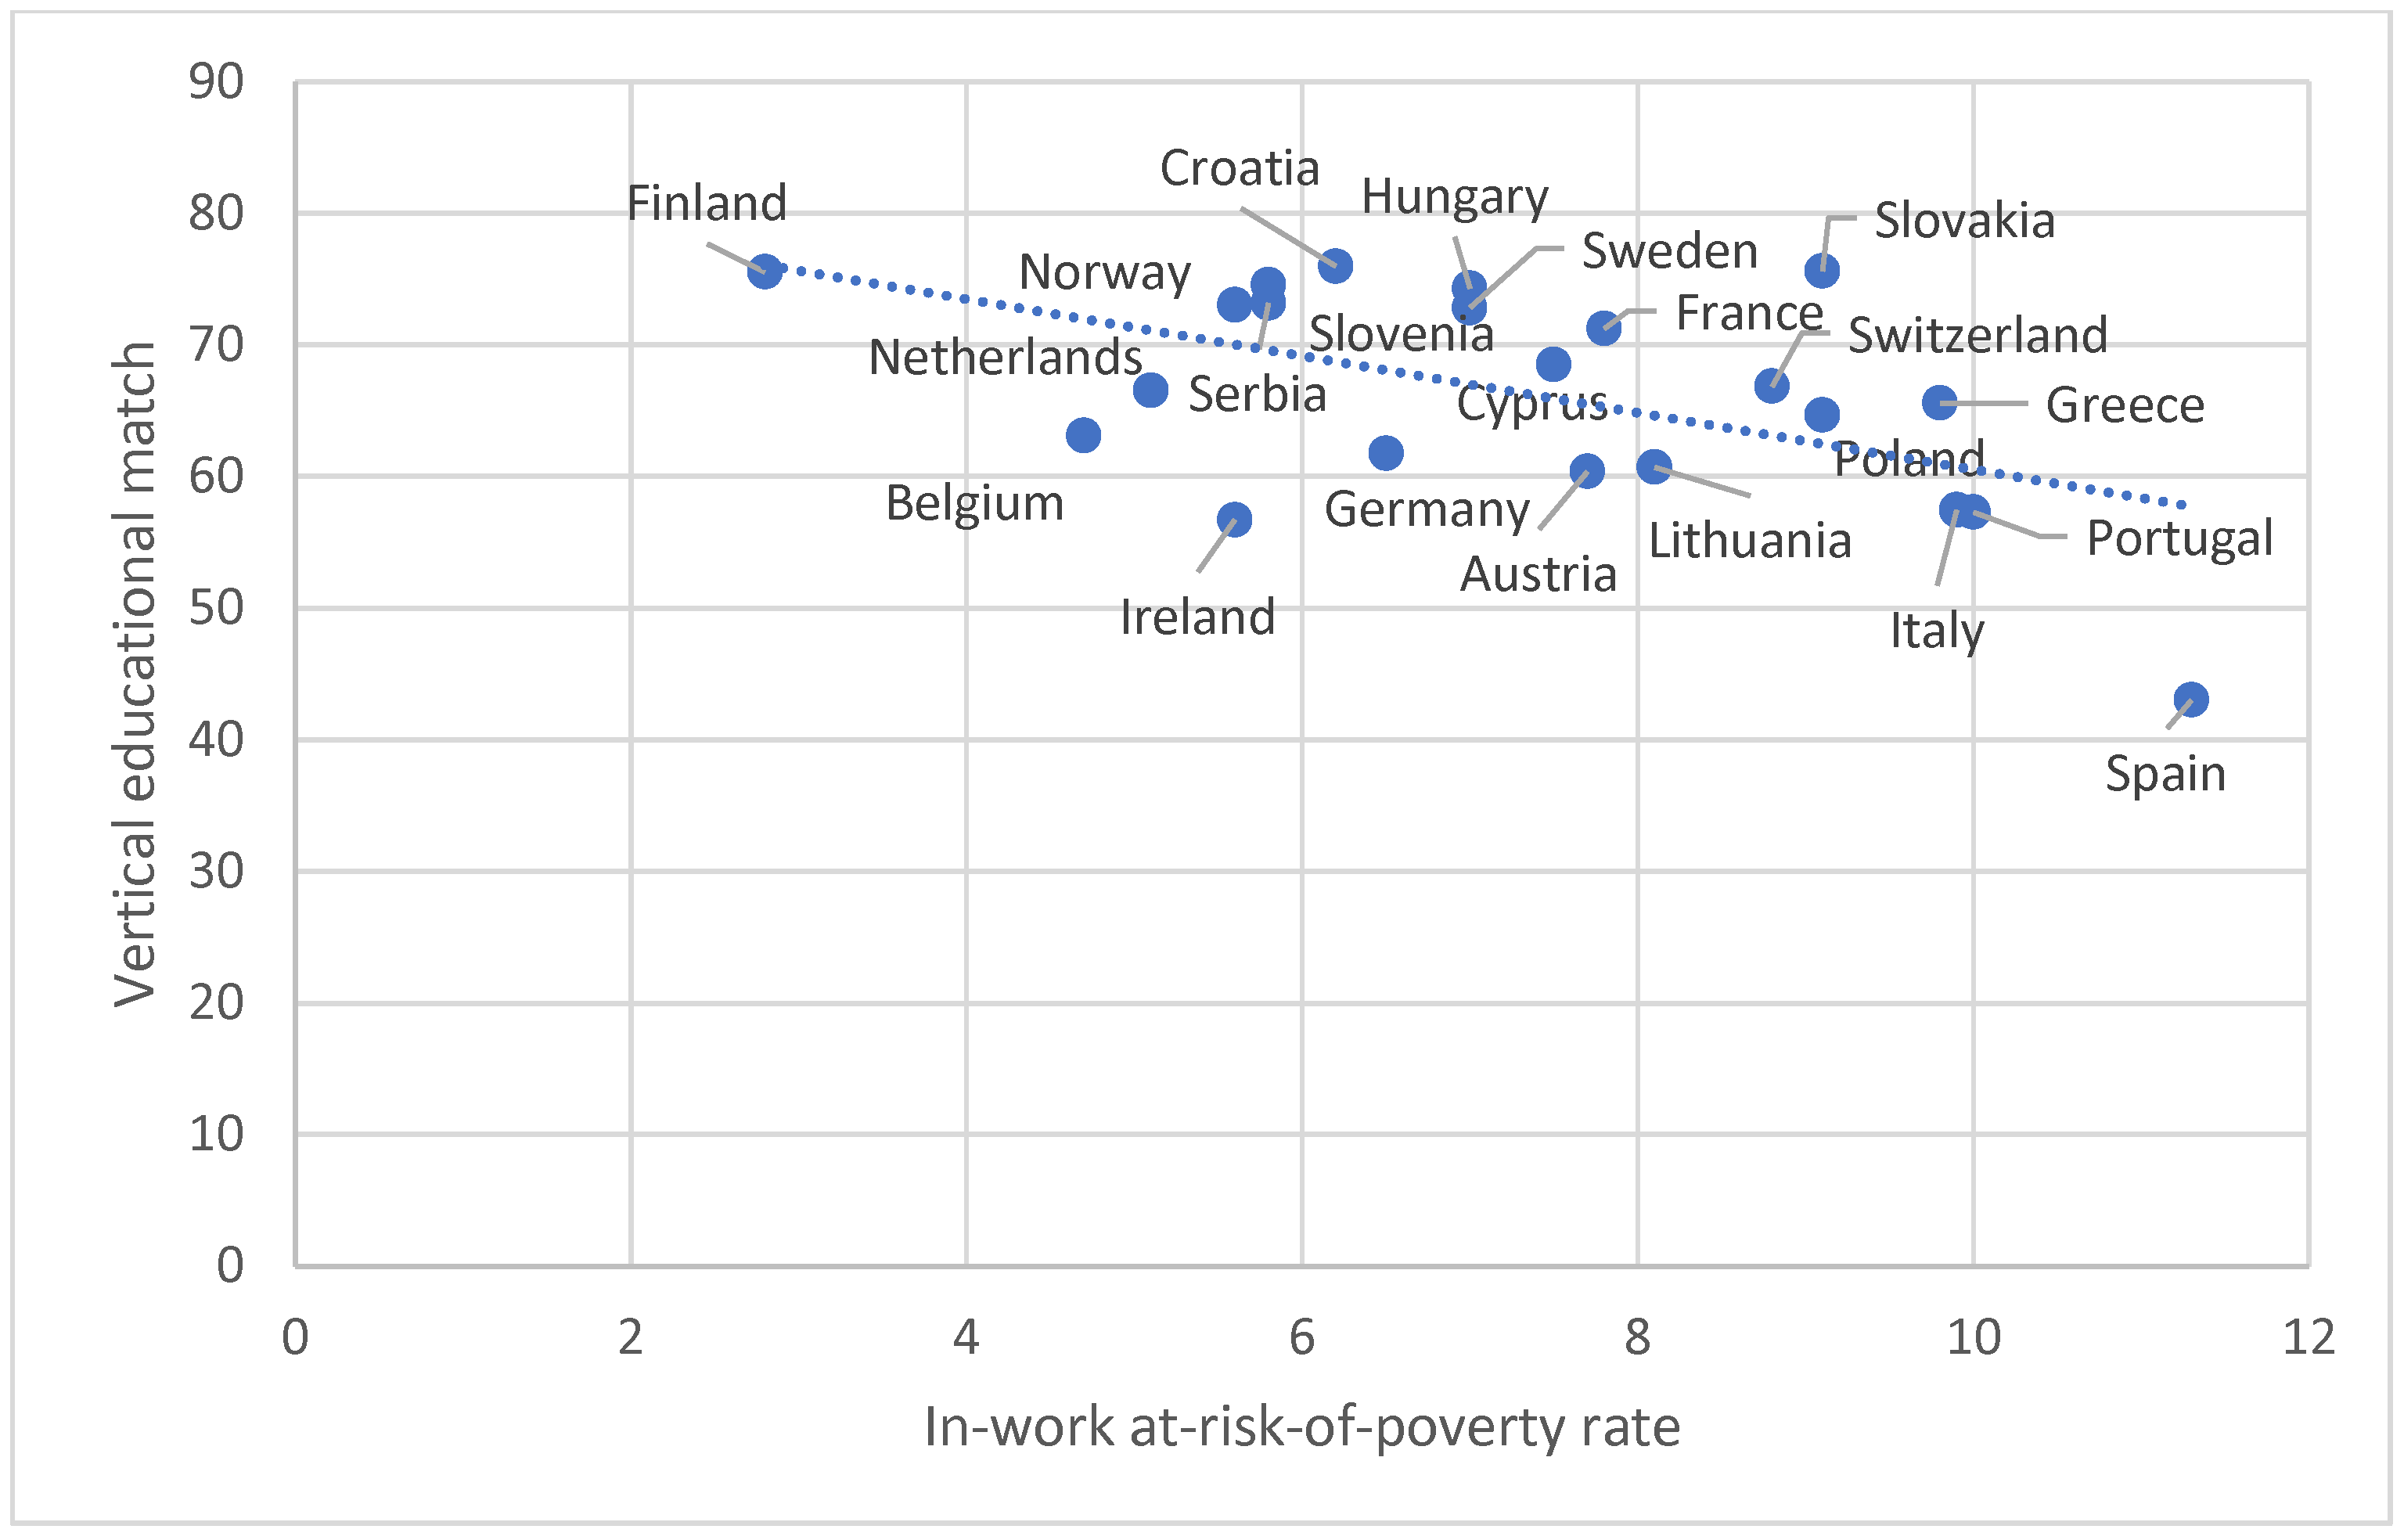
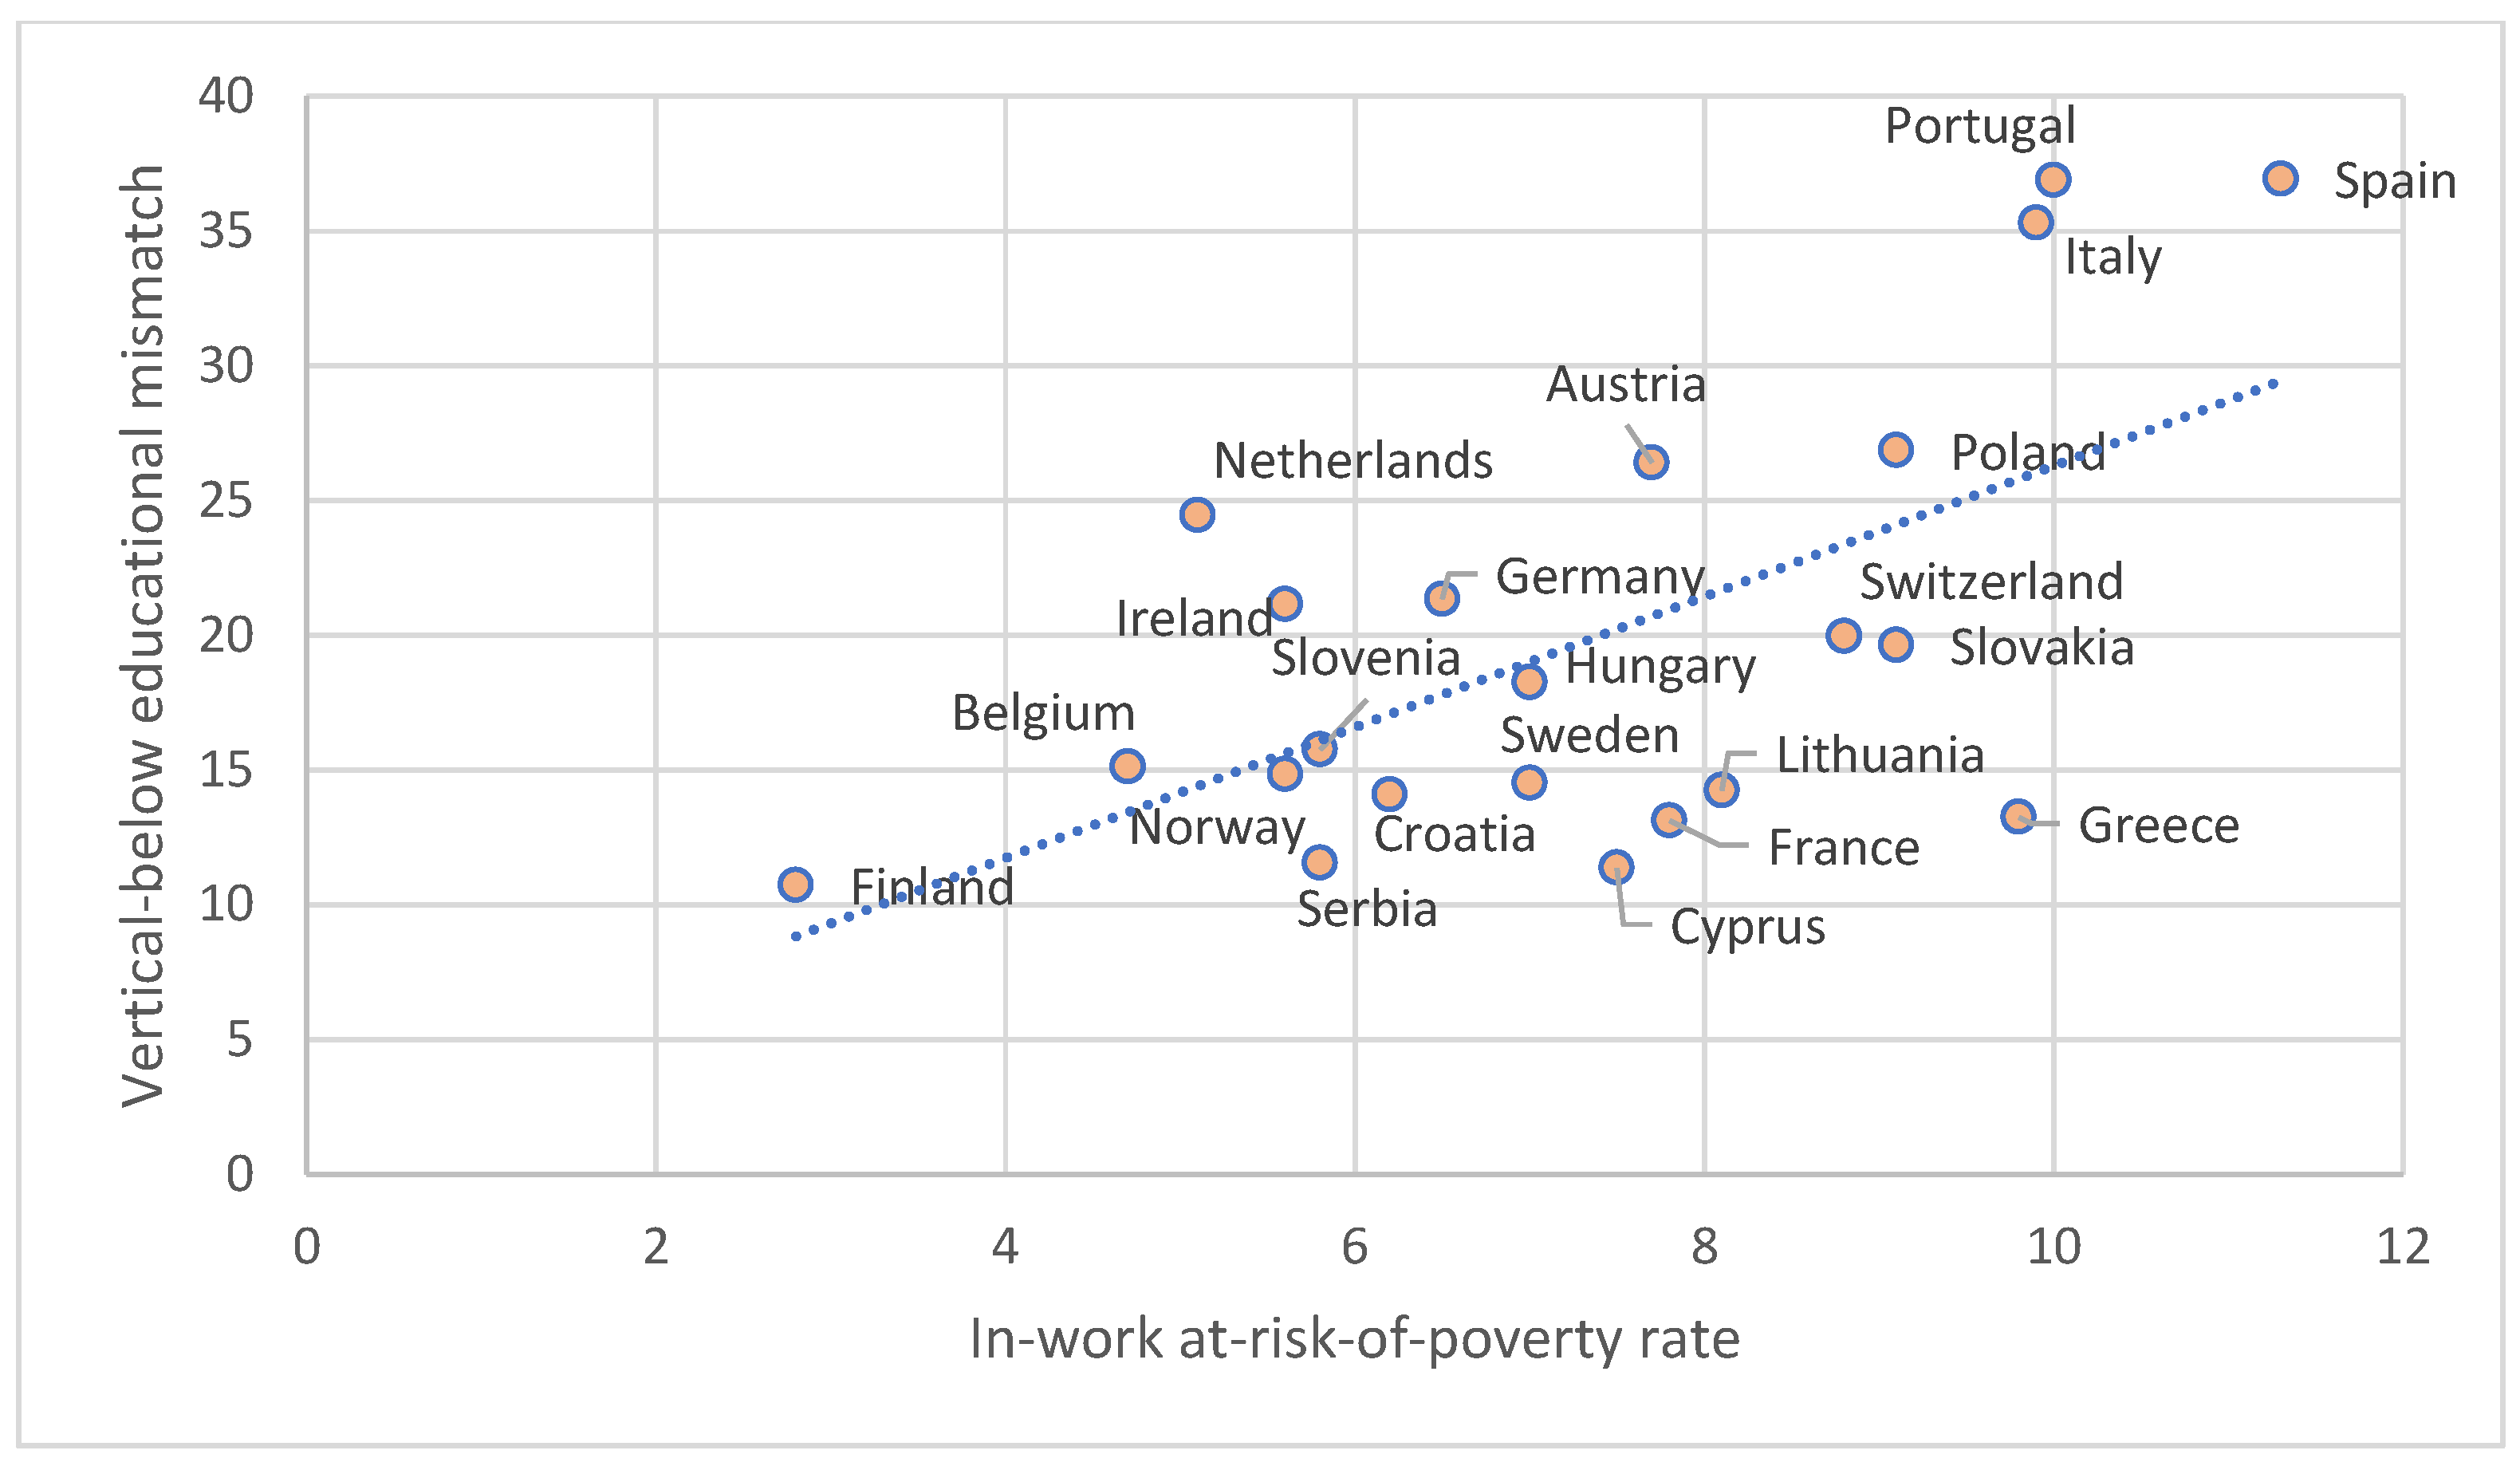
  • In-work at-risk-of-poverty rate. It refers to the percentage of people in the total population from 18 to 64 years of age who declared themselves to be working (employed or self-employed) and who are at risk of poverty (i.e., with an equivalized disposable income below the risk-of-poverty threshold, which is set at 60% of the national median equivalized disposable income (after social transfers). Source: Eurostat. Data code: ilc_iw01 [Accessed on 11 April 2025].
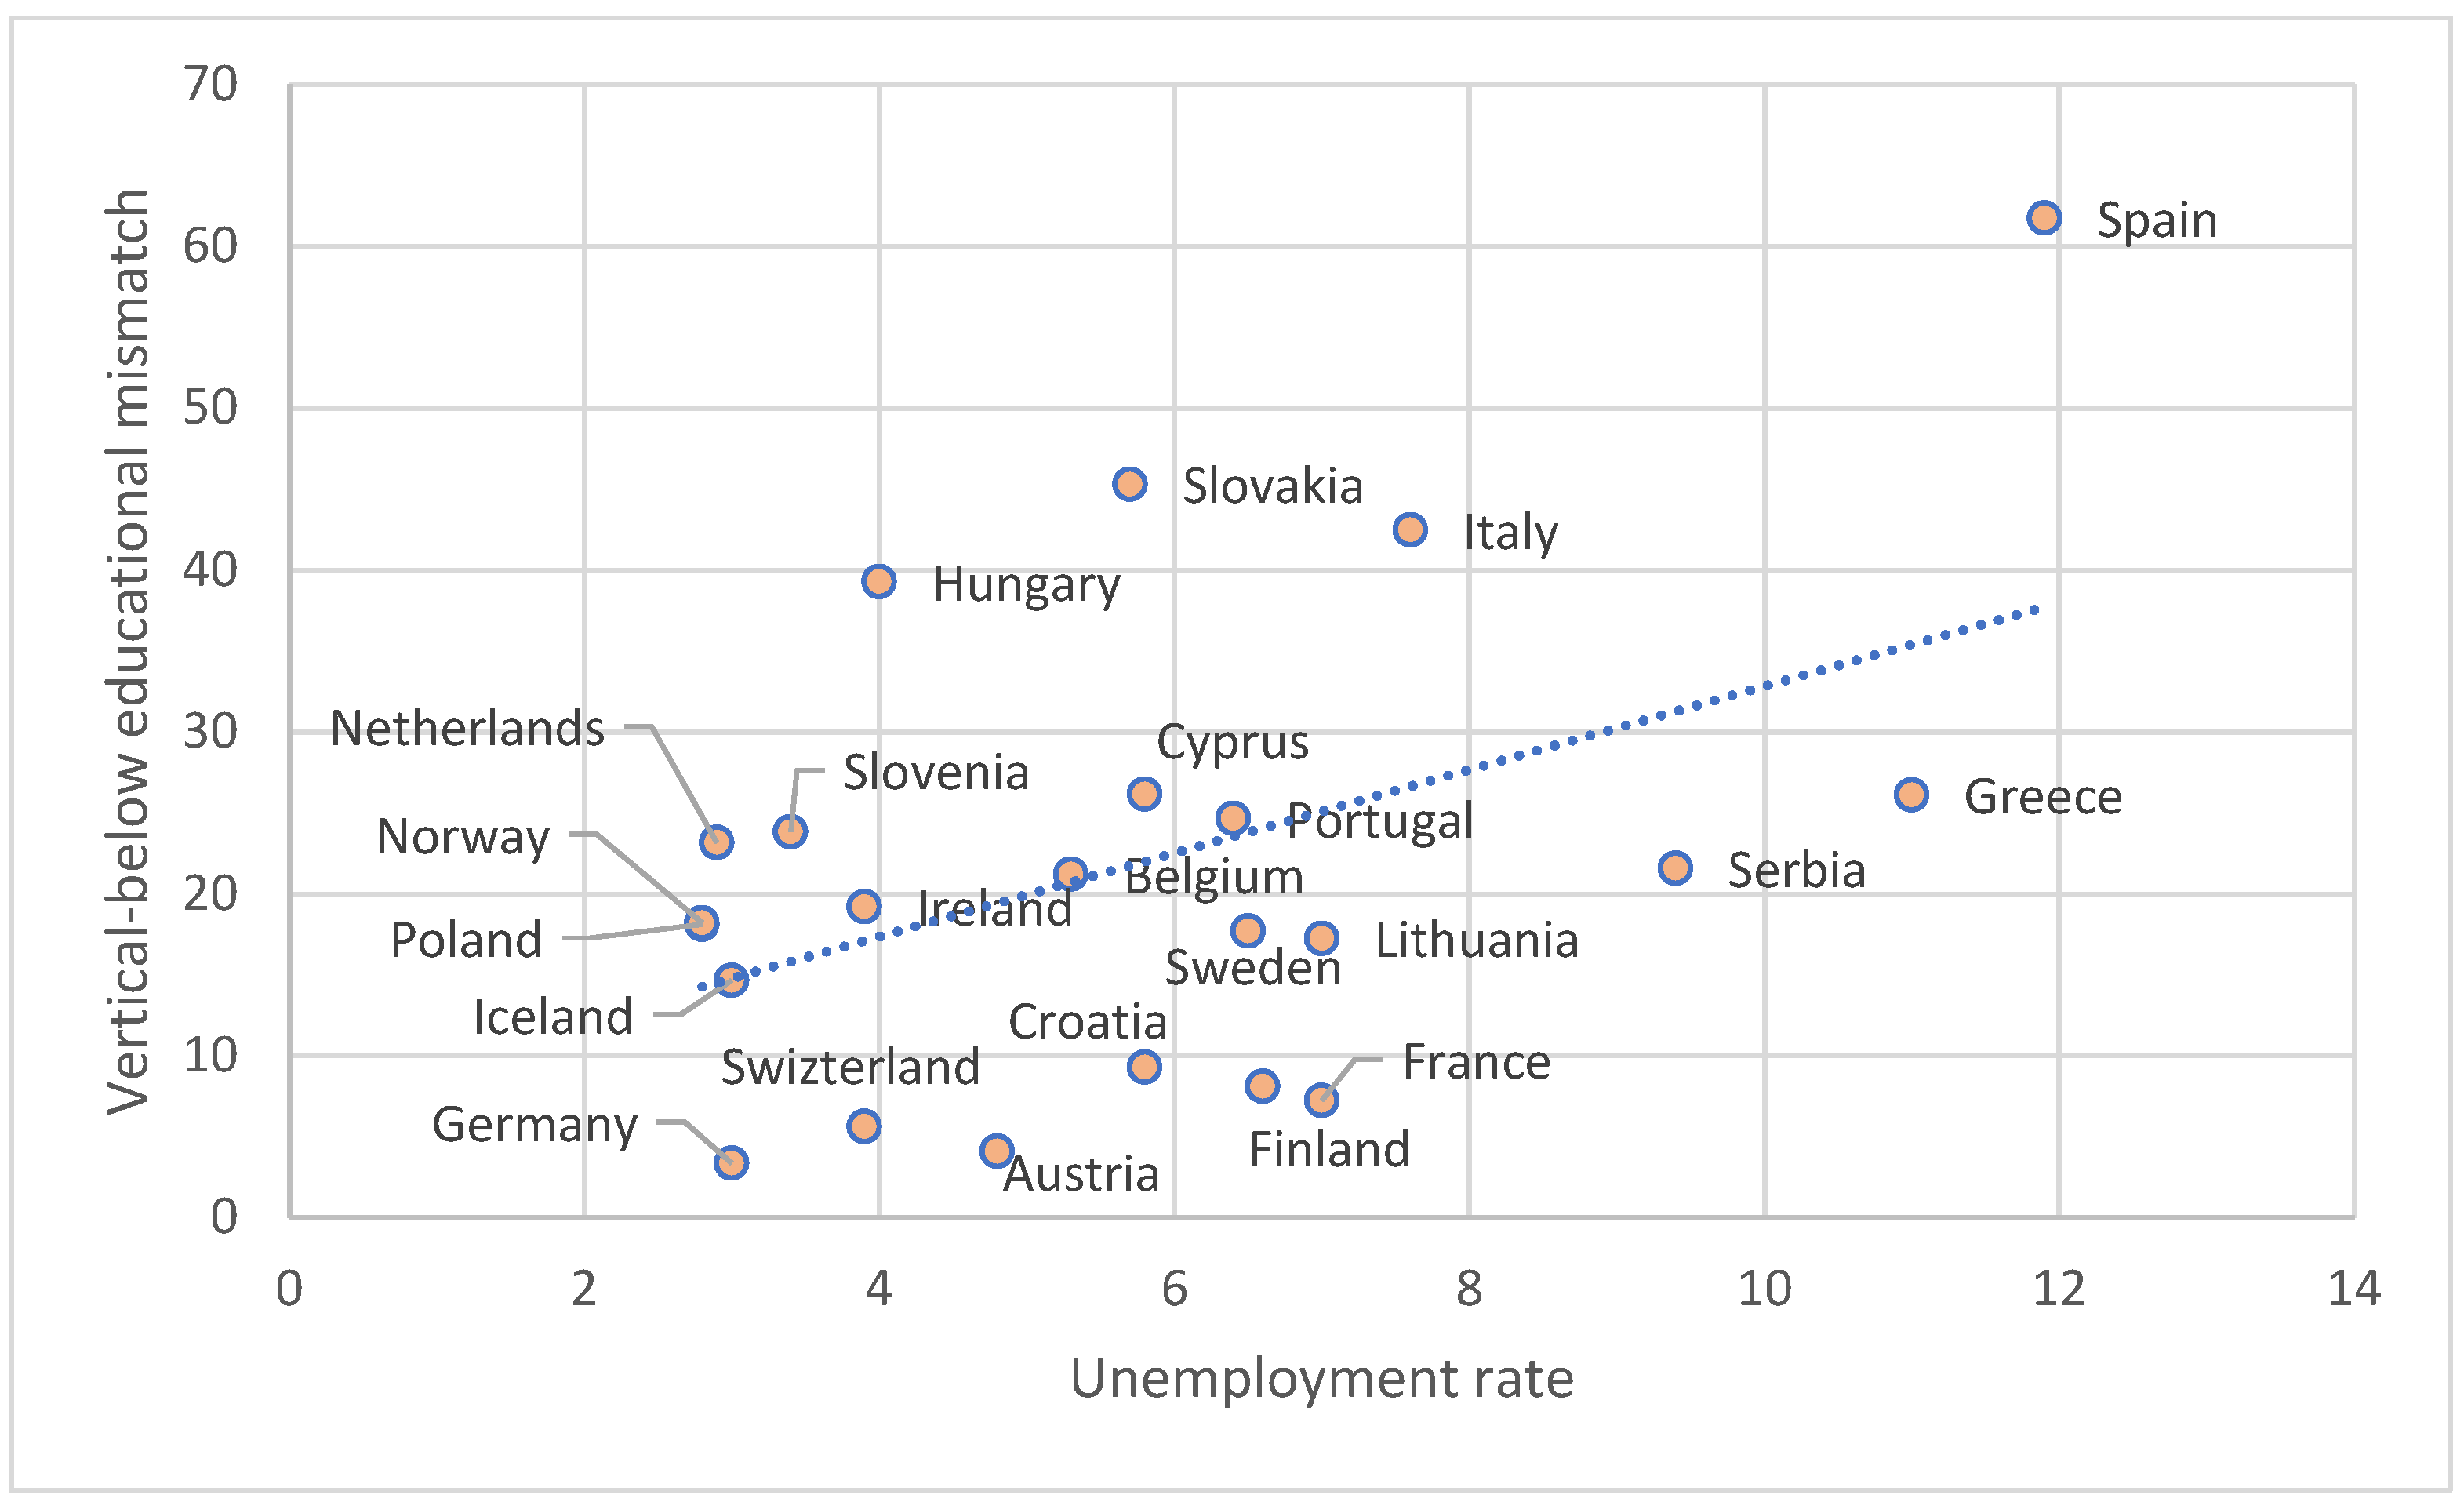
  • Unemployment rate. It refers to the percentage of unemployment among the population aged 20 to 64 years in the labor force. Source: Eurostat. Data code: une_rt_a [Accessed on 11 April 2025].
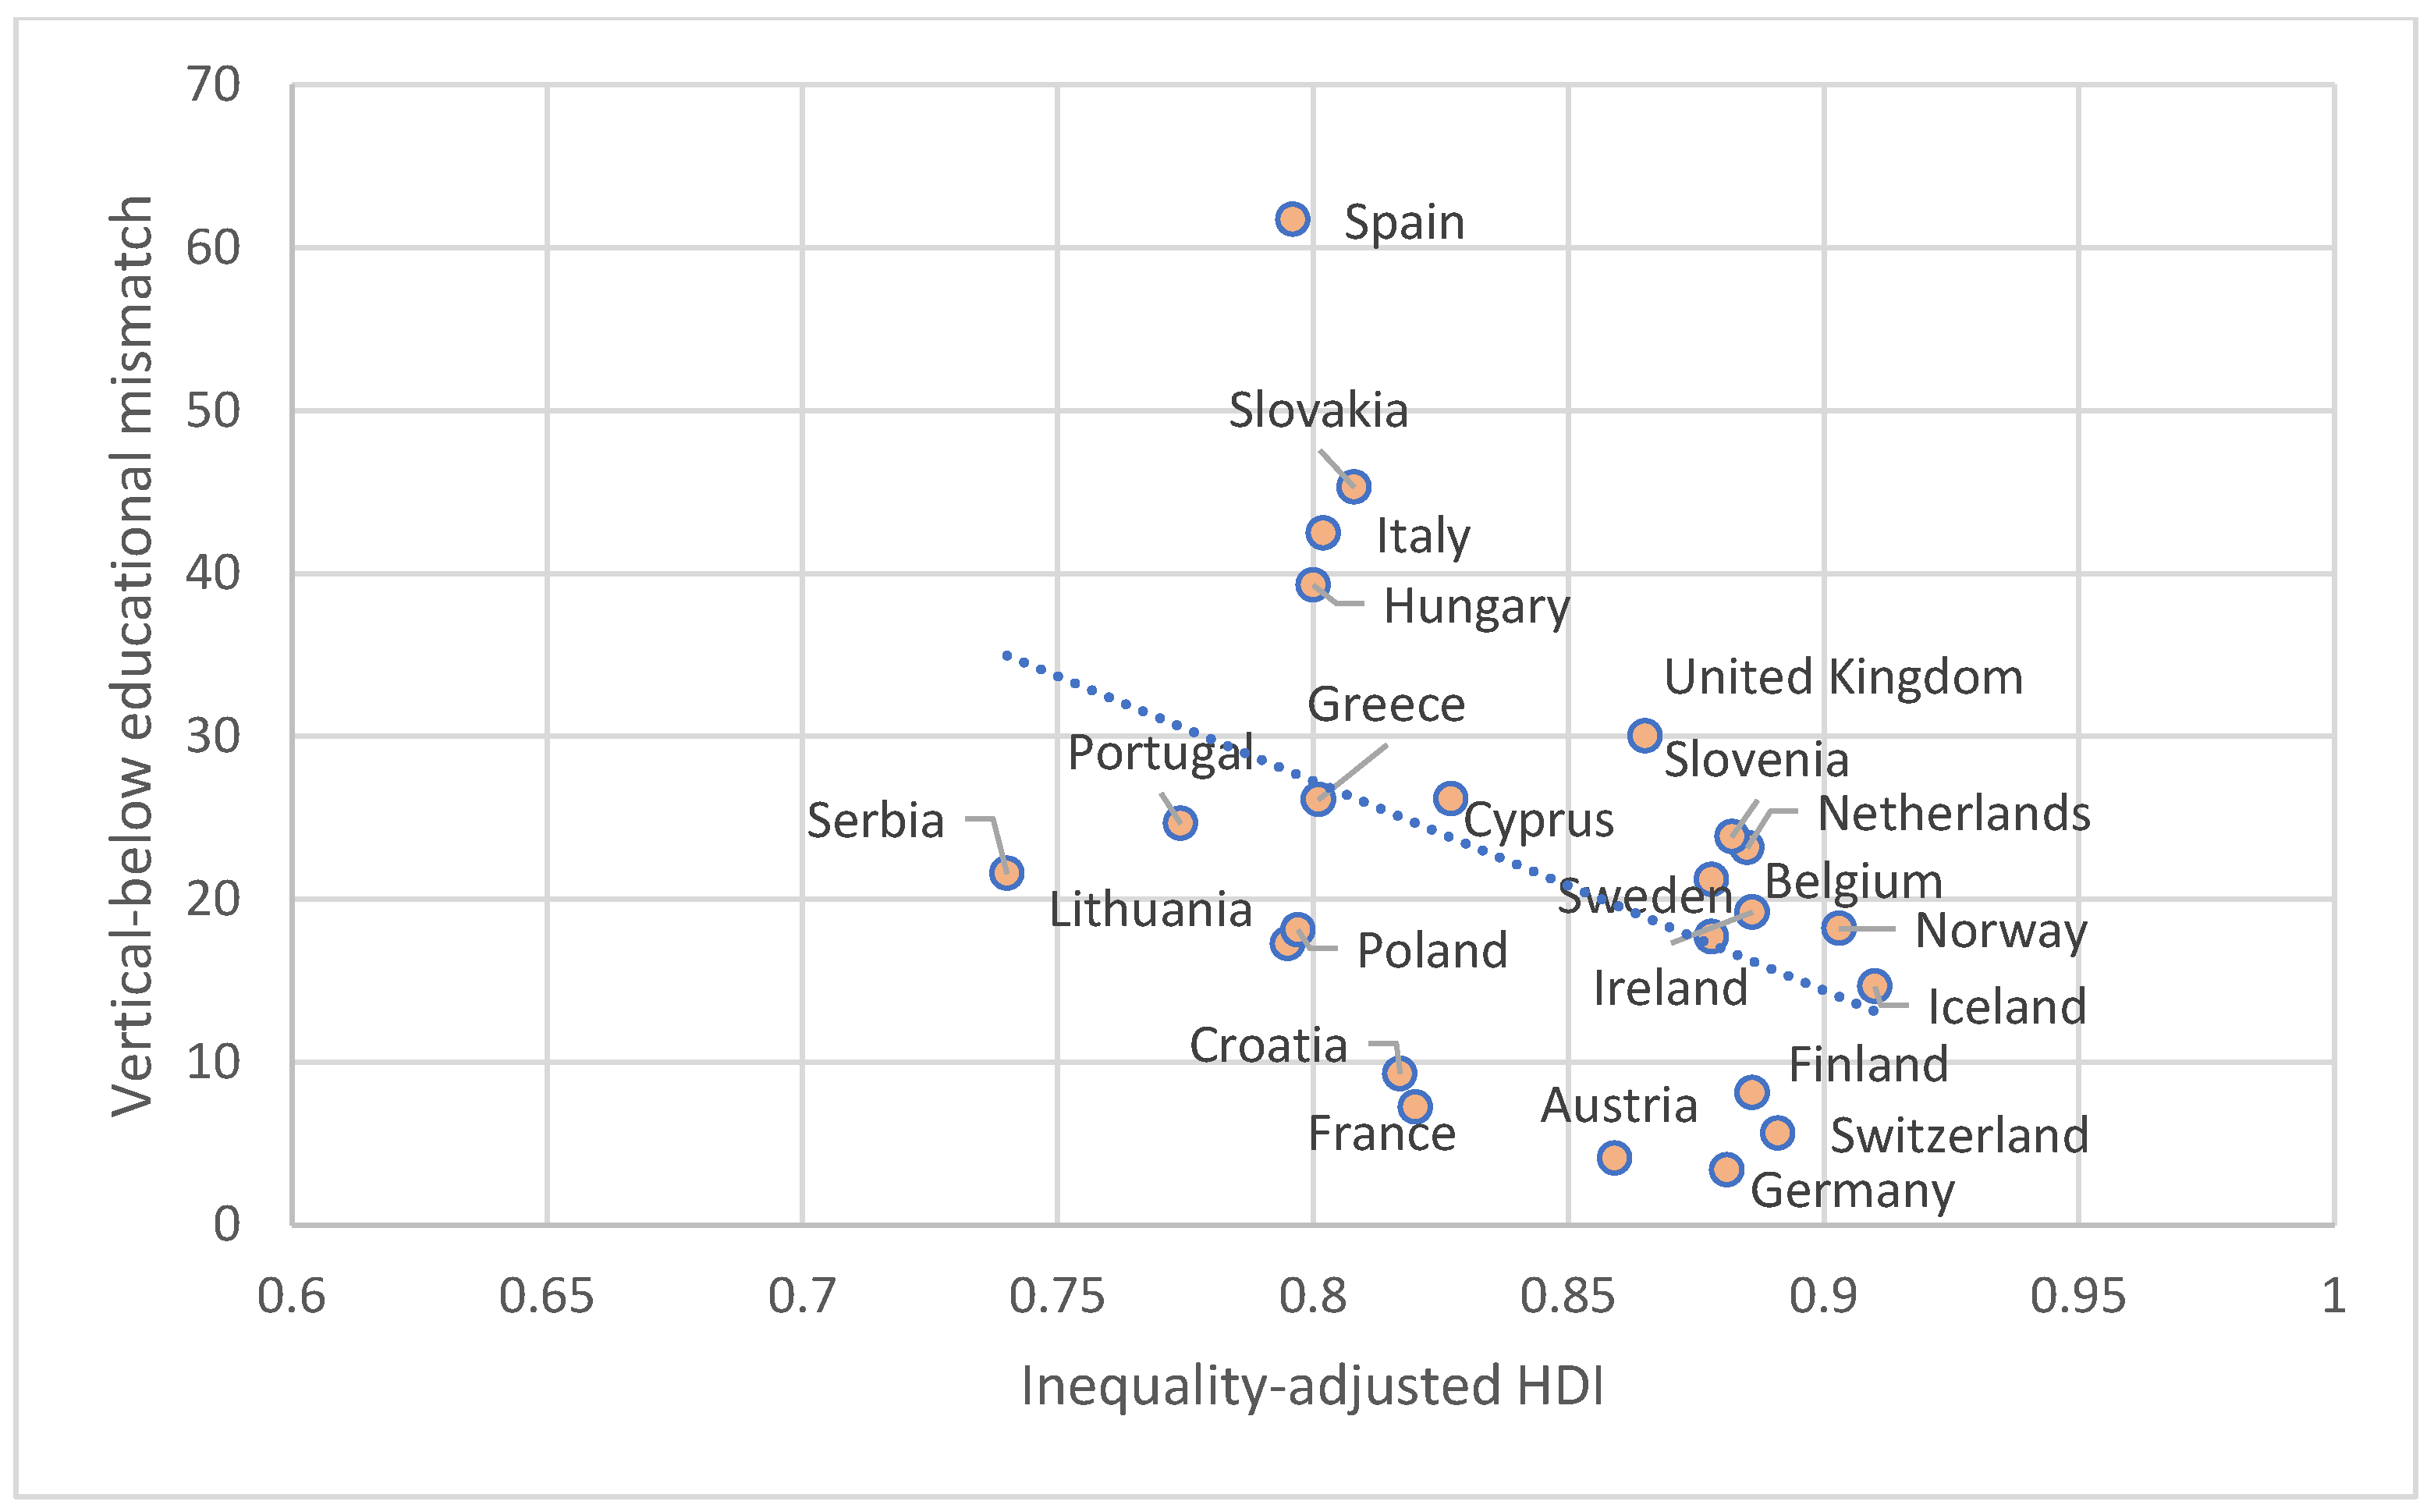
  • Inequality-adjusted HDI. It is designed to adjust the Human Development Index value for inequality within countries in each of its components (health, education, and income)4 [17]. This index looks beyond the average progress of a country in terms of longevity, education, and income to show how these achievements are distributed among its residents. It ranges between 0 and 1, where the value of 1 means the best possible level of human development when inequality is accounted for.

4.2. Research Strategy

The article applies correlation analysis as a research strategy. More specifically, we have tested if there are statistically significant associations between all six above-mentioned indicators of inclusive growth and the levels of skills/educational (mis)march for the people 25–64 who have paid work in a given country as a whole and for each of the four occupational groups (high-skilled white-collar workers, low-skilled white-collar workers, high-skilled blue-collar workers, and low-skilled blue-collar workers). As a result, we have calculated 30 bivariate Pearson correlations. The correlation coefficient can range between −1 to 1. While acknowledging that there is no undisputable view of the interpretation of the size of the correlations, for the needs of this article we have used a more nuanced classification, which distinguishes between very weak (<0.20), weak (0.20–0.39), moderate (0.40–0.59), strong (0.60–0.79) and very strong (>0.80) correlations [78,79]. We will be presenting in the Section 5 those that are significant at levels of p < 0.01, 0.05, or 0.10.

4.3. Limitations of the Analyses

Our analyses allow for a discussion about the associations between variables, but they do not imply causality. However, although associations do not reveal causality, they indicate the existence of a relationship between the studied variables. Last, we do not have a variable that considers the time when the respondent had this occupation.

5. Results

The present study has identified several statistically significant associations between the levels of vertical educational match, vertical mismatch above, and vertical mismatch below in a given country, and part of the measures of inclusive economic growth among the population aged 25–64 who have paid work or for some of the four occupational groups.

5.1. Vertical Educational Match

As for the vertical educational match, our analysis shows that there are moderate negative correlations between the proportion of vertical educational match among the people aged 25–64 who have paid work and three of the indicators of inclusiveness of economic growth (Figure 1, Figure 2 and Figure 3): with the Gini coefficient (Pearson’s r = −0.427, significant at p < 0.05), with the proportion of persons at risk of poverty or social exclusion (Pearson’s r = −0.436, significant at p < 0.05), and with the in-work at-risk-of-poverty rate (Pearson’s r = −0.537, significant at p < 0.01). It means that a higher level of vertical educational match among the people aged 25–64 who have paid work in a given country is associated with lower levels of income inequalities, persons at risk of poverty and social exclusion, and in-work poverty.
In the case of the occupational groups, we have found a weak negative correlation between the Gini coefficient and the percentage of low-skilled white-collar workers who are educationally matched in a given country (Pearson’s r = −0.392, significant at p < 0.10). This indicates that a higher level of vertical educational match for this occupational group (low-skilled white-collar workers) at the country level is associated with lower income inequalities.

5.2. Vertical-Above Educational Mismatch

As regards the vertical-above educational mismatch, we have found a statistically significant positive correlation between the proportion of this type of mismatch among people 25–64 who have paid work in a given country and one of the indicators for inclusiveness of economic growth: the proportion of persons at risk of poverty or social exclusion (Pearson’s r = 0.412, significant at p < 0.10). This shows that the higher the vertical-above educational mismatch among the population 25–64 who have paid work in a given country, the higher the proportion of persons at risk of poverty or social exclusion.
The results furthermore reveal that there is a moderate positive association between the percentage of vertical-above educational mismatch among high-skilled blue-collar workers and the Inequality-adjusted HDI (Pearson’s r = 0.488, significant at p < 0.05). This means that the higher the percentage of vertical-above educational mismatch among high-skilled blue-collar workers in a given country, the higher the Inequality-adjusted HDI (Figure 4).

5.3. Vertical-Below Educational Mismatch

Regarding vertical-below educational mismatch, we have found a strong positive correlation between the in-work at-risk-of-poverty rate in a given country and the percentage of vertical-below educational mismatch among people aged 25–64 who have paid work (Pearson’s r = 0.613, significant at p < 0.01). This means that the higher the level of vertical-below educational mismatch among the population 25–64 who have paid work in a given country, the higher the level of in-work poverty and vice versa (see Figure 5). The analyses show that there are also statistically significant positive correlations between the in-work at-risk-of-poverty rate and the percentages of vertical-below educational mismatch among the high-skilled blue-collar (Pearson’s r = 0.501, significant at p < 0.05) and low-skilled blue-collar workers (Pearson’s r = 0.552, significant at p < 0.01). This indicates that the higher the level of vertical-below educational mismatch for high and low-skilled blue-collar workers in a given country, the higher the level of in-work poverty and vice versa.
Our analyses have also shown that there are statistically significant correlations between the vertical-below educational mismatch among two occupational groups (high and low-skilled blue-collar workers) with some of the other indicators of inclusive growth. Thus, regarding the vertical-below educational mismatch among high-skilled blue-collar workers, we have found a positive association between its proportion and the level of unemployment in a given country (Pearson’s r = 0.460, significant at p < 0.05) and a negative one with the inequality-adjusted HDI (Pearson’s r = −0.432, significant at p < 0.05). This means that a higher level of vertical-below educational mismatch among high-skilled blue-collar workers is associated with a higher unemployment rate and lower inequality-adjusted human development (See Figure 6 and Figure 7).
As regards the low-skilled blue-collar workers, Figure 8 illustrates that there is a moderate positive association between the proportion of vertical-below educational mismatch among this occupational group and the Gini coefficient (Pearson’s r = 0.422, significant at p < 0.05). This indicates that a higher level of vertical-below educational mismatch among low-skilled blue-collar workers in a given country is associated with a higher level of income inequality.

6. Discussion

At the theoretical level, we have argued that the dominant approaches in studies on skills/educational mismatch place it mainly in relation to productivity and individual economic benefits. In searching for a more comprehensive theoretical perspective, this article draws on the heuristic potential of the capability approach. We define skills/educational mismatch as imbalances between individuals’ skills/education and the skills/education required in the labor market, leading to capability deprivation with wider consequences at the individual and societal levels.
In relation to our RQ1 and accordance with our expectations, our findings suggest that vertical educational match can be viewed as a sign of inclusiveness of growth. Thus, higher levels of vertical educational match among the entire population aged 25–64 who are in paid work in a given country are associated with lower levels of income inequalities, persons at risk of poverty and social exclusion, and in-work poverty.
In relation to our RQ2, we found that the associations between vertical educational (mis)match and inclusive growth differ among occupational groups. Roosmaa et al. [10] have convincingly shown that there are substantial differences in skills/educational mismatch between occupational groups. Our findings further reveal that the effects of skills/educational (mis)match at the societal level vary among different occupational groups. More concretely, our results suggest that the market labor situation of the high-skilled blue-collar occupational group has a crucial role in the inclusive economic growth in a given country. Thus, higher levels of vertical-below educational mismatch for this group in a given country are associated with higher rates of unemployment and in-work poverty and lower levels of inequality-adjusted HDI. We suggest that these results reflect the fact that the existence of adequate and well-qualified high-skilled blue-collar workers is an important factor in the development of key economic sectors, such as energy, production, construction, agriculture, and manufacturing.
The obtained results demonstrate that vertical—either above or below—educational mismatch is related to capability deprivation at the societal level. For example, we have found that as the vertical-above educational mismatch among the population 25–64 who have paid work increases, the proportion of persons at risk of poverty or social exclusion also becomes higher. Our findings also revealed that a higher level of vertical-below educational mismatch among the population 25–64 who have paid work in a given country is associated with a higher level of in-work poverty and vice versa.

7. Conclusions

The present article studies some effects of skills/educational (mis)match on inclusive economic growth using data from the 11th round of the European Social Survey and official data sources. To the best of our knowledge there is no research specially devoted to the analysis of the relationship between vertical educational (mis)match and inclusive growth. More concretely, this article focuses on the relationships between vertical educational (mis)match and some macro characteristics (Inequality-adjusted HDI, Gini coefficient, level of unemployment, poverty indices). Our main conclusion is that the vertical educational match is positively associated with inclusive growth.
Our study raises several additional questions and allows us to outline some directions for future research. First, the relationship between skills/educational (mis)match and inclusive growth could be studied in a more dynamic way, i.e., for other time periods. The time series of these data will also allow us to perform causal analysis, which will indispensably contribute to deepening the research on this issue. Second, it will be worthwhile to analyze the relationship between skill/educational (mis)match with the use of other measures and indicators, for example, by measuring skills/educational (mis)match subjectively through self-assessment or using a composite index for inclusive growth [52]. Third, a fruitful direction for studies is the investigation of the relationship between other forms of skills mismatch, e.g., skills shortages, skills gaps, or skills obsolescence, on the one hand, and inclusive economic growth, on the other. Fourth, a distinctive line for future research is the association of skills/educational (mis)match with non-monetary indicators of inclusive growth and thus including wider manifestations of capability deprivation for individuals, such as their well-being, personal relations, use of talents at work or active citizenship (e.g., [80]).
As already outlined, Sen [39] defines development as the expansion of persons’ capabilities to lead the kind of lives they value and have reason to value. From this perspective, income and wealth are not desirable for their own sake but because they function as a means to have more freedom to lead the kind of lives we have reason to value. If we apply this reasoning to skills/educational mismatch, we could claim that overcoming it is not desirable for its own sake; rather, it is a means to avoid the deprivation of people’s capabilities and enable them to lead the kind of lives they have reason to value and to build fair and flourishing societies.

Author Contributions

Conceptualization, P.B.; Formal analysis, P.I.-T.; Investigation, P.B. and P.I.-T.; Methodology, P.I.-T.; Project administration, P.B.; Resources, P.B.; Software, P.I.-T. Supervision, P.B.; Validation, P.I.-T.; Visualization, P.I.-T.; Writing—original draft, P.B and P.I.-T.; Writing—review and editing, P.B. and P.I.-T.; Funding Acquisition, P.B. and P.I.-T.; All authors have read and agreed to the published version of the manuscript.

Funding

This research was undertaken within the Skills2Capabilities project (2023–2025), which is funded by the European Union’s Horizon Europe research and innovation programme under Grant Agreement No. 101094758.

Institutional Review Board Statement

Not applicable.

Informed Consent Statement

Not applicable.

Data Availability Statement

The original contributions presented in the study are included in the article.

Acknowledgments

We would like to thank the two anonymous reviewers and the editor of Societies Journal for their valuable comments on an earlier version of this article.

Conflicts of Interest

The authors declare no conflict of interest.

Appendix A

Table A1. Indicators of the inclusiveness of economic growth.
CountryGini Coefficient of Equivalised Disposable IncomeAt-Risk-of-Poverty Rate by Poverty ThresholdIn-Work at-Risk-of-Poverty RatePersons at Risk of Poverty or Social Exclusion (%)Unemployment RateInequality-Adjusted HDI
Austria28.114.97.717.74.80.859
Belgium24.212.34.718.65.30.878
Switzerland31.516.48.819.53.90.891
Cyprus29.613.97.516.75.80.827
Germany29.414.46.521.330.881
Spain31.520.211.326.511.90.796
Finland26.612.22.815.86.60.886
France29.715.47.820.470.82
United Kingdom-----0.865
Greece31.818.99.826.1110.801
Croatia29.719.36.220.75.80.817
Hungary2913.1719.740.8
Ireland27.4125.619.23.90.886
Iceland----30.91
Italy31.518.99.922.87.60.802
Lithuania35.720.68.124.370.795
Netherlands26.5135.115.82.90.885
Norway24.711.55.615.82.80.903
Poland27149.116.32.80.797
Portugal33.7171020.16.40.774
Serbia31.719.95.827.29.40.74
Sweden29.516.1718.46.50.878
Slovenia23.412.75.813.73.40.882
Slovakia21.614.39.117.65.70.808
Figure A1. Skills/Educational (mis)matches across 24 European countries, (%). Source: Own calculations based on ESS Round 11 [16] for people aged 25–64 who have paid work, weighted data (dweight), sorted by the proportion of vertical educational match.
Societies 15 00113 g0a1

Notes

1
For a systematic overview of the capability approach, see, for example, Robeyns [43] and Boyadjieva and Ilieva-Trichkova [44].
2
3
More specifically, we differentiate between four occupational groups distinguished based on ISCO broad categories at the single-digit level: high-skilled white-collar workers (ISCO 1–3), low-skilled white-collar workers (ISCO 4–5), high-skilled blue-collar workers (ISCO 6–7), and low-skilled blue-collar workers (ISCO 8–9).
4
Its values are as of 2022 because it was the latest release of the index available at the moment of the study.

References

  1. Cerra, V. An inclusivse growth framework. In How to Achieve Inclusive Growth; Cerra, V., Eichengreen, B., El-Ganainy, A., Schindler, M., Eds.; Oxford University Press: Oxford, UK, 2022; pp. 1–31. [Google Scholar] [CrossRef]
  2. Stiglitz, J. The Price of Inequality. How Today’s Divided Society Endangers Our Future; W.W. Norton & Company: New York, NY, USA, 2012. [Google Scholar]
  3. Wilkinson, R.; Pickett, K. The Spirit Level: Why More Equal Societies Almost Always Do Better; Allen Lane: London, UK, 2009. [Google Scholar]
  4. Comin, F. Beyond the HDI? Assessing Alternative Measures of Human Development from a Capability Perspective; UNDP Human Development Report Office: New York, NY, USA, 2017. [Google Scholar]
  5. Ianchovichina, E.; Lundstrom, S. Inclusive Growth Analytics: Framework and Application; Policy Research Working Paper 4851; The World Bank Group: Washington, DC, USA, 2009; Available online: http://documents.worldbank.org/curated/en/771771468180864543/Inclusive-growth-analytics-framework-and-application (accessed on 15 November 2024).
  6. Ranieri, R.; Ramos, A.R. Inclusive Growth: Building Up a Concept; Working Paper 104; International Policy Centre for Inclusive Growth, United Nations Development Programme: Brasilia, Brazil, 2013; Available online: https://ipcid.org/sites/default/files/pub/en/IPCWorkingPaper104.pdf (accessed on 15 November 2024).
  7. Cerra, V.; Eichengreen, B.; El-Ganainy, A.; Schindler, M. (Eds.) How to Achieve Inclusive Growth; Oxford University Press: Oxford, UK, 2022. [Google Scholar]
  8. Saher, L.; Tabák, L.; Lyeonov, S.; Vasa, L. Inclusive growth: Literature review. J. Int. Stud. 2024, 1, 205–232. Available online: https://www.ceeol.com/search/article-detail?id=1236169 (accessed on 15 November 2024). [CrossRef]
  9. Brunello, G.; Wruuck, P. Skill shortages and skill mismatch: A review of the literature. J. Econ. Surv. 2021, 35, 1145–1167. [Google Scholar] [CrossRef]
  10. Roosmaa, E.-L.; Saar, E.; Martma, L. Education Mismatch in European Countries During the 2008 Financial Crisis and After That: Determinants by Occupational Groups and the Mismatch on Salaries; RASI Toimetised nr 23; Tallinna Ülikool: Tallinn, Estonia, 2023; Available online: https://www.tlu.ee/sites/default/files/Instituudid/%C3%9CTI/RASI/2023_RASI%20toimetised%20nr%2023_Education%20mismatch%20in%20European%20countries%20during%20the%202008%20financial%20crisis%20and%20after%20that%20determinants%20by%20occupational%20groups%20and%20the%20mismatch%20on%20salaries.pdf (accessed on 15 November 2024).
  11. Neycheva, M. Qualification (mis)match for upper secondary and higher education. Soc. Sci. 2021, 10, 327. [Google Scholar] [CrossRef]
  12. Schofer, E.; Meyer, J.W. The worldwide expansion of higher education in the twentieth century. Am. Sociol. Rev. 2005, 70, 898–920. [Google Scholar] [CrossRef]
  13. Cantwell, B.; Marginson, S.; Smolentseva, A. (Eds.) High Participation Systems of Higher Education; Oxford University Press: Oxford, UK, 2018. [Google Scholar]
  14. Desjardins, R. Rewards to Skill Supply, Skill Demand and Skill-mismatch. Studies Using the Adult Literacy and Life Skills Survey; Lund Economic Studies No 176; Lund University: Lund, Sweden, 2014; Available online: https://lup.lub.lu.se/search/publication/4350627 (accessed on 15 November 2024).
  15. McGuinness, S.; Pouliakas, K.; Redmond, P. Skills mismatch: Concepts, measurement and policy approaches. J. Econ. Surv. 2018, 32, 985–1015. [Google Scholar] [CrossRef]
  16. ESS Round 11: European Social Survey European Research Infrastructure (ESS ERIC) ESS11—Integrated File, 2nd ed.; [Data Set]; Sikt—Norwegian Agency for Shared Services in Education and Research: Bergen, Norway, 2024. [CrossRef]
  17. UNDP. Human Development Report 2023/2024. Breaking the Gridlock: Reimagining Cooperation in a Polarized World; UNDP: New York, NY, USA, 2024. [Google Scholar]
  18. Cedefop. Insights into Skill Shortages and Skill Mismatch: Learning from Cedefop’s European Skills and Jobs Survey; Cedefop Reference Series No 106; Publications Office of the European Union: Luxembourg, 2018; Available online: https://data.europa.eu/doi/10.2801/645011 (accessed on 15 November 2024).
  19. McGuinness, S.; Redmond, P.; Staffa, E.; Devlin, A.; Whelan, A. 15: Skills mismatch: What do we already know and what do we need to know? In Handbook of Education and Work; Maarten, H.J., Wolbers, M.H.J., Verhaest, D., Eds.; Edward Elgar Publishing: Cheltenham, UK, 2025; pp. 318–339. [Google Scholar] [CrossRef]
  20. Cedefop. Skill Mismatch in Europe Europe’s Challenge Is Not Just to Improve Skill Levels, But to Match People with the Right Skills to the Right Jobs. Briefing Note; Cedefop: Thessaloniki, Greece, 2010; Available online: https://www.cedefop.europa.eu/files/9023_en.pdf (accessed on 15 November 2024).
  21. McGuinness, S. Overeducation in the labour market. J. Econ. Surv. 2006, 20, 387–418. [Google Scholar] [CrossRef]
  22. Delaney, J.; McGuinness, S.; Poulakis, K.; Redmond, P. Educational expansion and overeducation of young graduates: A comparative analysis of 30 European countries. Oxf. Rev. Educ. 2020, 46, 10–29. [Google Scholar] [CrossRef]
  23. Schultz, T.W. Investment in human capital. Am. Econ. Rev. 1961, 51, 1–17. Available online: https://www.jstor.org/stable/1818907 (accessed on 15 November 2024).
  24. Mincer, J. Investment in human capital and personal income. J. Political Econ. 1958, 66, 281–302. [Google Scholar] [CrossRef]
  25. Kautz, T.; Heckman, J.I.; Diris, R.; ter Weel, B.; Borghans, L. Fostering and Measuring Skills: Improving Cognitive and Non-Cognitive Skills to Promote Lifetime Success; IZA Discussion Paper No. 8696; IZA: Bonn, Germany, 2014; Available online: https://docs.iza.org/dp8696.pdf (accessed on 15 November 2024).
  26. Heckman, J.; Corbin, C. Capabilities and Skills. J. Hum. Dev. Capab. 2016, 17, 342–359. [Google Scholar] [CrossRef]
  27. Thurow, L. Generating Inequality; Basic Books: New York, NY, USA, 1975. [Google Scholar]
  28. Hirsch, F. Social Limits to Growth; Harvard University Press: Cambridge, UK, 1976. [Google Scholar]
  29. Collins, R. The Credential Society: A Historical Sociology of Education and Stratification; First Printing Edition; Academic Press: New York, NY, USA, 1979. [Google Scholar]
  30. Bryson, J. Putting skill in its place. J. Educ. Work 2015, 28, 551–570. [Google Scholar] [CrossRef]
  31. Bergin, A.; Delaney, J.; Handel, M.; McGuinness, S.; Kupets, O.; Pouliakas, K.; Redmond, P. Skills and Jobs Mismatches in Low- and Middle-Income Countries; International Labour Organization: Geneva, Switzerland, 2019. [Google Scholar]
  32. Verhaest, D.; van der Velden, R. Cross-country differences in graduate overeducation. Eur. Sociol. Rev. 2013, 29, 642–653. [Google Scholar] [CrossRef]
  33. Verhaest, D.; Sellami, S.; van der Velden, R. Differences in horizontal and vertical mismatches across countries and fields of study. Int. Labour Rev. 2017, 156, 2–23. [Google Scholar] [CrossRef]
  34. Handel, M.J.; Valerio, A.; Sanchez Puerta, M. Accounting for Mismatch in Low- and Middle-Income Countries; World Bank: Washington, DC, USA, 2016. [Google Scholar]
  35. Sparreboom, T.; Staneva, A. Is Education the Solution to Decent Work for Youth in Developing Economies? Identifying Qualifications Mismatch from 28 School-to-Work Transition Surveys; Work4Youth Publication Series No. 23; International Labour Organization: Geneva, Switzerland, 2014. [Google Scholar]
  36. Allen, J.; van der Velden, R. Educational mismatches versus skill mismatches: Effects on wages, job satisfaction, and on-the-job search. Oxf. Econ. Pap. 2001, 53, 434–452. [Google Scholar] [CrossRef]
  37. Chevalier, A.; Lindley, J. Overeducation and the skills of UK graduates. J. R. Stat. Soc. Ser. A Stat. Soc. 2009, 172, 307–337. [Google Scholar] [CrossRef]
  38. Sen, A. Inequality Reexamined; Oxford University Press: Oxford, UK, 1992. [Google Scholar]
  39. Sen, A. Development as Freedom; Oxford University Press: Oxford, UK, 1999. [Google Scholar]
  40. Nussbaum, M. Creating Capabilities. The Human Development Approach; The Belknap Press of Harvard University Press: Cambridge, UK; London, UK, 2011. [Google Scholar]
  41. Sen, A. Editorial: Human capital and human capability. World Dev. 1997, 25, 1959–1961. [Google Scholar] [CrossRef]
  42. Sen, A. The Idea of Justice; The Belknap Press of Harvard University Press: Cambridge, UK, 2009. [Google Scholar]
  43. Robeyns, I. Wellbeing, Freedom and Social Justice. The Capability Approach Re-Examined; Open Book Publishers: Cambridge, UK, 2017. [Google Scholar]
  44. Boyadjieva, P.; Ilieva-Trichkova, P. Adult Education as Empowerment: Re-Imagining Lifelong Learning Through the Capability Approach, Recognition Theory and Common Goods Perspective; Palgrave Macmillan: London, UK, 2021. [Google Scholar]
  45. Thapa, B.K. Capability approach to skill: Bridging the disciplinary differentials over conceptualizing skill. J. Tech. Vocat. Educ. Train. 2021, 1, 148–155. [Google Scholar] [CrossRef]
  46. Støren, L.A.; Arnesen, C.Å. Winners and losers. In The Flexible Professional in the Knowledge Society; Allen, J., van der Velden, R., Eds.; Springer: Dordrecht, The Netherlands, 2011; pp. 199–240. [Google Scholar]
  47. Laruffa, F. What is a capability-enhancing social policy? Individual autonomy, democratic citizenship and the insufficiency of the employment-focused paradigm. J. Hum. Dev. Capab. 2020, 21, 1–16. [Google Scholar] [CrossRef]
  48. Sen, A. Inequality, unemployment and contemporary Europe. Int. Labour Rev. 1997, 136, 160–164. [Google Scholar]
  49. Chiappero-Martinetti, E.; Sabadash, A. Integrating human capital and human capabilities in understanding the value of education. In The Capability Approach; Ibrahim, S., Tiwari, M., Eds.; Palgrave Macmillan: London, UK, 2014; pp. 206–230. [Google Scholar]
  50. Ravallion, M.; Chen, S. Measuring pro-poor growth. Econ. Lett. 2003, 78, 93–99. [Google Scholar] [CrossRef]
  51. Klasen, S.; Kneib, T.; Bue, M.; Prete, V. What’s behind pro-poor growth? An investigation of its drivers and dynamics. J. Econ. Inequal. 2024, 23, 43–69. [Google Scholar] [CrossRef]
  52. McKinley, T. Inclusive Growth Criteria and Indicators: An Inclusive Growth Index for Diagnosis of Country Progress; ADB Sustainable Development Working Paper Series No. 14; Asian Development Bank: Metro Manila, Philippines, 2010. [Google Scholar]
  53. Anand, R.; Mishra, S.; Peiris, S.J. Inclusive Growth: Measurement and Determinants; The Economic Premise Note Series No. 122; The World Bank: Washington, DC, USA, 2013. [Google Scholar]
  54. James, C.; Devaux, M.; Sassi, F. Inclusive Growth and Health; OECD Health Working Paper No. 103; OECD Publishing: Paris, France, 2017. [Google Scholar] [CrossRef]
  55. Samans, R.; Blanke, J.; Corrigan, G.; Hanouz, M. The Inclusive Growth and Development Report 2017; World Economic Forum: Geneva, Switzerland, 2017. [Google Scholar]
  56. European Commission. Europe 2020: A Strategy for Smart, Sustainable, and Inclusive Growth; European Commission: Brussels, Belgium, 2020. [Google Scholar]
  57. World Bank. Inclusive Growth at a Crossroads. Part One of Strengthening Inclusion and Facilitating the Green Transition; The World Bank: Washington, DC, USA, 2021. [Google Scholar]
  58. Hay, C.; Hunt, T.; McGregor, J.A. Inclusive growth: The challenges of multidimensionality and multilateralism. Camb. Rev. Int. Aff. 2022, 35, 888–914. [Google Scholar] [CrossRef]
  59. Mitra, A.; Das, D. Inclusive growth: Economics as if people mattered. Glob. Bus. Rev. 2018, 19, 756–770. [Google Scholar] [CrossRef]
  60. UNCTAD. Stark Contrast in Inclusive Growth: Progress Towards Equal Opportunities Needed Everywhere; SDG Pulse; 2022. Available online: https://sdgpulse.unctad.org/inclusive-growth/ (accessed on 15 November 2024).
  61. Pritchett, L. Where has all the education gone? World Bank Econ. Rev. 2001, 15, 367–391. Available online: https://openknowledge.worldbank.org/handle/10986/17434 (accessed on 15 November 2024). [CrossRef]
  62. Sunde, U.; Vischer, T. Human capital and growth: Specification matters. Economica 2015, 82, 368–390. [Google Scholar] [CrossRef]
  63. Atiq-ur-Rehman Rauf, A.; Khan, G. Human capital-growth nexus: The skill mismatch. Intellect. Econ. 2021, 15, 15–30. [Google Scholar] [CrossRef]
  64. Kampelmann, S.; Mahy, B.; Rycx, F.; Vermeylen, G. Over-, required, and undereducation: Consequences on the bottom lines of Firms. Labour 2020, 34, 80–112. [Google Scholar] [CrossRef]
  65. McGuinness, S.; Sloane, P.J. Labour market mismatch among UK graduates: An analysis using Reflex data. Econ. Educ. Rev. 2011, 30, 130–145. [Google Scholar] [CrossRef]
  66. Muñoz de Bustillo Llorente, R.; Sarkar, S.; Sebastian, R.; Antón, J.-I. Education mismatch in Europe at the turn of the century: Measurement, intensity and evolution. Int. J. Manpow. 2018, 39, 977–995. [Google Scholar] [CrossRef]
  67. Boll, C.; Leppin, J.S.; Schömann, K. Who Is Overeducated and Why? Probit and Dynamic Mixed Multinomial Logit Analyses of Vertical Mismatch in East and West Germany; Papers on Multidisciplinary Panel Data Research, No. 661; SOEP: Berlin, Germany, 2014. [Google Scholar]
  68. Cedefop. Setting Europe on Course for a Human Digital Transition: New Evidence from Cedefop’s Second European Skills and Jobs Survey; Cedefop Reference Series No. 123; Publications Office of the European Union: Luxembourg, 2022; Available online: https://www.cedefop.europa.eu/cs/publications/3092 (accessed on 15 November 2024).
  69. Flisi, S.; Goglio, V.; Meroni, E.C.; Rodrigues, M.; Vera-Toscano, E. Measuring occupational mismatch: Overeducation and overskill in Europe—Evidence from PIAAC. Soc. Indic. Res. 2017, 131, 1211–1249. [Google Scholar] [CrossRef]
  70. Capsada-Munsech, Q. Measuring overeducation: Incidence, correlation and overlaps across indicators and countries. Soc. Indic. Res. 2019, 145, 279–301. [Google Scholar] [CrossRef]
  71. Stiglitz, J.E.; Sen, A.; Fitoussi, J.-P. Mismeasuring Our Lives. Why GDP Doesn’t Add Up? The Report by the Commission on the Measurement of Economic Performance and Social Progress; The New Press: London, UK, 2010. [Google Scholar]
  72. Chancel, L.; Thiry, G.; Demailly, D. Beyond-GDP Indicators: To What End? Study N 04/14; IDDRI: Paris, France, 2014; Available online: https://www.iddri.org/sites/default/files/import/publications/st0414en.pdf (accessed on 15 November 2024).
  73. Biggeri, M.; Mauro, V. Towards a more ‘Sustainable’ Human Development Index: Integrating the environment and freedom. Ecol. Indic. 2018, 91, 220–231. [Google Scholar] [CrossRef]
  74. Hoekstra, R. Replacing GDP by 2030: Towards a Common Language for the Well-Being and Sustainability Community; Cambridge University Press: Cambridge, UK, 2019. [Google Scholar]
  75. UNDP. Human Development Report, The Real Wealth of Nations: Pathways to Human Development; Palgrave Macmillan: New York, NY, USA, 2010. [Google Scholar]
  76. Jeliazkova, M. The Polarized Bulgarian Society: Persistent Poverty and Toxic Inequalities; Polis Publishers: Sofia, Bulgaria, 2024. (In Bulgarian) [Google Scholar]
  77. Alkire, S.; Santos, M.E. Poverty and inequality measurement. In An Introduction to Human Development and Capability Approach: Freedom and Agency; Deneulin, S., Shanani, L., Eds.; Earthscan: London, UK; Steling, UK, 2009; pp. 121–161. [Google Scholar]
  78. Evans, J.D. Straightforward Statistics for the Behavioral Sciences; Brooks/Cole Publishing: Pacific Grove, CA, USA, 1996. [Google Scholar]
  79. Salkind, N.J. Statistics for People Who (Think They) Hate Statistics, 4th ed.; Sage: London, UK, 2011. [Google Scholar]
  80. Anand, P.; Jones, S.; Donoghue, M.; Teitler, J. Non-monetary poverty and deprivation: A capability approach. J. Eur. Soc. Policy 2021, 31, 78–91. [Google Scholar] [CrossRef]
Figure 1. Relationship between vertical educational match among people aged 25–64 who have paid work (%) and Gini coefficient as of 2023 for 22 countries. Source: Own calculations based on ESS Round 11, weighted data (dweight) [16] and Eurostat, Data code: ilc_di12 [Accessed on 11 April 2025]. Note: There were missing data for 2023 for this indicator in Iceland and the United Kingdom.
Societies 15 00113 g001
Figure 2. Relationship between vertical educational match among people aged 25–64 who have paid work (%) and persons at risk of poverty or social exclusion (%) as of 2023 for 22 countries. Source: Own calculations based on ESS Round 11, weighted data (dweight) [16] and Eurostat, Data code: ilc_peps01n [Accessed on 11 April 2025]. Note: There were missing data for 2023 for this indicator in Iceland and the United Kingdom.
Societies 15 00113 g002
Figure 3. Relationship between vertical educational match among people aged 25–64 who have paid work (%) and in-work at-risk-of-poverty rate as of 2023 for 22 countries. Source: Own calculations based on ESS Round 11, weighted data (dweight) [16], and Eurostat. Data code: ilc_iw01 [Accessed on 11 April 2025]. Note: There were missing data for 2023 for this indicator in Iceland and the United Kingdom.
Societies 15 00113 g003
Figure 4. Relationship between vertical-above educational mismatch among high-skilled blue-collar workers (%) and inequality-adjusted HDI as of 2022 for 24 countries. Source: Own calculations based on ESS Round 11, weighted data (dweight) [16] and UNDP [17], pp. 283–284.
Societies 15 00113 g004
Figure 5. Relationship between vertical-below educational mismatch among people aged 25–64 who have paid work (%) and in-work at-risk-of-poverty rate as of 2023 for 22 countries. Source: Own calculations based on ESS Round 11, weighted data (dweight) [16], and Eurostat. Data code: ilc_iw01 [Accessed on 11 December 2025]. Note: There were missing data for the in-work at-risk-of-poverty rate in Iceland and the United Kingdom.
Societies 15 00113 g005
Figure 6. Relationship between vertical-below educational mismatch among high-skilled blue-collar workers (%) and the unemployment rate as of 2023 for 23 countries. Source: Own calculations based on ESS Round 11, weighted data (dweight) [16], and Eurostat. Data code: une_rt_a [Accessed on 11 April 2025]. Note: There were missing data for 2023 for the unemployment rate in the United Kingdom.
Societies 15 00113 g006
Figure 7. Relationship between vertical-below educational mismatch among high-skilled blue-collar workers (%) and inequality-adjusted HDI as of 2022 for 24 countries. Source: Own calculations based on ESS Round 11, weighted data (dweight) [16] and UNDP [17], pp. 283–284.
Societies 15 00113 g007
Figure 8. Relationship between vertical educational match among low-skilled blue-collar workers (%) and Gini coefficient as of 2023 for 22 countries. Source: Own calculations based on ESS Round 11, weighted data (dweight) [16] and Eurostat, Data code: ilc_di12 [Accessed on 11 April 2025]. Note: There were missing data for 2023 for this indicator in Iceland and the United Kingdom.
Societies 15 00113 g008
Disclaimer/Publisher’s Note: The statements, opinions and data contained in all publications are solely those of the individual author(s) and contributor(s) and not of MDPI and/or the editor(s). MDPI and/or the editor(s) disclaim responsibility for any injury to people or property resulting from any ideas, methods, instructions or products referred to in the content.

