Article

An Asset-Based Perspective of the Economic Contributions of Latinx Communities: An Illinois Case Study

1
Department of City and Metropolitan Planning, University of Utah, Salt Lake City, UT 84102, USA
2
Innovation and Technology, The Conference Board of Canada, Ottawa, ON K1H 8M7, Canada
*
Author to whom correspondence should be addressed.
Societies 2020, 10(3), 59; https://doi.org/10.3390/soc10030059
Submission received: 20 June 2020 / Revised: 22 July 2020 / Accepted: 27 July 2020 / Published: 29 July 2020

Abstract

:
The study aims to measure Latinx share of economic activities and highlight and its increasing role in the economic future of their state. As a methodology we use input-output model-based IMPLAN to calculate the economic footprint of Latinx in Illinois. We demonstrate how this labor force has allowed the state to expand production and purchasing power. In the conclusion we discuss how this line of investigation allows us to explore what decision makers can do to facilitate a Latinx action agenda from the asset-based perspective.

1. Introduction

An asset-based approach concentrates on the contributions of individuals to their communities [1]. The approach stands in opposition of a needs approach—which focuses in “what is wrong” as opposed to “what is right” [2]. A needs approach would often create a “needs map” that tends to rely only on the observation of metrics that relate to poverty, unemployment, and other negative characteristics about a community or a group of people, highlighting their “deficiencies” [3]. Meanwhile, an asset-based approach would create an “asset map” where the assets, skills, and contributions of individuals and groups are highlighted [4]. These might include, for example, how much employees produce, their buying power, how many businesses have been started, and so on. Ultimately, an asset-based approach is about improving upon individuals and communities’ “gifts” as opposed to concentrating on their “deficiencies” [5].
According to the Latino Policy Forum (LPF), analysis of the U.S. Census data, Illinois has 2.2 million Latinx—which is the gender-neutral version of Latino/Latina or people with direct or indirect roots in Latin America [6]. Latinx in Illinois account for 17% of the total population of the state [7]. The LPF also reports that Illinois has the 10th largest Latinx population in the U.S. and that about 100% of the state growth is being driven by Latinx. Furthermore, although, immigration is a contributing factor behind this growth, about 70% of the Latinx increase is from U.S. born Latinos rather than foreign-born migrants [8]. One of the most important demographic trends to note is that since the 1990’s more and more Latinos have been passing by, or moving out of the City of Chicago, and settling in its surrounding suburban counties of Illinois [9]. The growth of Latinx in suburban areas of the state has been unwelcomed by residents and policymakers in these communities who have engaged in a number of discriminatory practices in housing, schooling, and work—becoming a concern to the Governor and decision makers at the state level [10].
Given the national discourses about how the growth of Latinx could be of detriment to states, in the form of high poverty rates and social service dependency—such as public housing and food stamps—this article seeks to understand the asset and contributions of Latinx [11]. The article is geared primarily to researchers, policymakers, and decision makers involved in understanding how the growth of Latinx is affecting their communities. The article was born from a larger study commissioned by the Illinois Latino Family Commission (ILFC). In this particular study the ILFC wanted researchers to communicate the value that Latinx added to the Illinois economy. Put simply, policymakers from the ILFC wanted to debunk the idea that Latinx were only consumers of social services but not contributors.
Besides discussing needs of this ethnic group, it highlights the extent to which Latinx are already contributing to economies of cities, regions, and states in which they live [12]. Taken as a whole, the approach is one that is driven by the need and want of improving equity, inclusion, and diversity nationally/internationally [13]. This case study is focusing on Illinois and more broadly the U.S. but it should be also applicable to the many immigrant groups that are moving to Canada, Sweden, and Australia.
Studies have shown the relationship between population growth in industrialized countries and economic growth [14]. Since Latinx drive population growth in the U.S. and the state of Illinois, this research study seeks to answer: first, what are their characteristics and second, what is their economic footprint? We use the most current employment data available by the U.S. Census Bureau’s Longitudinal Employer-Household Dynamics Program. This program lists employment by North American Industry Classification System (NAICS) codes by race and ethnicity at the state level to answer these questions from an asset-based approach. In addition, we gather data from the U.S. Census, the American Community Survey, the National Agricultural Workers Survey and other reliable public data sources.
In this study we find that Latinx are a significant asset in a broad and diverse range of occupations and industries in Illinois. According to the Bureau of Labor Statistics, as of 2011 Latinx represented 15% of the U.S. labor force, at nearly 25 million workers [15]. In Illinois about a million (943,267) of Latinx are in the labor force [15]. Latinx represented in Illinois 15% of all laborers in the economy; 72% of all Latinx were in the labor force, which is higher than any of the other states analyzed for comparison purposes (California, Texas, Florida, New York, Arizona, New Jersey, Colorado and New Mexico) [15]. That being said, Illinois is an interesting case study to understand the economic contributions of Latinx, their economic characteristics as well as the issues that policymakers should consider in order to understand the contributions of this group.
The methodological approach we adopt using an asset-based approach allows us to produce a picture of the ways in which this increasing Latinx employment is distributed by sector, their share of the state economy, as well as the Latinx relative sectoral concentration—specifically, industries in which Latinx are highly represented. To this end, we take a two-part analytical approach. First, in “Employment Analysis” we analyze Latinx direct share of employment and their relative industrial concentration. Second, under “Economic Multiplier of Latinx Employment” we extend our analysis beyond Latinx employment share and examine how the sectors in which Latinx are employed are economically linked with other sectors as well as their purchasing power and tax contributions. The study will provide useful recommendations for state and local policymakers in order to ensure that all segments of the Latinx population can prosper and continue to make substantial contributions to the economy.

2. Literature Review

2.1. An Asset-Based Approach

The asset-based approach was put forward by John McKnight and Jody Kretzmann at the Asset Based Community Development (ABCD) Institute as a way of focusing on the skills, capabilities, and resources that already exist within communities [1,2,3]. Contrary to conventional wisdom which tends to focus on the problems that need to be fixed and the gaps that need to be filled in communities, an ABCD orientation, looks at the glass half full, rather than half empty [1]. While local needs-based community development highlights deficits, asset-based community development focuses on refining and building on existing strengths within communities [1,2,3]. As Karl (1989) stated, “If we ask people to look for deficits, they will usually find them, and their view of the situation will be colored by this. If we ask people to look for successes, they will usually find them, and their view of the situation will be colored by this” [16].
Asset maps are used in place of needs maps that focus exclusively on the downsides of communities (for example, people who are unemployed or that have low-educational attainment) [17]. Asset maps, by contrast, focus on community assets, abilities, skills, and strengths in order to build the community’s future (for example, the number of people who started businesses and GDP generated). ABCD is based on the principles of empowerment where communities are not only viewed from the prism of what is wrong with them but also from a more holistic perspective [18]. One could recognize the problems in a community but celebrate what is working too in order to create a path forward for envisioning a better community and recognizing the building-blocks available to us as community organizers [19,20].
There are six key assets in any community: individuals, associations, institutions, physical assets, economy, and stories. This article will concentrate on the economic assets of communities. Usually, ABCD looks at the neighborhood scale. An asset map would often be created by asking questions such as which skills people have that could be transformed into a new business or that can be shared into a Timebank? This means that most studies are qualitative in nature, not quantitative. There are only a few studies that use the approach for higher geographic levels, like the state level [21,22]. Most studies are at the community level [23,24]. Until now there are few studies addressing Latinx and ABCD in the fields of urban planning [7,25,26], public health [27], psychology [28], and social work [11]. The only topic addressed within community-based Latinx economics was entrepreneurship [11,25]. This article seeks to contribute to the literature on ABCD from a macroeconomics perspective among Latinx. The next section provides some background regarding the importance of studying Latinx communities as substantial contributors to state economics.

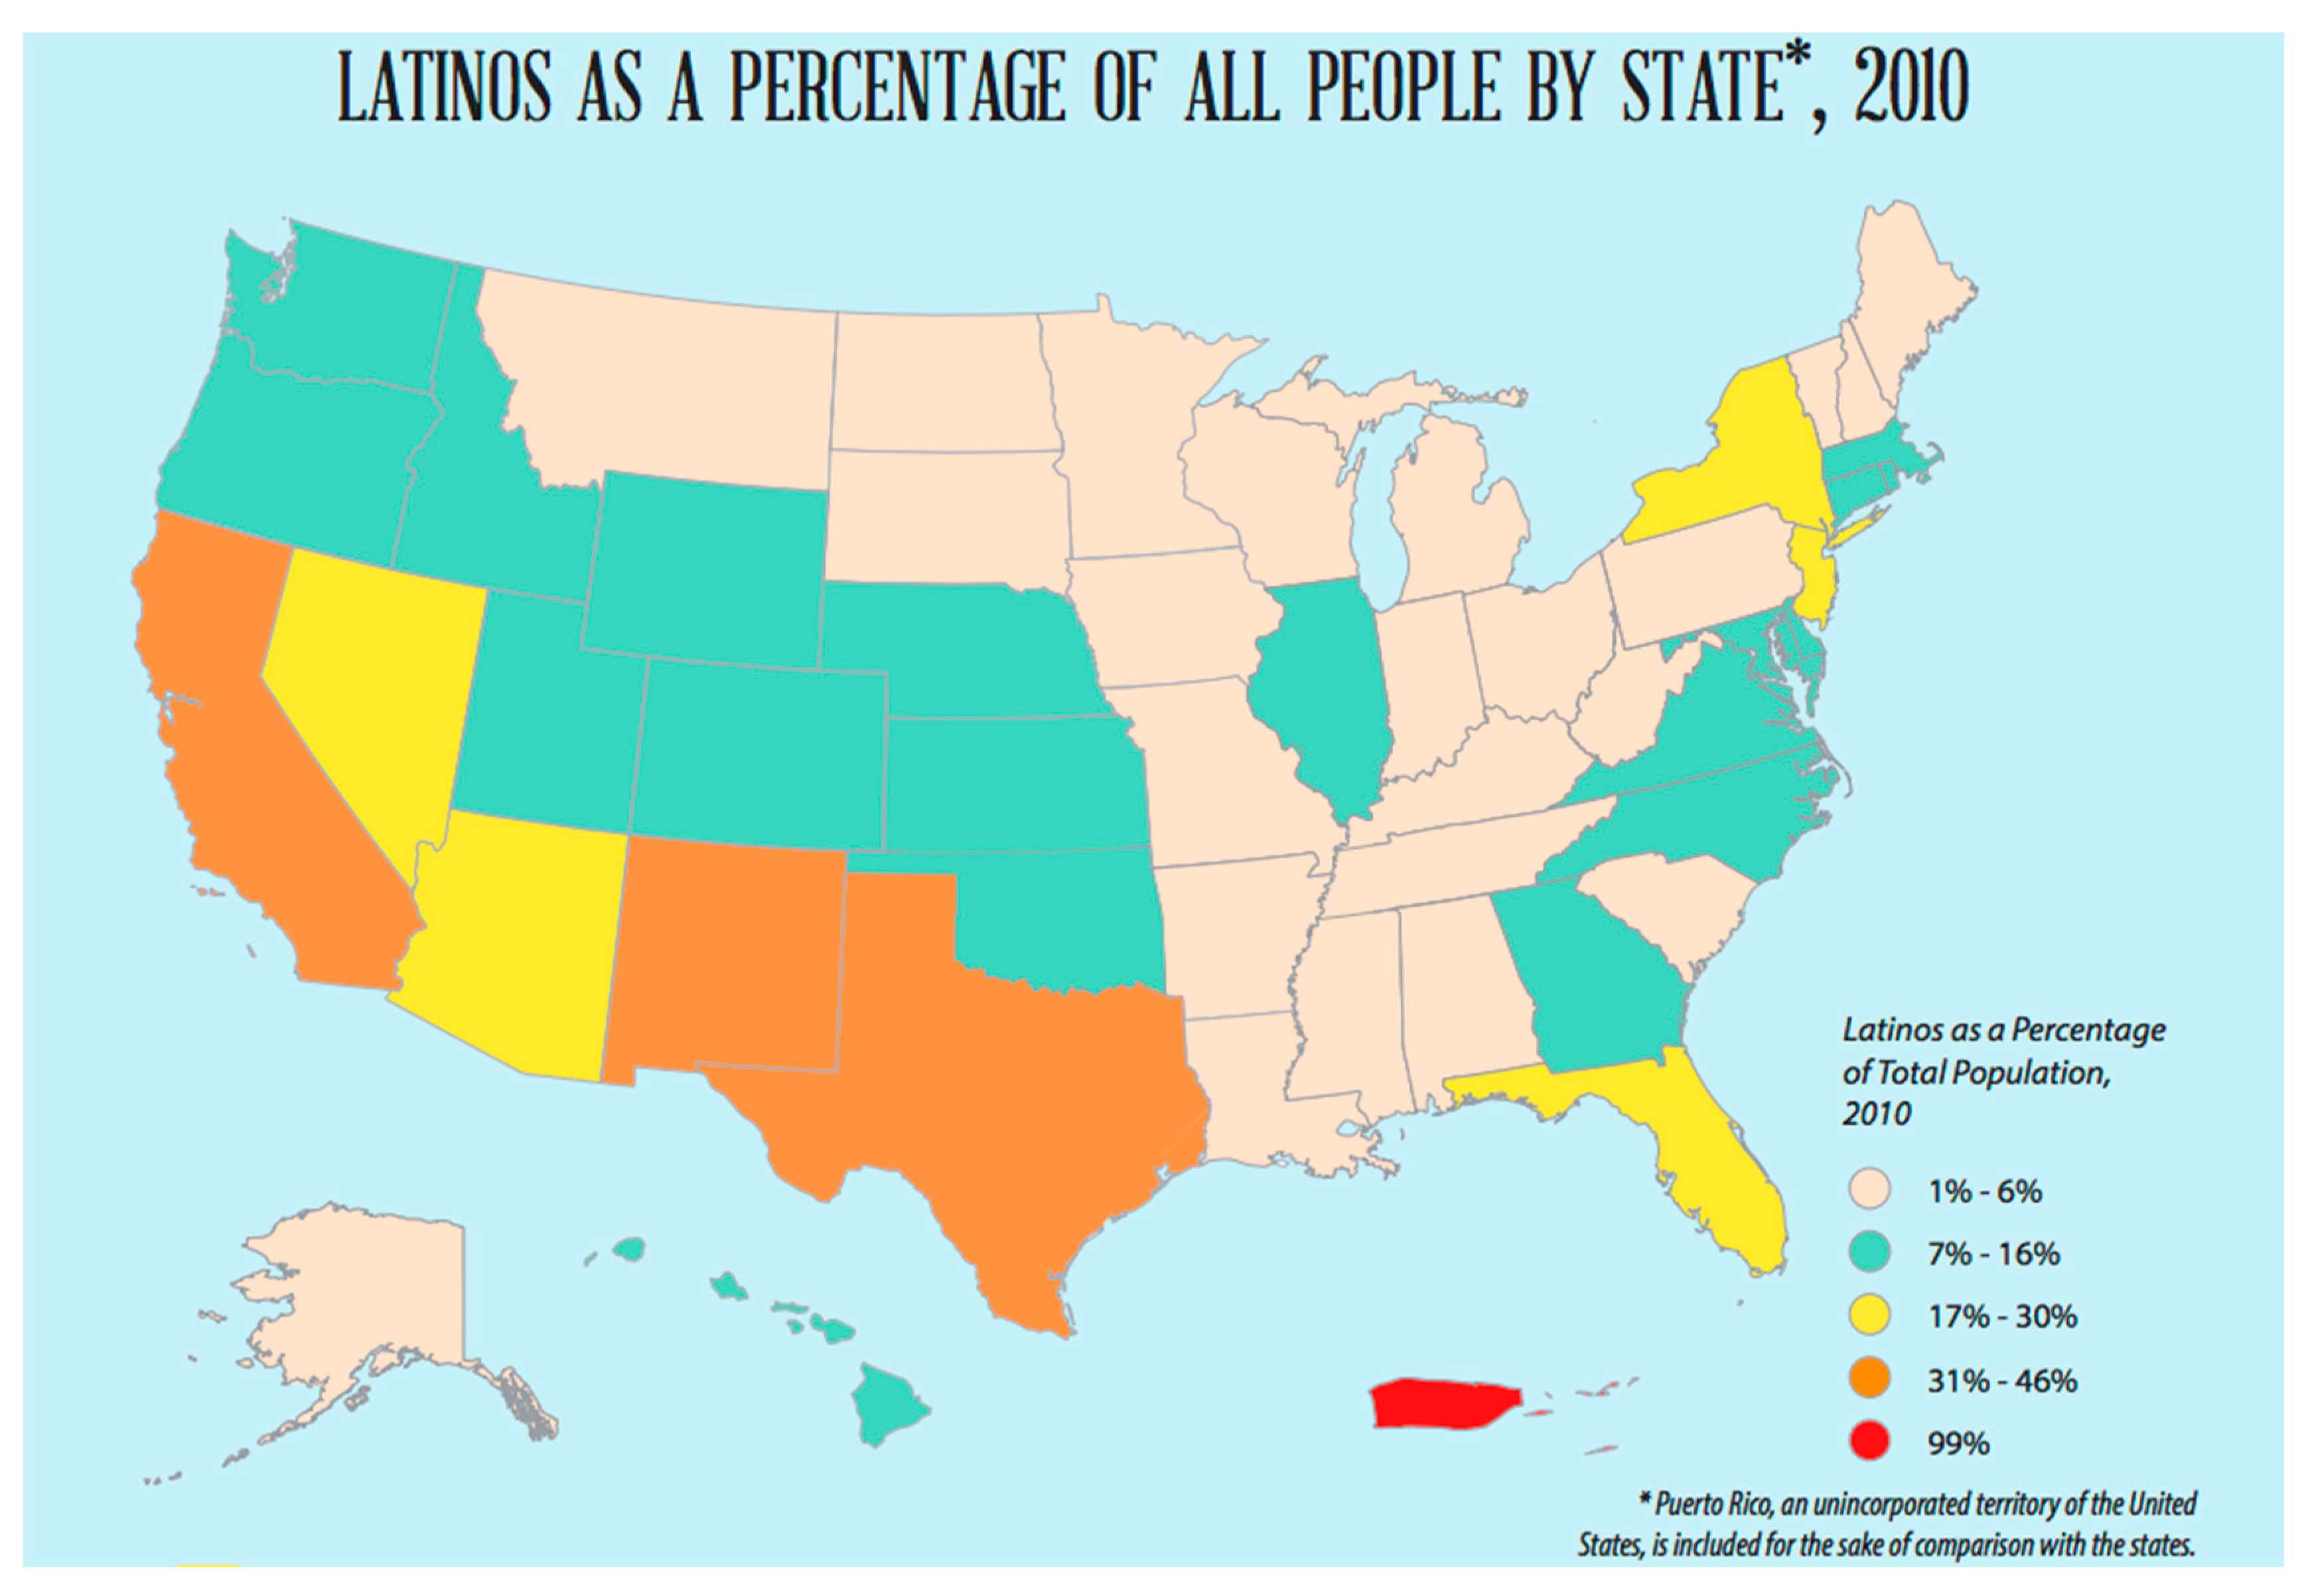
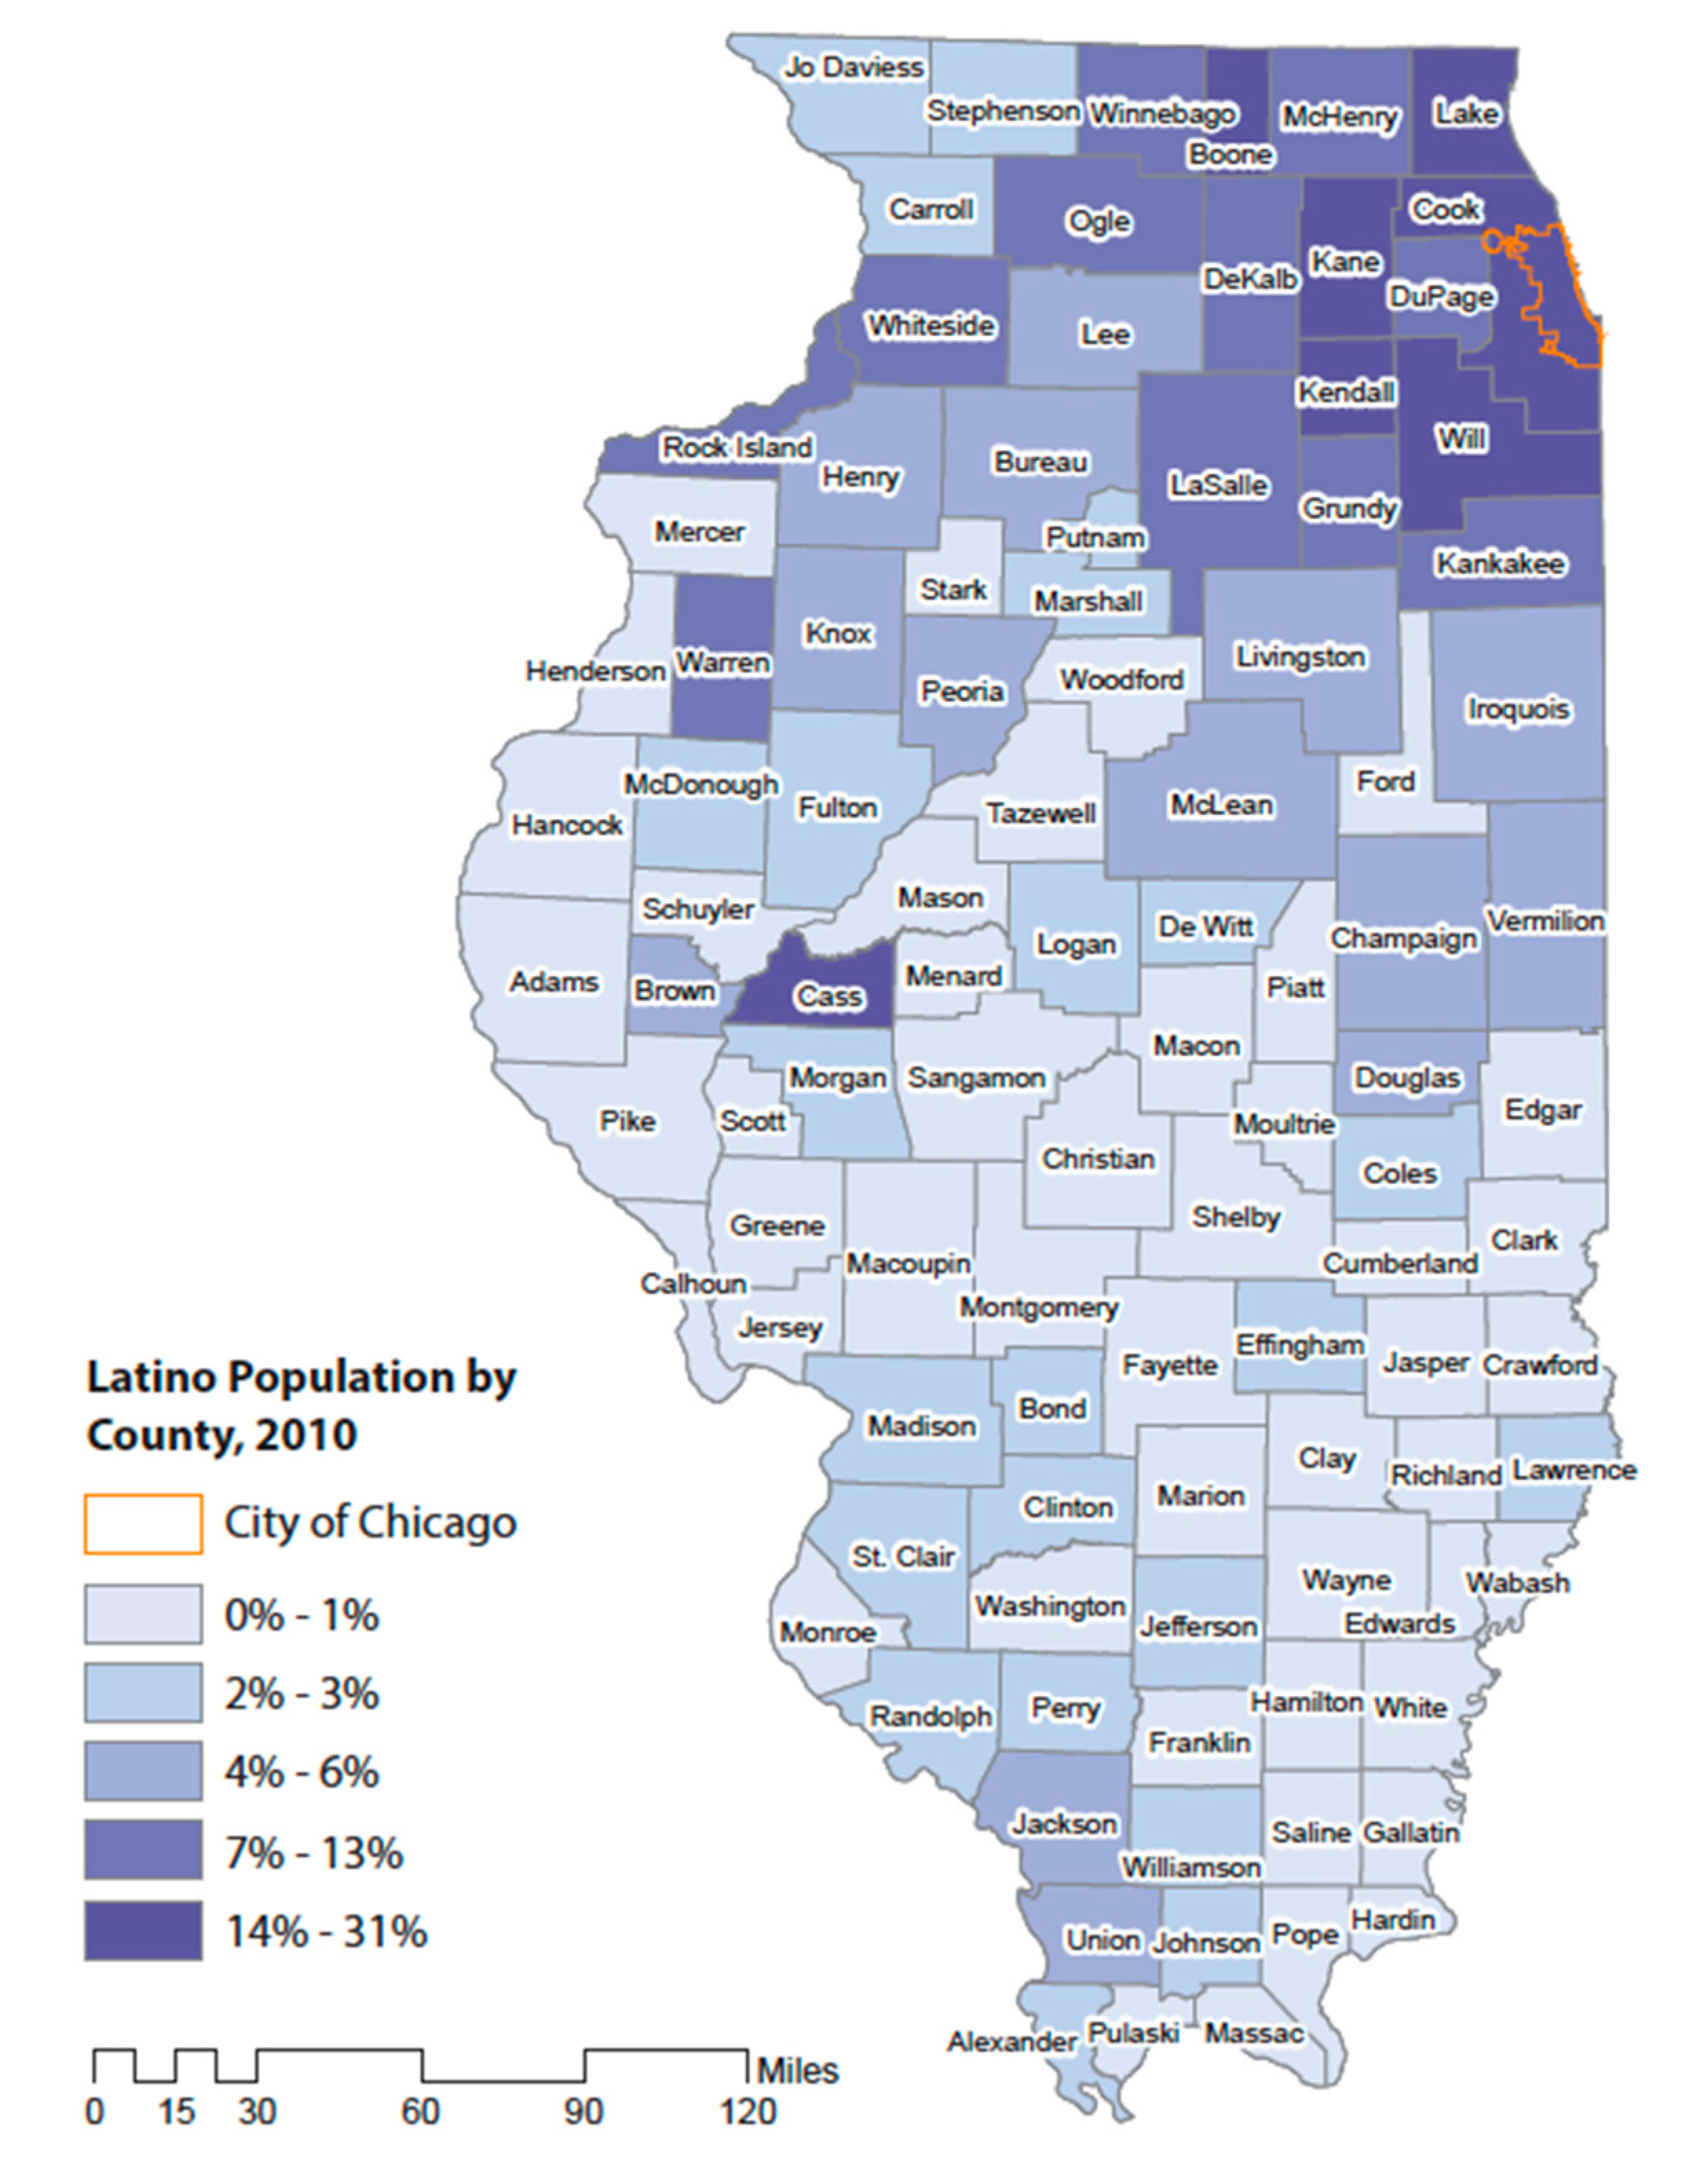
2.2. The Growth of Latinx in the State

The Latinx population grew from 9.1 to 50.5 million from 1970 to 2010, corresponding to a 455 percent change [29]. Today, roughly one out of six people in the U.S. self-identify as being of Latinx origin [30]. According to the U.S. Census, the “Hispanic or Latino” (here referred as Latinx to keep gender neutrality) ethnicity category includes a group of people from different races, whom trace the origin of their ancestors to Spanish speaking countries such as Mexico, Puerto Rico, Cuba, Spain, Central and South America [31]. The 2010 Census estimated 50.5 million Latinx in the U.S., comprising 16.3% of the total U.S. population of 308.7 million [32]. Just in the last decade, the Latinx population grew by 43%, compared to a nationwide growth rate of about 10%, comprising over half of the total nation’s population growth since 2000 [33]. Most of the population growth has been led by Latinx whom are native-born, which in 2010 constituted 70% of the entire population [14]. At 2.9 births per Latinx woman, compared to a 2.1 fertility rate for the nation, the Latinx population can be expected to increase substantially [34]. Census Bureau’s population projections indicate that by 2050, the Latinx population at least will double, making up 30% of the U.S. population [14]. Figure 1 shows the Latinx population in the United States.
According to our calculations from U.S. Census the state of Illinois (see Figure 2), with about two million Latinx, accounting for 17% of the total population of the state, has the 10 largest Latinx population in the nation [14]. In the last decade, although the state of Illinois’ total population grew by a mere 3.3%, almost all of the growth the state experienced was within its Latinx population—for example, while the total population for the state increased by 411,339 (from 12,419,293 to 12,830,632), the Latinx population increased by 497,316 (1,529,141 to 2,027,578)—accounting for nearly 100% of the state’s population growth [15]. This is not only true for the last decade, but is also true for the last three decades. From 1970 to 2010, the Latinx population in the state of Illinois grew by about 1.7 million (from 365,032 to 2,027,578); in contrast the entire population grew by 1.7 million (from 11,110,285 to 12,830,632) [15]. Latinx represent again 100% of the population growth of the state in the last three decades.

3. Methods

Although similar in its basic approach and methodological framework for quantifying immigrant and native Latinx share of economic activities, our study will differ from most of the previous studies that examined immigrants or Latinx contribution to the economy in other states [35]. First, it is beyond the scope of this article to fully calculate the net fiscal impact of immigrant Latinx in Illinois to answer the question of whether they contribute in taxes as much as they consume in social services [36]. Second, because a large portion (41%) of Latinx we are examining are foreign born, instead of impact we choose to use the term “footprint” which we believe more accurately captures and documents what we are trying to estimate [15]. Until now, few studies have investigated the economic footprint of Latinx using input-output models like IMpact Analysis for PLANning (IMPLAN) [37].

3.1. Employment Analysis

In this first section we show Latinx’ share of employment and sectoral distribution. We base the first part of our analysis on the location quotient, a common analytical technique in economic policy analysis. Location quotient (LQ) analysis compares industries in a local economy to a reference economy (typically the nation or the state) to identify sectors in which the local economy is specialized. Specifically, industries that account for a greater share of employment locally than they do nationally are assumed to be industries of local specialization. Location quotients are calculated by dividing the percentage of those employed locally in a sector by the percentage of those employed in the same sector nationally.
The interpretation of the LQ results is relatively straightforward. If a LQ for an industry is greater than one, the area is specialized in that industry, because industries in the area are producing more than local needs and assumed to be exporting. When the LQ is less than one, the local area most likely imports goods and/or services. For example, manufacturing accounted for 8.7% of the U.S. economy in 20019 [38]. A state in which manufacturing accounts for 8.7% of total employment has a LQ of one—it has precisely the same share of manufacturing employment as the nation. A state in which manufacturing accounted for 17.4% of total employment would have a LQ of two (that is, 17.4/8.7), meaning that it is twice as specialized in manufacturing as the typical state or the nation on average. For example, with 2.05 the state of Indiana has the highest manufacturing LQ of all states in 2018 [39]. And, the state recorded $38.14 billion in manufactured goods exports in 2018, the latest year for which the export data is available [40].
By contrast, a state in which manufacturing only accounts for 4.35% of total employment has a LQ of 0.5, meaning it is 50% less specialized in the industry than would be expected. Industries with a LQ of greater than one is considered to constitute the area’s economic base. These seemingly simple observations become an important starting point for investigating level of labor specialization as well as teasing out an industry’s fortunes, potential and barriers to expansion. In this study, we revise this original LQ formula by replacing local employment with Latinx employment in the numerator. The new equation allows us to determine industries in which Latinx employees are concentrated compared with other employees. The premise of this analysis is that industries with high LQs (greater than one) are the industries for which Latinx presence is critical.

3.2. Economic Multiplier of Latinx Employment

To estimate the larger footprint of Latinx, we rely on economic impact modeling. Note that, we use economic impact modeling in a non-conventional fashion in this study. In a conventional economic modeling, which necessarily intends to estimate net contribution to the state economy, the direct impact is supposed to be spending or investment originating from private sector or non-state government. Here, our purpose is to show the extent of Latinx’ integration into the state economy by quantifying employment, labor income and economic output impact of their employment and household expenditure. Economic impact models provide detailed information on the flows of goods and services between industries and jurisdictions. Consequently, it enables us to trace the ways in which spending ripples through a local economy. Using the detailed economic impact model from IMPLAN (IMpact Analysis for PLANning) Group, we were able to trace spending impacts of each sector in which Latinx are employed and the goods and services they purchase through their household expenditure. To better understand the results based on impact analysis, it is useful to inform readers about the basics of the modeling.
IMPLAN is a widely used impact analysis program based on a regional input-output model [41,42,43]. At the heart of the model is a matrix of dollar flows called the Social Accounting Matrix (SAM) that is estimated from a combination of national benchmark input-output data and regional information. This matrix accounts for all the dollar flows among different sectors of the regional economy. Unlike some other input-output models which represent only the purchasing relationships between industry and household sectors, the SAM in IMPLAN includes the economic relationships among government, industry and household sectors, allowing the modeling of transfer payments such as unemployment insurance.
Using this information, the IMPLAN software models the way a dollar injected into one sector is spent and then circulated through other sectors of the economy, generating waves of economic activity, or so-called “economic multiplier” effects (described below). The model generates a series of multipliers that, in aggregate, describe the economic repercussions of the original activity. For direct events entered in the form of employment, IMPLAN applies estimates of the average output and compensation per worker to translate the direct effects into monetary value figures. It then applies the value of an event to local and national sector-specific production functions and traces these values through subsequent cycles of transactions and payments to estimate the indirect and induced impacts. During each of these cycles, the procedure removes expenditures to government, savings and extra-local purchases, so that the results reflect only those transactions that impact the local economy (state economy in this case).
  • Direct impact denotes the dollar value of Latinx employment by industry. For each employee in each sector, the model computes the total estimated value of industrial output.
  • Indirect impact denotes the associated industrial activity at local firms that supply goods and services to those industries in which Latinx are employed.
  • Induced impact denotes the industrial activity that occurs when Latinx households and households of employees of firms supplying goods and services to businesses that employ Latinx spend their paychecks. While direct and indirect impacts vary based on the types of goods and services being produced, induced impacts typically vary much less.
  • Total impact denotes the cumulative effect of direct, indirect and induced effects.
Although running the economic model is relatively straightforward, tailoring the available Latinx employment data in Illinois to fit the model’s needs required some adjustments, assumptions, calculations and other steps (e.g., sectoral matching and inflation adjustment). The process of model development consisted of the following steps:
  • Identify new events (direct impacts) to be introduced into the model: The Latinx employment is the direct impacts.
  • Identify the industry sectors affected: North American Industry Classification System (NAICS) industry sectors in which Latinx are employed were found and all were allocated to appropriate IMPLAN industry codes.
We utilized 2018 IMPLAN data to construct the input-output model. We did not see a need to change regional purchase coefficients assumed by the model. One of the limitations of this study is that it undercounts unauthorized immigrants. In the U.S. there are about 40 million immigrants total and about 10.5 million (about 23% of the population) are unauthorized [44]. One quarter of unauthorized immigrants were from Mexico alone, followed by China, India, Philippines, and El Salvador [14]. The Center for Migration Studies estimates that there are approximately 342,000 unauthorized migrants from Mexico, Central America, and South America in Illinois between 2012–2016 according to the 5-years American Community Survey estimates [45]. Contrary to common belief, most of this population is counted in the U.S. Census, but anywhere between 5–15% is undercount, according to Pew Research Center [46].

4. Findings

4.1. Employment Analysis

The total employment in Illinois in 2018 is around 5.9 million and the Latinx share of this employment is approximately 0.9 million, approximately 14.9%1. Table 1 displays top ten industries with largest absolute concentration of Latinx and their corresponding share in total Latinx employment. Given that there are 300 sectors with some Latinx employment in Illinois, around a third of all Latinx are working in ten sectors, suggesting that Latinx are over-represented in some industries.
Although figures above give overall picture of the sectors that employ the most Latinx, such employment distribution might just reflect the distribution of employment in Illinois in general. In order to find out industries in which Latinx have a larger presence, we need to examine the relative shares of Latinx that is, how likely Latinx are employed in some sectors compared with other groups. The analytical technique (LQ) discussed in the methodology section enables us to make exactly this precise distinction for all industries.
Illinois’s total employment in 2018 is around 5.9 million and Latinx’ share of this employment is approximately 14.9%. However, this share is not distributed evenly across industries—they constitute a larger share of employment in some industries and smaller in others. For example, approximately a third of total employed in plastics product manufacturing (total employment 36,715) are Latinx (11,363) while in management, scientific and technical consulting services, their share is 9% (7,699 of 85,395 total state employment). Table 2 shows the top 10 industries with the highest concentration of Latinx employment (in industries with employment of more than 5,000 people). Total number of employees in these industries suggests that nearly 13% of Latinx are working in these sectors. LQs greater than two can be interpreted as extreme concentration of employment. For instance, in animal slaughtering and processing industry, Latinx are 2.3 times more likely to be employed than other groups, while in plastic products manufacturing they are twice more likely to be employed than other groups. Overall this industrial concentration pattern indicates that developments in these industries (growth, contraction or restructuring) would directly influence Latinx prosperity, conversely the productivity levels or even growth prospects for these industries are directly related to the education and productivity of Latinx.
We chose to focus on industries with significant employment size (5,000 or more employees) instead of industries of any size for two reasons. First, we want to present more established trends in the economy. Because of the way LQs are computed, the values based on small employment figures might be misleading as small employment figures are relatively more sensitive to small changes in the economy, hence they might not be representing overall persistent trends we intend to observe. Second, however small they are, even if these employment figures are persistent, because of their relatively small size, it is more reasonable to focus on industries with larger employment for policy design purposes.
Table 3 displays summary results for the LQ analysis. Our classification of employment and industries into three categories is based upon the following: Industries with LQs > 1.2 are concentrated; Industries with 1.2 ≥ LQs ≥ 0.80 are evenly distributed; industries with LQs < 0.80 are de-concentrated. Although theoretically LQ figures greater than 1 implies concentration and LQ figures less than 1 implies de-concentration, practically in order for a local area or a specific group to be concentrated in an industry LQ values greater than 1.2 is commonly accepted in the economic development literature. Similarly, although LQ values less than 1 theoretically implies de-concentration, practical cut point is 0.80.
First column of Table 3 shows the Latinx employment in industries in which Latinx’ share of sectoral employment is substantially higher than their share of total employment. Approximately, half of Latinx employment (47%) is concentrated in 31% of the industries. According to the second column of the same table, more than a quarter of Latinx employment is distributed very similar to their share of total employment. That is, 26% of Latinx employees are working in industries in which their presence is equal to that of other groups. The third column shows the industries in which Latinx are underrepresented. Such industries are the largest (about 42%) suggesting that there are more than 100 industries where the Latinx presence is relatively very low. Overall, almost half of total Latinx employment is concentrated in less than one third of the sectors while the balance is distributed equally between evenly distributed and de-concentrated industries.
According to economic base theory, cities or regions with sectors that show employment concentration tend to pay higher than comparable localities due to externalities created by specialization of the labor force [47]. Theory predicts that as employment expands, more complex and sophisticated processes or services are integrated into the industry and average pay levels rise as a result of performing these new activities that require relatively high skills. Similarly, applying this logic to Latinx dominated sectors, we can investigate whether Latinx are employed in such sectors because they perform advanced tasks and/or occupy high-level positions. Wage ratios in Table 4 are average Latinx employee earnings as a proportion of average earnings in the industry. Ratios in all sectors are less than one indicating that Latinx employees earn less than other groups in many sectors of the economy. The ratio of 0.70 for the total indicates that Latinx employees earn 30 percent less than the economy average. It is beyond the scope of this study to determine whether these seemingly prevalent differences in payroll are associated with the positions of Latinx in these industries or hiring policies for Latinx. However, it is important to note that the ratios for these industries are generally larger than the ratio for all industries. This indicates some of the Latinx employment is concentrated in sectors where they earn more than the average.

4.2. Economic Multiplier of Latinx Employment

The economic footprint of Latinx is not limited to the sectors in which they are employed. Their footprint extends beyond as they make household expenditures and the industries in which they are employed demand inputs from other sectors (see Table 5). That being said in this second section, we investigate how this labor force has allowed the state to expand production and purchasing power. The Selig Center for Economic Growth estimated the disposable personal income or the total buying power of Latinx in 2009 in the state of Illinois at $42,994,645 [48]. The purchasing power of Latinx has increased by $34,170,497 in about 20 years (an increase of about 400% since 1990) and it reached about $57,428,795 in 2014. As the figure below indicates, the Latinx share of the consumer market was about 10% in 2014, accounting for almost 10 cents out of every dollar spent.
IMPLAN Table 6 presents summary results in 2018 monetary figures, not adjusted for inflation. As we noted in the first part of the study, Latinx employment accounts for around 14.9% of total state employment. Besides the direct contribution of Latinx employment, there are indirect economic impacts as industries in which Latinx are employed demand goods and services from other sectors of the economy. Additional benefits are created in the form of induced impacts as Latinx and other employees that are indirectly affected by the Latinx employment spend their wages in the wider consumer economy. The employment multiplier is 1.77, meaning that for every 100 Latinx employment in Illinois, an additional 77 jobs are supported in the state economy. The output multiplier of 2.01 indicates that for every million dollars’ worth of GDP (gross domestic product or value added) generated by NASA employees, an additional $1 million worth of GDP is sustained throughout the state economy. Finally, Latinx employment in the state is directly and indirectly attributable to nearly 12 billion dollars in tax revenues for the local and state governments in Illinois.
Besides overall impacts, it is useful to examine sectors that are influenced the most by Latinx employment and household spending (Table 7). Most economic and labor policy occurs at the industry level. Similar to results in estimating impacts of other economic events, retail and the food and drinking sectors are the most impacted sector due to the allocation of household spending for essential needs. Employment services, which we noted as the second largest employer of Latinx is the third most impacted sector. Because of differences in capital intensity, corresponding labor income and output figures are not proportional to the employment’s figures. Real estate sector is with the highest output per employee. Table 8 displays industries that are impacted the most in terms of output by Latinx employment. As mentioned above, relatively capital-intensive sectors top the list. Although the order for many of these industries would be similar for estimation of other types of impacts, restaurants, employment services, and oilseed farming sectors are unique for Latinx employment as Latinx are concentrated in these industries.

5. Discussion

We can expect that Latinx will continue to be main drivers of population growth in United States and thus, drivers of economic growth. Only a few studies have investigated the Latinx economic footprint of Latinx using IMPLAN [36]. Nonetheless, as state governments recognize that their economies depend on the contributions of Latinx, we anticipate investigations like this one becoming more common in decades to come. Specially, we believe that an asset-based approach is integral to understanding the dynamism Latinx bring to the economy of states.
This exploratory asset-based driven study has shown that the Latinx footprint is expanding in the state economy and accounting for significant share of employment in many industries. In our location quotient (LQ) analysis, we find that Latinx tend to be overrepresented in some industries (e.g., restaurants, employment services) and underrepresented in others (e.g., professional services, finance). Additionally, overall their wages tend to be lower than the average regardless of the industry in question. Accounting for about 16% of the population and 15% employment, the income generated by Latinx workers in Illinois is about 10.4% of the overall income in the state.
Although their income as a share might be lower in proportion to their employment in the state, we find that their contribution to labor-intensive sectors in the state economy is critical. In terms of their purchasing power, Latinx in Illinois account for 10 cents out of every dollar spent. Moreover, the direct contributions of Latinx in tax revenues for the local and state government amounts to approximately 13.4 percent of the state revenue. This shows a potential of sustainableconomic growth as the Latinx population grows, which is one of the strategies of an asset-based approach.

6. Conclusions and Recommendations

Asset based Community Development (ABCD) as outlined in the introduction and literature review is an international movement that tries to understand what are the gifts that people have and the local assets that they bring to their communities [1,2,3]. ABCD believes that every cultural and social group can contribute to their community by offering their gifts and skills. In this was ABCD demarginalizes people and places that historically have been left at the margins of society [1]. The ABCD framework in this economic footprint analysis has offered policymakers a narrative of how Latinx are making great contributions to the Illinois and how these contributions have a multiplier effect in the economy that would not be possible without them.
Although ABCD concentrates in gifts, it is not blind to the needs or communities and what can be done to improve them. Thus, ABCD also recognizes that more must be done by policymakers in order to combat the economic shortcomings of Latinx workers for the common good. For example, there is a wage gap among Latinx driven by their educational attainment, the types of occupations they hold and their immigration status. It is in this view that we offered some recommendations for Illinois’ local policymakers to ensure that all segments of the Latinx population can prosper and continue to make substantial contributions to the state’s economy. These recommendations are outlined in more detail in the report that authors prepared for the Illinois Latino Family Commission on the economic footprint of Latinx in Illinois [15]. First, self-employment and small microenterprises among Latinx should be strengthened by improving credit access and by connecting them with banks that would finance capital improvements. Special attention should be given to women-owned enterprises; although currently over represented when compared to other racial and ethnic groups, there is room for improvement. It is crucial to target financial resources for education and training so that small business owners can learn how to manage their finances and create business plans. Second, although the Latinx labor force is higher than for any group, it is necessary to expand job-training programs so that the workforce mismatch for Latinx workers may be narrowed in order to reduce unemployment and increase earnings. In addition, Latinx workers are underrepresented in professional occupations, which usually have higher pay, better pensions and health care benefits.
In short, Latinx are integral to the state economy in a multiplicity of ways. But besides their economic contributions the article raises issues faced by them and concerns that policy makers must consider. For instance, future research might examine the reasons behind the concentration of Latinx in some specific industries and their low representation in other sectors. Research specifically focusing on industries where Latinx occupy advanced positions is likely to prove very useful for developing policies aimed at improving Latinx employment and further integration into the state economy from as asset-based perspective.

Author Contributions

I.G. and Z.S. engaged in research design, writing, and revision. I.G. engaged more in the project management and theoretical framing while Z.S. engaged more in the data clean-up and analysis. All authors have read and agreed to the published version of the manuscript.

Funding

This research received no external funding.

Acknowledgments

We would like to acknowledge The Nathalie P. Voorhees Center for Neighborhood and Community Improvement and the Illinois Latino Family Commission.

Conflicts of Interest

The authors declare no conflict of interest.

References

  1. Kretzmann, J.P.; McKnight, J.L. Building Communities from the Inside out: A Path toward Finding and Mobilizing a Community’s Assets; The Asset-Based Community Development Institute, Institute for Policy Research, Northwestern University: Evanston, IL, USA, 1993. [Google Scholar]
  2. García, I. Asset-Based Community Development (ABCD): Core principles. In Research Handbook on Community Development; Edward Elgar Publishing: Cheltenham, UK, 2020; pp. 67–75. [Google Scholar]
  3. Green, M.; Moore, H.; O’Brien, J. ABCD: When People Care Enough to Act, 1st ed.; O’Brien, J., Ed.; Inclusion Press: Toronto, ON, Canada, 2007. [Google Scholar]
  4. Griffin, D.; Farris, A. School counselors and collaboration: Finding resources through community asset mapping. Prof. Sch. Couns. 2010, 13. [Google Scholar] [CrossRef]
  5. Arnold, L.; Gallaher, J.; Garcia, M.; Head, B.; Hutcheson, H.; Khajehei, S.; Oswald, L.; Sheng, J.; Siracuse, B.; Wedekind, M.; et al. Community Engagement Techniques; ABCD Practitioner Series; University of Utah and ABCD Institute at DePaul University: Salt Lake City, UT, USA; Chicago, IL, USA, 2019. [Google Scholar]
  6. García, I. Cultural insights for planners: Understanding the terms Hispanic, Latino, and Latinx. J. Am. Plan. Assoc. 2020, 1–10. [Google Scholar] [CrossRef]
  7. Latino Policy Forum. IMPACTO Illinois! Latino Policy Forum. Available online: https://www.latinopolicyforum.org/get-involved/impacto (accessed on 19 July 2020).
  8. Cintrón, R.; Toro-Morn, M.; García, I.; Scott, E. 60 Years of Migration: Puerto Ricans in Chicagoland; Prepared for the Puerto Rican Agenda; Nathalie P. Voorhees Center for Neighborhood and Community Improvement at the College of Urban Planning and Policy (CUPPA) and University of Illinois at Chicago (UIC): Chicago, IL, USA, 2012; Available online: http://www.puertoricanchicago.org/ (accessed on 28 July 2020).
  9. García, I. Latino Demographic Profiles; Prepared for Illinois Latino Family Commission. Making the Case for Change; Nathalie, P. Voorhees Center for Neighborhood and Community Improvement at the College of Urban Planning and Policy (CUPPPA) and University of Illinois at Chicago (UIC): Chicago, IL, USA, 2014; Available online: https://doi.org/10.13140/RG.2.2.15481.21608 (accessed on 28 July 2020).
  10. Born, A. Open to All? Different Cultures, Same Communities; Voorhees Center and Interfaith Housing Center of the Northern Suburbs: Chicago, IL, USA, 2011; Available online: https://voorheescenter.red.uic.edu/wp-content/uploads/sites/122/2017/10/2011-Open-to-All-Different-cultures-same-communities.pdf (accessed on 28 July 2020).
  11. Delgado, M. Social Work with Latinos: A Cultural Assets Paradigm; Oxford University Press: New York, NY, USA, 2007. [Google Scholar]
  12. González, E.; Romero, C.S.; Urzua, A.S.; Luévano, S.C. The grassroots and new urbanism: A case from a southern California Latino community. International research on placemaking and urban sustainability. J. Urban. 2012, 5, 219–239. [Google Scholar] [CrossRef]
  13. García, I. Community participation as a tool for conservation planning and historic preservation: The case of community as a campus’ (CAAC). J. Hous. Built Environ. 2018, 33, 519–537. [Google Scholar] [CrossRef]
  14. Hoekveld, J.J. Time-space relations and the differences between shrinking regions. Built Environ. 2012, 38, 179–195. [Google Scholar] [CrossRef]
  15. García, I. Making the Case for Change: Report Series; Nathalie, P. Voorhees Center for Neighborhood and Community Improvement, and the Illinois Latino Family Commission. Tampico Press: Chicago, IL, USA, 2014; Available online: https://www.voorheescenter.com/publications (accessed on 28 July 2020).
  16. Kral, R. Strategies That Work: Techniques for Solutions in the Schools; Brieg Family Therapy Center: Milwaukee, WI, USA, 1989; p. 32. [Google Scholar]
  17. Duncan, D. Asset Mapping Toolkit Eight Steps to Increase Residential Engagement; Clear Impact: Florida, FL, USA, 2016; Available online: https://resources.depaul.edu/abcd-institute/resources/Documents/D.%20Duncan%20Asset%20Mapping%20Toolkit%20Eight%20Steps%20to%20Increase%20Residential%20Engagement.pdf (accessed on 28 July 2020).
  18. McKnight, J. Asset Mapping in Communities. In Health Assets in a Global Context: Theory, Methods, Action; Morgan, A., Davies, M., Ziglio, E., Eds.; Springer: New York, NY, USA, 2010; pp. 59–76. [Google Scholar] [CrossRef]
  19. García, T.; Garfinkel-Castro, A.; Pfeiffer, D. Planning with Diverse Communities; Planning Advisory Service (PAS) Report 593; American Planning Association: Chicago, IL, USA, 2019; Available online: https://www.planning.org/publications/report/9165143/ (accessed on 28 July 2020).
  20. García, I. Symbolism, collective identity, and community development. Societies 2018, 8, 81. [Google Scholar] [CrossRef] [Green Version]
  21. García, I. The two-income debt trap: Personal responsibility and the financialization of every day life. Special Issue Neoliberalism and Social Reproduction. Polygr. Int. J. Cult. Polit. 2019, 13, 31–49. Available online: https://polygraphjournal.files.wordpress.com/2019/02/polygraph-27_garcia.pdf (accessed on 28 July 2020).
  22. Baker, D. The Conservative Nanny State: How the Wealthy Use the Government to Stay Rich and Get Richer; LULU: Washington, DC, USA, 2006. [Google Scholar]
  23. García, I. Repurposing a historic school building as a teacher’s village: Exploring the connection between school closures, housing affordability, and community goals in a gentrifying neighborhood. J. Urban. Int. Res. Placemaking Urban. Sustain. 2019, 13, 153–169. [Google Scholar] [CrossRef]
  24. García, I. No Se Vende (Not for Sale): An anti-gentrification grassroots campaign of Puerto Ricans in Chicago. Am. Crít. 2020, 3, 35–61. Available online: http://ojs.unica.it/index.php/cisap/issue/view/130 (accessed on 28 July 2020).
  25. García, I.; Crookston, J. Connectivity and usership of two types of multi-modal transportation networks: A regional trail and a transit oriented commercial corridor. Urban. Sci. 2019, 3, 34. [Google Scholar] [CrossRef] [Green Version]
  26. García, I.; Ara, S. Active transportation and perceptions of safety: A case study of a regional trail and a transit corridor in Salt Lake City, Utah. J. Plan. Pract. Educ. 2018, 14, 37–43. Available online: http://digitalcommons.calpoly.edu/focus/vol14/iss1/14/ (accessed on 28 July 2020).
  27. Cutts, T.; Langdon, S.; Meza, F.R.; Hochwalt, R.; Pichardo-Geisinger, B.; Sowell, J.; Chapman, L.; Dorton, B.; Kennett, B.; Jones, M.T. Community Health Asset Mapping Partnership Engages Hispanic/Latino Health Seekers and Providers. N. C. Med. J. 2016, 77, 160–167. [Google Scholar] [CrossRef] [PubMed] [Green Version]
  28. Smokowski, P.R.; Bacallao, M.L. Acculturation and aggression in Latino adolescents: A structural model focusing on cultural risk factors and assets. J. Abnorm. Child Psychol. 2006, 34, 657–671. [Google Scholar] [CrossRef] [PubMed]
  29. U.S. Census Bureau. 1970 and 2010. Decennial Census. Available online: https://2020census.gov/ (accessed on 28 July 2020).
  30. Ceasar, S. Hispanic Population Tops 50 Million in U.S. Los Angeles Times. 24 March 2011. Available online: http://articles.latimes.com/2011/mar/24/nation/la-na-census-hispanic-20110325 (accessed on 28 July 2020).
  31. US Census Bureau. U.S. Census Bureau Projections Show a Slower Growing, Older, More Diverse Nation a Half Century from Now; Population-Newsroom-U.S. Census Bureau: Washington, DC, USA, 2012. Available online: https://www.census.gov/newsroom/releases/archives/population/cb12-243.html (accessed on 28 July 2020).
  32. Martinez, M.; Ariosto, D. Hispanic Population Exceeds 50 Million, Firmly Nation’s No. 2 Group. 2011. Available online: http://www.cnn.com/2011/US/03/24/census.hispanics/ (accessed on 28 July 2020).
  33. Passel, J.S.; Cohn, D.V.; Gonzalez-Barrera, A. Net Migration from Mexico Falls to Zero—and Perhaps Less; Pew Research Center’s Hispanic Trends Project (blog): Washington, DC, USA, 2012. [Google Scholar]
  34. Brown, A. U.S. Hispanic and Asian Populations Growing, but for Different Reasons; Pew Research Center (blog), 2014; Available online: http://www.pewresearch.org/fact-tank/2014/06/26/u-s-hispanic-and-asian-populations-growing-but-for-different-reasons/html (accessed on 28 July 2020).
  35. Immigration Policy Center. The Economic and Political Impact of Immigrants, Latinos and Asians State by State. 2013. Available online: http://www.immigrationpolicy.org/just-facts/economic-and-political-impact-immigrants-latinos-and-asians-state-state (accessed on 28 July 2020).
  36. Garvey, D.L.; Espenshade, T.J.; Scully, J.M. Are immigrants a drain on the public fisc? State and local impacts in New Jersey. Soc. Sci. Q. 2002, 83, 537–553. [Google Scholar]
  37. Miller, S.; Martinez, R.; Fuan, A. Measuring the Economic and Fiscal Contributions of Michigan’s Latino Population; Julian Samora Reserach Institute: East Lansing, MI, USA, 2010. [Google Scholar]
  38. U.S. Census. American Community Survey; U.S. Census, 2008. Available online: https://www.census.gov/programs-surveys/acs/data.html (accessed on 28 July 2020).
  39. Bureau of Labor Statistics. Quarterly Census of Employment and Wages 2020. Available online: https://data.bls.gov/cew/apps/table_maker/v4/table_maker.htm#type=6&year=2019&qtr=A&own=5&area=US000&supp=0 (accessed on 28 July 2020).
  40. NAM. 2019 Indiana Manufacturing Facts. 2020. Available online: https://www.nam.org/state-manufacturing-data/2019-indiana-manufacturing-facts/ (accessed on 28 July 2020).
  41. Crompton, J.L.; Lee, S.; Shuster, T.J. A Guide for Undertaking Economic Impact Studies: The Springfest Example. J. Travel Res. 2001, 40, 79–87. [Google Scholar] [CrossRef]
  42. IMPLAN. IMPLAN Pro. Analysis Guide; IMPLAN: Hunterville, NC, USA, 2004; Available online: https://blog.implan.com/understanding-implan-application-and-data (accessed on 28 July 2020).
  43. Low, S.S.; Isserman, A.M. Ethanol and the local economy: Industry trends, location factors, economic impacts, and risks. Econ. Dev. Q. 2009, 23, 71–88. [Google Scholar] [CrossRef]
  44. Passel, J.; DeVera, C. Mexicans Decline to Less than Half the U.S. Unauthorized Immigrant Population for the First Time. 2019. Available online: https://www.pewresearch.org/fact-tank/2019/06/12/us-unauthorized-immigrant-population-2017/ (accessed on 28 July 2020).
  45. Migration Policy Institute. Profile of the Unauthorized Immigrant Population: Illinois. 2017. Available online: https://www.migrationpolicy.org/data/unauthorized-immigrant-population/state/IL (accessed on 28 July 2020).
  46. Passel, J. Measuring Illegal Immigration: Pew Research Center. Available online: https://www.pewresearch.org/fact-tank/2019/07/12/how-pew-research-center-counts-unauthorized-immigrants-in-us/ (accessed on 28 July 2020).
  47. Stimson, R.J.; Stough, R.R.; Roberts, B.H. Regional Economic Development: Analysis and Planning Strategy; Springer Science & Business Media: Berlin, Germany, 2006. [Google Scholar]
  48. Humphreys, J.M. The Multicultural Economy 2012. Selig Center for Economic Growth. 2012. Available online: http://www.terry.uga.edu/media/documents/multicultural_economy_2009.pdf (accessed on 28 July 2020).
1
Year 2018 is the latest year for which employment data for four quarters by ethnicity and detailed industry levels (4-digit NAICS) are available from the U.S. Census’ Quarterly Workforce Indicators (QWI) database.
2
This sector estimates what owner/occupants would pay in rent if they rented rather than owned their homes. This sector creates an industry out of owning a home, and its production function represents the repair and maintenance of that home. Its sole product (output) is ownership and is purchased entirely by personal consumption expenditures—i.e., the household sector. There is no employment or employee compensation for this industry. Indirect business taxes for this sector are largely made up of property taxes paid by the homeowner, while other property income is the difference between the rental value of the home and the costs of home ownership. Interest payments and mortgage payments are a transfer in the SAM and are not part of the production function for this sector. This sector is included in the database to ensure consistency in the flow of funds. It captures the expenses of home ownership, such as repair and maintenance construction, various closing costs, and other expenditures related to the upkeep of the space in the same way expenses are captured for rental properties.
Figure 1. Latinx population in the United States. Source: Authors.
Societies 10 00059 g001
Figure 2. Latinx population in state of Illinois. Source: Authors.
Societies 10 00059 g002
Table 1. Top 10 Industry Sectors by the Size of Latinx Employment.
Industry SectorEmploymentShare of Total Latinx Employment
Restaurants and Other Eating Places86,8559.9%
Employment Services49,2515.6%
Elementary and Secondary Schools34,5434.0%
Services to Buildings and Dwellings28,1983.2%
General Medical and Surgical Hospitals24,2362.8%
Grocery Stores17,8282.0%
Traveler Accommodation14,1021.6%
Department Stores12,5631.4%
Warehousing and Storage12,5521.4%
Offices of Physicians12,5001.4%
Top 10 Sectors292,62833.5%
Total (all sectors)873,312100.0%
Table 2. Industries with Highest Concentration of Latinx.
Industry SectorIllinois EmploymentLatinx EmploymentShareLQ
Animal Slaughtering and Processing18,828661835.1%2.36
Converted Paper Product Manufacturing18,180608833.5%2.24
Bakeries and Tortilla Manufacturing22,575753833.4%2.24
Services to Buildings and Dwellings85,52028,19833.0%2.21
Plastics Product Manufacturing36,71511,36330.9%2.07
Traveler Accommodation51,20914,10227.5%1.85
Grocery and Related Product Merchant Wholesalers42,77411,49126.9%1.80
Special Food Services36,559908224.8%1.66
Clothing Stores36,437877524.1%1.61
Building Finishing Contractors28,532674223.6%1.58
Total5,852,376873,31214.9%-
Table 3. Relative Concentration of Latinx Employment.
ConcentratedEvenly DistributedUnconcentratedTotal
Employment410,87247.0%230,35426.4%232,08626.6%873,312
Number of Industries9530.7%8427.2%13042.1%309
Table 4. Relative Earnings for Latinx in Top 10 Industries with High Concentration of Latinx.
Industry SectorLQEmploymentWage Ratio
Animal Slaughtering and Processing2.3666180.84
Converted Paper Product Manufacturing2.2460880.78
Bakeries and Tortilla Manufacturing2.2475380.95
Services to Buildings and Dwellings2.2128,1980.95
Plastics Product Manufacturing2.0711,3630.69
Traveler Accommodation1.8514,1020.92
Grocery and Related Product Merchant Wholesalers1.8011,4910.72
Special Food Services1.6690820.91
Clothing Stores1.6187750.87
Building Finishing Contractors1.5867420.99
Total-873,3120.70
Table 5. Buying Power in Illinois for 1990, 2000, 2009, and 2014.
1990 *2000 *2009 *2014
Latinx8,824,14822,617,08642,994,64557,428,795
Total208,084,531340,995,806485,733,773582,666,550
Percent4.2%6.6%8.9%9.9%
* Adjusted for inflation to 2014 values.
Table 6. Summary Impacts.
Impact TypeEmploymentLabor Income
($ Thousands)
GDP
($ Thousands)
Output
($ Thousands)
Local & State Tax
($ Thousands)
Direct Effect873,31244,080,24669,211,940133,691,5775,491,411
Indirect Effect292,61220,436,68132,650,37359,161,2462,610,171
Induced Effect379,79320,556,21636,976,67061,156,0593,767,726
Total Effect1,545,71785,073,142138,838,983254,008,88211,869,308
Impact Multiplier1.771.932.011.902.16
Table 7. Top 10 Most Affected Sectors by Employment.
Industry SectorEmploymentLabor Income
($ Thousands)
GDP
($ Thousands)
Output
($ Thousands)
Retail165,6114,976,7528,170,40512,966,840
Restaurants and other food & drinking places158,5743,806,7825,751,5519,650,710
Employment services78,6262,754,6484,390,2216,716,835
Hospitals47,8643,326,2984,132,8407,450,676
Real estate41,4191,893,9654,841,27010,008,722
Elementary and secondary schools39,3901,266,6121,096,0761,361,686
Construction34,2672,056,2223,171,5576,562,122
Services to buildings30,014887,475917,7801,468,205
Management of companies and enterprises27,1243,353,6863,869,5865,377,372
Warehousing and storage23,3621,066,7111,226,0812,381,377
Subtotal (top 10)646,25225,389,14937,567,36663,944,545
Total1,545,71785,073,142138,838,983254,008,882
Table 8. Top 10 Most Affected Sectors by Output.
Industry SectorEmploymentLabor Income
($ Thousands)
GDP
($ Thousands)
Output
($ Thousands)
Retail165,6114,976,7528,170,40512,966,840
Real estate41,4191,893,9654,841,27010,008,722
Restaurants and other food & drinking places158,5743,806,7825,751,5519,650,710
Hospitals47,8643,326,2984,132,8407,450,676
Monetary authorities and depository credit intermediation20,7271,845,5484,630,2617,188,669
Employment services78,6262,754,6484,390,2216,716,835
Construction34,2672,056,2223,171,5576,562,122
Owner-occupied dwellings2 [45]005,089,1276,430,052
Management of companies and enterprises27,1243,353,6863,869,5865,377,372
Oilseed farming809790,9711,888,5964,741,561
Subtotal (top 10)575,02124,804,87045,935,41577,093,558
Total1,545,71785,073,142138,838,983254,008,882

