
The Between-Competition Running Demands of Elite Hurling Match-Play

 , ,
, ,  ,
,
Abstract
1. Introduction
2. Materials and Methods
2.1. Experimental Approach to the Problem
2.2. Subjects
2.3. Procedures
2.4. Statistical Analysis
3. Results
4. Discussion
5. Conclusions
Author Contributions
Funding
Institutional Review Board Statement
Informed Consent Statement
Data Availability Statement
Acknowledgments
Conflicts of Interest
References
- Beato, M.; Coratella, G.; Stiff, A.; Iacono, A.D. The validity and between-unit variability of GNSS units (STATSports Apex 10 and 18 Hz) for measuring distance and peak speed in team sports. Front. Physiol. 2018, 21, 1288. Available online: https://www.frontiersin.org/articles/10.3389/fphys.2018.01288/abstract (accessed on 26 May 2021). [CrossRef] [PubMed]
- Beato, M.; Devereux, G.; Stiff, A. Validity and Reliability of Global Positioning System Units (STATSports Viper) for Measuring Distance and Peak Speed in Sports. J. Strength Cond. Res. 2018, 32, 2831–2837. [Google Scholar] [CrossRef] [PubMed]
- Bradley, P.S.; Noakes, T.D. Match running performance fluctuations in elite soccer: Indicative of fatigue, pacing or situational influences? J. Sports Sci. 2013, 31, 1627–1638. [Google Scholar] [CrossRef]
- Brady, A.J.; Scriney, M.; Moyna, N.M.; McCarren, A. Identification of movement categories and associated velocity thresholds for elite Gaelic football and hurling referees. Int. J. Perform. Anal. Sport 2021. [Google Scholar] [CrossRef]
- Brito, Â.; Roriz, P.; Silva, P.; Duarte, R.; Garganta, J. Effects of pitch surface and playing position on external load activity profiles and technical demands of young soccer players in match play. Int. J. Perform. Anal. Sport 2017, 17, 902–918. [Google Scholar] [CrossRef]
- Caldwell, B.P.; Peters, D.M. Seasonal Variation in Physiological Fitness of a Semiprofessional Soccer Team. J. Strength Cond. Res. 2009, 23, 1370–1377. [Google Scholar] [CrossRef]
- Chambers, R.; Gabbett, T.; Solutions, G.P.; Cole, M.; Beard, A. The Use of Wearable Microsensors to Quantify Sport-Specific Movements. Sport Med. 2015, 45, 1065–1081. [Google Scholar] [CrossRef] [PubMed]
- Connor, M.; Mernagh, D.; Beato, M. Quantifying and modelling the game speed outputs of English Championship soccer players. Res. Sports Med. 2021. [Google Scholar] [CrossRef] [PubMed]
- Gabbett, T.J. Influence of Ball-in-Play Time on the Activity Profiles of Rugby League Match-Play. J. Strength Cond. Res. 2015, 29, 716–721. [Google Scholar] [CrossRef]
- Hopkins, W.G. A spreadsheet for deriving a confidence interval, mechanistic inference and clinical inference from a P value. Sportscience 2007, 11, 16–21. Available online: http://sportsci.org/ (accessed on 17 June 2021).
- Malone, S.; Keane, J.; Keogh, C.; Coratella, G.; Young, D.; Collins, K. A comparison of anthropometric and performance profiles between elite and sub-elite hurling players. Appl. Sci. 2021, 11, 954. [Google Scholar] [CrossRef]
- Maddison, R.; Ni Mhurchu, C. Global positioning system: A new opportunity in physical activity measurement. Int. J. Behav. Nutr. Phys. Act. 2009, 6, 73. [Google Scholar] [CrossRef] [PubMed]
- Malone, S.; Keane, J.; Owen, A.; Coratella, G.; Young, D.; Collins, K. The effect of a periodized small-sided games intervention in hurling on physical and physiological measures of performance. Sport Sci. Health 2021, 17, 403–413. [Google Scholar] [CrossRef]
- Malone, S.; Solan, B.; Collins, K.D.; Doran, D.A. Positional Match Running Performance in Elite Gaelic Football. J. Strength Cond. Res. 2016, 30, 2292–2298. [Google Scholar] [CrossRef] [PubMed]
- Mangan, S.; Collins, K. A Rating System For Gaelic Football Teams: Factors That Influence Success. Int. J. Comput. Sci. Sport 2016, 15, 78–90. [Google Scholar] [CrossRef][Green Version]
- Mangan, S.; Ryan, M.; Shovlin, A.; McGahan, J.; Malone, S.; O’Neill, C.; Burns, C.; Collins, K. Seasonal Changes in Gaelic Football Match-Play Running Performance. J. Strength Cond. Res. 2019, 33, 1685–1691. [Google Scholar] [CrossRef]
- McGahan, J.; Burns, C.; Lacey, S.; Gabbett, T.; O’Neil, C. Investigation in to the Positional Running Demands of Elite Gaelic Football Players: How Competition Data Can Inform Training Practice. J. Strength Cond. Res. 2020, 34, 2040–2047. [Google Scholar] [CrossRef]
- Cahill, N.; Lamb, K.; Worsfold, P.; Headey, R.; Murray, S. The movement characteristics of English Premiership rugby union players. Eur. J. Sport Sci. 2013, 31, 229–237. [Google Scholar] [CrossRef]
- McLellan, C.P.; Lovell, D.I.; Gass, G.C. Performance Analysis of Elite Rugby League Match Play Using Global Positioning Systems. J. Strength Cond. Res. 2011, 25, 1703–1710. [Google Scholar] [CrossRef]
- Mohr, M.; Krustrup, P.; Bangsbo, J. Match performance of high-standard soccer players with special reference to development of fatigue. J. Sports Sci. 2003, 21, 519–528. [Google Scholar] [CrossRef] [PubMed]
- Brien, P.O.; Martin, D.; Bradley, J. Differences in performance indicators between winners and losers in senior inter county hurling championship. Int. J. Perform. Anal. Sport 2021, 21, 630–640. [Google Scholar] [CrossRef]
- Vieira, L.H.P.; Carling, C.; Barbieri, F.A.; Aquino, R.; Santiago, P.R.P. Match Running Performance in Young Soccer Players: A Systematic Review. Sports Med. 2019, 49, 289–318. [Google Scholar] [CrossRef] [PubMed]
- Polglaze, T.; Hoppe, M.W. Metabolic Power: A Step in the Right Direction for Team Sports. Int. J. Sports Physiol. Perform. 2019, 14, 407–411. [Google Scholar] [CrossRef]
- Rampinini, E.; Coutts, A.J.; Castagna, C.; Sassi, R.; Impellizzeri, F.M. Variation in top level soccer match performance. Int. J. Sports Med. 2007, 28, 1018–1024. [Google Scholar] [CrossRef] [PubMed]
- Ritchie, D.; Hopkins, W.G.; Buchheit, M.; Cordy, J.; Bartlett, J.D. Quantification of training and competition load across a season in an elite Australian Football Club. Int. J. Sport Physiol. Perform. J. 2016, 11, 474–479. [Google Scholar] [CrossRef]
- Stone, K.J.; Hughes, M.G.; Stembridge, M.R.; Meyers, R.W.; Newcombe, D.J.; Oliver, J.L. The influence of playing surface on physiological and performance responses during and after soccer simulation. Eur. J. Sport Sci. 2014, 16, 42–49. [Google Scholar] [CrossRef]
- Suarez-Arrones, L.; Torreño, N.; Requena, B.; De Villarreal, E.S.; Casamichana, D.; Barbero-Alvarez, J.C.; Munguía-Izquierdo, D. Match-play activity proile in professional soccer players during oficial games and the relationship between external and internal load. J. Sports Med. Phys. Fit. 2015, 55, 1417–1422. Available online: https://www.scopus.com/inward/record.uri?eid=2-s2.0-84962534608&partnerID=40&md5=ffd8d6a13270367e08aac93d3f95c411 (accessed on 7 July 2021).
- Torreño, N.; Munguía-Izquierdo, D.; Coutts, A.; de Villarreal, E.S.; Asian-Clemente, J.; Suarez-Arrones, L. Relationship between external and internal load of professional soccer players during full-matches in official games using GPS and heart rate technology. Int. J. Sports Physiol. Perform. 2016, 11, 940–946. [Google Scholar] [CrossRef]
- White, A.D.; Macfarlane, N. Time-on-Pitch or Full-Game GPS Analysis Procedures for Elite Field Hockey? Int. J. Sports Physiol. Perform. 2013, 8, 549–555. [Google Scholar] [CrossRef] [PubMed][Green Version]
- Young, D.; Coratella, G.; Malone, S.; Collins, K.; Mourot, L.; Beato, M. The match-play sprint performance of elite senior hurlers during competitive games. PLoS ONE 2019, 14, e0215156. [Google Scholar] [CrossRef]
- Young, D.; Hennessy, L.; Coratella, G. The ball-in-play vs. ball-out-of-play match demands of elite senior hurling. Sport Sci. Health 2021, 17, 625–634. [Google Scholar] [CrossRef]
- Young, D.; Malone, S.; Beato, M.; Mourot, L.; Coratella, G. Identification of maximal running intensities during elite hurling match-play. J. Strength Cond. Res. 2020, 34, 2608–2617. Available online: http://insights.ovid.com/crossref?an=00124278-900000000-95276 (accessed on 9 April 2021). [CrossRef] [PubMed]
- Young, D.; Beato, M.; Mourot, L.; Coratella, G. Match-Play Temporal and Position-Specific Physical and Physiological Demands of Senior Hurlers. J. Strength Cond. Res. 2020, 34, 1759–1768. [Google Scholar] [CrossRef] [PubMed]
- Young, D.; Mourot, L.; Coratella, G. Match-play performance comparisons between elite and sub-elite hurling players. Sport Sci. Health 2018, 14, 201–208. [Google Scholar] [CrossRef]


| Performance Variable | League | Championship | Mean Difference (95% CI) | p Value | Effect Size |
|---|---|---|---|---|---|
| Total Distance (m) | 7808 ± 1234 * | 8172 ± 1003 | −325 (−422 to −229) | p < 0.001 | −0.32 (−0.72 to 0.07) |
| Relative Distance (m·min−1) | 106 ± 17 * | 110 ± 14 | −4 (−6 to −3) | p < 0.001 | −0.26 (−0.65 to 0.14) |
| High-Speed Distance (m) | 1215 ± 369 | 1253 ± 258 | −32 (−67 to 4) | p = 0.080 | −0.12 (−0.51 to 0.27) |
| Sprint Distance (m) | 362 ± 127 * | 406 ± 86 | −40 (−50 to −29) | p < 0.001 | −0.41 (−0.80 to −0.01) |
| Number of Sprints (n) | 25 ± 8 * | 36 ± 9 | −11 (−12 to −11) | p < 0.001 | −1.29 (−1.71 to 0.85) |
| Length of Sprint (m) | 15 ± 3 * | 14 ± 3 | 1 (1 to 1) | p < 0.001 | 0.33 (−0.06 to 0.73) |
| Peak Speed (km·h−1) | 30.0 ± 1.7 * | 31.3 ± 1.2 | −1.2 (−1.4 to −1.1) | p < 0.001 | −0.88 (−1.29 to −0.47) |
| Full Backs | Half Backs | Midfield | Half Forwards | Full Forwards | ||
|---|---|---|---|---|---|---|
| Total Distance (m) | Championship | 7153 ± 357 | 9150 ± 400 a | 9138 ± 512 a | 8293 ± 639 abc | 7077 ± 380 bcd |
| League | 6939 ± 713 * | 8462 ± 986 *a | 9141 ± 932 a | 8128 ± 934 *ac | 6516 ± 747 *bcd | |
| Diff (95% CI) | −214 (−15 to −413) | −688 (−865 to −511) | 3 (−272 to 278) | −166 (−352 to 21) | −561 (−786 to −337) | |
| ES | −0.38 | −0.91 | 0.01 | −0.21 | −0.95 | |
| Relative Distance (m·min−1) | Championship | 101 ± 9 | 125 ± 5 a | 123 ± 7 a | 113 ± 9 abc | 98 ± 9 bcd |
| League | 99 ± 14 | 113 ± 14 *a | 124 ± 13 a | 105 ± 14 *c | 98 ± 17 bc | |
| Diff (95% CI) | −2 (−4 to 1) | −12 (−15 to −9) | 0 (−4 to 4) | −8 (−11 to −5) | −1 (−3 to 2) | |
| ES | −0.17 | −1.14 | 0.10 | −0.68 | 0.00 | |
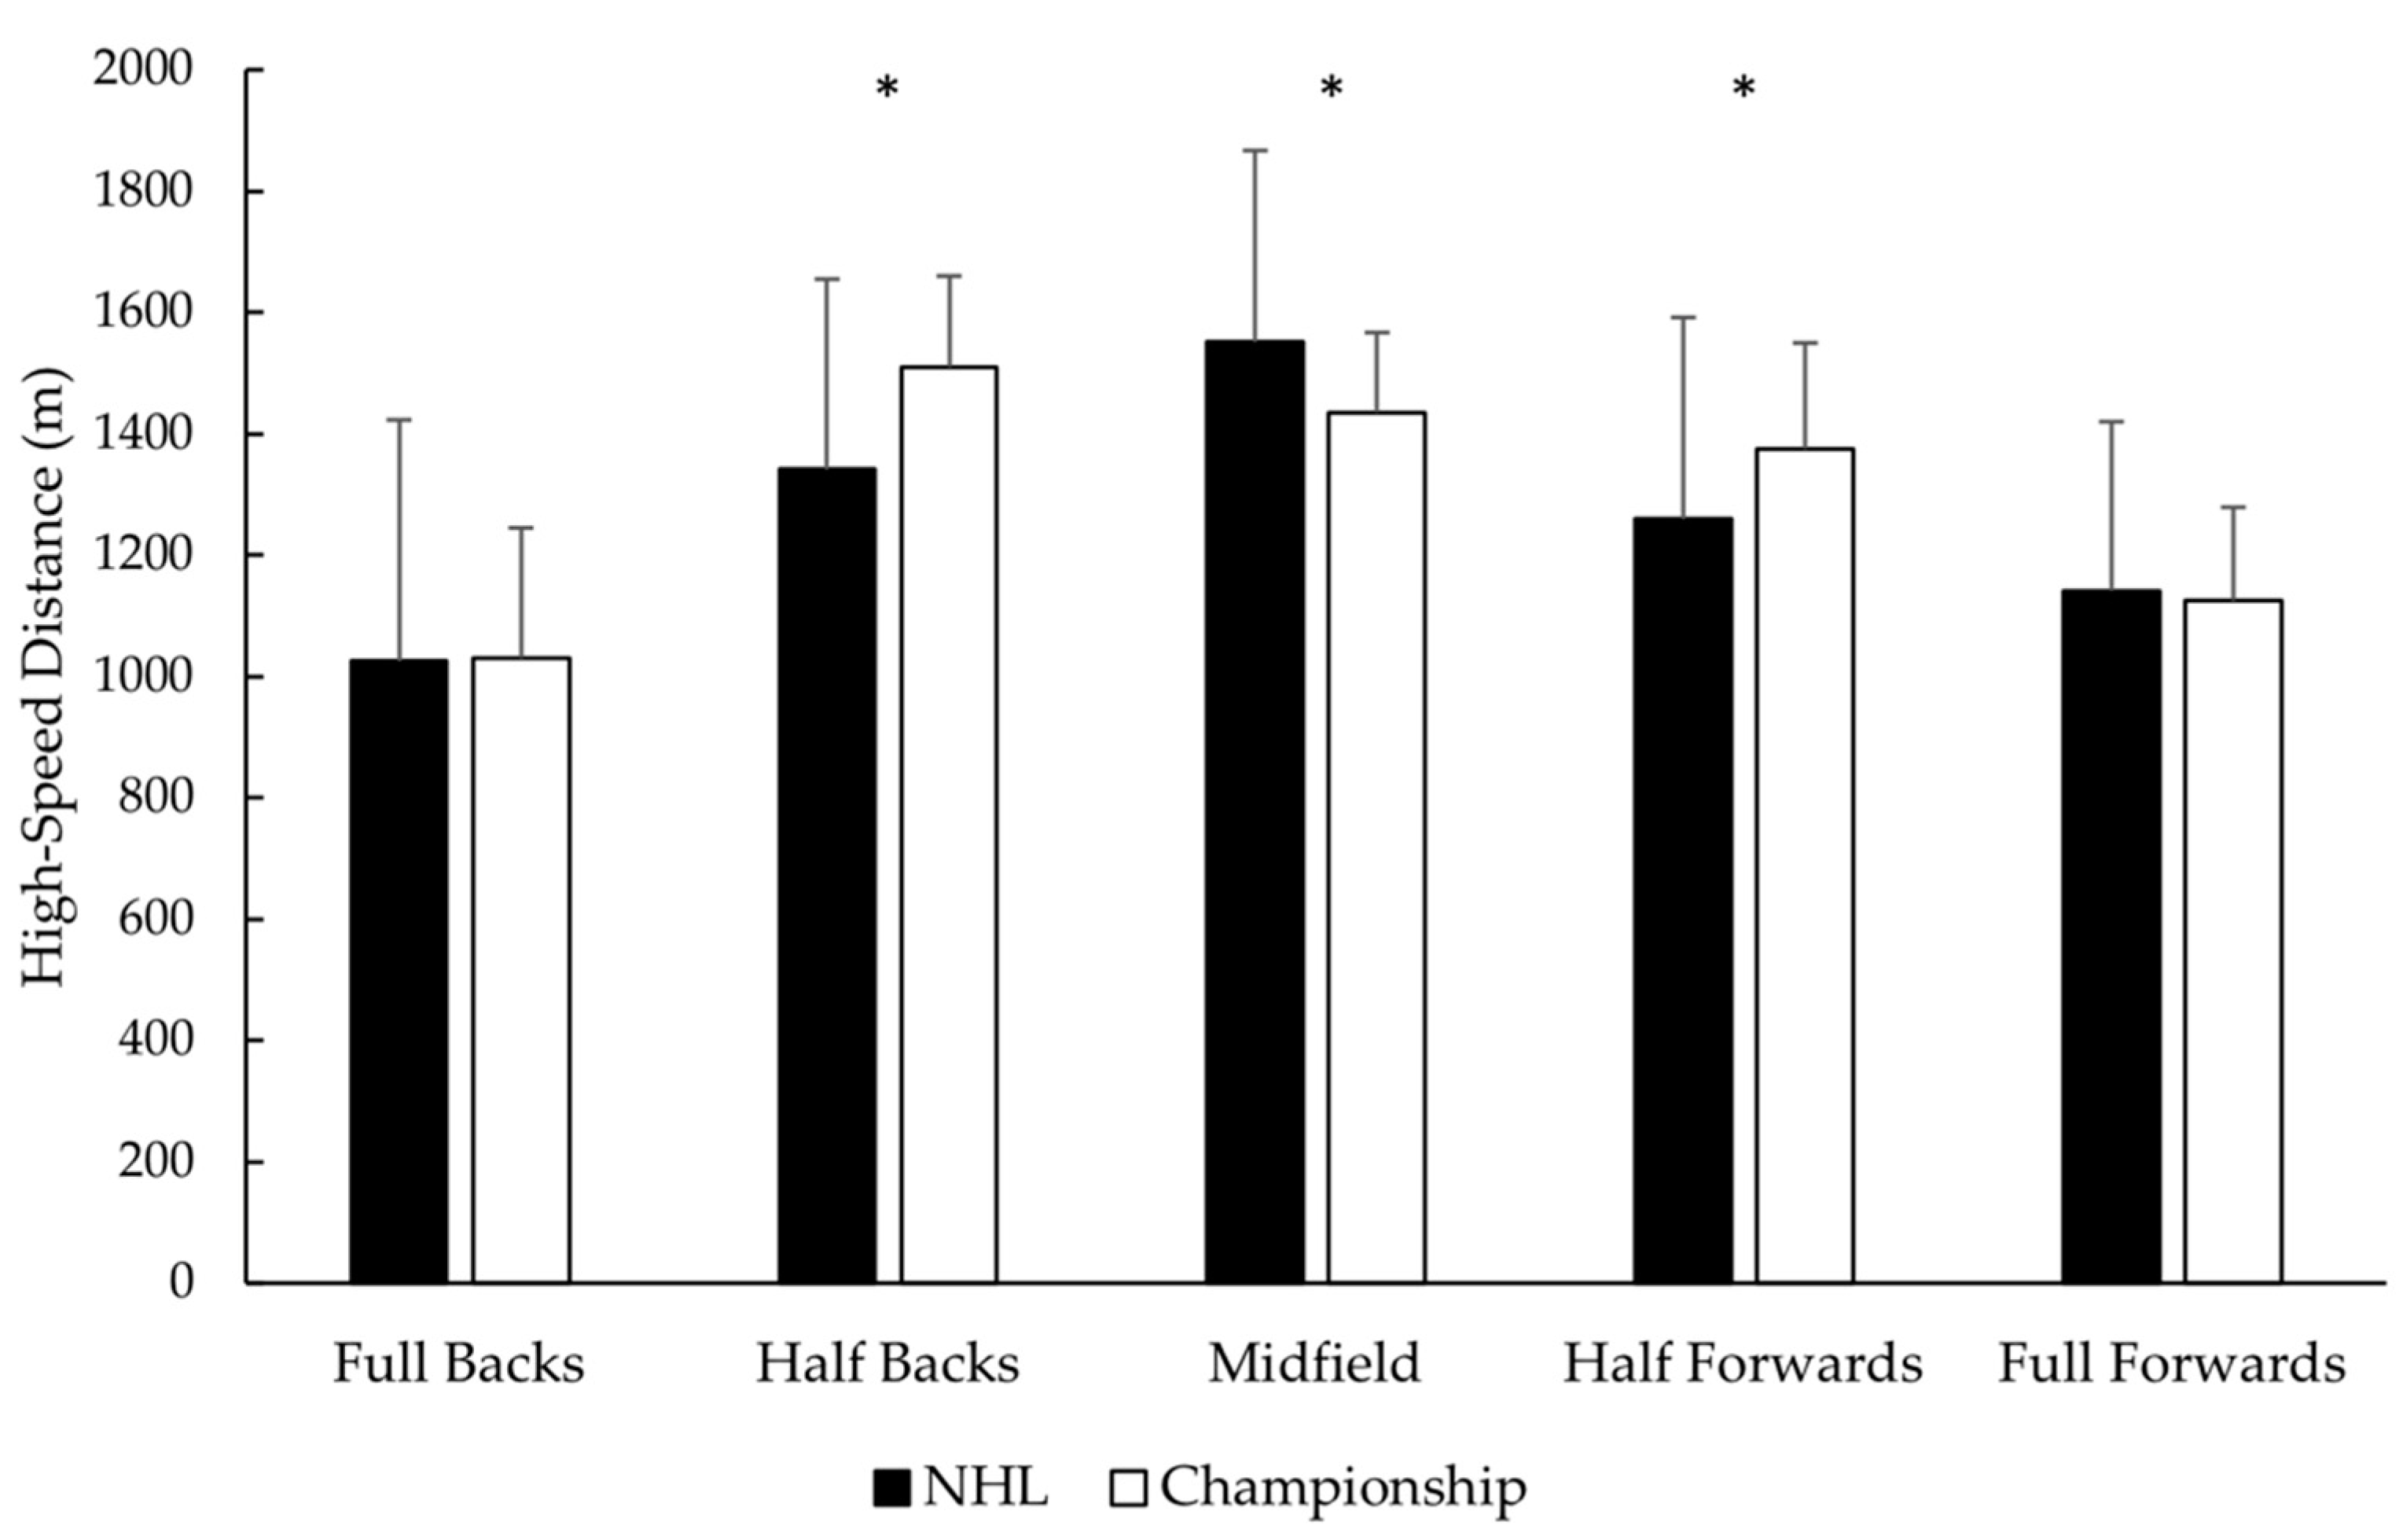
| High-Speed Distance (m) | Championship | 1030 ± 215 | 1510 ± 150 a | 1435 ± 132 a | 1375 ± 175 a | 1125 ± 154 bcd |
| League | 1025 ± 398 | 1341 ± 314 *a | 1551 ± 316 *a | 1259 ± 333 * | 1141 ± 279 c | |
| Diff (95% CI) | −5 (−69 to 59) | −169 (-246 to −93) | 115 (14 to −217) | −117 (−197 to −36) | 17 (−53 to 87) | |
| ES | −0.02 | −0.69 | 0.48 | −0.44 | 0.07 | |
| Sprint Distance (m) | Championship | 374 ± 84 | 411 ± 83 | 383 ± 69 | 440 ± 68 | 425 ± 98 |
| League | 318 ± 150 * | 360 ± 117 * | 400 ± 103 | 334 ± 98 * | 421 ± 112 a | |
| Diff (95% CI) | −56 (−75 to −37) | −50 (−72 to −28) | 17 (−13 to 47) | −106 (−130 to −82) | −4 (−25 to 17) | |
| ES | −0.46 | −0.50 | 0.19 | −1.26 | −0.04 | |
| Number of Sprints (n) | Championship | 33 ± 8 | 44 ± 7 a | 36 ± 9 | 36 ± 8 b | 31 ± 8 b |
| League | 24 ± 12 * | 24 ± 8 * | 26 ± 5 * | 23 ± 7 * | 27 ± 6 * | |
| Diff (95% CI) | −9 (−11 to −8) | −20 (−22 to −18) | −10 (−12 to −8) | −13 (−15 to −11) | −4 (−6 to −3) | |
| ES | −0.88 | −2.66 | −1.37 | −1.73 | −0.57 | |
| Length of Sprint (m) | Championship | 13 ± 3 | 14 ± 2 | 13 ± 3 | 14 ± 3 | 16 ± 3 abc |
| League | 14 ± 4 * | 15 ± 3 * | 15 ± 2 * | 15 ± 2 | 16 ± 3 | |
| Diff (95% CI) | 1 (−1 to 0) | 2 (1 to 2) | 2 (1 to 3) | 0 (0 to 1) | 1 (−1 to 0) | |
| ES | 0.28 | 0.39 | 0.78 | 0.39 | 0.00 | |
| Peak Speed (Km·h−1) | Championship | 31.5 ± 1.2 | 31.0 ± 1.0 | 30.6 ± 1.2 | 31.2 ± 1.0 | 31.9 ± 1.0 bc |
| League | 29.5 ± 2.0 * | 29.8 ± 1.2 * | 30.2 ± 1.8 * | 29.6 ± 1.4 * | 30.9 ± 1.6 *a | |
| Diff (95% CI) | −2.0 (−2.2 to −1.7) | −1.2 (−1.5 to −0.9) | −0.4 (−0.8 to 0.0) | −1.6 (−1.9 to −3) | −1.0 (−1.3 to −0.8) | |
| ES | −1.21 | −1.09 | −0.26 | −1.32 | −0.75 |
Publisher’s Note: MDPI stays neutral with regard to jurisdictional claims in published maps and institutional affiliations. |
© 2021 by the authors. Licensee MDPI, Basel, Switzerland. This article is an open access article distributed under the terms and conditions of the Creative Commons Attribution (CC BY) license (https://creativecommons.org/licenses/by/4.0/).
Share and Cite
Egan, B.; Young, D.; Collins, K.; Malone, S.; Coratella, G. The Between-Competition Running Demands of Elite Hurling Match-Play. Sports 2021, 9, 145. https://doi.org/10.3390/sports9110145
Egan B, Young D, Collins K, Malone S, Coratella G. The Between-Competition Running Demands of Elite Hurling Match-Play. Sports. 2021; 9(11):145. https://doi.org/10.3390/sports9110145
Chicago/Turabian StyleEgan, Brendan, Damien Young, Kieran Collins, Shane Malone, and Giuseppe Coratella. 2021. "The Between-Competition Running Demands of Elite Hurling Match-Play" Sports 9, no. 11: 145. https://doi.org/10.3390/sports9110145
APA StyleEgan, B., Young, D., Collins, K., Malone, S., & Coratella, G. (2021). The Between-Competition Running Demands of Elite Hurling Match-Play. Sports, 9(11), 145. https://doi.org/10.3390/sports9110145