
Relative Training Load and Match Outcome: Are Professional Soccer Players Actually Undertrained during the In-Season?


Abstract
:1. Introduction
2. Materials and Methods
2.1. Participants
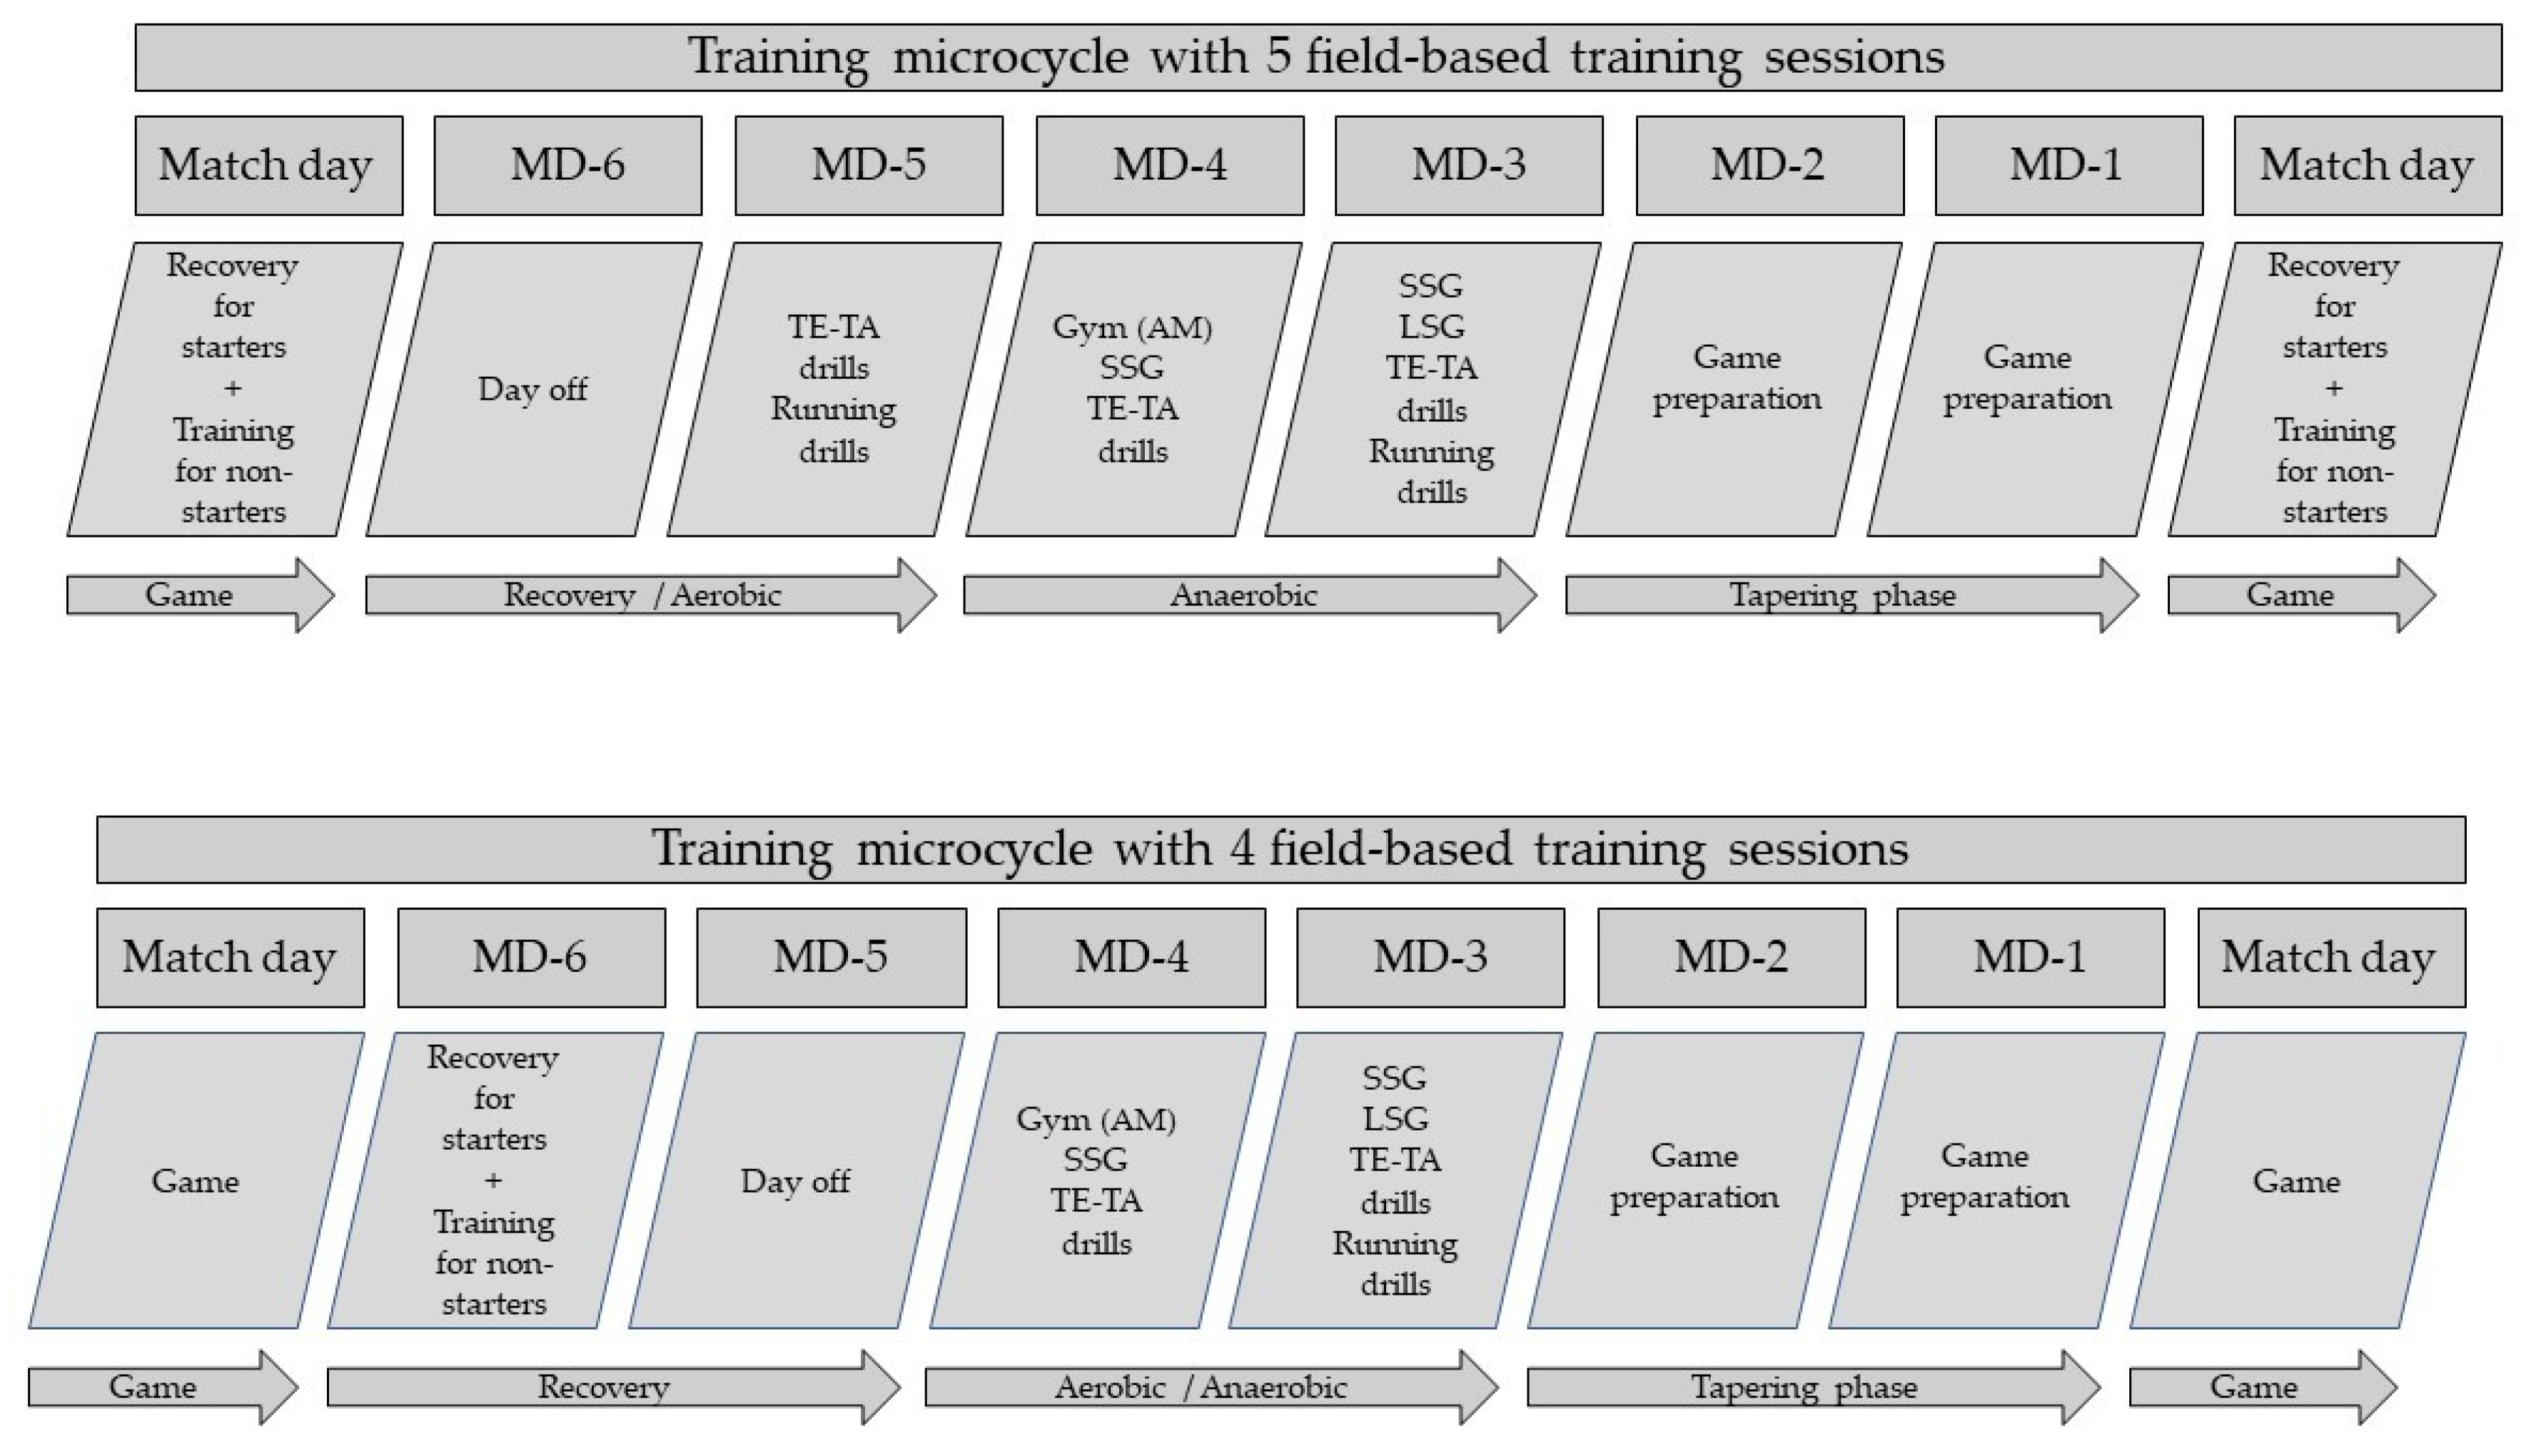
2.2. Design
2.3. Procedures
2.4. Statistics
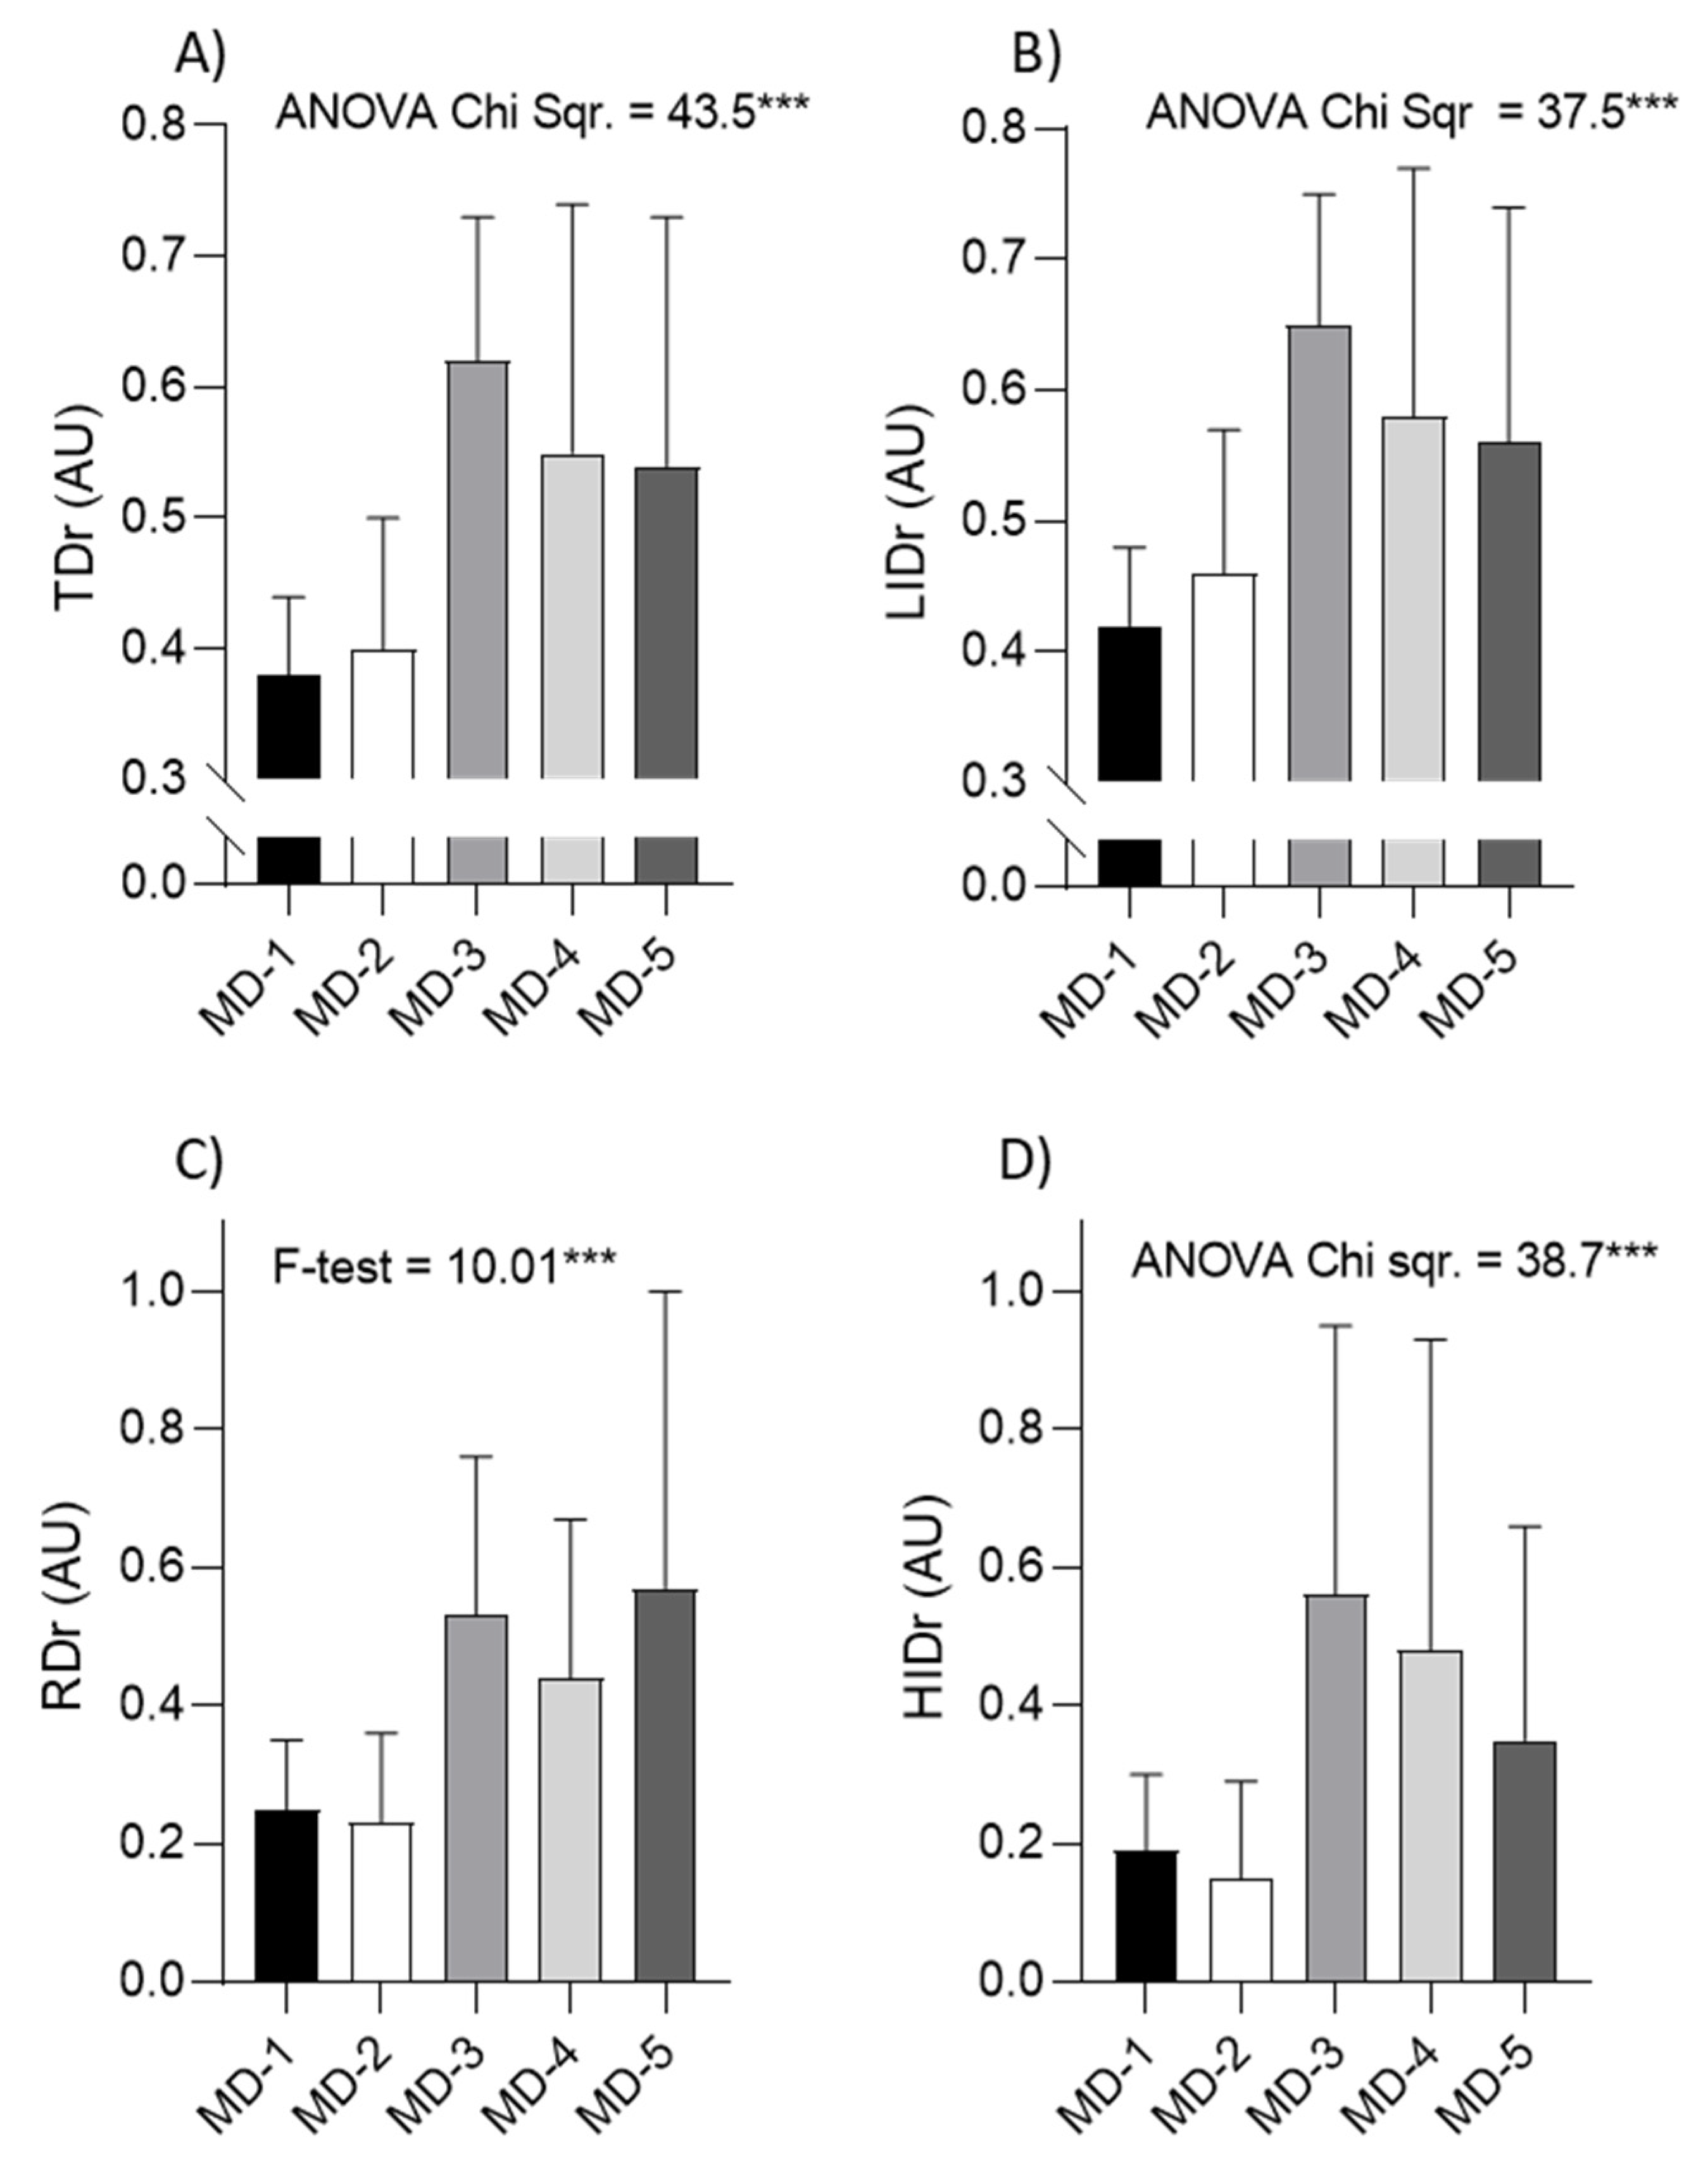
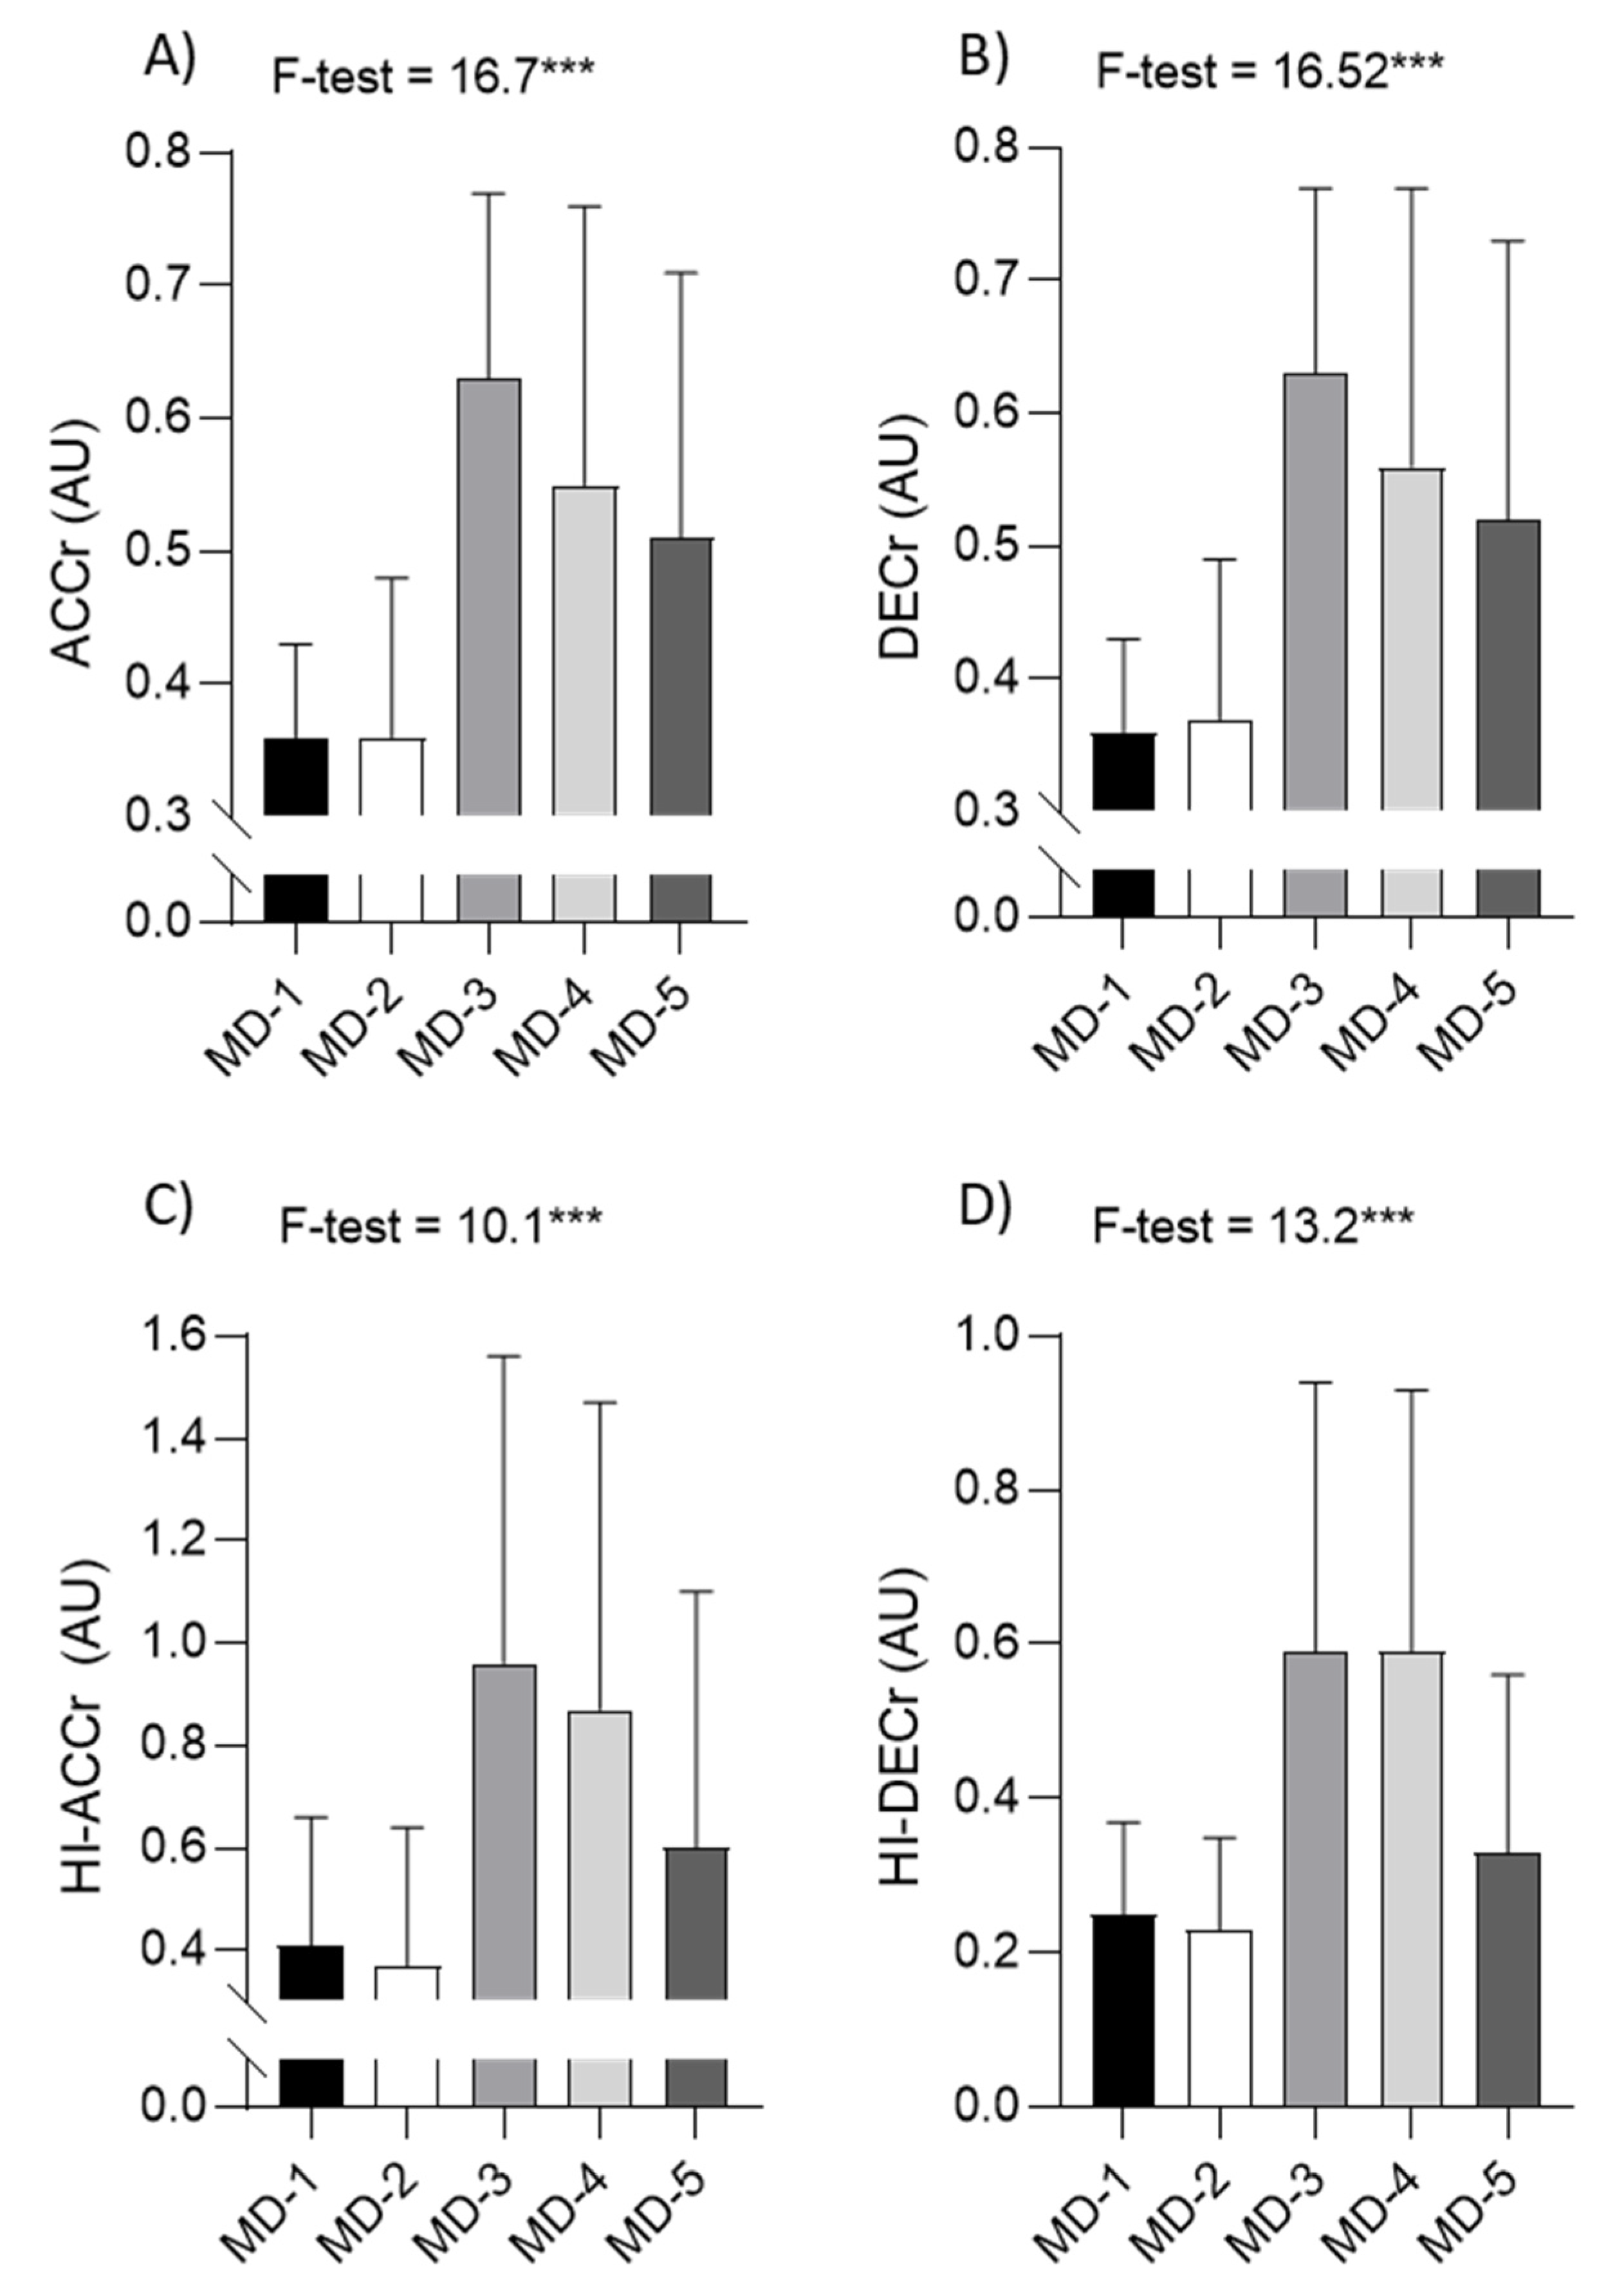
3. Results
4. Discussion
4.1. Relative Training Load within In-Season Microcycles
4.2. Association between Relative Training Load and Success in Soccer
4.3. Strengths and Limitations
4.4. Practical Implications and Future Research
- Players should be exposed to a minimum of 75–80% of the high-intensity running normally characterizing a match in the middle of the week (i.e., on MD-3 in our study);
- When utilizing small-sided games which do not require running at high speeds, coaches should include specific running drills that entail high-intensity running (e.g., high-speed running and sprinting) in the training sessions;
- Training methodology that utilizes a “high-volume and low-intensity” training session the second day after the match (i.e., on MD-5) may positively impact success in soccer;
- After heavy training sessions which are characterized by high internal and external load in the middle of the week, coaches should reduce the volume of the training on the two days before the match.
- For a more comprehensive understanding of RTL, measures of internal load should be included in future studies.
5. Conclusions
Author Contributions
Funding
Institutional Review Board Statement
Informed Consent Statement
Data Availability Statement
Acknowledgments
Conflicts of Interest
References
- Coppalle, S.; Rave, G.; Ben Abderrahman, A.; Ali, A.; Salhi, I.; Zouita, S.; Zouita, A.; Brughelli, M.; Granacher, U.; Zouhal, H. Relationship of pre-season training load with in-season biochemical markers, injuries and performance in professional soccer players. Front. Physiol. 2019, 10, 409. [Google Scholar] [CrossRef] [PubMed] [Green Version]
- Barnes, C.; Archer, D.; Bush, M.; Hogg, R.; Bradley, P. The evolution of physical and technical performance parameters in the English Premier League. Int. J. Sports Med. 2014, 35, 1–6. [Google Scholar] [CrossRef] [PubMed]
- Radzimiński, Ł. Weekly training load distribution and relationships between external and internal load indicators in professional soccer players. J. Phys. Educ. Sport 2021, 21, 1669–1675. [Google Scholar] [CrossRef]
- Zhou, C.; Gómez, M.-Á.; Lorenzo, A. The evolution of physical and technical performance parameters in the Chinese Soccer Super League. Biol. Sport 2020, 37, 139–145. [Google Scholar] [CrossRef]
- Andrzejewski, M.; Konefał, M.; Chmura, P.; Kowalczuk, E.; Chmura, J. Match outcome and distances covered at various speeds in match play by elite German soccer players. Int. J. Perform. Anal. Sport 2016, 16, 817–828. [Google Scholar] [CrossRef]
- Jaspers, A.; Brink, M.S.; Probst, S.G.; Frencken, W.G.; Helsen, W.F. Relationships between training load indicators and training outcomes in professional soccer. Sports Med. 2017, 47, 533–544. [Google Scholar] [CrossRef] [PubMed]
- Scott, B.R.; Lockie, R.G.; Davies, S.J.; Clark, A.C.; Lynch, D.M.; Janse de Jonge, X. The physical demands of professional soccer players during in-season field-based training and match-play. J. Aust. Strength Cond. 2014, 22, 48–52. [Google Scholar]
- Oliveira, R.; Brito, J.P.; Martins, A.; Mendes, B.; Marinho, D.A.; Ferraz, R.; Marques, M.C. In-season internal and external training load quantification of an elite European soccer team. PLoS ONE 2019, 14, e0209393. [Google Scholar] [CrossRef] [Green Version]
- Anderson, L.; Orme, P.; Di Michele, R.; Close, G.L.; Morgans, R.; Drust, B.; Morton, J.P. Quantification of training load during one-, two-and three-game week schedules in professional soccer players from the English Premier League: Implications for carbohydrate periodisation. J. Sports Sci. 2016, 34, 1250–1259. [Google Scholar] [CrossRef] [Green Version]
- Alexiou, H.; Coutts, A.J. A comparison of methods used for quantifying internal training load in women soccer players. Int. J. Sports Physiol. Perform. 2008, 3, 320–330. [Google Scholar] [CrossRef] [PubMed] [Green Version]
- Little, T.; Williams, A.G. Measures of exercise intensity during soccer training drills with professional soccer players. J. Strength Cond. Res. 2007, 21, 367. [Google Scholar] [CrossRef] [PubMed]
- Scott, B.R.; Lockie, R.G.; Knight, T.J.; Clark, A.C.; de Jonge, X.A.J. A comparison of methods to quantify the in-season training load of professional soccer players. Int. J. Sports Physiol. Perform. 2013, 8, 195–202. [Google Scholar] [CrossRef] [PubMed] [Green Version]
- Aguiar, M.; Botelho, G.; Lago, C.; Maças, V.; Sampaio, J. A review on the effects of soccer small-sided games. J. Hum. Kinet. 2012, 33, 103. [Google Scholar] [CrossRef]
- Clemente, F.M.; Rabbani, A.; Conte, D.; Castillo, D.; Afonso, J.; Clark, T.; Craig, C.; Nikolaidis, P.T.; Rosemann, T.; Knechtle, B. Training/Match External Load Ratios in Professional Soccer Players: A Full-Season Study. Int. J. Environ. Res. Public Health 2019, 16, 3057. [Google Scholar] [CrossRef] [Green Version]
- Stevens, T.G.; de Ruiter, C.J.; Twisk, J.W.; Savelsbergh, G.J.; Beek, P.J. Quantification of in-season training load relative to match load in professional Dutch Eredivisie football players. Sci. Med. Footb. 2017, 1, 117–125. [Google Scholar] [CrossRef]
- Modric, T.; Versic, S.; Sekulic, D. Relations of the Weekly External Training Load Indicators and Running Performances in Professional Soccer Matches. Sport Mont 2021, 19, 31–37. [Google Scholar]
- Borresen, J.; Lambert, M.I. The quantification of training load, the training response and the effect on performance. Sports Med. 2009, 39, 779–795. [Google Scholar] [CrossRef] [PubMed]
- Bourdon, P.C.; Cardinale, M.; Murray, A.; Gastin, P.; Kellmann, M.; Varley, M.C.; Gabbett, T.J.; Coutts, A.J.; Burgess, D.J.; Gregson, W.; et al. Monitoring Athlete Training Loads: Consensus Statement. Int. J. Sports Physiol. Perform. 2017, 12, S2161–S2170. [Google Scholar] [CrossRef]
- Modric, T.; Versic, S.; Sekulic, D.; Liposek, S. Analysis of the Association between Running Performance and Game Performance Indicators in Professional Soccer Players. Int. J. Environ. Res. Public Health 2019, 16, 4032. [Google Scholar] [CrossRef] [Green Version]
- Andrzejewski, M.; Chmura, P.; Konefał, M.; Kowalczuk, E.; Chmura, J. Match outcome and sprinting activities in match play by elite German soccer players. J. Sports Med. Phys. Fit. 2017, 58, 785–792. [Google Scholar]
- Chmura, P.; Konefał, M.; Chmura, J.; Kowalczuk, E.; Zając, T.; Rokita, A.; Andrzejewski, M. Match outcome and running performance in different intensity ranges among elite soccer players. Biol. Sport 2018, 35, 197. [Google Scholar] [CrossRef] [PubMed]
- Di Salvo, V.; Gregson, W.; Atkinson, G.; Tordoff, P.; Drust, B. Analysis of high intensity activity in Premier League soccer. Int. J. Sports Med. 2009, 30, 205–212. [Google Scholar] [CrossRef] [PubMed]
- Barrera, J.; Sarmento, H.; Clemente, F.M.; Field, A.; Figueiredo, A.J. The Effect of Contextual Variables on Match Performance across Different Playing Positions in Professional Portuguese Soccer Players. Int. J. Environ. Res. Public Health 2021, 18, 5175. [Google Scholar] [CrossRef] [PubMed]
- Chmura, P.; Liu, H.; Andrzejewski, M.; Chmura, J.; Kowalczuk, E.; Rokita, A.; Konefał, M. Is there meaningful influence from situational and environmental factors on the physical and technical activity of elite football players? Evidence from the data of 5 consecutive seasons of the German Bundesliga. PLoS ONE 2021, 16, e0247771. [Google Scholar] [CrossRef] [PubMed]
- Modric, T.; Versic, S.; Sekulic, D. Position Specific Running Performances in Professional Football (Soccer): Influence of Different Tactical Formations. Sports 2020, 8, 161. [Google Scholar] [CrossRef] [PubMed]
- Teune, B.; Spencer, B.; Sweeting, A.J.; Woods, C.; Inness, M.; Robertson, S. Application of a continuous pressure metric for Australian football. J. Sports Sci. 2021, 39, 1548–1554. [Google Scholar] [CrossRef]
- Castellano, J.; Casamichana, D.; Calleja-González, J.; San Román, J.; Ostojic, S.M. Reliability and accuracy of 10 Hz GPS devices for short-distance exercise. J. Sports Sci. Med. 2011, 10, 233. [Google Scholar] [PubMed]
- Johnston, R.J.; Watsford, M.L.; Kelly, S.J.; Pine, M.J.; Spurrs, R.W. Validity and interunit reliability of 10 Hz and 15 Hz GPS units for assessing athlete movement demands. J. Strength Cond. Res. 2014, 28, 1649–1655. [Google Scholar] [CrossRef] [PubMed]
- Kadlubowski, B.; Keiner, M.; Hartmann, H.; Wirth, K.; Frick, U. The relationship between change of direction tests in elite youth soccer players. Sports 2019, 7, 111. [Google Scholar] [CrossRef] [Green Version]
- Vickerstaff, V.; Omar, R.Z.; Ambler, G. Methods to adjust for multiple comparisons in the analysis and sample size calculation of randomised controlled trials with multiple primary outcomes. BMC Med. Res. Methodol. 2019, 19, 1–13. [Google Scholar]
- Cohen, J. Statistical Power Analysis for the Behavioral Sciences; Academic Press: Cambridge, MA, USA, 2013. [Google Scholar]
- Lenhard, W.; Lenhard, A. Berechnung von Effektstärken [Calculation of effect sizes]. Dettelbach: Psychometrica. 2016. Available online: https://www.psychometrica.de/effektstaerke.html (accessed on 15 February 2020).
- Akenhead, R.; Harley, J.A.; Tweddle, S.P. Examining the external training load of an English Premier League football team with special reference to acceleration. J. Strength Cond. Res. 2016, 30, 2424–2432. [Google Scholar] [CrossRef] [PubMed]
- Spencer, M.; Bishop, D.; Dawson, B.; Goodman, C. Physiological and metabolic responses of repeated-sprint activities. Sports Med. 2005, 35, 1025–1044. [Google Scholar] [CrossRef] [PubMed]
- Modric, T.; Versic, S.; Sekulic, D. Does aerobic performance define match running performance among professional soccer players? A position-specific analysis. Res. Sports Med. 2021, 29, 336–348. [Google Scholar] [CrossRef] [PubMed]
- Modric, T.; Versic, S.; Sekulic, D. Playing position specifics of associations between running performance during the training and match in male soccer players. Acta Gymnica 2020, 50, 51–60. [Google Scholar] [CrossRef]
- Vigne, G.; Gaudino, C.; Rogowski, I.; Alloatti, G.; Hautier, C. Activity profile in elite Italian soccer team. Int. J. Sports Med. 2010, 31, 304–310. [Google Scholar] [CrossRef]
- Modric, T.; Versic, S.; Sekulic, D. Aerobic fitness and game performance indicators in professional football players; playing position specifics and associations. Heliyon 2020, 6, e05427. [Google Scholar] [CrossRef]
- Chmura, P.; Goliński, D.; Andrzejewski, M.; Mroczek, D.; Kawczyński, A.; Rokita, A.; Chmura, J. Endurance capacity and selected technical-tactical skills of soccer players participating in the group stage of the 2014 FIFA World Cup. Trends Sport Sci. 2014, 21, 153–160. [Google Scholar]
- Fessi, M.S.; Zarrouk, N.; Di Salvo, V.; Filetti, C.; Barker, A.R.; Moalla, W. Effects of tapering on physical match activities in professional soccer players. J. Sports Sci. 2016, 34, 2189–2194. [Google Scholar] [CrossRef]
- Mujika, I.; Padilla, S. Scientific bases for precompetition tapering strategies. Med. Sci. Sports Exerc. 2003, 35, 1182–1187. [Google Scholar] [CrossRef]
- Bosquet, L.; Montpetit, J.; Arvisais, D.; Mujika, I. Effects of tapering on performance: A meta-analysis. Med. Sci. Sports Exerc. 2007, 39, 1358–1365. [Google Scholar] [CrossRef] [Green Version]
- Clemente, F.M.; Owen, A.; Serra-Olivares, J.; Nikolaidis, P.T.; van der Linden, C.M.I.; Mendes, B. Characterization of the Weekly External Load Profile of Professional Soccer Teams from Portugal and the Netherlands. J. Hum. Kinet. 2019, 66, 155–164. [Google Scholar] [CrossRef] [PubMed] [Green Version]

| Match Outcome | Analysis of Variance | Effect Size | |||||||
|---|---|---|---|---|---|---|---|---|---|
| Loss | Draw | Win | F-Test/ H-Test * | p | L/W | D/L | D/W | ||
| TDr | MD-1 | 0.42 ± 0.04 W | 0.4 ± 0.05 W | 0.35 ± 0.05 L, D | 16.98 | 0.01 | 1.41 | 0.43 | 0.95 |
| MD-2 | 0.44 ± 0.12 W | 0.45 ± 0.06 W | 0.35 ± 0.09 L, D | 10.37 | 0.01 | 0.89 | 0.07 | 1.21 | |
| MD-3 | 0.59 ± 0.06 | 0.61 ± 0.11 | 0.63 ± 0.12 | 1.00 | 0.37 | 0.40 | 0.26 | 0.15 | |
| MD-4 * | 0.48 ± 0.1 D | 0.73 ± 0.22 L, W | 0.48 ± 0.14 D | 21.08 | 0.01 | 0.03 | 1.53 | 1.29 | |
| MD-5 | 0.43 ± 0.11 W | 0.36 ± 0.04 W | 0.71 ± 0.13 L, D | 31.65 | 0.01 | 2.12 | 0.91 | 3.05 | |
| LIDr | MD-1 | 0.46 ± 0.04 W | 0.44 ± 0.06 W | 0.39 ± 0.05 L, D | 12.50 | 0.01 | 1.28 | 0.39 | 0.78 |
| MD-2 | 0.49 ± 0.12 W | 0.5 ± 0.07 W | 0.4 ± 0.09 L, D | 10.47 | 0.01 | 0.89 | 0.11 | 1.24 | |
| MD-3 | 0.63 ± 0.06 | 0.66 ± 0.09 | 0.65 ± 0.11 | 0.46 | 0.64 | 0.18 | 0.35 | 0.09 | |
| MD-4 * | 0.5 ± 0.13 D | 0.79 ± 0.2 L, W | 0.51 ± 0.13 D | 30.09 | 0.01 | 0.02 | 1.99 | 1.78 | |
| MD-5 | 0.43 ± 0.16 W | 0.41 ± 0.04 W | 0.72 ± 0.08 L, D | 34.40 | 0.01 | 2.50 | 0.12 | 4.37 | |
| RDr | MD-1 | 0.26 ± 0.1 | 0.28 ± 0.08 | 0.22 ± 0.1 | 2.58 | 0.08 | 0.35 | 0.24 | 0.61 |
| MD-2 | 0.25 ± 0.14 | 0.27 ± 0.1 | 0.18 ± 0.13 | 3.73 | 0.03 | 0.52 | 0.10 | 0.72 | |
| MD-3 | 0.46 ± 0.11 | 0.49 ± 0.22 | 0.59 ± 0.27 | 2.65 | 0.08 | 0.59 | 0.20 | 0.39 | |
| MD-4 | 0.4 ± 0.14 D | 0.59 ± 0.32 L, W | 0.37 ± 0.18 D | 7.19 | 0.01 | 0.23 | 0.77 | 0.89 | |
| MD-5 | 0.59 ± 0.16 | 0.18 ± 0.05 W | 0.78 ± 0.51 D | 6.97 | 0.01 | 0.43 | 3.35 | 1.40 | |
| HIDr | MD-1 | 0.21 ± 0.1 | 0.23 ± 0.11 | 0.15 ± 0.11 | 4.40 | 0.02 | 0.53 | 0.24 | 0.72 |
| MD-2 | 0.16 ± 0.17 | 0.22 ± 0.15 | 0.1 ± 0.11 | 4.48 | 0.01 | 0.43 | 0.34 | 0.90 | |
| MD-3 | 0.37 ± 0.2 W | 0.46 ± 0.24 W | 0.73 ± 0.47 L, D | 7.69 | 0.01 | 0.91 | 0.40 | 0.68 | |
| MD-4 * | 0.43 ± 0.42 | 0.61 ± 0.6 | 0.45 ± 0.51 | 0.97 | 0.62 | 0.13 | 0.23 | 0.23 | |
| MD-5 | 0.3 ± 0.2 | 0.1 ± 0.04 | 0.52 ± 0.47 | 4.02 | 0.03 | 0.53 | 1.33 | 1.08 | |
| Match Outcome | Analysis of Variance | Effect Size | |||||||
|---|---|---|---|---|---|---|---|---|---|
| Loss | Draw | Win | F-Test | p | L/W | D/L | D/W | ||
| ACCr | MD-1 | 0.4 ± 0.05 W | 0.38 ± 0.06 W | 0.32 ± 0.06 L, D | 16.21 | 0.01 | 1.44 | 0.51 | 0.86 |
| MD-2 | 0.44 ± 0.1 W | 0.39 ± 0.08 W | 0.29 ± 0.11 L, D | 16.76 | 0.01 | 1.38 | 0.55 | 0.93 | |
| MD-3 | 0.63 ± 0.08 | 0.64 ± 0.19 | 0.63 ± 0.13 | 0.03 | 0.97 | 0.04 | 0.03 | 0.06 | |
| MD-4 | 0.49 ± 0.21 D | 0.74 ± 0.2 L, W | 0.48 ± 0.12 D | 15.82 | 0.01 | 0.07 | 1.18 | 1.60 | |
| MD-5 | 0.43 ± 0.2 W | 0.34 ± 0.07 W | 0.65 ± 0.16 L, D | 10.76 | 0.01 | 1.16 | 0.56 | 2.11 | |
| DECr | MD-1 | 0.4 ± 0.05 W | 0.38 ± 0.06 W | 0.33 ± 0.06 L, D | 14.72 | 0.01 | 1.39 | 0.50 | 0.81 |
| MD-2 | 0.44 ± 0.1 W | 0.39 ± 0.09 W | 0.3 ± 0.12 L, D | 14.51 | 0.01 | 1.28 | 0.57 | 0.83 | |
| MD-3 | 0.63 ± 0.09 | 0.63 ± 0.18 | 0.63 ± 0.13 | 0.02 | 0.98 | 0.06 | 0.05 | 0.00 | |
| MD-4 | 0.49 ± 0.2 D | 0.75 ± 0.21 L, W | 0.49 ± 0.12 D | 17.48 | 0.01 | 0.03 | 1.26 | 1.62 | |
| MD-5 | 0.44 ± 0.2 W | 0.34 ± 0.06 W | 0.66 ± 0.16 L, D | 12.43 | 0.01 | 1.19 | 0.69 | 2.29 | |
| HI-ACCr | MD-1 | 0.35 ± 0.16 | 0.44 ± 0.23 | 0.44 ± 0.31 | 1.03 | 0.36 | 0.32 | 0.44 | 0.01 |
| MD-2 | 0.36 ± 0.26 | 0.36 ± 0.26 | 0.38 ± 0.3 | 0.04 | 0.96 | 0.07 | 0.03 | 0.04 | |
| MD-3 | 1.17 ± 0.81 D | 0.71 ± 0.32 L | 1 ± 0.55 | 3.43 | 0.04 | 0.26 | 0.75 | 0.60 | |
| MD-4 | 0.54 ± 0.28 D, L | 1.07 ± 0.86 L | 1.01 ± 0.52 L | 6.66 | 0.01 | 1.07 | 0.86 | 0.09 | |
| MD-5 | 0.31 ± 0.17 W | 0.27 ± 0.2 W | 0.91 ± 0.54 D, L | 8.59 | 0.01 | 1.26 | 0.20 | 1.37 | |
| HI-DECr | MD-1 | 0.24 ± 0.07 | 0.27 ± 0.12 | 0.25 ± 0.16 | 0.29 | 0.75 | 0.07 | 0.30 | 0.13 |
| MD-2 | 0.27 ± 0.12 W | 0.23 ± 0.09 | 0.19 ± 0.12 L | 4.13 | 0.02 | 0.69 | 0.37 | 0.39 | |
| MD-3 | 0.71 ± 0.42 | 0.56 ± 0.27 | 0.55 ± 0.35 | 1.44 | 0.24 | 0.42 | 0.41 | 0.04 | |
| MD-4 | 0.45 ± 0.27 | 0.68 ± 0.43 | 0.63 ± 0.31 | 3.26 | 0.04 | 0.60 | 0.64 | 0.12 | |
| MD-5 | 0.22 ± 0.14 | 0.29 ± 0.14 | 0.42 ± 0.28 | 2.38 | 0.11 | 0.81 | 0.46 | 0.53 | |
| MD-1 | MD-2 | MD-3 | MD-4 | MD-5 | |
|---|---|---|---|---|---|
| TDr | −0.54 (0.001) * | −0.40 (0.001) * | 0.20 (0.09) | −0.01 (0.91) | 0.72 (0.001) * |
| LIDr | −0.50 (0.001) * | −0.40 (0.001) * | 0.07 (0.58) | −0.03 (0.80) | 0.73 (0.001) * |
| RDr | −0.22 (0.04) | −0.25 (0.03) | 0.2 (0.048) | −0.08 (0.48) | 0.15 (0.42) |
| HIDr | −0.29 (0.001) * | −0.19 (0.08) | 0.40 (0.001) * | −0.05 (0.67) | 0.25 (0.19) |
| ACCr | −0.54 (0.001) * | −0.53 (0.001) * | 0.00 (0.98) | −0.09 (0.42) | 0.56 (0.001) * |
| DECr | −0.52 (0.001) * | −0.51 (0.001) * | 0.06 (0.62) | −0.06 (0.60) | 0.57 (0.001) * |
| HI-ACCr | 0.06 (0.62) | 0.02 (0.83) | 0.00 (0.98) | 0.35 (0.001) * | 0.60 (0.001) * |
| HI-DECr | −0.09 (0.41) | −0.30 (0.001) * | −0.14 (0.24) | 0.23 (0.04) | 0.33 (0.07) |
Publisher’s Note: MDPI stays neutral with regard to jurisdictional claims in published maps and institutional affiliations. |
© 2021 by the authors. Licensee MDPI, Basel, Switzerland. This article is an open access article distributed under the terms and conditions of the Creative Commons Attribution (CC BY) license (https://creativecommons.org/licenses/by/4.0/).
Share and Cite
Modric, T.; Jelicic, M.; Sekulic, D. Relative Training Load and Match Outcome: Are Professional Soccer Players Actually Undertrained during the In-Season? Sports 2021, 9, 139. https://doi.org/10.3390/sports9100139
Modric T, Jelicic M, Sekulic D. Relative Training Load and Match Outcome: Are Professional Soccer Players Actually Undertrained during the In-Season? Sports. 2021; 9(10):139. https://doi.org/10.3390/sports9100139
Chicago/Turabian StyleModric, Toni, Mario Jelicic, and Damir Sekulic. 2021. "Relative Training Load and Match Outcome: Are Professional Soccer Players Actually Undertrained during the In-Season?" Sports 9, no. 10: 139. https://doi.org/10.3390/sports9100139
APA StyleModric, T., Jelicic, M., & Sekulic, D. (2021). Relative Training Load and Match Outcome: Are Professional Soccer Players Actually Undertrained during the In-Season? Sports, 9(10), 139. https://doi.org/10.3390/sports9100139