Abstract
Research on heart rate (HR), mean arterial pressure (MAP) and blood pressure (BP) during specific training stages is less common in endurance athletes, whereas resting BP and HR are less studied in relationship to HRmax. In the current study, the objective was to conduct a medium-term HR, BP and MAP analysis while tracking individual training outcomes. The study was conducted during the 2017–2018 season, over 43 days and 1033 km of training volume, on 12 competitive male cross-country ski athletes. One VO2max test was performed 10 days before the start of the training program. After the test, training volume and intensity was preset for each subject, according to the general training methodology. Early morning HR, MAP and BP measurements were taken as part of the basic functional analysis. Training volume was correlated to both distance (p = 0.01, r = 0.85, CI95% = 0.80 to 0.88) and training HR%, namely the percentage of HRmax (p = 0.01, r = −0.47, CI95% = −0.58 to −0.34). Both the supine (sHR) and orthostatic HR (oHR) values were significantly correlated with the training intensity. We obtained a significant correlation between sHR and oHR values and the training objective (p = 0.01). An increased oHR was correlated to high intensity training activity (HIT) during the second training session (p = 0.01). Heart rate and blood pressure measurements represent predictive functional adaptation parameters over different training phases. We highlight a link between sHR, oHR, MAP data, and the athletes’ ability to perform in lower effort zones during physical exertion. However, we failed to validate MAP as a cardiovascular stress indicator following high intensity training.
1. Introduction
Planning the training intensity is of particular importance in sports performance, while monitoring the athlete can offer specific data regarding the adaptation process, the recovery status or the main physiological changes that occur. Some of the most common measurements used for training monitoring are the heart rate (HR), blood pressure (BP) and mean arterial pressure (MAP), along with blood lactate and sleep quality.
Day by day training activity may significantly differ from laboratory research conditions [1,2,3]. As a result, field-based research can be more relevant to daily training activity, even if common methods are used in the study methodology. Over the training stages, cardiovascular and neural adaptations seem to be related to various training characteristics, such as effort intensity, effort volume and environmental conditions, during either short or long training periods. Of the main changes, physical effort influences vascular remodeling [4]. Yet, aerobic physical training favors angiogenesis, positively influencing the number of capillaries and therefore the gas exchange area, while improving oxygen diffusion and vagal tonus [5,6]. Without proper adaptation, the heart rate will increase due to reduced parasympathetic and increased sympathetic activity [7]. Increased long-term sympathetic activity induces cardiovascular stress, a drop in muscular strength, agility and an increased reaction time, influencing both resting and effort cardiovascular parameters.
Despite the use of HR as a predictor of autonomic cardiovascular activity, few data are available regarding heart rate and blood pressure during rest-to-effort and effort-to-rest transitions [8]. During the resting or physical effort period, neural adaptation will strongly influence the HR measurement result and therefore the muscle contraction frequency changes the hearts sympathetic stimulation. During high intensity training (HIT), performances can change due to a drop in both cardiac output and HRmax, of which values fail to exceed a 90% peak. Both power and muscle contraction frequency can describe the effort intensity better than the HR value, which can easily be affected by other factors [9,10]. During physical exertion, both systemic vasoconstriction and local vasodilatation fail to bring a significant change in diastolic blood pressure, whereas systolic blood pressure reaches a plateau near maximal exercise intensity [11,12]. The main outcome is an increased MAP, which can be maintained during the post effort period [13]. Contrary to HRmax use during training, several authors have utilized HR measurements during recovery periods [14,15,16]. Research papers on resting HR and BP tend to be less specific in elite cross-country skiing during medium-term periods, while long-term MAP and HR are less studied in relation to HRmax.
A small number of research papers that investigate long-term training performance following HIT activity are available [13,17,18]. Yet, HR use during short-term periods is well known. Several groups are using HR data for individual training and performance tracking. However, less data regarding the use of resting BP and MAP in training is being published. Performance drop is related much more to training-induced fatigue and reduced muscle fiber recruitment. Starting from this point, our objective was to conduct a medium term HR, BP and MAP analysis while tracking individual training performances. Based on our hypothesis, specific physiological HR, BP and MAP changes can be associated with individual adaption according to the training characteristics. By testing such a hypothesis, daily activity during both general and specific training conditions can be significantly improved by using simple, cost efficient and noninvasive methods.
2. Materials and Methods
We conducted an observational study between October and December 2017, during part of the 2017–2018 cross-country ski training season. To conduct the study and publish the current results, written informed consent was received from: (1) the participants, (2) federal management, and (3) the University Ethical Committee.
2.1. Participants
The study group consisted of 12 international competitive male cross-country skiers with a mean age of 23 (18–28). To be included in the study group, the subjects had to fulfil the following criteria: (1) male cross-country ski athlete, (2) general medical acceptance, (3) >18 years old, (4) currently competing at professional national or international level. Exclusion was pre-set by using the following criteria: (1) medical incompatibility with the pre-determined training program, (2) health condition that would inhibit the study activity, (3) age less than 18 or (4) lack of international or national competitive activity.
Two individuals (n = 2) were excluded at the start of the study due to age (<18 years old).
2.2. Procedures
The study was conducted during the 2017–2018 season, over 43 days and 1033 km of training volume, on a sample of 12 competitive male cross-country ski athletes. Each athlete undertook one VO2max test 10 days before the start of the training program, which was preset for each subject according to the general training methodology. Five (n = 5) training zones were determined for each athlete (45–100% of VO2max), namely: training zone 1: zone 1 (Z1, 45–65% of VO2max), training zone 2: zone 2 (Z2, 66–80% of VO2max), training zone 3: zone 3 (Z3, 81–87% of VO2max), training zone 4: zone 4 (Z4, 88–93% of VO2max) and training zone 5: zone 5 (Z5, 94–100% of VO2max) [19]. Morning heart rate (HR) and blood pressure (BP) were measured daily as part of the basic functional analysis over the pre-determined training period.
2.3. Maximum Rate of Oxygen Consumption during the Incremental Exercise Test (VO2max)
Each athlete performed the VO2max test by undertaking the Bruce Maximal Testing Protocol [20]. The test was applied using Cosmed Quark CPET equipment (Rome, Italy) and a Cosmos T150 running ergometer over seven effort stages (1 to 7), each consisting of 3 min lengths. The VO2max test was conducted after calibrating the Cosmed unit with known O2 (16%) and CO2 (4%) concentrations. The flow meter was calibrated at the start of each test using the Cosmed Syringe (3 L). The VO2max measurement was validated by applying the following criteria: respiratory exchange ratio (RER) >1.10, ±10 b/min of the predicted HRmax and/or ≤150 mL O2/min changes.
From the VO2max test data, the following parameters were of particular importance: maximum oxygen consumption (VO2max), maximum reached heart rate (HRmax), the ventilatory threshold 1 (VT1, b/min) and the ventilatory threshold 2 (VT2, b/min). The ventilator thresholds were determined by applying the V Slope method [21].
2.4. Training Monitoring
The training analysis was completed using the global positioning systems (GPS): Polar V800 (+/–2% error) (Kempele, Finland) and a Polar H7 Bluetooth HR monitor (Kempele, Finland). The following parameters were monitored during training: (1) heart rate (b/min, %), (2) distance (km), (3) movement speed (km/h), (4) time (min), (5) positive (Dif +) and (6) negative altitude gain (Dif −).
2.5. Training Periodization
Two training sessions (n = 2) were run each day during 33 of the 43 study days (76.74%). On each day that had two training sessions (T1 and T2), T1 was programed in the morning, whereas T2 was programed after a 6 to 8 h recovery period. Against the mean training volume (1033 km), a difference between 5 and 10% (51.6–103.3 km) was monitored between the study subjects.
Fifty four (n = 54) training sessions were conducted on skis, eleven sessions (n = 11) involved trail running, and five sessions (n = 5) were conducted on roller skis.
2.6. Basic Functional Analysis
Heart rate (HR) and blood pressure (BP) measurements were included in the study methodology as the basic functional analysis. Each measurement took place in the early morning. Heart rate (HR, b/min) and blood pressure (BP, mmHg) analyses were performed by applying an orthostatic test using the following methodology: 3 min supine positioning followed by HR measurement (sHR, b/min); 3 min orthostatic positioning followed by HR measurement (oHR, b/min). In addition to HR analysis, blood pressure (BP) was measured using an aneroid sphygmomanometer (mmHg) under the following protocol: 3 min supine positioning, followed by BP measurement (sSBP, mmHg, systolic blood pressure; sDBP, mmHg, diastolic blood pressure); 3 min orthostatic positioning followed by orthostatic BP measurement (systolic blood pressure, oSBP mmHg; diastolic blood pressure, oSBP, mmHg). At least two (n = 2) measurements were taken each time, resulting in a mean value if the first measurement did not exceed ±5 mmHg. If such a difference was obtained, a third measurement was conducted. Each measurement was repeated if the sounds were not clearly defined [22].
2.7. Secondary Measurements
By using ΔTA (difference between systolic blood pressure and mmHg) and ΔP (difference between heart rate values, b/min), the Crampton Index (CI) was calculated for each data set. Later, MAP (mean arterial pressure) was obtained by applying the following formula:
Equation (1). Formula used to calculate (a) the Crampton Index and (b) MAP:
The following criteria were used to interpret the Crampton Index: <50 (insufficient adaptation), 50–75 (poor adaptation), 75–100 (good adaptation), >100 (very good adaptation). The MAP normal range was considered to be between 70 and 110 mmHg [23,24].
2.8. Analysis
GraphPad Prism 5.0 software (GraphPad Software Inc., Sand Diego, CA, USA) was used for the statistical analysis. The main statistical indicators used to describe the sample were the mean and median values. The D’Agostino and Pearson normality test was applied for data normalization. The Wilcoxon matched pairs test was used to compare the evolution of one parameter, while through the Spearman test we calculated the correlation between two parameters. A two-tailed Mann–Whitney test was applied to identify the difference between two items. The significance level was set at α = 0.05, with a pre-determined confidence interval of 95% (CI95%).
3. Results
3.1. Effort Capacity
Individual effort capacity was assessed by performing incremental exercise testing. VO2peak reached a mean value of 78.86 mL/min/kg (74.6–82.3). VT1 was determined at 75.52% (73.2–78.9%), while VT2 was determined at 86.5% of HRmax (84.4–88.1%).
3.2. Training Effort Analysis
The physical training activity consisted of 1.033 km and 4.7432 min, respecting the general training guidance described in Table 1 for both the T1 and T2 training seasons. Of the training volume, 81.7% of the activity (843.961 km) was performed between 45–80% of VO2max, equivalent to the low aerobic effort training zone. Differences were monitored between T1 and T2 regarding the volume, specifically through effort time (minutes of effort), and distance (kilometers), along with altitude gain (meters) and mean effort HR (b/min) (Table 1).

Table 1.
General data indicating training (T1–T2) outcome.
3.3. Basic Functional Evaluation Data
The mean sHR value was determined at 54.2 b/min, while oHR reached 81.3 b/min (p = 0.01). The Crampton Index was calculated at 101.5 of the mean value, while both the sSBP and sDBP values (112.8 and 67.2 mmHg, respectively) were lower compared to the oSBP and oDBP measurements (117.6 and 79.6 mmHg, respectively) (p = 0.0017).
Training volume was correlated to both distance (p = 0.01, r = 0.85, CI95% = 0.80 to 0.88) and training HR%, namely the % from HRmax (p = 0.01, r = −0.47, CI95% = −0.58 to −0.34). Both the sHR and oHR values were significantly correlated with the training performed 12 h before the basic functional analysis. As a result, we obtained a statistically significant correlation between the analyzed sHR and oHR values and the training objective (p = 0.01). Based on the data, the athletes’ capacity to perform and maintain lower effort HR ranges was significantly correlated with both their sHR and oHR values (p = 0.01, r = −0.38, CI95% = −0.50 to −0.24), whereas T1 and T2 volume was significantly correlated with the Crampton Index (p = 0.001) (Figure 1).
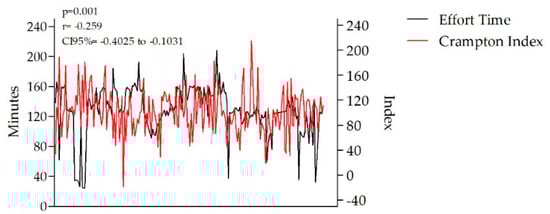
Figure 1.
Correlation between effort time and the Crampton Index (p = 0.001).
The T1 results were correlated with the Crampton Index, unlike the T2 training data. The measurements are illustrated in Table 2 for both training activities.
Table 2.
Comparative data for the T1 and T2 training activities and the Crampton Index.
The individual ability to perform over a predetermined HR range was correlated to training intensity, as shown through the specific training zones illustrated in Table 3. An inappropriate HR% range (>10%), contrary to the training objective, was correlated with increased sHR–oHR and sBP–oBP values (p = 0.0116, r = −0.21, CI95% = −0.38 to −0.04) during basic functional measurements.
Table 3.
sHR–oHR statistical analysis over training intensity (Z1–Z5).
Resting sHR and oHr were correlated with both sBP values (p = 0.0026, r = 0.21, CI95% = 0.07 to 0.35) and exercise HR (p = 0.0001, r = 0.293, CI95% = 0.149 to 0.424). No statistically significant findings (p > 0.05) were obtained between both sBP–oBP measurements and T1 volume (p = 0.553). Further, MAP failed to be correlated with T1 volume and training intensity (p > 0.05), except during high aerobic training (p = 0.007, r = −0.199, CI95% = −0.34 to −0.05). Yet, the SBP–DBP data was correlated with the effort HR (p = 0.0065, r = 0.23, CI95% = 0.06 to 0.39), while supine SBP–DBP results were correlated with mean effort HR (p = 0.0059, r = 0.23, CI95% = 0.06 to 0.39), as shown in Table 4 for SBP and Table 5 for DBP.
Table 4.
sSBP–oSBP statistical analysis of effort training intensities (Z1–Z5).
Table 5.
sDBP–oDBP statistical analysis of effort training intensities (Z1–Z5).
4. Discussion
In this study we chose to monitor the major physiological changes that occur during several training phases, including the low intensity–high volume stage and the high intensity–low volume stage. Starting from our hypothesis, the resting MAP, BP and HR values describe individual training-induced adaptations. Related articles have used HR and BP data to describe non-effort cardiovascular and nervous system recovery. However, a different approach was proposed when applying the current methodology.
Among the most common used physiological parameters, MAP, BP and HR are easy to monitor. In our results, HR, BP and MAP were correlated with the physical effort HR. A decrease in cardiovascular control, and possibly in power through muscle strength, may be associated with muscle fiber recruitment and neural adaptation. We believe, but did not demonstrate through the current methodology, that muscle fiber activation, overall fatigue and general physical stress induced the main changes in BP and HR, similar to the findings of Jing-Jing Wan et al. (2017) [25].
4.1. Physiological Induced Changes
Cardiac activity is defined as a repetitive electric wave measured through the number of contractions per time unit [26]. As described by Imai et al. (1994) [27], heart rate analysis during training can be used to evaluate vagal tone restoration, while continuous HR recovery is used to describe both parasympathetic and sympathetic activity [28].
Starting from the recovery stage and the individual effort capacity, HIT activity can induce changes in resting HR and BP values, similar to those found by Grace et al. (2018) [29]. By performing aerobic training, both the parasympathetic nerves and the stroke volume will improve resting HR values [30], while an enhanced peripheral vessel resistance can reduce BP over a short-term period [31]. According to Mont et al. (2009) [32], bradycardia is a parasympathetic-mediated adaptation, which was undefined in our results due to the training stage and the training volume. Based on our outcomes, both HR and BP measurements were linked to the subjects’ capacity to perform in the predetermined effort zones during several training stages.
4.2. Resting Heart Rate Measurement and Training
An advanced heart rate kinetic indicates training-induced sensitivity during various stages, as shown both in our results and in the outcomes from Nelson et al. (2014) [33]. Based on our findings, resting heart rate is significantly correlated with daily physical training intensity. During T1, aerobic training induced an increase in resting sHR, whereas both anaerobic and low aerobic training intensity were associated with lower resting heart rate values. This outcome is different to early findings regarding post-exercise HR [34]. Neural adaptations can induce changes in resting HR values. Therefore, the mechano-receptors could have caused changes in both muscle length and tension over T2 due to T1 training-induced fatigue. However, several papers have confirmed that aerobic physical exercise will drop resting HR values through parasympathetic tone [35].
From a general perspective, athlete adaptation can be influenced by both the volume and the physical effort intensity, as seen in oHR due to several hormonal- and neural-induced changes. Anaerobic and low aerobic training were related to a drop in oHR, while an increased oHR value was encountered when aerobic and high aerobic physical training was undertaken (T1). This outcome could be related to training-induced vascular adaptations, among which an increased blood flow could be obtained during both physical effort and resting periods [4]. During T2, low aerobic, aerobic and high aerobic activities were correlated with a drop in oHR, whereas anaerobic physical effort conducted during T2 was related to a higher oHR. This finding was similar to that of other papers, which confirmed the effect of aerobic physical effort on resting HR [36]. However, many other factors can also be involved, including the recovery process.
No statistically significant correlations (p > 0.05) were obtained between the high aerobic training zone and resting HR. Resting sHR was higher during T2 when related to aerobic, high aerobic and anaerobic physical training, whereas in T1, a drop in resting sHR was correlated with low aerobic training. As published by Oh et al. (2003) [37] and Fagard et al. (2003) [38], resting heart rate varies according to the training period. Therefore, early physical training conducted above VT1 was related to low sHR, while the same effort intensity conducted during T2 had the opposite effect, as confirmed in Table 2 and Table 3.
Increasing resting HR affected the individuals HR response during physical exercise, which is contrary to Bellenger et al. (2016) [39]. They confirmed that a slight but constant increase in HR may indicate training-induced fatigue, as seen in T2 compared to T1 over sHR unlike oHR. According to Thomson et al. (2016) [40], an increased resting heart rate may be associated with fatigue. However, our results seem to confirm the athletes’ ability to perform at high intensity based on HR control. A short distance HIT activity held during T2 was significantly correlated with increased HR and BP values 12 h post effort, similar to the findings of Guerra et al. (2014) [41], which illustrated similar changes in HR and no concerns in the BP analysis.
4.3. Blood Pressure and Mean Arterial Pressure Resting Measurements and Training
Following the study outcomes, a 4–10 mmHg increase in resting BP values was found as a result of aerobic training (81–87% of VO2max), unlike Chobanian et al. (2003) [42], who described a 4–9 mmHg drop during low intensity high volume training. Hanssen et al. (2017) [43] published a similar increase in resting blood pressure due to high intensity training (≥88% of VO2max). They concluded that improper volume and intensity staging can be identified early by analyzing HR and BP data during a 24 h period. Only a few papers have found similar outcomes during short periods of BP monitoring.
Bo-Ae Lee et al. (2016) [44] concluded that aerobic exercise induces a drop in both sBP and oBP, whereas post physical exercise values can be similar. Contrary to the main findings in the literature, sSBP failed to correlate with T1 training intensity. Aerobic intensity during T1 physical training was significantly correlated with oSBP, as Kelley et al. (2001) found [45]. Following a linear intensity guide, few changes were observed in SBP, while both DBP and MAP values remained the same or slightly dropped post physical exercise. Unlike Cornelissen et al. (2005) [46], low aerobic training intensity was correlated with an increased oSBP, whereas both aerobic and high aerobic training intensity were correlated with low measured values. The current study outcomes were different for T2 training, in that sSBP dropped if low aerobic training was performed, whereas aerobic physical effort induced an increased value. No statistically significant results were obtained in terms of oSBP values and both high intensity and low intensity effort during T2 training, while MAP values were not related to the time of physical exertion but to high aerobic training intensity. A possible explanation for this could be related to vascular modulation, increased vasodilatation capacity, and several changes in autonomic tone, which may help in reducing vascular resistance. Such an outcome could also be related to an improved vascular diameter, as seen in athletes compared to inactive subjects [47]. MAP was statistically correlated with physical exercise HR and aerobic volume, but no data were obtained showing a correlation between high aerobic or anaerobic training intensity and MAP values.
Our papers does confirm other recent findings in the literature regarding blood pressure and athlete performance [34,48].
4.4. Study Limitations
Lack of heart rate variability (HRV) monitoring is a limitation of the current research, while non-specific VO2max testing could have limited the current VO2max values. However, day by day training analysis in elite athletes is an important strength of the current study methodology as we applied specific training conditions, unlike previous research [2,49,50].
In future, we will propose a similar hypothesis but with several methodology changes. Among them, we would seek to conduct an advanced HR analysis by using: (1) HRV analysis, (2) continuous BP, (3) HR acceleration, and (4) HR recovery, in order to fully assess individual adaptation.
5. Conclusions
Heart rate and blood pressure measurements represent predictive functional adaptation parameters over different training phases. Based on our outcomes, we have highlighted a link between sHR, oHR, MAP, and athletes’ ability to perform at lower physical effort intensities. An increased resting HR value was related to an elevated physical effort HR, without any reported pace or intensity changes. However, oHR was significantly increased during T2 due to reduced recovery time between the first (day 1) and the second assessment (day 2), limiting HRmax during HIT training. Further, oHR was associated with HIT training during T2, whereas MAP was not validated as a possible cardiovascular stress indicator following high intensity training.
Further data is needed to understand the performance drop, along with the HRmax limitation over maximal effort, and its relationship with both the training stage and the individual effort capacity.
Author Contributions
S.A.M. and R.M.H. have contributed equally in the paper conceptualization, writing, original draft preparation, writing-review & editing, visualization, study methodology, software use, validation, formal analysis, investigation and resources. Supervision was carried out by Dan Dobreanu from the Department of Physiology, University of Medicine Pharmacy Science and Technology Târgu Mureș, Romania.
Funding
This research received no external funding.
Acknowledgments
The authors of this papers will like to thank the coaches and the athletes for their compliance during the study period. Partial results from this paper are used in the first author’s doctoral thesis.
Conflicts of Interest
There are no conflicts of interest.
References
- Martindale, R.; Nash, C. Sport Science Relevance and Application: Perceptions of UK Coaches. J. Sports Sci. 2013, 31, 807–819. [Google Scholar] [CrossRef] [PubMed]
- Semin, K.; Stahlnecker, A.C., IV; Heelan, K.; Brown, G.A.; Shaw, B.S.; Shaw, I. Discrepancy between Training, Competition and Laboratory Measures of Maximum Heart Rate in NCAA Division 2 Distance Runners. J. Sport Sci. Med. 2008, 7, 455–460. [Google Scholar]
- Lindenthaler, J.R.; Rice, A.J.; Versey, N.G.; McKune, A.J.; Welvaert, M. Differences in Physiological Responses During Rowing and Cycle Ergometry in Elite Male Rowers. Front. Physiol. 2018, 9, 1010. [Google Scholar] [CrossRef] [PubMed]
- Green, D.J.; Hopman, M.T.E.; Padilla, J.; Laughlin, M.H.; Thijssen, D.H.J. Vascular Adaptation to Exercise in Humans: Role of Hemodynamic Stimuli. Physiol. Rev. 2017, 97, 495–528. [Google Scholar] [CrossRef] [PubMed]
- Laughlin, M.H.; Roseguini, B. Mechanisms for Exercise Training-Induced Increases in Skeletal Muscle Blood Flow Capacity: Differences with Interval Sprint Training versus Aerobic Endurance Training. J. Physiol. Pharmacol. 2008, 59, 71–88. [Google Scholar] [PubMed]
- Sloan, R.P.; Shapiro, P.A.; DeMeersman, R.E.; Bagiella, E.; Brondolo, E.N.; McKinley, P.S.; Slavov, I.; Fang, Y.; Myers, M.M. The effect of aerobic training and cardiac autonomic regulation in young adults. Am. J. Public Health, 2009; 99, 921–928. [Google Scholar] [CrossRef]
- Dong, J.G. The Role of Heart Rate Variability in Sports Physiology (Review). Exp. Ther. Med. 2016, 11, 1531–1536. [Google Scholar] [CrossRef] [PubMed]
- Suzic Lazic, J.; Dekleva, M.; Soldatovic, I.; Leischik, R.; Suzic, S.; Radovanovic, D.; Djuric, B.; Nesic, D.; Lazic, M.; Mazic, S. Heart Rate Recovery in Elite Athletes: The Impact of Age and Exercise Capacity. Clin. Physiol. Funct. Imaging 2017, 37, 117–123. [Google Scholar] [CrossRef]
- Sammito, S.; Böckelmann, I. Factors Influencing Heart Rate Variability. Int. Cardiovasc. Forum J. 2016, 11, e32–e40. [Google Scholar] [CrossRef]
- Fatisson, J.; Oswald, V.; Lalonde, F. Influence Diagram of Physiological and Environmental Factors Affecting Heart Rate Variability: An Extended Literature Overview. Heart Int. 2016, 11, e32–e40. [Google Scholar] [CrossRef]
- Wielemborek-Musial, K.; Szmigielska, K.; Leszczynska, J.; Jegier, A. Blood Pressure Response to Submaximal Exercise Test in Adults. BioMed Res. Int. 2016, 3, 176–187. [Google Scholar] [CrossRef]
- Sharman, J.E.; Lagerche, A. Exercise Blood Pressure: Clinical Relevance and Correct Measurement. J. Hum. Hypertens. 2015, 29, 351–358. [Google Scholar] [CrossRef] [PubMed]
- Foster, C.; Farl, C.V.; Guidotti, F.; Harbin, M.; Roberts, B.; Schuette, J.; Tuuri, A.; Doberstein, S.T.; Porcari, J.P. The Effects of High Intensity Interval Training vs Steady State Training on Aerobic and Anaerobic Capacity. J. Sport Sci. Med. 2015, 14, 747–755. [Google Scholar]
- Bellenger, C.R.; Thomson, R.L.; Howe, P.R.C.; Karavirta, L.; Buckley, J.D. Monitoring Athletic Training Status Using the Maximal Rate of Heart Rate Increase. J. Sci. Med. Sport 2016, 19, 590–595. [Google Scholar] [CrossRef] [PubMed]
- Schneider, C.; Hanakam, F.; Wiewelhove, T.; Döweling, A.; Kellmann, M.; Meyer, T.; Pfeiffer, M.; Ferrauti, A. Heart Rate Monitoring in Team Sports—A Conceptual Framework for Contextualizing Heart Rate Measures for Training and Recovery Prescription. Front. Physiol. 2018, 9, 639. [Google Scholar] [CrossRef]
- Reimers, A.; Knapp, G.; Reimers, C.-D. Effects of Exercise on the Resting Heart Rate: A Systematic Review and Meta—Analysis of Interventional Studies. J. Clin. Med. 2018, 7, 503. [Google Scholar] [CrossRef]
- Sylta, Ø.; Tønnessen, E.; Hammarström, D.; Danielsen, J.; Skovereng, K.; Ravn, T.; Rønnestad, B.R.; Sandbakk, Ø.; Seiler, S. The Effect of Different High-Intensity Periodization Models on Endurance Adaptations. Med. Sci. Sports Exerc. 2016, 48, 2165–2174. [Google Scholar] [CrossRef]
- MacInnis, M.J.; Gibala, M.J. Physiological adaptations to interval training and the role of exercise intensity. J. Physiol. 2017, 595, 2915–2930. [Google Scholar] [CrossRef]
- Seiler, S. What Is Best Practice for Training Intensity and Duration Distribution in Endurance Athletes? Int. J. Sports Physiol. Perform. 2010, 5, 276–291. [Google Scholar] [CrossRef]
- Noonan, V.; Dean, E. Submaximal exercise testing: Clinical application and interpretation. Phys. Ther. 2000, 80, 782–807. [Google Scholar]
- Beaver, W.L.; Wasserman, K.; Whipp, B.J. A New Method for Detecting Anaerobic Threshold by Gas Exchange. J. Appl. Physiol. 2017, 60, 2020–2027. [Google Scholar] [CrossRef]
- Shahbabu, B.; Dasgupta, A.; Sarkar, K.; Sahoo, S.K. Which Is More Accurate in Measuring the Blood Pressure? A Digital or an Aneroid Sphygmomanometer. J. Clin. Diagn. Res. 2016, 10, LC11–LC14. [Google Scholar] [CrossRef]
- Dziuda, Ł.; Krej, M.; Śmietanowski, M.; Sobotnicki, A.; Sobiech, M.; Kwaśny, P.; Brzozowska, A.; Baran, P.; Kowalczuk, K.; Skibniewski, F.W. Development and Evaluation of a Novel System for Inducing Orthostatic Challenge by Tilt Tests and Lower Body Negative Pressure. Sci. Rep. 2018, 8, 7793. [Google Scholar] [CrossRef] [PubMed]
- Danielsen, R. Blood Pressure Measurement. Essent. Clin. Proced. 2007. [Google Scholar] [CrossRef]
- Wan, J.J.; Qin, Z.; Wang, P.Y.; Sun, Y.; Liu, X. Muscle Fatigue: General Understanding and Treatment. Exp. Mol. Med. 2017, 49, e384. [Google Scholar] [CrossRef] [PubMed]
- Acharya, U.R.; Joseph, K.P.; Kannathal, N.; Lim, C.M.; Suri, J.S. Heart Rate Variability: A Review. Med. Biol. Eng. Comput. 2006, 44, 1031–1051. [Google Scholar] [CrossRef] [PubMed]
- Imai, K.; Sato, H.; Hori, M.; Kusuoka, H.; Ozaki, H.; Yokoyama, H.; Takeda, H.; Inoue, M.; Kamada, T. Vagally Mediated Heart Rate Recovery after Exercise Is Accelerated in Athletes but Blunted in Patients with Chronic Heart Failure. J. Am. Coll. Cardiol. 1994, 24, 1529–1535. [Google Scholar] [CrossRef]
- Niewiadomski, W.; Gasiorowska, A.; Krauss, B.; Mróz, A.; Cybulski, G. Suppression of Heart Rate Variability after Supramaximal Exertion. Clin. Physiol. Funct. Imaging 2007, 27, 309–319. [Google Scholar] [CrossRef] [PubMed]
- Grace, F.; Herbert, P.; Elliott, A.D.; Richards, J.; Beaumont, A.; Sculthorpe, N.F. High Intensity Interval Training (HIIT) Improves Resting Blood Pressure, Metabolic (MET) Capacity and Heart Rate Reserve without Compromising Cardiac Function in Sedentary Aging Men. Exp. Gerontol. 2018, 109, 75–81. [Google Scholar] [CrossRef]
- Riebe, D.; Franklin, B.A.; Thompson, P.D.; Garber, C.E.; Whitfield, G.P.; Magal, M.; Pescatello, L.S. Updating ACSM’s Recommendations for Exercise Preparticipation Health Screening. Med. Sci. Sports Exerc. 2015, 47, 2473–2479. [Google Scholar] [CrossRef]
- Guimarães, G.V.; Ciolac, E.G.; Carvalho, V.O.; D’Avila, V.M.; Bortolotto, L.A.; Bocchi, E.A. Effects of Continuous vs. Interval Exercise Training on Blood Pressure and Arterial Stiffness in Treated Hypertension. Hypertens. Res. 2010, 33, 627–632. [Google Scholar] [CrossRef] [PubMed]
- Mont, L.; Elosua, R.; Brugada, J. Endurance Sport Practice as a Risk Factor for Atrial Fibrillation and Atrial Flutter. Europace 2009, 11, 11–17. [Google Scholar] [CrossRef] [PubMed]
- Nelson, M.J.; Thomson, R.L.; Rogers, D.K.; Howe, P.R.C.; Buckley, J.D. Maximal Rate of Increase in Heart Rate during the Rest-Exercise Transition Tracks Reductions in Exercise Performance When Training Load Is Increased. J. Sci. Med. Sport 2014, 17, 129–133. [Google Scholar] [CrossRef] [PubMed]
- Berge, H.M.; Isern, C.B.; Berge, E. Blood Pressure and Hypertension in Athletes: A Systematic Review. Br. J. Sports Med. 2015, 49, 716–723. [Google Scholar] [CrossRef] [PubMed]
- Shahraki, M.R.; Mirshekari, H.; Shahraki, A.R.; Shahraki, E.; Naroi, M. Arterial Blood Pressure in Female Students before, during and after Exercise. ARYA Atheroscler. 2012, 8, 12–15. [Google Scholar] [PubMed]
- Cornelissen, V.A.; Verheyden, B.; Aubert, A.E.; Fagard, R.H. Effects of Aerobic Training Intensity on Resting, Exercise and Post-Exercise Blood Pressure, Heart Rate and Heart-Rate Variability. J. Hum. Hypertens. 2010, 24, 175–182. [Google Scholar] [CrossRef] [PubMed]
- Oh, D.-J.; Hong, H.-O.; Lee, B.-A. The Effects of Strenuous Exercises on Resting Heart Rate, Blood Pressure, and Maximal Oxygen Uptake. J. Exerc. Rehabil. 2016, 12, 42. [Google Scholar] [CrossRef] [PubMed]
- Fagard, R. Athlete’s Heart. Heart 2003, 12, 42–46. [Google Scholar] [CrossRef] [PubMed]
- Bellenger, C.R.; Fuller, J.T.; Thomson, R.L.; Davison, K.; Robertson, E.Y.; Buckley, J.D. Monitoring Athletic Training Status Through Autonomic Heart Rate Regulation: A Systematic Review and Meta-Analysis. Sports Med. 2016, 46, 1461–1486. [Google Scholar] [CrossRef]
- Thomson, R.L.; Bellenger, C.R.; Howe, P.R.C.; Karavirta, L.; Buckley, J.D. Improved Heart Rate Recovery despite Reduced Exercise Performance Following Heavy Training: A within-Subject Analysis. J. Sci. Med. Sport 2016, 19, 255–259. [Google Scholar] [CrossRef]
- Guerra, Z.F.; Peçanha, T.; Moreira, D.N.; Silva, L.P.; Laterza, M.C.; Nakamura, F.Y.; Lima, J.R.P. Effects of Load and Type of Physical Training on Resting and Postexercise Cardiac Autonomic Control. Clin. Physiol. Funct. Imaging 2014, 34, 114–120. [Google Scholar] [CrossRef]
- Chobanian, A.V.; Bakris, G.L.; Black, H.R.; Cushman, W.C.; Green, L.A.; Izzo, J.L.; Jones, D.W.; Materson, B.J.; Oparil, S.; Wright, J.T.; et al. Seventh Report of the Joint National Committee on Prevention, Detection, Evaluation, and Treatment of High Blood Pressure. Hypertension 2003, 42, 1206–1252. [Google Scholar] [CrossRef] [PubMed]
- Hanssen, H.; Minghetti, A.; Magon, S.; Rossmeissl, A.; Papadopoulou, A.; Klenk, C.; Schmidt-Trucksäss, A.; Faude, O.; Zahner, L.; Sprenger, T.; et al. Superior Effects of High-Intensity Interval Training vs. Moderate Continuous Training on Arterial Stiffness in Episodic Migraine: A Randomized Controlled Trial. Front. Physiol. 2017, 8, 1086. [Google Scholar] [CrossRef] [PubMed]
- Lee, B.-A.; Oh, D.-J. The Effects of Long-Term Aerobic Exercise on Cardiac Structure, Stroke Volume of the Left Ventricle, and Cardiac Output. J. Exerc. Rehabil. 2016, 12, 37–41. [Google Scholar] [CrossRef] [PubMed]
- Kelley, G.A.; Kelley, K.A.; Vu Tran, Z. Aerobic Exercise and Resting Blood Pressure: A Meta-Analytic Review of Randomized, Controlled Trials. Prev. Cardiol. 2001, 4, 73–80. [Google Scholar] [CrossRef] [PubMed]
- Cornelissen, V.A.; Fagard, R.H. Effects of Endurance Training on Blood Pressure, Blood Pressure-Regulating Mechanisms, and Cardiovascular Risk Factors. Hypertension 2005, 46, 667–675. [Google Scholar] [CrossRef] [PubMed]
- Green, D.J.; Spence, A.; Rowley, N.; Thijssen, D.H.J.; Naylor, L.H. Vascular Adaptation in Athletes: Is There an “Athlete’s Artery”? Exp. Physiol. 2012, 97, 295–304. [Google Scholar] [CrossRef] [PubMed]
- Mazic, S.; Suzic Lazic, J.; Dekleva, M.; Antic, M.; Soldatovic, I.; Djelic, M.; Nesic, D.; Acimovic, T.; Lazic, M.; Lazovic, B.; et al. The Impact of Elevated Blood Pressure on Exercise Capacity in Elite Athletes. Int. J. Cardiol. 2015, 180, 171–177. [Google Scholar] [CrossRef] [PubMed]
- Boudet, G.; Garet, M.; Bedu, M.; Albuisson, E.; Chamoux, A. Median Maximal Heart Rate for Heart Rate Calibration in Different Conditions: Laboratory, Field and Competition. Int. J. Sports Med. 2002, 23, 290–297. [Google Scholar] [CrossRef]
- McDonald, K.G.; Grote, S.; Shoepe, T.C. Effect of Training Mode on Post-Exercise Heart Rate Recovery of Trained Cyclists. J. Hum. Kinet. 2014, 41, 43–49. [Google Scholar] [CrossRef]

© 2019 by the authors. Licensee MDPI, Basel, Switzerland. This article is an open access article distributed under the terms and conditions of the Creative Commons Attribution (CC BY) license (http://creativecommons.org/licenses/by/4.0/).