Abstract
This study aimed to describe and assess differences among playing positions, to determine playing position profiles, and to analyze the relationships between the change-of-direction deficit (CODD) percentage and the other anthropometric and performance variables. A total of 98 young futsal players (age: 17 ± 1 years) from the highest national level in Spain were assessed using a cross-sectional design. Anthropometric variables such as height and body mass were recorded. The performance tests included countermovement jumps; horizontal jumps; sprint tests (10 m and 25 m); change-of-direction (COD) tests, including a 10 m test with one COD of 180° (COD180) and a 25 m test with 4 CODs (V-cut); and the percentage CODD. Furthermore, asymmetries were recorded. The group comparisons were considered statistically significant at p ≤ 0.05 and were supported by the effect sizes and mean differences. Significant differences were found among playing positions, showing that pivots and goalkeepers were significantly taller than left- and right-wingers and defenders (p < 0.05, effect size (ES) = −1.42 to 0.72). Goalkeepers were significantly slower than the rest of the positions in COD180 to the left (p < 0.05, ES = 1.32 to 1.89). A very large association was found between the CODDs of 25 m and 25 m (p < 0.001; r = −0.72). These results suggest that pivots and goalkeepers are taller and larger than the other players. However, aside from goalkeepers, no differences in performance variables were observed among the outfield players. In addition, a lower %CODD is associated with a faster COD performance, highlighting its importance in training.
1. Introduction
Futsal is a high-intensity, intermittent sport that demands a combination of technical, tactical, and physical attributes from its players [1]. The game is played on a court measuring 40 m × 20 m, with 3 m × 2 m goals, and consists of two teams of five players, including a goalkeeper [2]. Matches are played in two 20 min halves with stopped time, and substitutions are unlimited, allowing continuous player rotation [3]. Due to the confined playing space and rapid transitions, futsal requires players to possess exceptional change-of-direction (COD) abilities, speed, and power to maintain a high performance throughout the match [4].
Recent studies have examined the fitness profiles of futsal players across different competitive levels and genders, highlighting their anthropometric characteristics and physical attributes such as their jump performance (CMJ height: 25.7 cm to 37.7 cm), sprint times (10 m: 1.74 s to 1.98 s), and COD ability (505 COD: 2.81 s to 2.91 s), which are commonly associated with a higher competitive performance [5,6,7]. Although not significantly different between senior and junior futsal players, anthropometric variables show that seniors tend to have a greater lean body mass, likely due to prolonged exposure to systematic training, which contributes to an improved physical performance [7]. However, an excessive body fat percentage has been negatively correlated with futsal-specific agility and reactive strength (p < 0.01), highlighting its detrimental impact on high-intensity movements such as sprinting, jumping, and rapid CODs [8]. In terms of physical capacities, Sekulic et al. showed that top-level players outperform high-level players in key fitness attributes such as their reactive strength index (163 index vs. 140 index), broad jump (248 cm vs. 235 cm), and kicking speed (96–108 km/h vs. 91–104 km/h), as well as futsal-specific reactive agility, particularly when dribbling the ball (2.52 s vs. 2.66 s) (p < 0.05) [8]. Moreover, differences between elite and sub-elite players have been identified, particularly in aerobic fitness, acceleration, and strength levels, which are determinants for performance at higher levels of competition [9]. Importantly, comparisons among playing positions have also revealed distinct anthropometric and physical demands. Gadea-Uribarri et al. (2025) observed that pivots accumulated the lowest external load values across a competitive microcycle, while wings and defenders experienced the highest values in variables such as accelerations and decelerations [10]. Goalkeepers and pivots often present a higher body mass and lower acceleration demands due to their tactical roles [5]. These position-specific differences highlight the relevance of analyzing physical profiles by playing position in order to individualize training interventions and performance monitoring [11]. To the best of our knowledge, no study has specifically analyzed the anthropometric and performance profiles of young male futsal players by playing position, limiting the current understanding of their developmental needs, position-specific physical demands, and implications for individualized training and injury prevention strategies.
One of futsal’s most critical performance determinants is the ability to execute rapid COD maneuvers, as players frequently adjust their positioning in response to dynamic game situations [12]. Given the high frequency of COD actions in futsal, optimizing this ability is essential for improving movement efficiency and game performance. Studies have shown that futsal players are generally more efficient at changing direction than soccer players (ES = 1.11), though they exhibit similar COD performance metrics to other team-sport athletes, such as rugby and handball players (p > 0.05) [13]. To better quantify COD ability, the COD deficit (CODD) concept has been introduced as an alternative to traditional time-based measures. The CODD is the difference between the time taken to complete a specific distance, including a COD maneuver, and the time required to sprint the same distance in a straight line [14]. More recently, the CODD percentage (%CODD) has been proposed as a normalized metric, providing a percentage-based perspective of this difference, which allows for a more accurate evaluation of an athlete’s COD efficiency relative to their linear speed [15]. This approach mitigates potential misinterpretations when comparing athletes with different sprinting abilities, making the %CODD a more relevant metric for coaches and practitioners. Despite its increasing application in soccer, no study is currently analyzing the relationship between the CODD and performance variables in futsal.
Despite the growing literature on futsal performance [5,16,17], limited research has been conducted on the young male futsal population. Understanding young futsal players’ anthropometric and performance profiles is essential for optimizing training programs, identifying talent, and implementing evidence-based injury prevention strategies. Most studies have focused on senior or elite-level athletes [5,16,18,19], overlooking the developmental characteristics of younger populations, whose physical and neuromuscular adaptations may differ significantly due to growth, maturation, and training exposure. This is particularly relevant in youth players, whose bodies are still adapting physically and neuromuscularly to training demands. During this stage, mismatches in the development of bones, muscles, and tendons may contribute to asymmetries, flexibility limitations, or reduced motor control [20,21], ultimately increasing their susceptibility to musculoskeletal overuse injuries [22]. Monitoring biomechanical variables such as interlimb asymmetries and the CODD from an early stage may help anticipate the injury risk and guide preventive strategies tailored to individual maturation profiles [23]. Notably, asymmetries exceeding 15% in the unilateral CMJ height have been prospectively linked to an increased incidence of lower-limb injuries in youth athletes [23,24,25].
Furthermore, although the change-of-direction deficit (CODD) has been widely examined in soccer, its applicability and relevance in futsal remain unclear, given the sport’s unique movement demands and court dimensions. Without a clear understanding of how the CODD interacts with key performance determinants in young futsal players, coaches and practitioners may lack the necessary insights to develop effective training interventions that enhance the CODD efficiency and overall performance. Similarly, interlimb asymmetries, frequently associated with an increased risk of injury, remain understudied in youth futsal, despite their potential impact on movement efficiency and physical balance. It is hypothesized that physical and anthropometric characteristics differ across playing positions, and that both CODD and inter-limb asymmetries show significant relationships with selected physical performance variables. Therefore, the current study aimed to assess playing position differences, determine playing position profiles, and analyze the relationships among the %CODD, interlimb asymmetries, and the remaining anthropometric and performance variables.
2. Materials and Methods
2.1. Participants
This study included ninety-eight highly-trained young futsal players (17 ± 1) (TIER 3) [26]. A preliminary power analysis was conducted to determine the number of participants using the GPower software (version 3.1.9.3, based in Düsseldorf, Germany). A one-way ANOVA with five groups was used, considering an effect size of 0.5, a significance level (alpha) of 0.05, and a statistical power of 95%. The analysis determined that 80 subjects were required; our final sample exceeded this requirement, ensuring a greater robustness in the analysis. The local ethics committee approved the study (C.P.–C.I PI24/137, act n°07/2024, CEICA, Zaragoza, Spain) and followed the Declaration of Helsinki. The participants signed an informed consent form, and for underage players, their parents or legal guardians also signed the data consent form.
2.2. Study Design
This study investigated the physical characteristics of young futsal players from eight teams competing at Spain’s highest national young level (Young Honor Division Group VI). They followed a standardized weekly training schedule consisting of three futsal-specific sessions (each lasting 90 min) and one official match per week (40 min of stopped-clock time), totaling 4.5 h of training. The training methodology and volume were consistent across all teams, and all players actively competed during the data collection period. The inclusion criteria were as follows: (1) an age between 17 and 19 years; (2) participation in the highest national futsal category; and (3) no injuries in the month before testing. The exclusion criteria included the following: (1) not being an active team player and (2) suffering an injury during the month prior to the evaluations. The participants were grouped according to their on-field positions, which constituted the main independent variable of the study: goalkeeper (n = 15), defender (n = 22), winger—left (n = 16), winger—right (n = 27), and pivot (n = 18). In total, 104 players were assessed for eligibility. Of these, 6 were excluded due to recent injuries, leaving a final sample of 98 participants who met all criteria and completed all assessments. A descriptive analysis was carried out to define and characterize the physical profile of these athletes. To this end, a cross-sectional design was used to systematically evaluate the differences in physical variables among players of different playing positions. The relationship between the percentage change in the directional deficit and the other anthropometric and performance variables was also analyzed.
To obtain a more detailed picture of the physical profile of the participants, 98 players were assessed through a series of anthropometric measurements and physical performance tests. The anthropometric assessments included height, body mass, and a body composition analysis. On the other hand, physical performance was assessed through specific tests, such as the bilateral and unilateral countermovement jump (CMJ) tests, the bilateral and unilateral horizontal jump (HJ) tests, the 10 m and 25 m sprint tests, the 180° change-of-direction test (COD180). and the V-cut test.
2.3. Procedures
To reduce the risk of fatigue, the participants were instructed to refrain from strenuous physical activity for 48 h prior to testing. They were also reminded of the importance of maintaining proper nutrition and hydration throughout this period to ensure optimal testing conditions. Furthermore, as all participants had previously performed these assessments on a minimum of five occasions, they were well-acquainted with the testing procedures, thereby minimizing potential learning effects. Prior to the assessments, a dynamic warm-up aligned with the RAMP framework (raise, activate, mobilize, and potentiate) was conducted [27]. The tests were conducted on an indoor futsal court using players’ own futsal-specific footwear. The same lead researcher conducted and supervised all assessments to ensure consistency of data collection. The order of execution was the bilateral and unilateral CMJs, the bilateral and unilateral HJs, the sprint tests (10 m and 25 m), the COD180, and the V-cut test. All technologies used for data collection have been previously validated and included the MyJump2 app for a vertical jump assessment and Witty photocell timing gates (Microgate, Bolzano, Italy) for the sprint and COD tests. Reliability was ensured through intra-rater consistency, with high intraclass correlation coefficients (ICC = 0.89 to 0.98) and low coefficients of variation (CV = 0.6 to 5.7%) across all tests, as detailed in each subsection.
2.3.1. Bilateral and Unilateral Countermovement Jumps
The participants performed the countermovement jump (CMJ) tests with their hands on their hips to prevent arm swing. A countermovement was allowed before take-off, ensuring full extension of the hip, knee, and ankle during the flight phase. The testing sequence began with the bilateral CMJ, in which two trials were performed, with 45 s of rest between attempts. The best result was recorded for the analysis. Following this, the unilateral CMJ was performed, first with the left leg and then with the right leg. In this test, the participants jumped on one leg while keeping the opposite leg flexed at 90° at the hip and knee, avoiding any swinging or balance-assisting movement. The best value for each leg was recorded to assess the interlimb asymmetry. A trial was considered invalid if the participant failed to maintain proper posture or did not land on the same leg.
All jumps were analyzed using an iPhone 12 and the MyJump2 app, a scientifically validated and reliable application [28,29] that calculates the jump height based on the flight time. To ensure methodological consistency, all CMJ data were collected and analyzed by the same researcher. The intraclass correlation coefficient (ICC) was 0.90–0.98, and the coefficient of variation (CV) was 1.7–5.7%. The calculation of interlimb asymmetry was performed using the following equation [30]:
Interlimb asymmetry = 100/Max Value (right and left) × Min Value (right and left) × −1 + 100.
2.3.2. Bilateral and Unilateral Horizontal Jumps
The HJ test was conducted from a static position using both legs. The participants were required to land stably without losing balance. The use of arms was allowed during this test [31]. The HJ performance was assessed using a standard tape measure to record the distance covered. The total distance covered was recorded. Two valid attempts were recorded for each leg, with 45 s of rest between jumps, and the best result was used for further analysis. The testing sequence always began with the bilateral HJ, followed by the unilateral HJ with the left leg, and then with the right leg. A unilateral HJ was also performed. The participants were allowed to use arm swing and their free leg for propulsion, ensuring a stable landing on the jumping leg. Interlimb asymmetry was calculated using the formula by Bishop et al. [30]. The ICC values were 0.91–0.93 and the CVs were 1.7–2%. The participants performed the test with both legs while keeping their hands on their hips to prevent arm movement. A countermovement was allowed before take-off, ensuring the full extension of the hip, knee, and ankle during the jump. Two trials were performed, with 45 s of rest.
2.3.3. 10 m and 25 m Sprint Test
The sprint speed was evaluated with a 25 m straight sprint test, which also provided a 10 m split time. The sprint times were measured using a dual-beam photocell system (Witty, Microgate, Bolzano, Italy). The participants started from a 2-point staggered stance, positioning their lead foot 0.5 m behind the initial timing gate. The photocells were set at a height of 0.75 m and spaced 1.5 m apart. Each participant completed the 25 m sprint twice, with a minimum of 3 min of passive rest between attempts. The fastest trial was retained for the analysis. The reliabilities were 0.89–0.95 and 0.8–1.3% for the ICCs and CVs, respectively.
2.3.4. Change of Direction—180° and COD Deficit
A 10 m shuttle run with a 180° direction change was used to assess the COD ability (COD180 test). The players started in a two-point staggered stance, 0.5 m behind the first timing gate (0 m). They sprinted 5 m forward, planted and turned 180° off one leg, and sprinted 5 m back to the start/finish line. Two trials were completed using a turn off the left leg and two off the right leg, in alternating order. There was a 2 min rest between each trial. The fastest trial for each turning leg was recorded, yielding two performance metrics: COD180L (turn off the left leg) and COD180R (turn off the right leg). Timing gates (Witty, Microgate) at the start/finish captured the total time. The test reliability was high (ICC = 0.91–0.93; CV = 1.1–1.5%). The interlimb asymmetry was calculated using the equation proposed by Bishop et al. [30]. In addition, the change-of-direction deficit for the 180° test was computed as a percentage, following Nimphius et al. [14], to quantify the performance decrement due to the direction change. The percentage COD deficit for each leg was calculated using the following formula:
((COD time − 10 m sprint time)/10 m sprint time) × 100
2.3.5. V-Cut Test and COD Deficit 25
To assess the multidirectional agility, a 25 m V-cut test was performed, in which the players executed four 45° directional changes spaced every 5 m. The test started from a two-point staggered stance, with the front foot positioned 0.5 m behind the timing system. Photocells (Witty, Microgate, Bolzano, Italy) were placed at both the starting and finishing lines, set at a height of 0.75 m and spaced 1.5 m apart. For a trial to be valid, the participants were required to step entirely over a marked floor line with at least one foot at each change of direction. Attempts not meeting this criterion were repeated. Each athlete completed two valid trials with three minutes of passive recovery between them, and the fastest time was used for the analysis. The test demonstrated an excellent reliability, with ICC values of 0.95 and a coefficient of variation (CV) of 0.6%. The change-of-direction deficit was calculated as a percentage using the standard equation previously described in the literature [14]:
((V-cut time − 25 m sprint time)/25 m sprint time) × 100
2.4. Statical Analysis
All data were analyzed using IBM SPSS Statistics (version 25, IBM, New York, NY, USA) and Microsoft Excel (version 2016, Microsoft Corp., Redmond, WA, USA). Descriptive statistics are reported as the mean ± standard deviation (SD). The within-session reliability was assessed using the coefficients of variation (CVs) and intraclass correlation coefficients (ICCs), calculated through a spreadsheet specifically designed for this purpose. The distribution of the data was assessed using the Kolmogorov–Smirnov test. All variables met the assumption of normality except for the interlimb asymmetries in the COD and CODD. Levene’s test was used to evaluate the homogeneity of variances (homoscedasticity). To examine differences across playing positions (left-wingers, right-wingers, pivots, defenders, and goalkeepers), a one-way analysis of variance (ANOVA) was conducted. When significant main effects were found (p < 0.05), Bonferroni’s post hoc test was used to identify specific pairwise differences. For variables not fulfilling the assumptions of normality—specifically, the interlimb asymmetries in the COD and CODD—a nonparametric Kruskal–Wallis test was employed (p < 0.05). Effect sizes for the ANOVA were calculated using eta-squared (η2), with the thresholds interpreted as small (>0.01), medium (>0.06), and large (>0.14). Cohen’s d was also computed based on the pooled standard deviation to determine the magnitude of positional differences, with cut-offs set at >0.2 (small), >0.5 (moderate), and >0.8 (large). To explore associations between physical performance variables and the percentage-based change-of-direction deficits (CODD) for the right and left legs, as well as the V-cut test, Pearson’s correlation coefficients (r) were calculated. The strength of these correlations was interpreted using the following scale: ≤0.1 (trivial), >0.1–0.3 (small), >0.3–0.5 (moderate), >0.5–0.7 (large), >0.7–0.9 (very large), and >0.9–1.0 (almost perfect) [32]. Confidence intervals at 95% (95% CI) were reported for both the effect sizes and the correlation coefficients.
3. Results
The descriptive data of the players are provided in Table 1.

Table 1.
Physical and performance characteristics of elite youth male futsal players by playing position (mean ± SD).
The analysis of variance revealed significant differences among playing positions for several variables. Regarding the anthropometric characteristics, differences were found for the age (F = 3.95, p < 0.05, η2 = 0.14 [95% CI: 0.02–0.25]), height (F = 6.62, p < 0.001, η2 = 0.22 [0.07–0.33]), and body mass (F = 8.99, p < 0.001, η2 = 0.28 [0.11–0.39]). The post hoc comparisons indicated that pivots and goalkeepers were significantly taller than left- and right-wingers and defenders (p < 0.05, ES = −1.42 to 0.72), while goalkeepers had a significantly higher body mass than all the other outfield positions (p < 0.05, ES = −1.49 to 0.95). In addition, pivots were significantly heavier than right-wingers (p < 0.05, ES = −1.28).
In performance-related variables, significant differences were observed for the CODL (F = 8.36, p < 0.001, η2 = 0.26 [0.09–0.38]), CODR (F = 2.64, p = 0.039, η2 = 0.10 [0.00–0.19]), and V-cut test (F = 3.21, p = 0.016, η2 = 0.12 [0.00–0.24]). Specifically, left-wingers performed significantly better than goalkeepers for both the CODR and V-cut (p < 0.05, ES = 1.05 to 1.22), while goalkeepers were significantly slower than all other positions for CODL (p < 0.05, ES = 1.32 to 1.89).
In terms of the relationships between the change-of-direction deficit variables and performance outcomes (Figure 1), CODDL showed moderate correlations with the CODD25, the V-cut, and the 10 m sprint times (p < 0.05; r = −0.49 to 0.49), and large correlations with the CODL and CODDR (p < 0.001; r = 0.58 to 0.60). The CODDR was moderately associated with the V-cut and 10 m (p < 0.001; r = −0.42 to 0.43) and strongly correlated with the CODD25 and CODR (p < 0.001; r = 0.60 to 0.64). The CODD25 showed moderate relationships with both the V-cut and 10 m (p < 0.001; r = −0.40 to 0.39), and a very large correlation with the 25 m sprint (p < 0.001; r = −0.72).
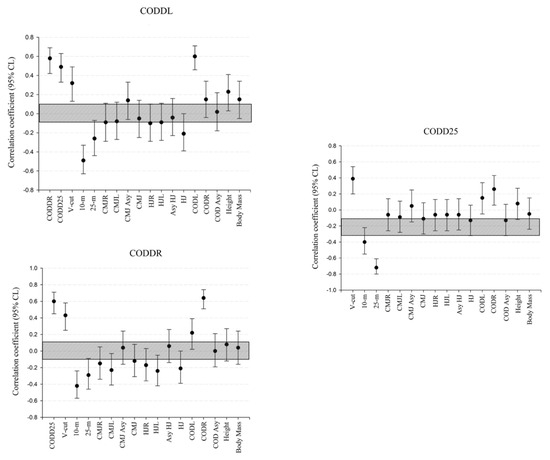
Figure 1.
Correlation coefficients (95% confidence interval) describing the relationships between the percentage-based change-of-direction deficit, for both left (CODDL) and right (CODDR), and the V-cut (CODD25) with physical performance and anthropometric variables. CMJR and CMJL: unilateral countermovement jump with right and left legs; HJR and HJL: unilateral horizontal jump with right and left legs; COD180R and COD180L: 10 m shuttle sprint with one change of direction to right or left; CMJ: bilateral countermovement jump; HJ: bilateral horizontal jump; 10 m: linear sprint of 10 m; 25 m: linear sprint of 25 m; CODR and CODL: 10 m shuttle sprint with one change of direction of 180° to right or left; CODDL, CODDR, and CODD25: change-of-direction deficit with right or left and V-cut; Asy: asymmetry.
4. Discussion
The current study aimed to assess the differences among playing positions, to determine playing position profiles, and to analyze the relationships between the % CODD and the rest of the anthropometric and performance variables. The main findings were as follows: (1) pivots and goalkeepers are taller and bigger than the rest of the positions; (2) all playing positions have similar profiles in jumping, linear and multidirectional sprinting ability, and interlimb asymmetries except for goalkeepers; (3) the change-of-direction speed measured through single and multiple changes of direction is worse for goalkeepers than for all other playing positions; and (4) a lower CODD percentage seems to be affected by a faster COD speed. These results suggest that interlimb asymmetries may not differ substantially among the positions in elite youth futsal, although their presence continues to be a relevant factor for performance and injury risk monitoring in applied settings.
The anthropometric profiles of young futsal players show that pivots and goalkeepers have a greater height and body mass than other positions. This aligns with previous studies on elite male players [33,34] and elite Spanish female futsal players [35]. Ramos et al. also found that goalkeepers and forwards had a higher body mass than wingers and defenders [36], indicating that anthropometric characteristics may influence role allocation within the team and the physical demands of each position [35]. In addition to these morphological differences, pivot players appear to be exposed to a lower total external load than their teammates, which may influence their training and physical preparation requirements [11,37]. This lower external demand may be related to their role in the game, which is characterized by more specific and controlled actions compared to positions that require a higher volume of movement and frequent changes of pace [10]. However, the results are not entirely consistent in all the populations studied. Albalad-Aiguabella et al. found no significant differences among the playing positions for female futsal players (p > 0.05) [5], indicating that factors such as gender, level of competition, or tactical strategies may influence these variations. Characterizing these physical profiles will allow for optimized training planning, facilitating more specific approaches tailored to the actual demands of each position in futsal.
Several previous studies in futsal players have analyzed performance variables through different training programs, examining their impact on the development of physical abilities such as strength and speed [38,39,40,41,42]. Regarding the CMJ variable, our results (35.9 ± 3.99 cm) are consistent with those described in the literature, which range between 35.5 and 38.7 cm [39,43,44]. Spyrou et al. recently explored the CMJ performance across playing positions in elite futsal and found values ranging from 35.1 cm in defenders to 37.3 cm in wingers, although no significant differences (p > 0.05) were observed among positions, supporting the notion that positional differences may exist, but remain within a small range [17]. In the 10 m sprint, our players recorded an average time of 1.89 ± 0.07 s, aligning with previous research findings, which have reported values ranging from 1.68 to 2.23 s [43,44,45]. Similarly, in the 25 m sprint, our results (3.84 ± 0.14 s) are comparable to those reported in another study, which found values ranging from 3.76 to 3.83 s [40]. Ayarra et al. found no significant differences across competitive levels in acceleration over 5 and 15 m or in the 505 agility test; however, players from higher-level categories performed better in the horizontal and vertical jump tests, suggesting that explosive power may serve as a discriminating factor based on competitive level [2]. These findings indicate that the physical profile of our sample is representative of highly trained young futsal players, which strengthens the external validity of the results. Notably, the only study that has compared performance variables by playing position in futsal is that of Albalad-Aiguabella et al., whose results closely resemble those found in the present study [5]. In this study, no significant differences were observed among the field positions, which can be explained by the homogeneous training loads and the lack of specialization at these ages [46]. However, goalkeepers showed a clearly differentiated profile, possibly due to the specific demands and nature of their position [47]. Even when standard physical tests do not show large differences among positions, the functional demands during gameplay do vary and justify a position-specific training periodization [48]. Therefore, more studies are needed to establish well-defined positional profiles and to standardize performance variables in futsal, allowing for more precise comparisons and practical applications in training and talent identification.
In futsal, the COD speed is one of the most decisive actions due to the rapid changes of activity during the match [49]. Outfield players must move quickly and accurately to keep or regain possession of the ball, which requires high linear and multidirectional sprinting abilities [50]. In our study, goalkeepers showed a lower COD speed compared to outfielders, which may be justified by differences in the physical and functional demands of their position. While outfielders perform constant CODs at multiple angles, goalkeepers rely more heavily on explosive lateral movements in a frontal plane, which may limit their development in this ability [5]. Freitas et al. indicated that athletes with a greater strength and power tend to perform CODs with a greater speed and efficiency [51]. In this sense, a lower CODD percentage indicates that the loss of speed when changing direction is lower compared to the speed achieved in a linear sprint, reflecting a higher efficiency in this action [52]. Players with a lower CODD will be able to change direction more quickly and smoothly without sacrificing speed [14]. However, despite the high relationship observed between the CODD and COD performance, no significant differences were found among positions. This can be explained by the fact that the CODD represents a relative and individual measure of efficiency in change of direction, and not an absolute measure of performance. Therefore, even if one player is faster than another in terms of their COD, both may show a similar efficiency (CODD) when comparing their ability to maintain speed when turning with respect to their linear sprint [15]. A study of rugby players found that faster athletes were less effective at CODs, as their faster approach speed impeded optimal turn execution [53]. Similarly, Clarke et al. suggested that linear velocity has the most significant relationship with COD180 performance (r = 0.71 to 0.76; p < 0.01) [54]. On the other hand, a study of young football players found a link between a higher body weight and a reduced ability to execute a COD efficiently (r = −0.65; p < 0.01) [55]. These descriptive data provide a useful benchmark for future research, facilitating comparisons between the profiles of young futsal players and allowing for a more accurate analysis of the factors influencing their performance and COD ability.
These descriptive data not only provide a useful benchmark for future research, but also offer relevant insights from a preventive perspective. Although no significant differences were found among playing positions in interlimb asymmetries, all the values remained below the 10% threshold for the unilateral CMJ, horizontal jump, and change-of-direction tests. Maintaining interlimb asymmetries below 10–15% has been suggested as a reasonable threshold [56], as greater asymmetries are associated with an increased injury risk and unilateral overload [57]. These findings support the importance of continuous individual monitoring, as it allows for the identification of athletes who exceed normative values and may benefit from preventive interventions, even in the absence of group-level differences [58].
Similarly, lower CODD values suggest a more efficient braking and turning capacity, which may protect athletes during rapid deceleration actions—a common mechanism in non-contact lower limb injuries [59]. Studies in futsal have identified that multiple sprints with frequent CODs are key contributors to non-contact knee injuries, highlighting the critical role of deceleration quality [60]. Moreover, research on change-of-direction and agility training in youth soccer and futsal indicates that incorporating COD technique drills, eccentric strength work, and multi-component warm-ups (e.g., modified FIFA 11+) not only enhance performance, but also significantly reduce the injury incidence [61]. Therefore, improving the CODD can not only optimize performance, but also enhance physical resilience in young athletes, bridging the gap between explosive ability and biomechanical safety.
The present study has some limitations that should be considered when interpreting the results. Firstly, no direct assessments of body composition (body fat percentage, lean muscle mass) were included. These variables could have provided a more detailed understanding of the athletes’ physical profiles and allowed for a more accurate comparison among playing positions in terms of performance-related morphology. Secondly, important physiological components such as the aerobic capacity and intermittent endurance were not evaluated, despite being fundamental to futsal performance. Including these variables in future research would offer a more holistic view of player characteristics and support the development of individualized, position-specific training strategies.
5. Conclusions
In conclusion, this study provides a comprehensive overview of the anthropometric and performance profiles of elite youth futsal players, highlighting both the general characteristics and specific differences among playing positions. Pivots and goalkeepers showed a greater height and body mass, while wingers performed better in speed and change-of-direction tests. Additionally, lower CODD values were associated with a greater efficiency in directional changes, emphasizing the relevance of the acceleration and deceleration capacity in game situations. Although no significant differences were found among positions in terms of interlimb asymmetries, their individual analysis remains essential to identify relevant deviations that could compromise performance or increase the injury risk. These findings reinforce the importance of considering the specific physical demands of each position when planning training and contribute to the development of more precise positional benchmarks in youth futsal.
Author Contributions
Conceptualization, O.V.-G. and R.A.-A.; methodology, O.V.-G., O.G.-S., and R.A.-A.; software, O.V.-G. and O.G.-S.; validation, O.G.-S., R.A.-A., and E.M.-P.; formal analysis, O.V.-G. and O.G.-S.; investigation, O.V.-G. and E.M.-P.; resources, R.A.-A. and E.M.-P.; data curation, O.G.-S. and E.M.-P.; writing—original draft preparation, O.V.-G. and O.G.-S.; writing—review and editing, R.A.-A. and E.M.-P.; visualization, O.V.-G.; supervision, R.A.-A. and E.M.-P.; project administration, O.V.-G. and E.M.-P. All authors have read and agreed to the published version of the manuscript.
Funding
This research received no external funding.
Institutional Review Board Statement
This study was conducted in accordance with the Declaration of Helsinki and approved by the Research Ethics Committee of Aragón (Research Ethics Committee of the Community of Aragon, CEICA), protocol code PI24/137 (3 April 2024).
Informed Consent Statement
Informed consent was obtained from all the subjects involved in this study. For underage players, informed consent was also obtained from their parents or legal guardians.
Data Availability Statement
Data supporting the findings of this research are available from the corresponding author (Elena Mainer-Pardos) upon reasonable request.
Acknowledgments
The authors thank the players, coaches, and participating clubs for their collaboration and willingness throughout the data collection process. Oliver Gonzalo-Skok was supported by a Ramón y Cajal postdoctoral fellowship (RYC2023-045305-I) funded by MICIU/AEI/10.13039/501100011033 and the FSE+ given by the Spanish Ministry of Science and Innovation, the State Research Agency (AEI) and the European Union.
Conflicts of Interest
The authors declare no conflicts of interest.
Abbreviations
The following abbreviations are used in this manuscript:
| CMJ | Counter Movement Jump |
| COD | Change of Direction |
| CODD | Change-of-Direction Deficit |
| CV | Coefficient of Variation |
| ES | Effect Size |
| HJ | Horizontal Jump |
| ICC | Intraclass Correlation Coefficient |
References
- Matzenbacher, F.; Pasquarelli, B.; Rabelo, F.; Stanganelli, L.C.R. Demanda fisiológica no futsal competitivo. Características físicas e fisiológicas de atletas profissionais. Rev. Andal. Med. Deporte 2014, 7, 122–131. [Google Scholar] [CrossRef]
- Ayarra, R.; Nakamura, F.Y.; Iturricastillo, A.; Castillo, D.; Yanci, J. Differences in physical performance according to the competitive level in futsal players. J. Hum. Kinet. 2018, 64, 275. [Google Scholar] [CrossRef]
- Ribeiro, J.N.; Yousefian, F.; Illa, J.; Couceiro, M.; Sampaio, J.; Travassos, B. The Effects of Players’ Rotations on High-Intensity Activities in Professional Futsal Players. J. Hum. Kinet. 2024, 90, 215–226. [Google Scholar] [CrossRef]
- Castagna, C.; D’Ottavio, S.; Vera, J.G.; Álvarez, J.C.B. Match demands of professional Futsal: A case study. J. Sci. Med. Sport 2009, 12, 490–494. [Google Scholar] [CrossRef]
- Albalad-Aiguabella, R.; Mainer-Pardos, E.; Roso-Moliner, A.; Lozano, D.; Vicente-Rodríguez, G.; Muniz-Pardos, B. Fitness Profiles of Highly Trained Female Futsal Players According to Their Playing Positions. Int. J. Sports Physiol. Perform. 2025, 1, 1–8. [Google Scholar] [CrossRef] [PubMed]
- Lago-Fuentes, C.; Pérez-Celada, S.; Prieto-Troncoso, J.; Rey, E.; Mecías-Calvo, M. Anthropometric and conditional profile in semiprofessional futsal players: Differences between sexes. A case study. [Perfil antropométrico y condicional en jugadores semiprofesionales de futbol sala: Diferencias entre sexos. Un estudio de caso]. Rev. Int. Cienc. Deporte 2020, 16, 330–341. [Google Scholar] [CrossRef]
- Sekulic, D.; Gilic, B.; Foretic, N.; Spasic, M.; Uljević, O.; Veršić, Š. Fitness profiles of professional futsal players: Identifying age-related differences. Biomed. Hum. Kinet. 2020, 12, 212. [Google Scholar] [CrossRef]
- Sekulic, D.; Pojskic, H.; Zeljko, I.; Pehar, M.; Modric, T.; Versic, S.; Novak, D. Physiological and anthropometric determinants of performance levels in professional futsal. Front. Psychol. 2021, 11, 621763. [Google Scholar] [CrossRef] [PubMed]
- López-Fernández, J.; García-Unanue, J.; Sánchez-Sánchez, J.; Colino, E.; Hernando, E.; Gallardo, L. Bilateral asymmetries assessment in elite and sub-elite male futsal players. Int. J. Environ. Res. Public Health 2020, 17, 3169. [Google Scholar] [CrossRef]
- Gadea-Uribarri, H.; Mainer-Pardos, E.; Bores-Arce, A.; Albalad-Aiguabella, R.; López-García, S.; Lago-Fuentes, C. External Load Variability in Elite Futsal: Positional Demands and Microcycle Structuring for Player Well-Being and Performance. Sports 2025, 13, 7. [Google Scholar] [CrossRef]
- Illa, J.; Alonso, Ò.; Serpiello, F.; Hodder, R.; Reche, X. Demandas de carga externa y diferencias posicionales en fútbol sala de élite mediante tecnología UWB. Apunts. Educ. Física Deportes 2021, 3, 53–59. [Google Scholar] [CrossRef]
- Zeljko, I.; Spasic, M.; Sekulic, D. Predicting futsal specific change of direction speed and reactive agility; analysis of specific correlates in top-level players. Life 2020, 2019, 147. [Google Scholar]
- Loturco, I.; Pereira, L.A.; Reis, V.P.; Abad, C.C.; Freitas, T.T.; Azevedo, P.H.; Nimphius, S. Change of direction performance in elite players from different team sports. J. Strength Cond. Res. 2022, 36, 862–866. [Google Scholar] [CrossRef]
- Nimphius, S.; Callaghan, S.J.; Spiteri, T.; Lockie, R.G. Change of direction deficit: A more isolated measure of change of direction performance than total 505 time. J. Strength Cond. Res. 2016, 30, 3024–3032. [Google Scholar] [CrossRef] [PubMed]
- Freitas, T.T.; Pereira, L.A.; Alcaraz, P.E.; Azevedo, P.H.; Bishop, C.; Loturco, I. Percentage-based change of direction deficit: A new approach to standardize time-and velocity-derived calculations. J. Strength Cond. Res. 2022, 36, 3521–3526. [Google Scholar] [CrossRef]
- Belo, J.; Valente-dos-Santos, J.; Pereira, J.R.; Duarte-Mendes, P.; M Gamonales, J.; Paulo, R. Study of Body Composition and Motor Skills of Futsal Athletes of Different Competitive Levels. Sports 2024, 12, 137. [Google Scholar] [CrossRef]
- Spyrou, K.; Alcaraz, P.E.; Martínez-Serrano, A.; Marín-Cascales, E.; Ferioli, D.; Contreras, J.P.S.; Ribeiro, J.N.; Travassos, B.; Freitas, T.T. Exploring countermovement jump variables across competitive levels and playing positions in futsal. Front. Sports Act. Living 2024, 6, 1371467. [Google Scholar] [CrossRef]
- Gadea-Uribarri, H.; Lago-Fuentes, C.; Bores-Arce, A.; Villavicencio Álvarez, V.E.; López-García, S.; Calero-Morales, S.; Mainer-Pardos, E. External Load Evaluation in Elite Futsal: Influence of Match Results and Game Location with IMU Technology. J. Funct. Morphol. Kinesiol. 2024, 9, 140. [Google Scholar] [CrossRef]
- Ribeiro, J.N.; Yousefian, F.; Illa, J.; Ferraz, A.; Nakamura, F.; Travassos, B. Profiling the acceleration and deceleration components in elite futsal players. Int. J. Perform. Anal. Sport 2024, 24, 641–653. [Google Scholar] [CrossRef]
- Costa e Silva, L.; Silva, A.L.; Teles, J.; Fragoso, I. Study on the Influence of Physical Activity Intensity and Maturation on Sports Injuries in Children and Adolescents. Appl. Sci. 2024, 14, 10632. [Google Scholar] [CrossRef]
- Rinaldo, N.; Gualdi-Russo, E.; Zaccagni, L. Influence of size and maturity on injury in young elite soccer players. Int. J. Environ. Res. Public Health 2021, 18, 3120. [Google Scholar] [CrossRef]
- Helme, M.; Tee, J.; Emmonds, S.; Low, C. Does lower-limb asymmetry increase injury risk in sport? A systematic review. Phys. Ther. Sport 2021, 49, 204–213. [Google Scholar] [CrossRef] [PubMed]
- Fort-Vanmeerhaeghe, A.; Bishop, C.; Buscà, B.; Aguilera-Castells, J.; Vicens-Bordas, J.; Gonzalo-Skok, O. Inter-limb asymmetries are associated with decrements in physical performance in youth elite team sports athletes. PLoS ONE 2020, 15, e0229440. [Google Scholar] [CrossRef] [PubMed]
- Guan, Y.; Bredin, S.S.D.; Taunton, J.; Jiang, Q.; Wu, N.; Warburton, D.E.R. Predicting the Risk of Injuries Through Assessments of Asymmetric Lower Limb Functional Performance: A Prospective Study of 415 Youth Taekwondo Athletes. Orthop. J. Sports Med. 2023, 11, 23259671231185586. [Google Scholar] [CrossRef]
- Fort-Vanmeerhaeghe, A.; Benet-Vigo, A.; Montalvo, A.; Arboix, A.; Buscà, B.; Arboix-Alió, J. Relationship between Performance and Inter-Limb Asymmetries Using Flywheel Resistance Device in Elite Youth Female Basketball Players. Biology 2022, 11, 812. [Google Scholar] [CrossRef]
- McKay, A.K.A.; Stellingwerff, T.; Smith, E.S.; Martin, D.T.; Mujika, I.; Goosey-Tolfrey, V.L.; Sheppard, J.; Burke, L.M. Defining Training and Performance Caliber: A Participant Classification Framework. Int. J. Sports Physiol. Perform. 2022, 17, 317–331. [Google Scholar] [CrossRef]
- Jeffreys, I. Warm up revisited–the ‘ramp’ method of optimising performance preparation. Uksca J. 2006, 6, 15–19. [Google Scholar]
- Bishop, C.; Jarvis, P.; Turner, A.; Balsalobre-Fernandez, C. Validity and reliability of strategy metrics to assess countermovement jump performance using the newly developed my jump lab smartphone application. J. Hum. Kinet. 2022, 83, 185. [Google Scholar] [CrossRef]
- Balsalobre-Fernández, C.; Glaister, M.; Lockey, R.A. The validity and reliability of an iPhone app for measuring vertical jump performance. J. Sports Sci. 2015, 33, 1574–1579. [Google Scholar] [CrossRef] [PubMed]
- Bishop, C.; Read, P.; Lake, J.; Chavda, S.; Turner, A. Interlimb asymmetries: Understanding how to calculate differences from bilateral and unilateral tests. Strength Cond. J. 2018, 40, 1–6. [Google Scholar] [CrossRef]
- Mainer-Pardos, E.; Álvarez, V.E.V.; Moreno-Apellaniz, N.; Gutiérrez-Logroño, A.; Calero-Morales, S. Effects of a neuromuscular training program on the performance and inter-limb asymmetries in highly trained junior male tennis players. Heliyon 2024, 10, e27081. [Google Scholar] [CrossRef]
- Hopkins, W.; Marshall, S.; Batterham, A.; Hanin, J. Progressive statistics for studies in sports medicine and exercise science. Med. Sci. Sports Exerc. 2009, 41, 3. [Google Scholar] [CrossRef] [PubMed]
- Baroni, B.M.; Leal Junior, E.C. Aerobic capacity of male professional futsal players. J. Sports Med. Phys. Fit. 2010, 50, 395–399. [Google Scholar]
- Martinez-Riaza, L.; Herrero-Gonzalez, H.; Lopez-Alcorocho, J.M.; Guillen-Garcia, P.; Fernandez-Jaen, T.F. Epidemiology of injuries in the Spanish national futsal male team: A five-season retrospective study. BMJ Open Sport Exerc. Med. 2017, 2, e000180. [Google Scholar] [CrossRef] [PubMed]
- Castillo, M.; Martínez-Sanz, J.M.; Penichet-Tomás, A.; Sellés, S.; González-Rodriguez, E.; Hurtado-Sánchez, J.A.; Sospedra, I. Relationship between body composition and performance profile characteristics in female futsal players. Appl. Sci. 2022, 12, 11492. [Google Scholar] [CrossRef]
- Ramos Campo, D.J.; Martínez Sánchez, F.; Esteban García, P.; Rubio Arias, J.Á.; Bores Cerezal, A.; Clemente Suárez, V.; Jiménez Díaz, J.F. Body composition features in different playing position of professional team indoor players. Int. J. Morphol. 2014, 32, 1316–1324. [Google Scholar] [CrossRef]
- Ohmuro, T.; Iso, Y.; Tobita, A.; Hirose, S.; Ishizaki, S.; Sakaue, K.; Yasumatsu, M. Physical match performance of Japanese top-level futsal players in different categories and playing positions. Biol. Sport 2020, 37, 359–365. [Google Scholar] [CrossRef]
- Campos, F.S.; Borszcz, F.K.; Flores, L.J.F.; Barazetti, L.K.; Teixeira, A.S.; Hartmann Nunes, R.F.; Guglielmo, L.G.A. HIIT Models in Addition to Training Load and Heart Rate Variability Are Related With Physiological and Performance Adaptations After 10-Weeks of Training in Young Futsal Players. Front. Psychol. 2021, 12, 636153. [Google Scholar] [CrossRef]
- Iodice, P.; Trecroci, A.; Dian, D.; Proietti, G.; Alberti, G.; Formenti, D. Slow-Speed Resistance Training Increases Skeletal Muscle Contractile Properties and Power Production Capacity in Elite Futsal Players. Front. Sports Act. Living 2020, 2, 8. [Google Scholar] [CrossRef]
- Villanueva-Guerrero, O.; Lozano, D.; Roso-Moliner, A.; Nobari, H.; Lago-Fuentes, C.; Mainer-Pardos, E. Effects of different strength and velocity training programs on physical performance in youth futsal players. Heliyon 2024, 10, e30747. [Google Scholar] [CrossRef]
- Yanci, J.; Castillo, D.; Iturricastillo, A.; Ayarra, R.; Nakamura, F.Y. Effects of Two Different Volume-Equated Weekly Distributed Short-Term Plyometric Training Programs on Futsal Players’ Physical Performance. J. Strength Cond. Res. 2017, 31, 1787–1794. [Google Scholar] [CrossRef] [PubMed]
- Teixeira, A.S.; Arins, F.B.; De Lucas, R.D.; Carminatti, L.J.; Dittrich, N.; Nakamura, F.Y.; Guglielmo, L.G.A. Comparative Effects of Two Interval Shuttle-Run Training Modes on Physiological and Performance Adaptations in Female Professional Futsal Players. J. Strength Cond. Res. 2019, 33, 1416–1428. [Google Scholar] [CrossRef]
- Paz-Franco, A.; Rey, E.; Barcala-Furelos, R. Effects of 3 different resistance training frequencies on jump, sprint, and repeated sprint ability performances in professional futsal players. J. Strength Cond. Res. 2017, 31, 3343–3350. [Google Scholar] [CrossRef]
- Torres-Torrelo, J.; Rodríguez-Rosell, D.; Mora-Custodio, R.; Pareja-Blanco, F.; Yañez-García, J.M.; González-Badillo, J.J. Effects of resistance training and combined training program on repeated sprint ability in futsal players. Int. J. Sports Med. 2018, 39, 517–526. [Google Scholar] [CrossRef] [PubMed]
- Lago-Fuentes, C.; Rey, E.; Padrón-Cabo, A.; de Rellán-Guerra, A.S.; Fragueiro-Rodríguez, A.; García-Núñez, J. Effects of core strength training using stable and unstable surfaces on physical fitness and functional performance in professional female futsal players. J. Hum. Kinet. 2018, 65, 213. [Google Scholar] [CrossRef]
- Ortega, J.A.F.; Buitrago, J.A.R.; Rodriguez, D.A.S. Aspectos centrales de la identificación y desarrollo de talentos deportivos: Revisión sistemática. Retos Nuevas Tend. Educ. Física Deporte Recreación 2021, 39, 915–928. [Google Scholar]
- Lockie, R.G.; Moreno, M.R.; Lazar, A.; Orjalo, A.J.; Giuliano, D.V.; Risso, F.G.; Davis, D.L.; Crelling, J.B.; Lockwood, J.R.; Jalilvand, F. The physical and athletic performance characteristics of Division I collegiate female soccer players by position. J. Strength Cond. Res. 2018, 32, 334–343. [Google Scholar] [CrossRef] [PubMed]
- Albalad-Aiguabella, R.; Navarrete-Villanueva, D.; Mainer-Pardos, E.; Villanueva-Guerrero, O.; Muniz-Pardos, B.; Vicente-Rodríguez, G. Physical Training Considerations for Futsal Players According to Strength and Conditioning Coaches: A Qualitative Study. Sports 2025, 13, 126. [Google Scholar] [CrossRef]
- Spyrou, K.; Freitas, T.T.; Marín-Cascales, E.; Alcaraz, P.E. Physical and Physiological Match-Play Demands and Player Characteristics in Futsal: A Systematic Review. Front. Psychol. 2020, 11, 569897. [Google Scholar] [CrossRef] [PubMed]
- Naser, N.; Ali, A.; Macadam, P. Physical and physiological demands of futsal. J. Exerc. Sci. Fit. 2017, 15, 76–80. [Google Scholar] [CrossRef]
- Freitas, T.T.; Pereira, L.A.; Alcaraz, P.E.; Arruda, A.F.; Guerriero, A.; Azevedo, P.H.; Loturco, I. Influence of strength and power capacity on change of direction speed and deficit in elite team-sport athletes. J. Hum. Kinet. 2019, 68, 167. [Google Scholar] [CrossRef]
- Sammoud, S.; Bouguezzi, R.; Negra, Y.; Chaabene, H. The Reliability and Sensitivity of Change of Direction Deficit and Its Association with Linear Sprint Speed in Prepubertal Male Soccer Players. J. Funct. Morphol. Kinesiol. 2021, 6, 41. [Google Scholar] [CrossRef]
- Freitas, T.T.; Alcaraz, P.E.; Bishop, C.; Calleja-González, J.; Arruda, A.F.S.; Guerriero, A.; Reis, V.P.; Pereira, L.A.; Loturco, I. Change of Direction Deficit in National Team Rugby Union Players: Is There an Influence of Playing Position? Sports 2018, 7, 2. [Google Scholar] [CrossRef]
- Clarke, R.; Read, P.J.; De Ste Croix, M.B.A.; Hughes, J.D. The Deceleration Deficit: A Novel Field-Based Method to Quantify Deceleration During Change of Direction Performance. J. Strength Cond. Res. 2022, 36, 2434–2439. [Google Scholar] [CrossRef]
- Atakan, M.M.; Unver, E.; Demırcı, N.; Cinemre, Ş.A.; Bulut, S.; Turnagol, H.H. Effect of body composition on fitness performance in young male football players. Turk. J. Sport Exerc. 2017, 19, 54–59. [Google Scholar]
- Bishop, C.; McAuley, W.; Read, P.; Gonzalo-Skok, O.; Lake, J.; Turner, A. Acute effect of repeated sprints on interlimb asymmetries during unilateral jumping. J. Strength Cond. Res. 2021, 35, 2127–2132. [Google Scholar] [CrossRef]
- Guan, Y.; Bredin, S.S.D.; Taunton, J.; Jiang, Q.; Wu, N.; Warburton, D.E.R. Association between Inter-Limb Asymmetries in Lower-Limb Functional Performance and Sport Injury: A Systematic Review of Prospective Cohort Studies. J. Clin. Med. 2022, 11, 360. [Google Scholar] [CrossRef] [PubMed]
- Bloomfield, J.; Polman, R.; O’Donoghue, P. Physical demands of different positions in FA Premier League soccer. J. Sports Sci. Med. 2007, 6, 63. [Google Scholar] [PubMed]
- Mijatovic, D.; Krivokapic, D.; Versic, S.; Dimitric, G.; Zenic, N. Change of Direction Speed and Reactive Agility in Prediction of Injury in Football; Prospective Analysis over One Half-Season. Healthcare 2022, 10, 440. [Google Scholar] [CrossRef] [PubMed]
- Oliveira, J.P.; Sampaio, T.; Marinho, D.A.; Barbosa, T.M.; Morais, J.E. Exploring Injury Prevention Strategies for Futsal Players: A Systematic Review. Healthcare 2024, 12, 1387. [Google Scholar] [CrossRef]
- Liu, R.; Liu, J.; Ma, X.; Li, Q.; An, R. Effect of FIFA 11+ intervention on change of direction performance in soccer and futsal players: A systematic review and meta-analysis. Int. J. Sports Sci. Coach. 2021, 16, 862–872. [Google Scholar] [CrossRef]

Disclaimer/Publisher’s Note: The statements, opinions and data contained in all publications are solely those of the individual author(s) and contributor(s) and not of MDPI and/or the editor(s). MDPI and/or the editor(s) disclaim responsibility for any injury to people or property resulting from any ideas, methods, instructions or products referred to in the content. |
© 2025 by the authors. Licensee MDPI, Basel, Switzerland. This article is an open access article distributed under the terms and conditions of the Creative Commons Attribution (CC BY) license (https://creativecommons.org/licenses/by/4.0/).