
Metabolomic and Proteomic Profiling of Athletes Performing Physical Activity under Hypoxic Conditions

 ,
,  , , ,
, , ,
Abstract
1. Introduction
2. Materials and Methods
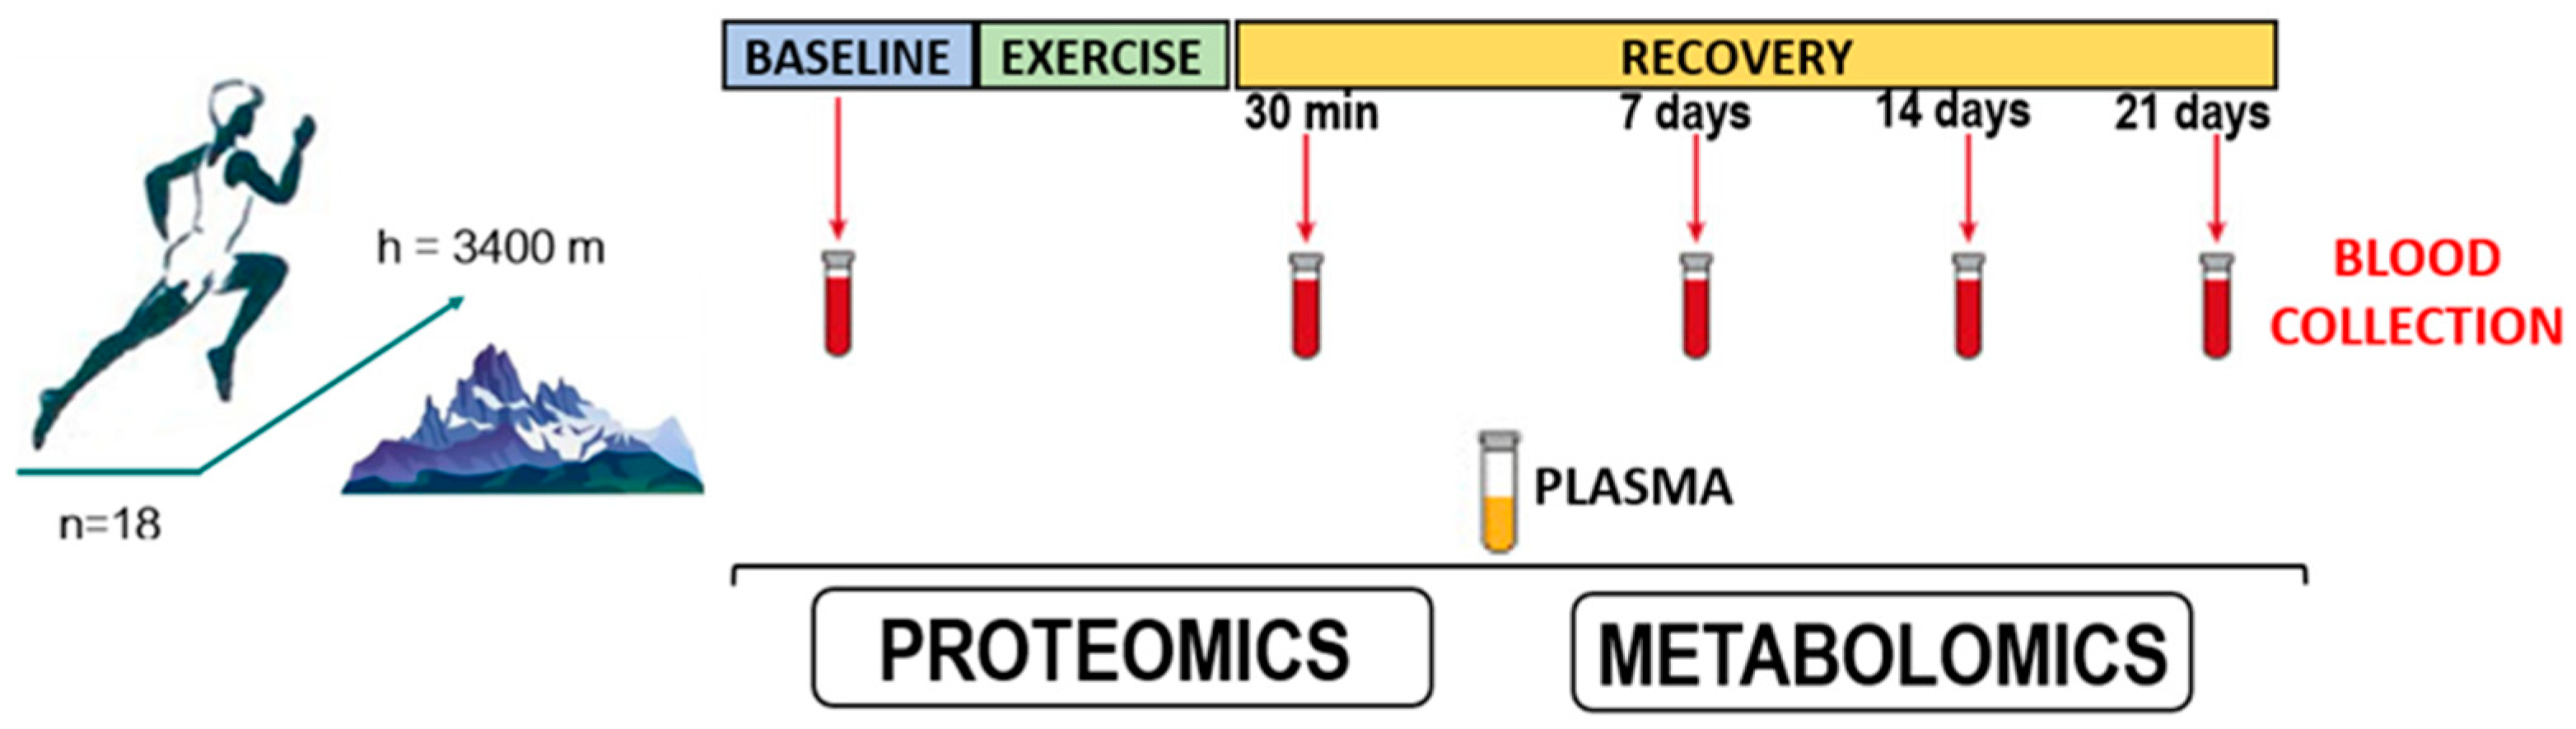
2.1. Study Participants
- -
- Professional climbers with experience in climbing seven thousand meters and above;
- -
- Age from 24 to 40 years old;
- -
- Male gender;
- -
- Members of the Russian triathlon team;
- -
- Study participants who do not live at high altitudes or have no experience at high altitudes;
- -
- A minimum of 15 years of sports experience;
- -
- Availability of access to training and competitive activities according to an in-depth medical examination.
- -
- Females;
- -
- Age below 20 and above 40 years;
- -
- Acute disease and exacerbation of chronic disease at the time of examination;
- -
- Contraindications to stress testing under hypoxic environmental conditions;
- -
- The use of certain pharmacological drugs whose effects may be altered at altitude;
- -
- Lack of willingness of the athlete to comply with study protocols and provide the necessary data.
2.2. Training Load Conditions
2.3. Blood Sample Collection
2.4. Preliminary Preparation of Blood Plasma for HPLC-MS/MS Analysis
2.5. Mass Spectrometric Analysis
2.5.1. Proteomic Analysis
2.5.2. Metabolomic Analysis
2.6. Blood Chemistry and Hematology Tests
2.7. Statistical Analysis
3. Results
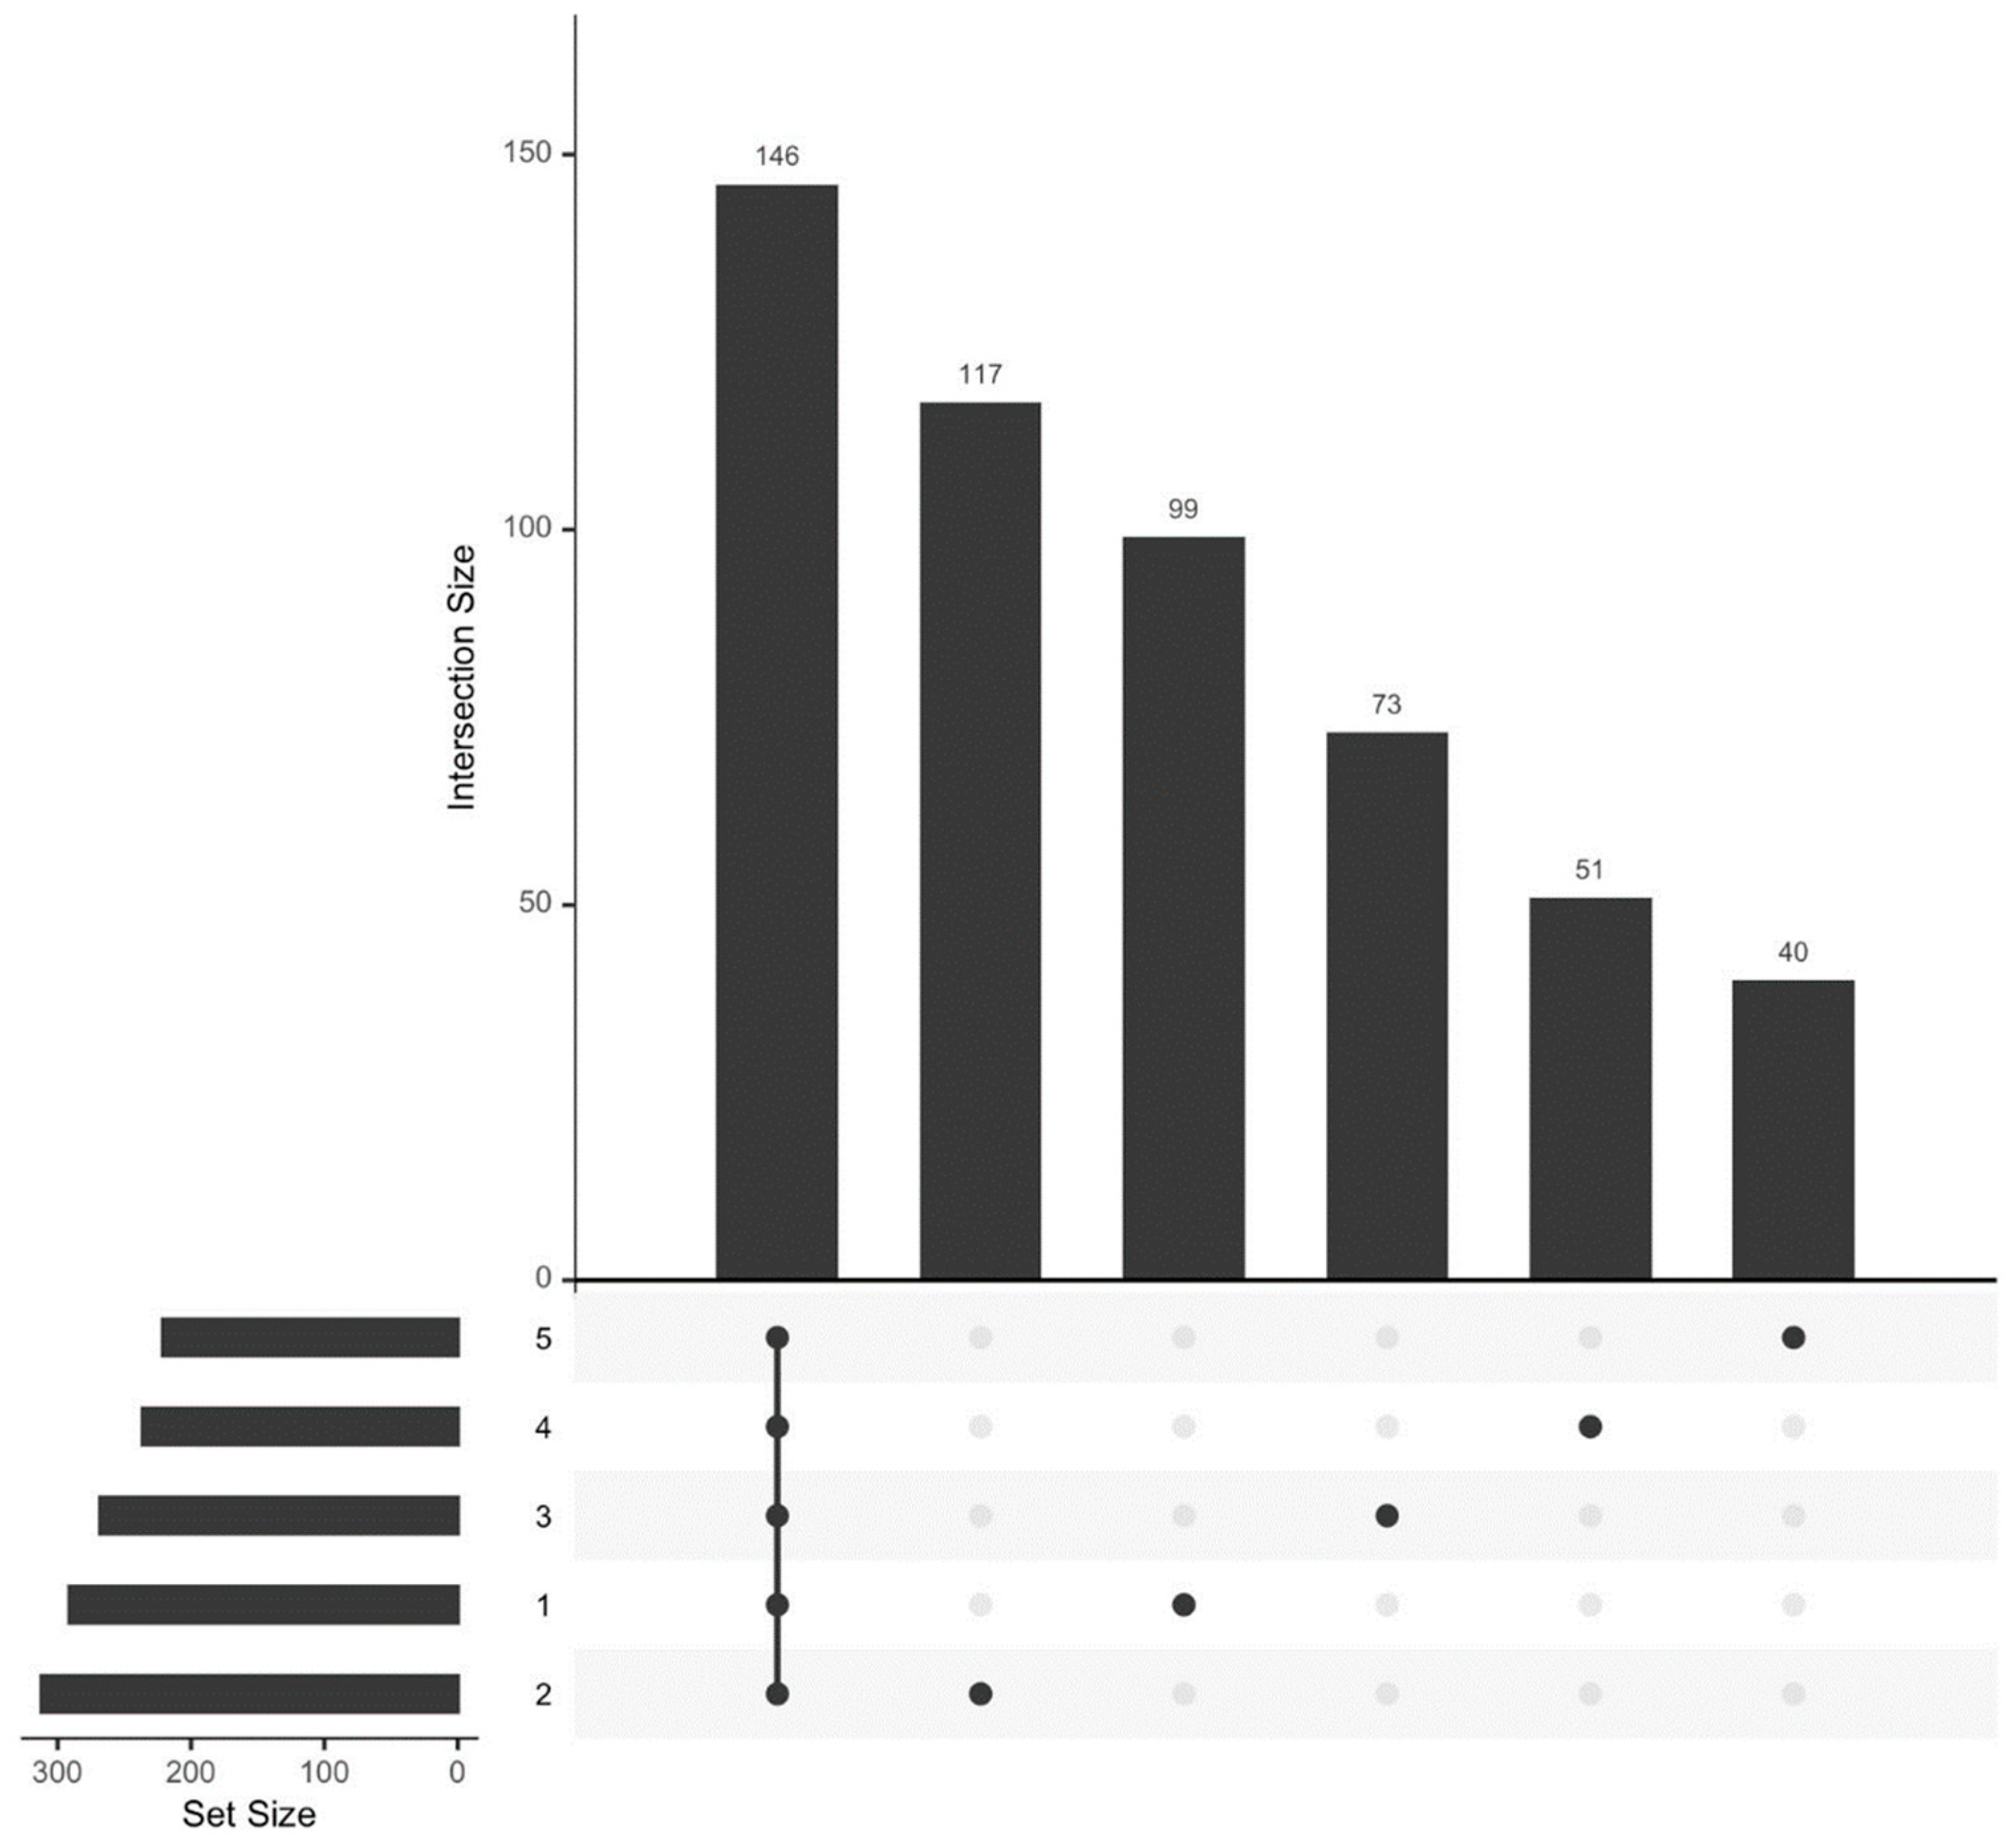
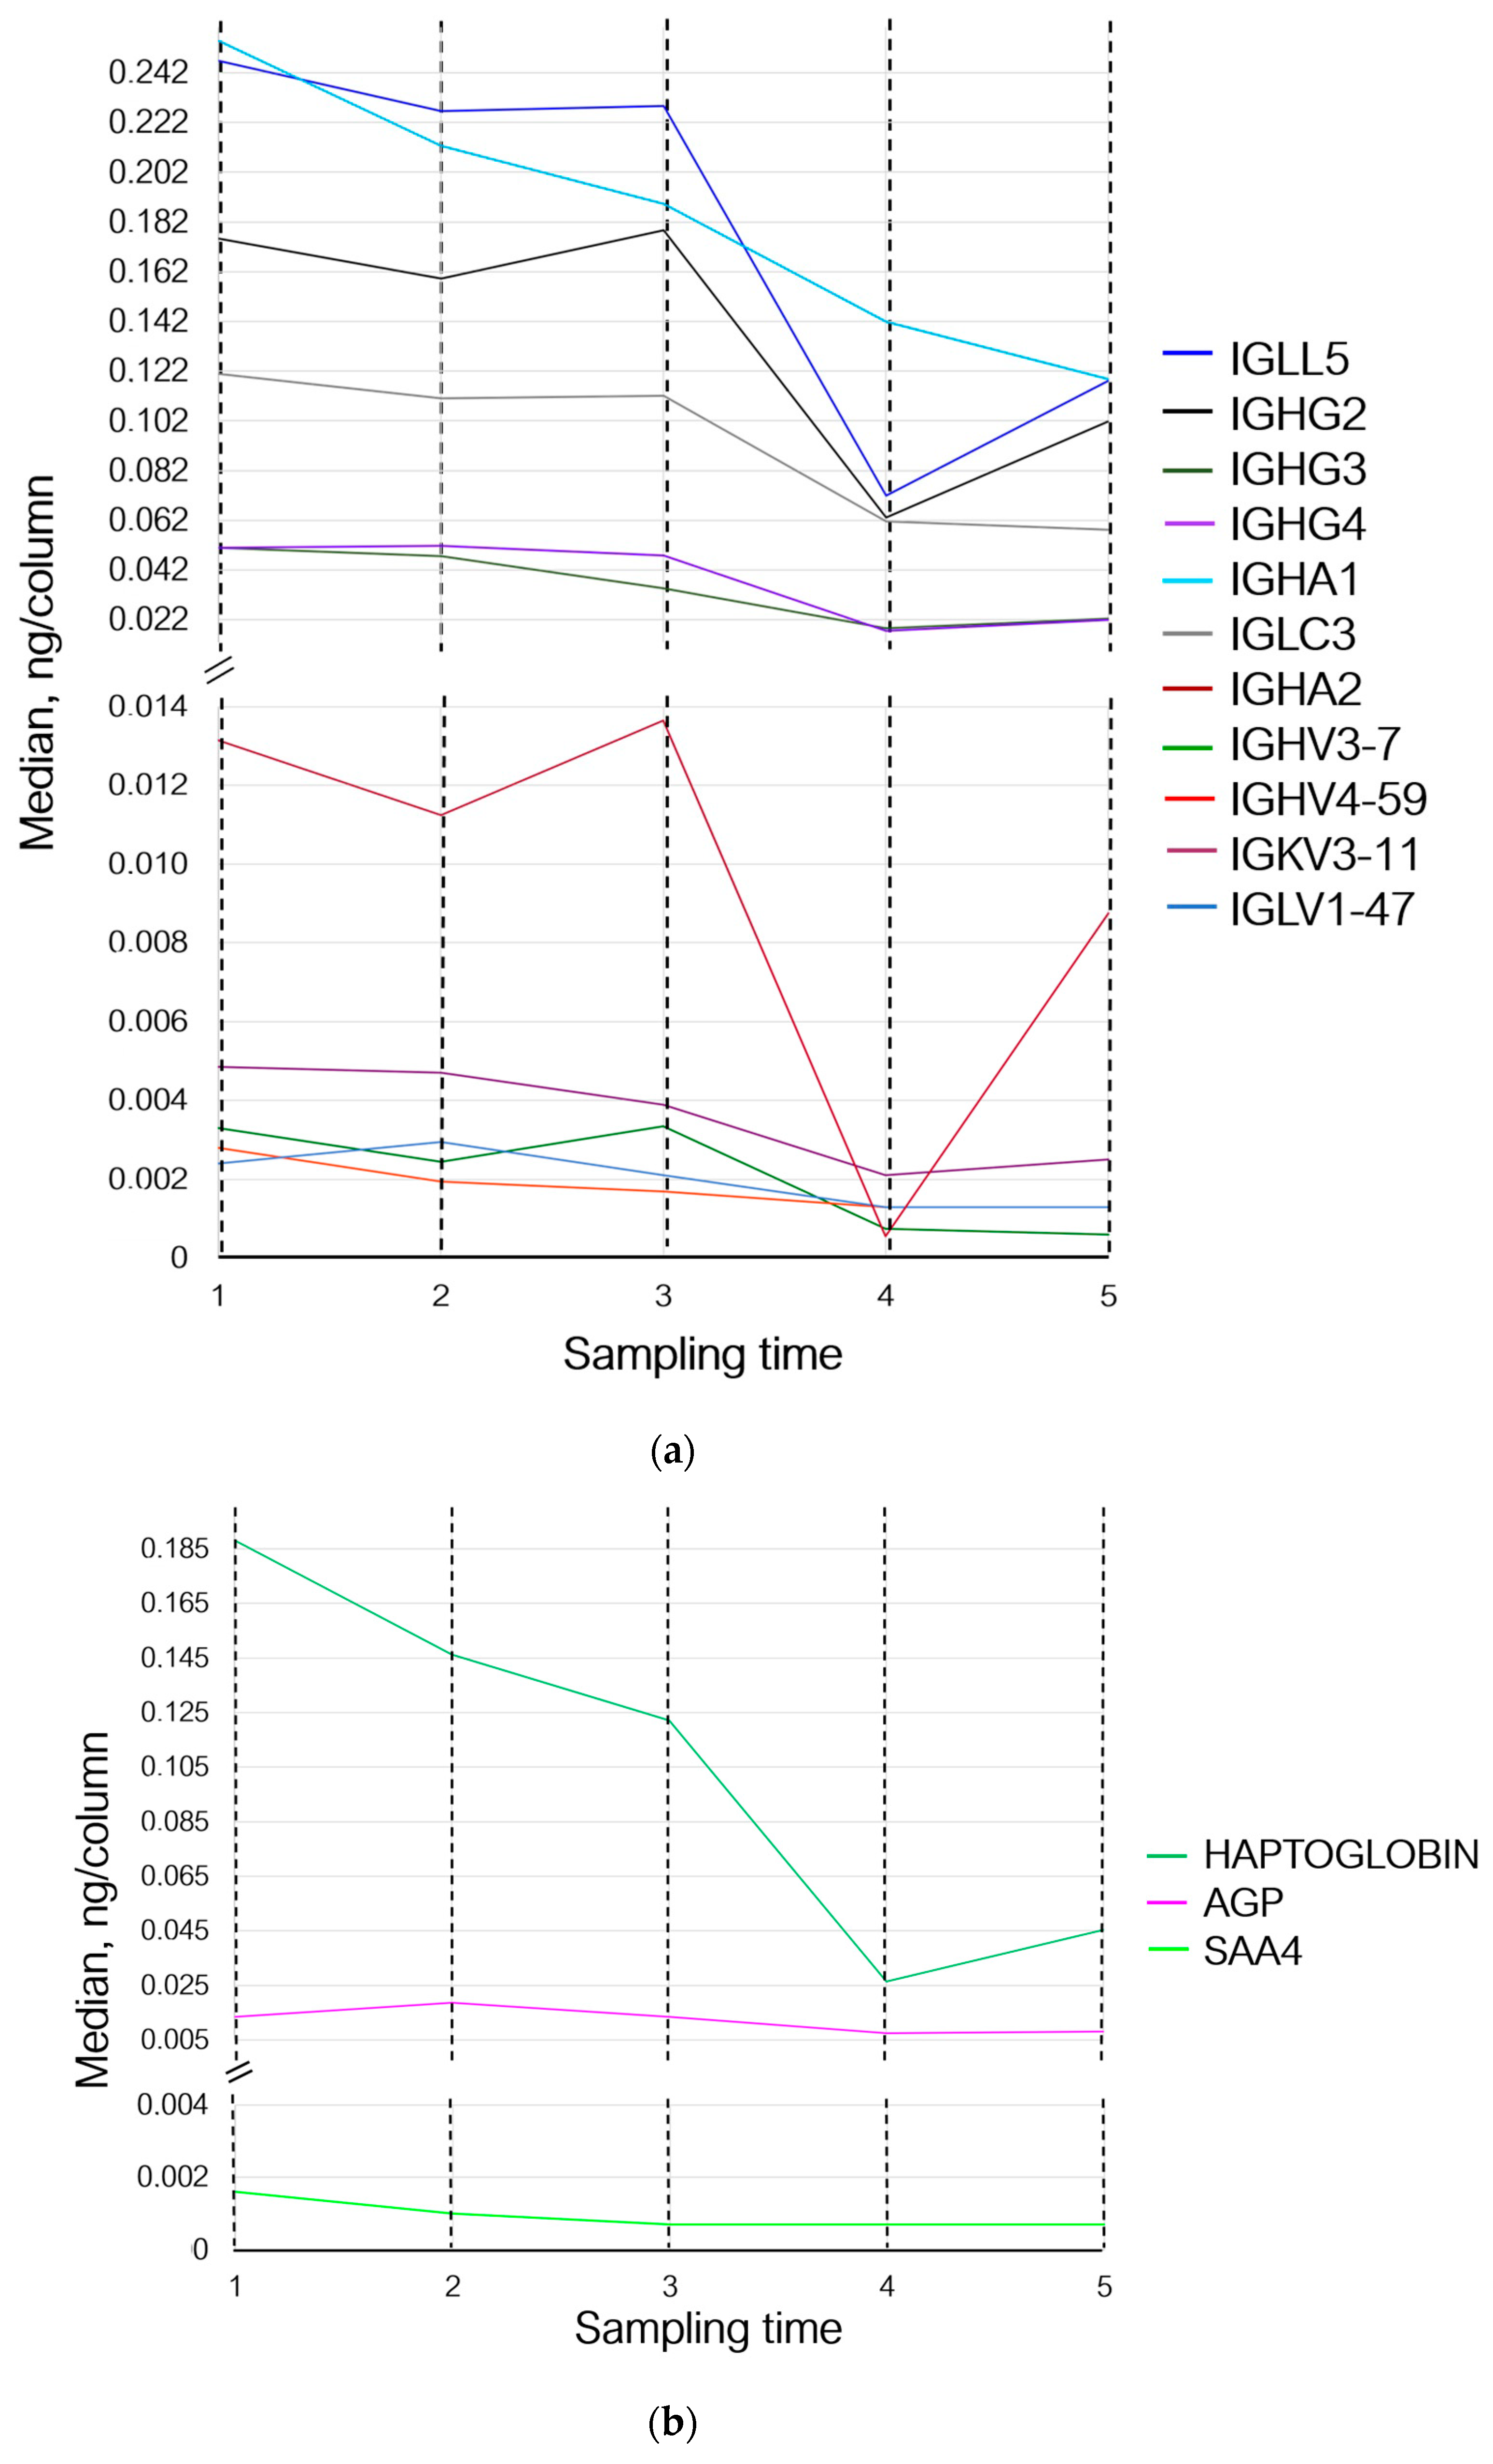
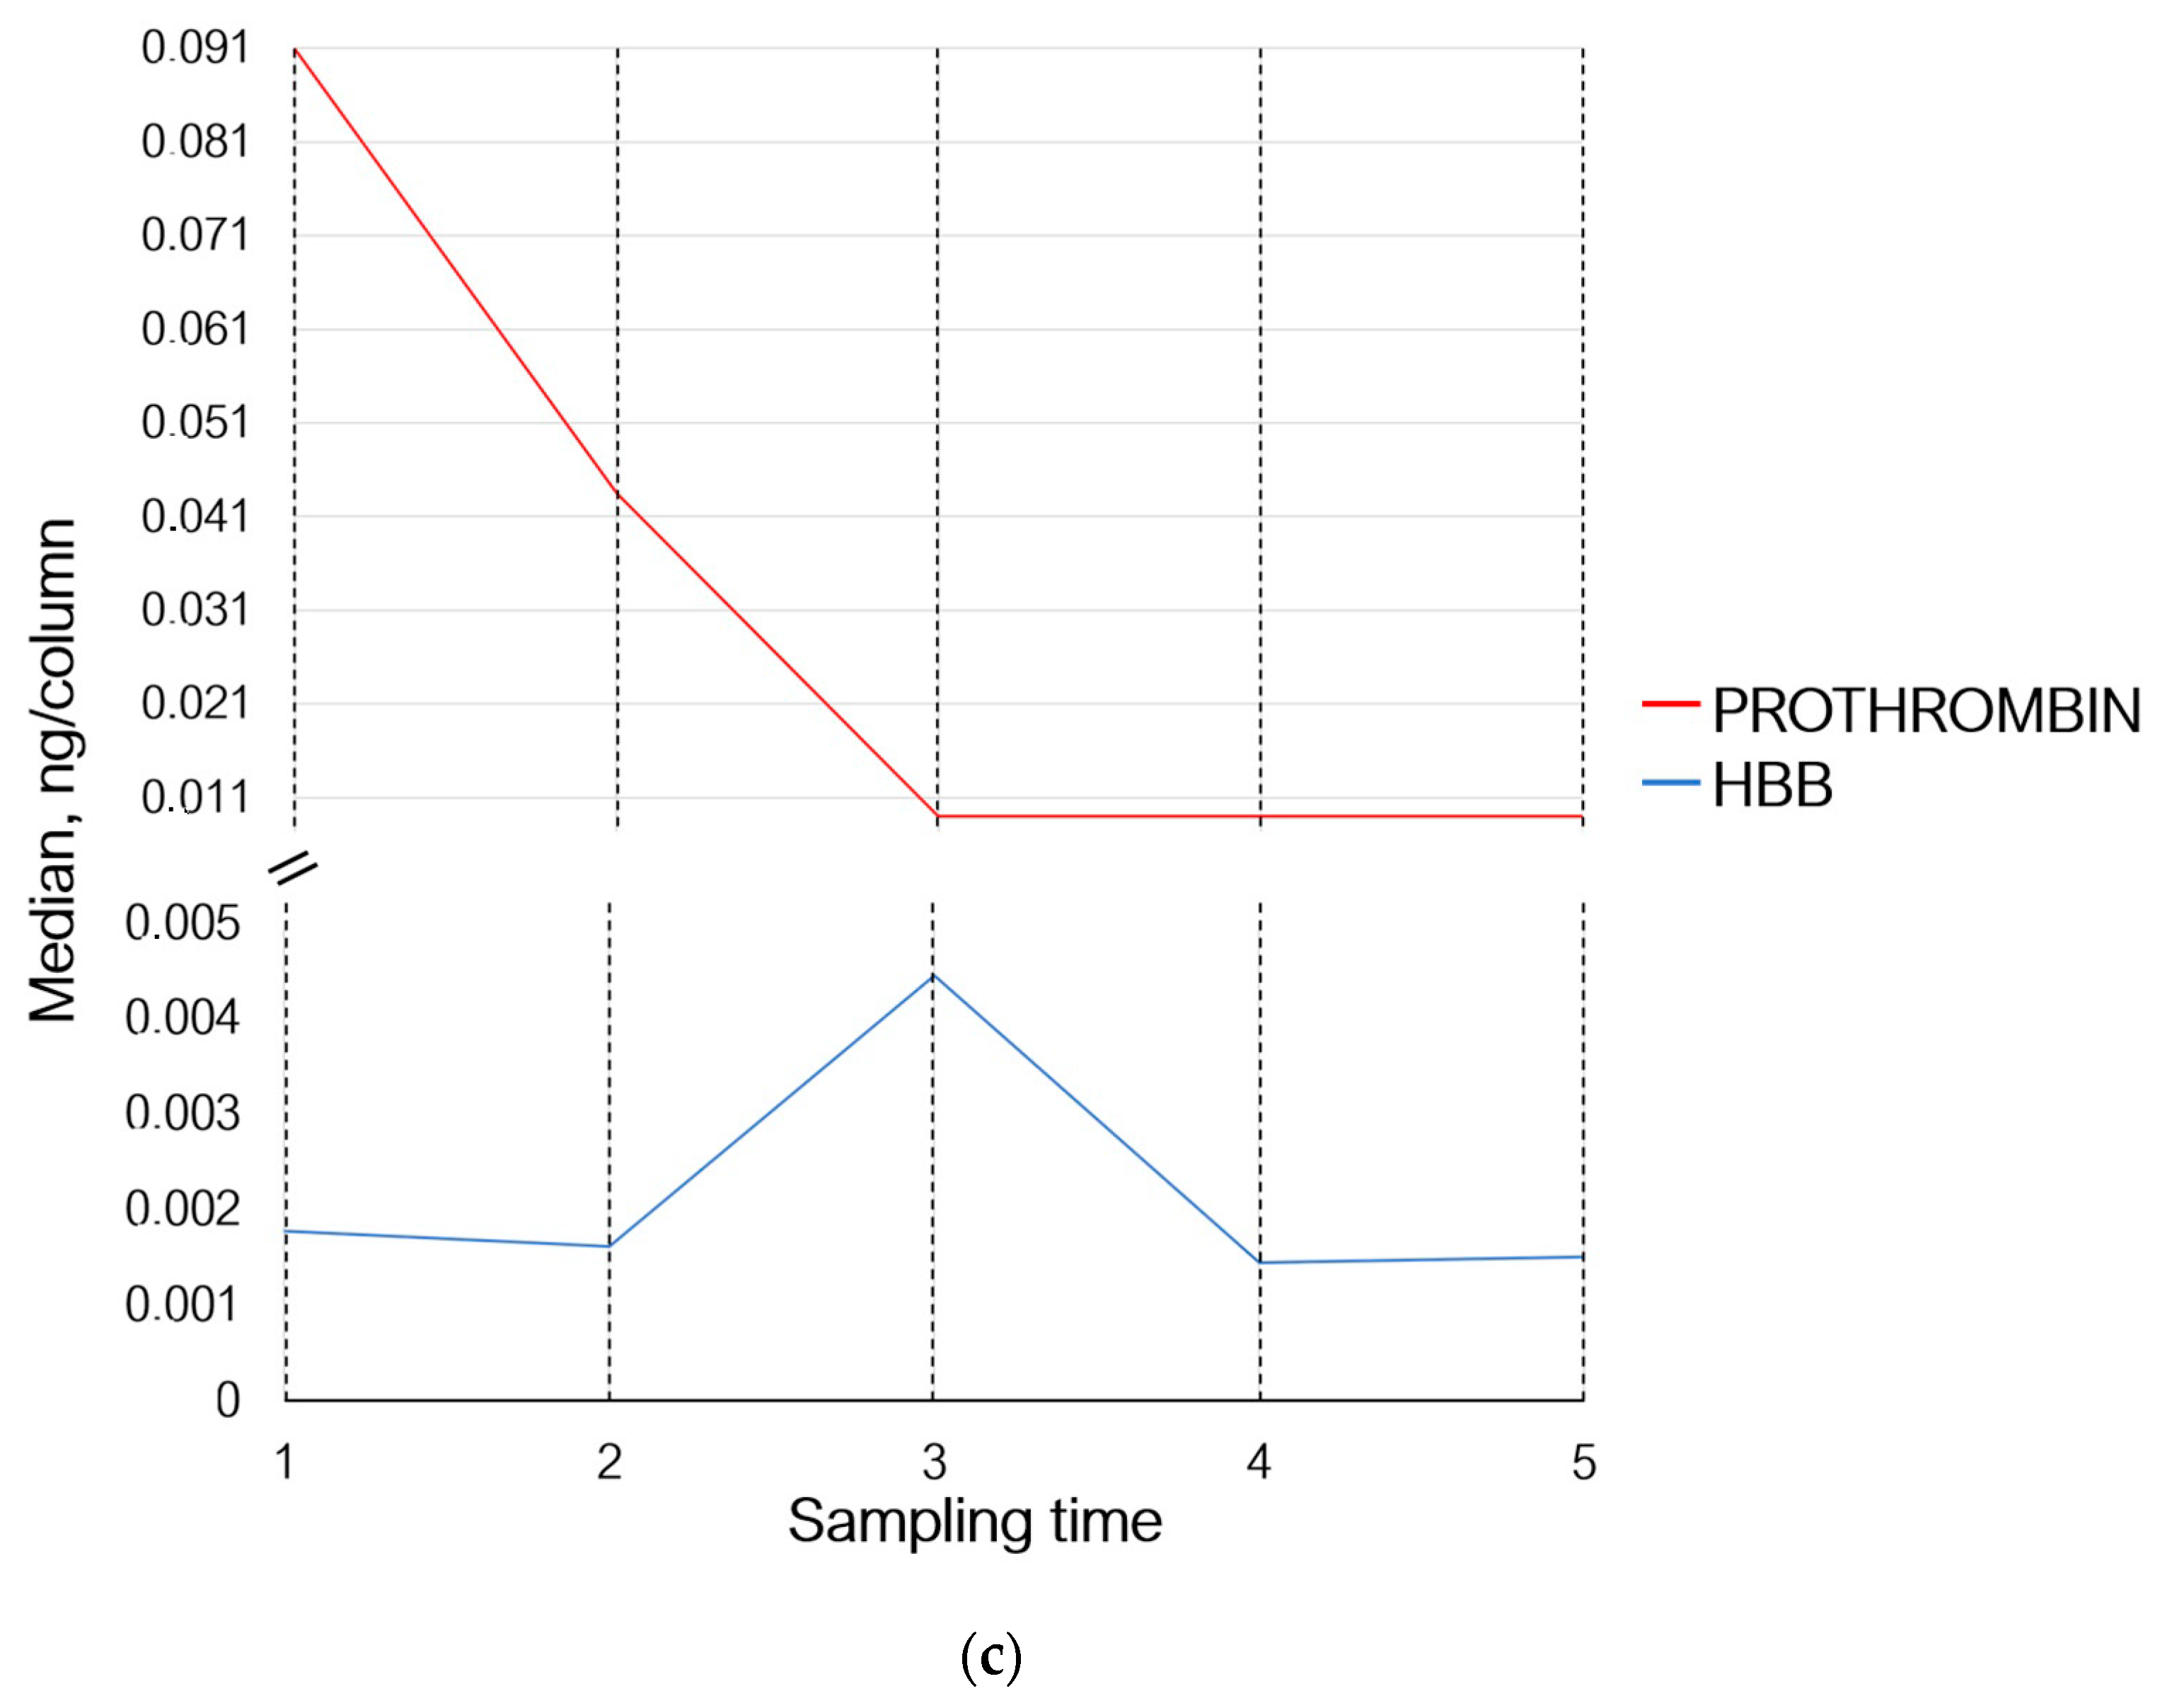
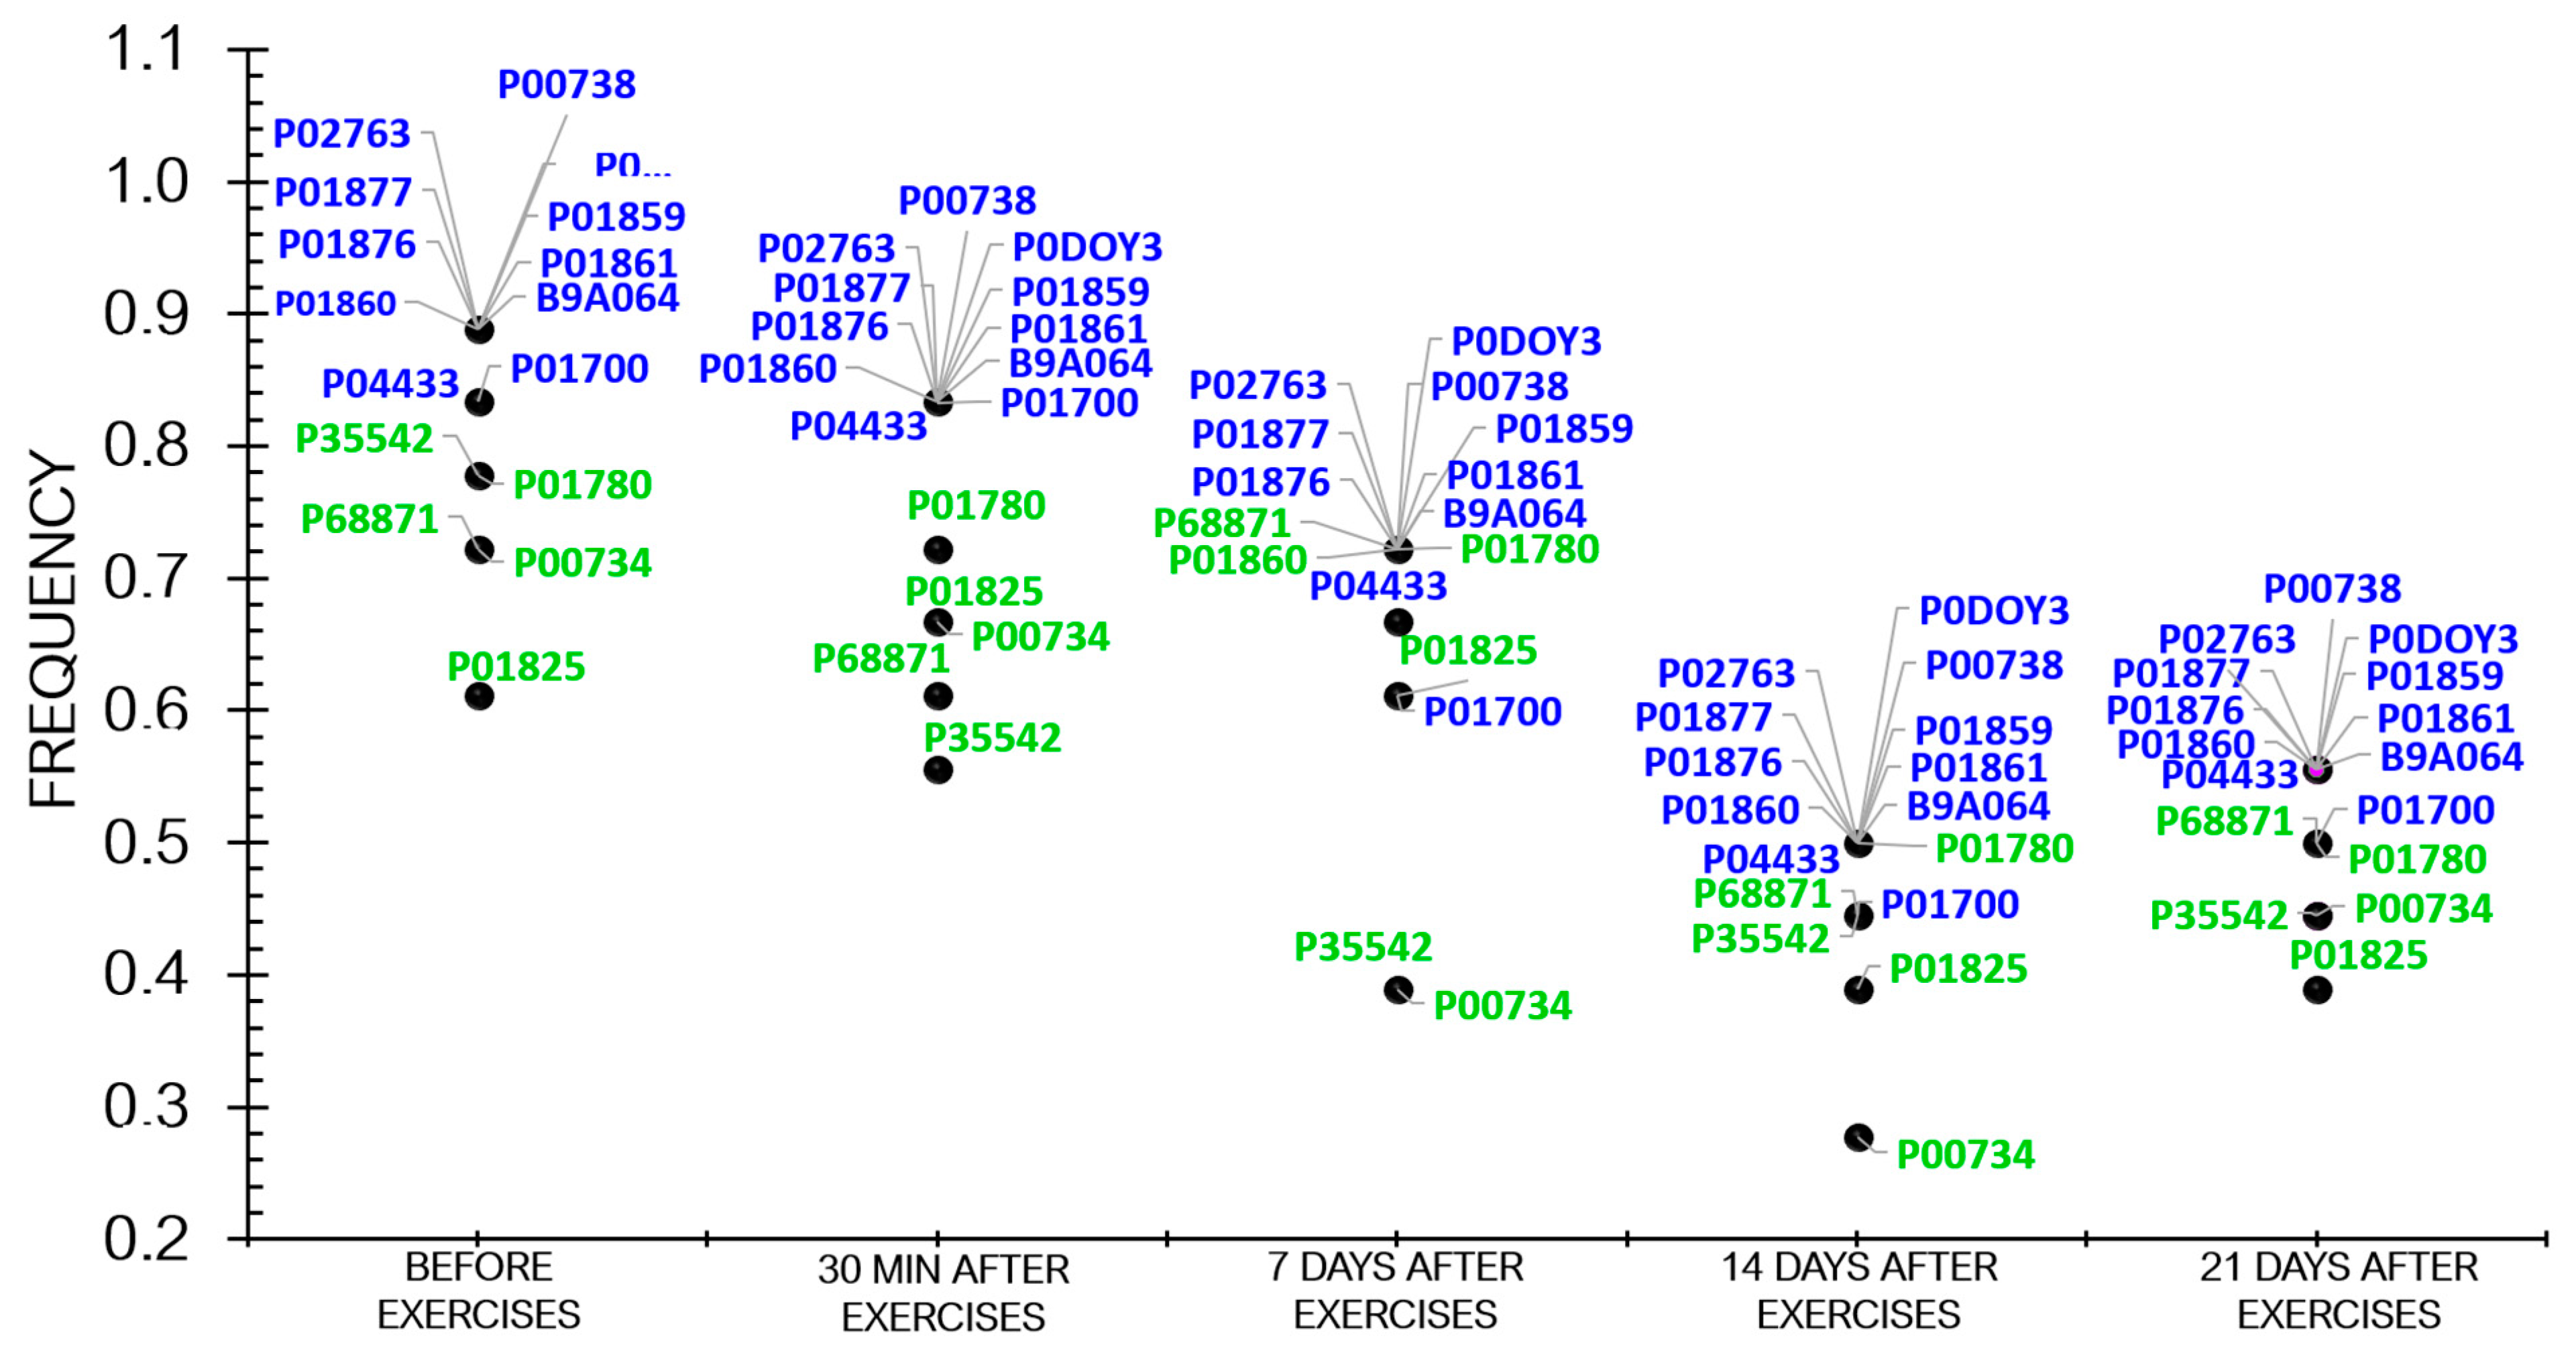
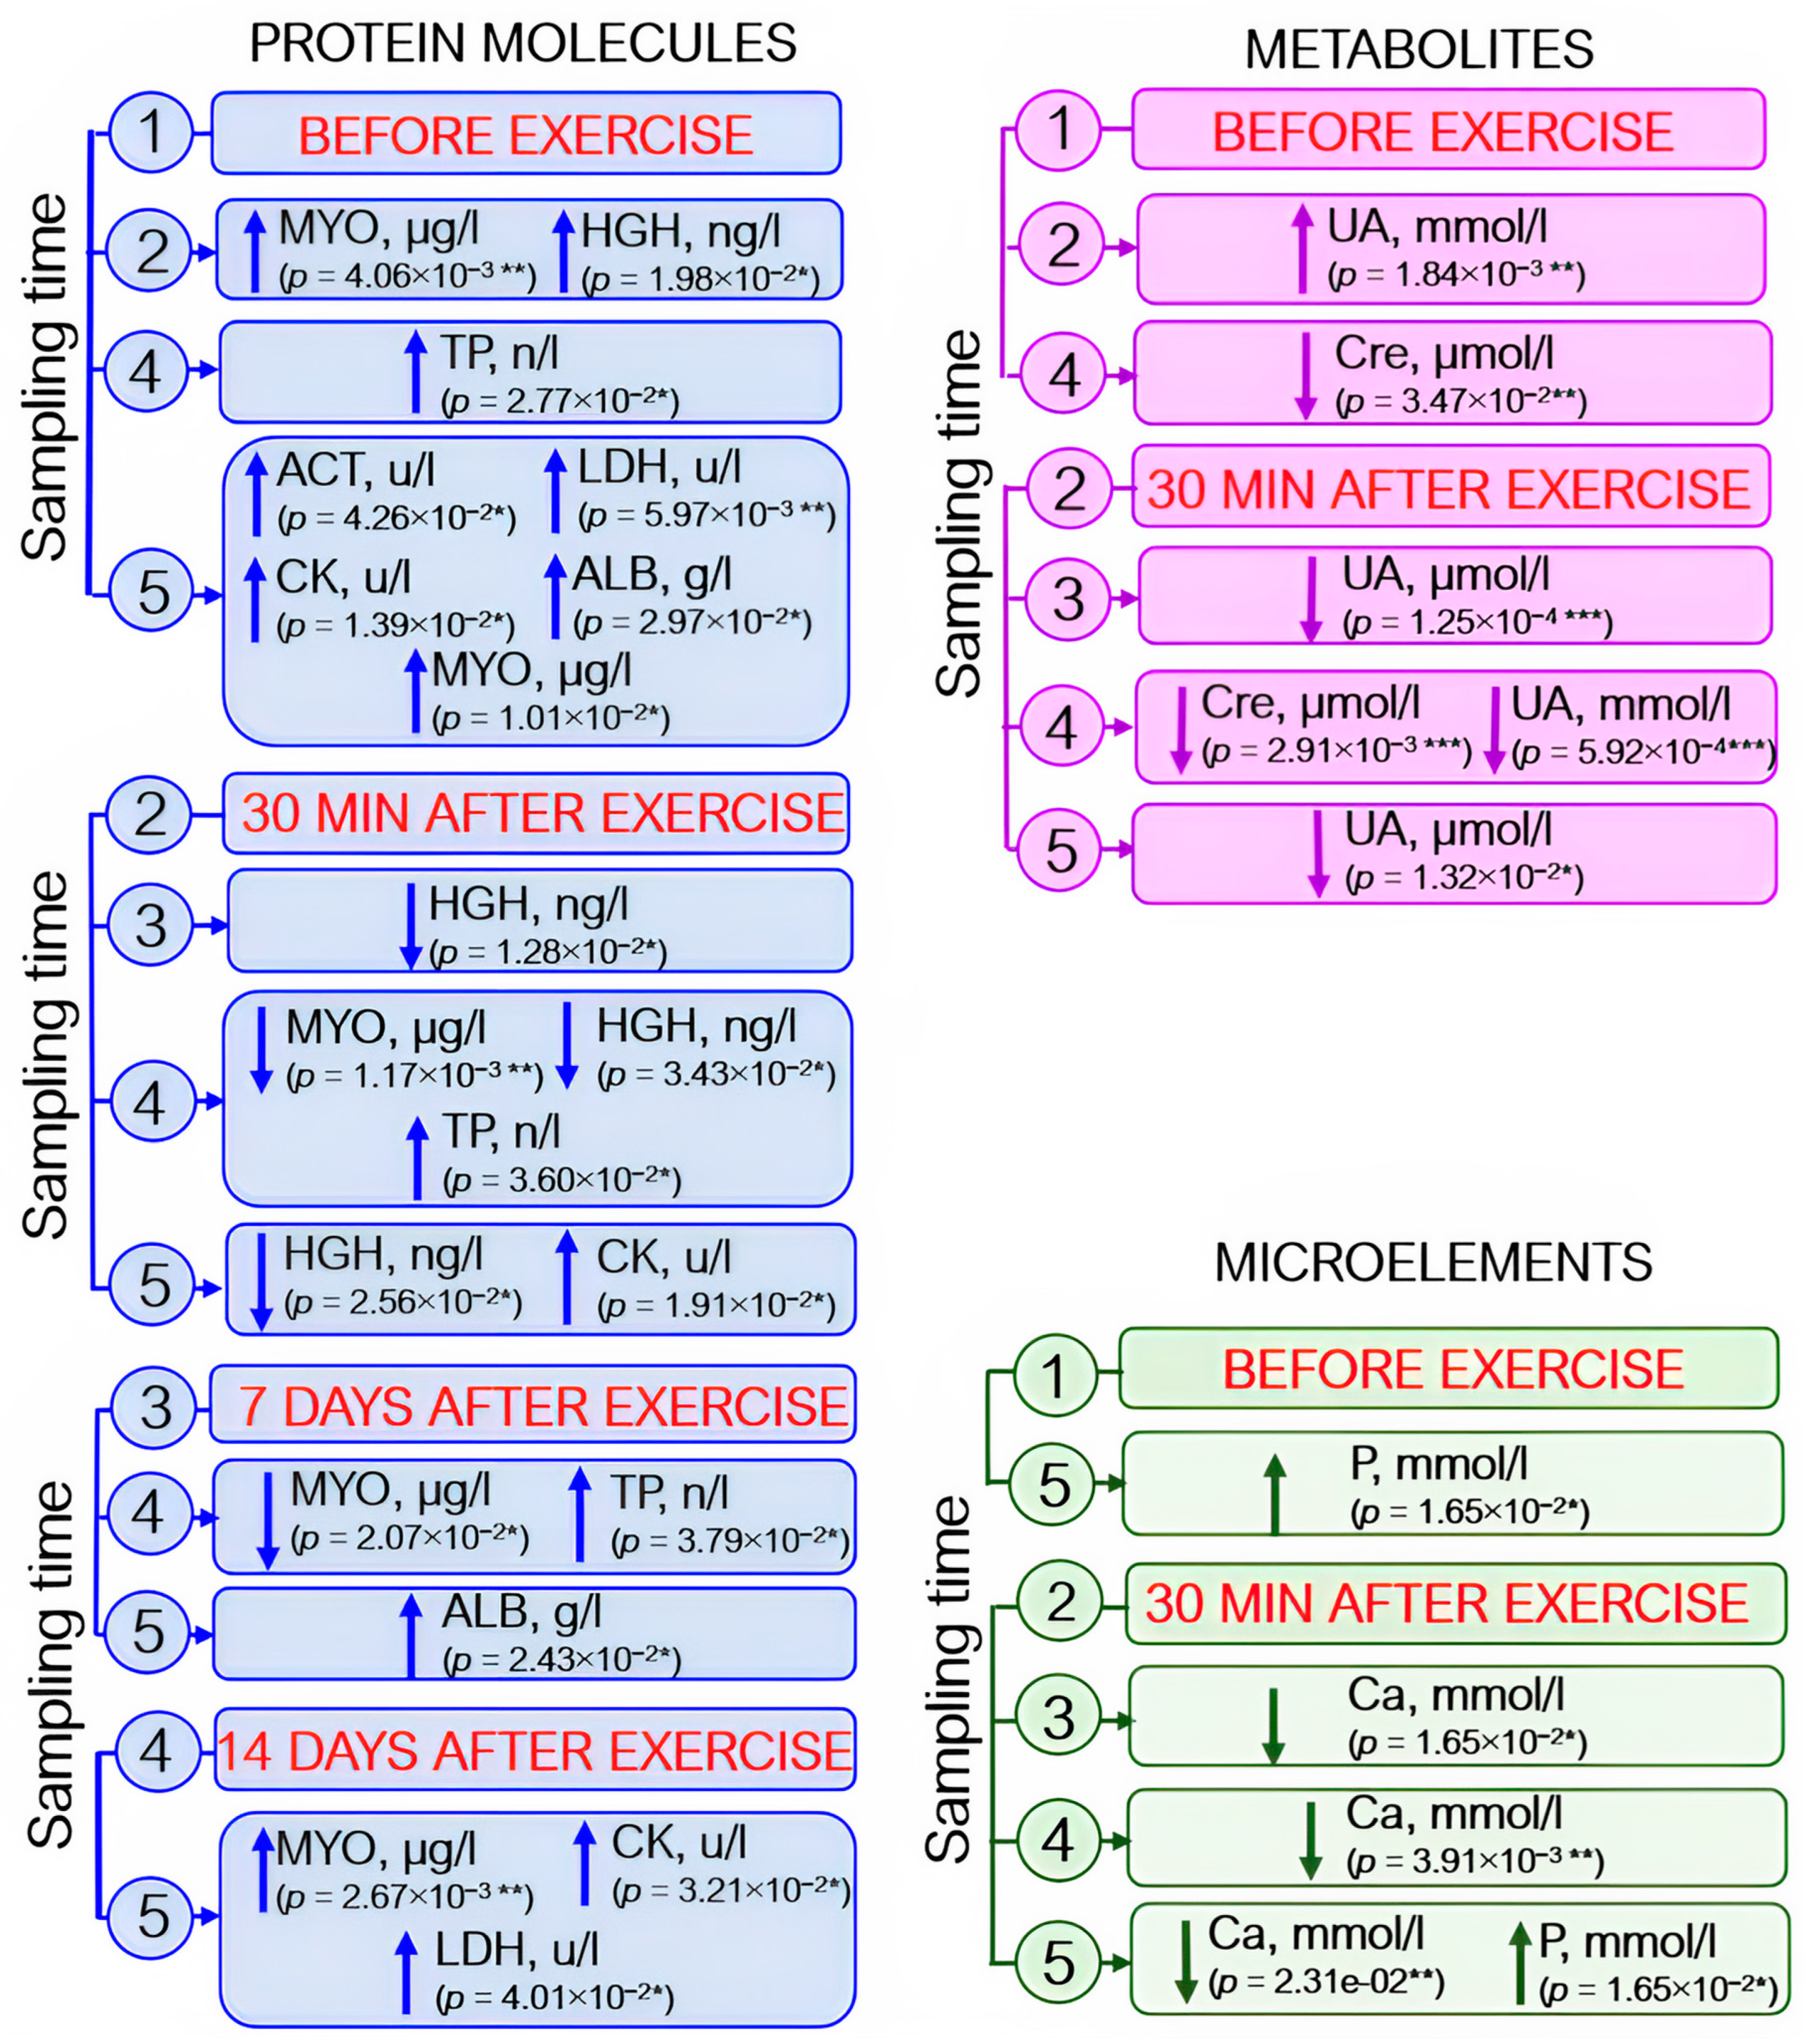
3.1. Proteome Analysis
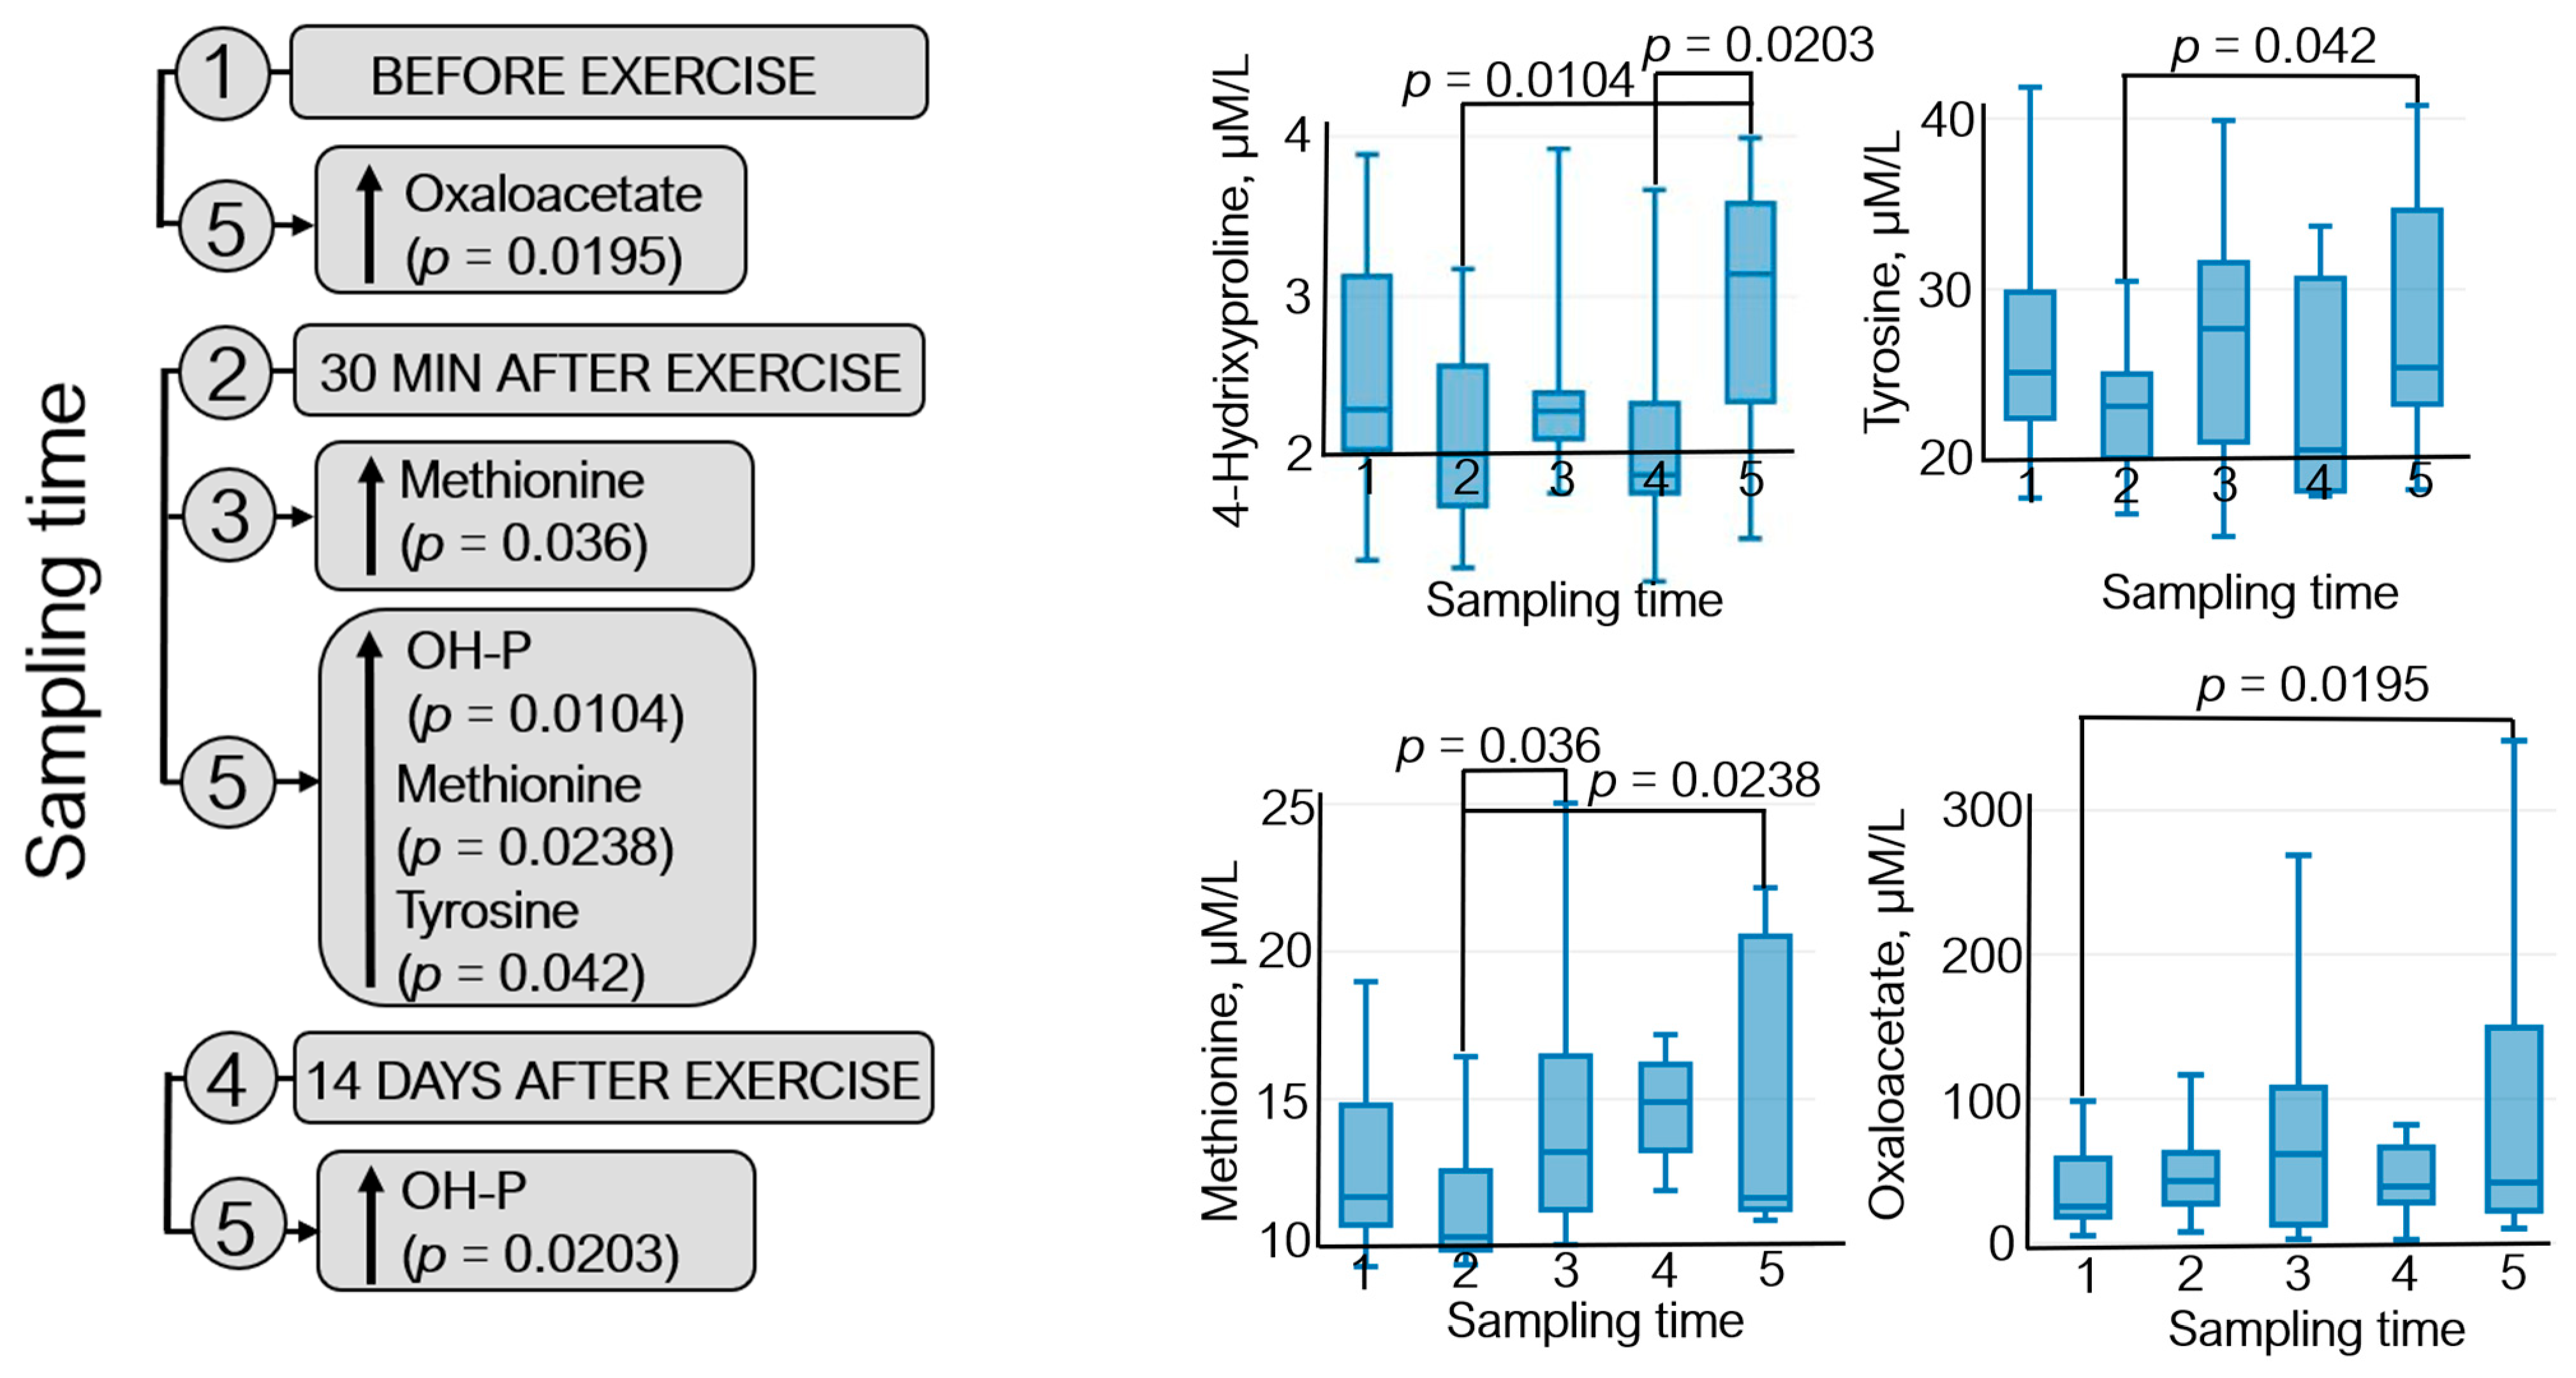
3.2. Metabolomic Analysis
3.3. Analysis of Blood Biochemistry Parameters
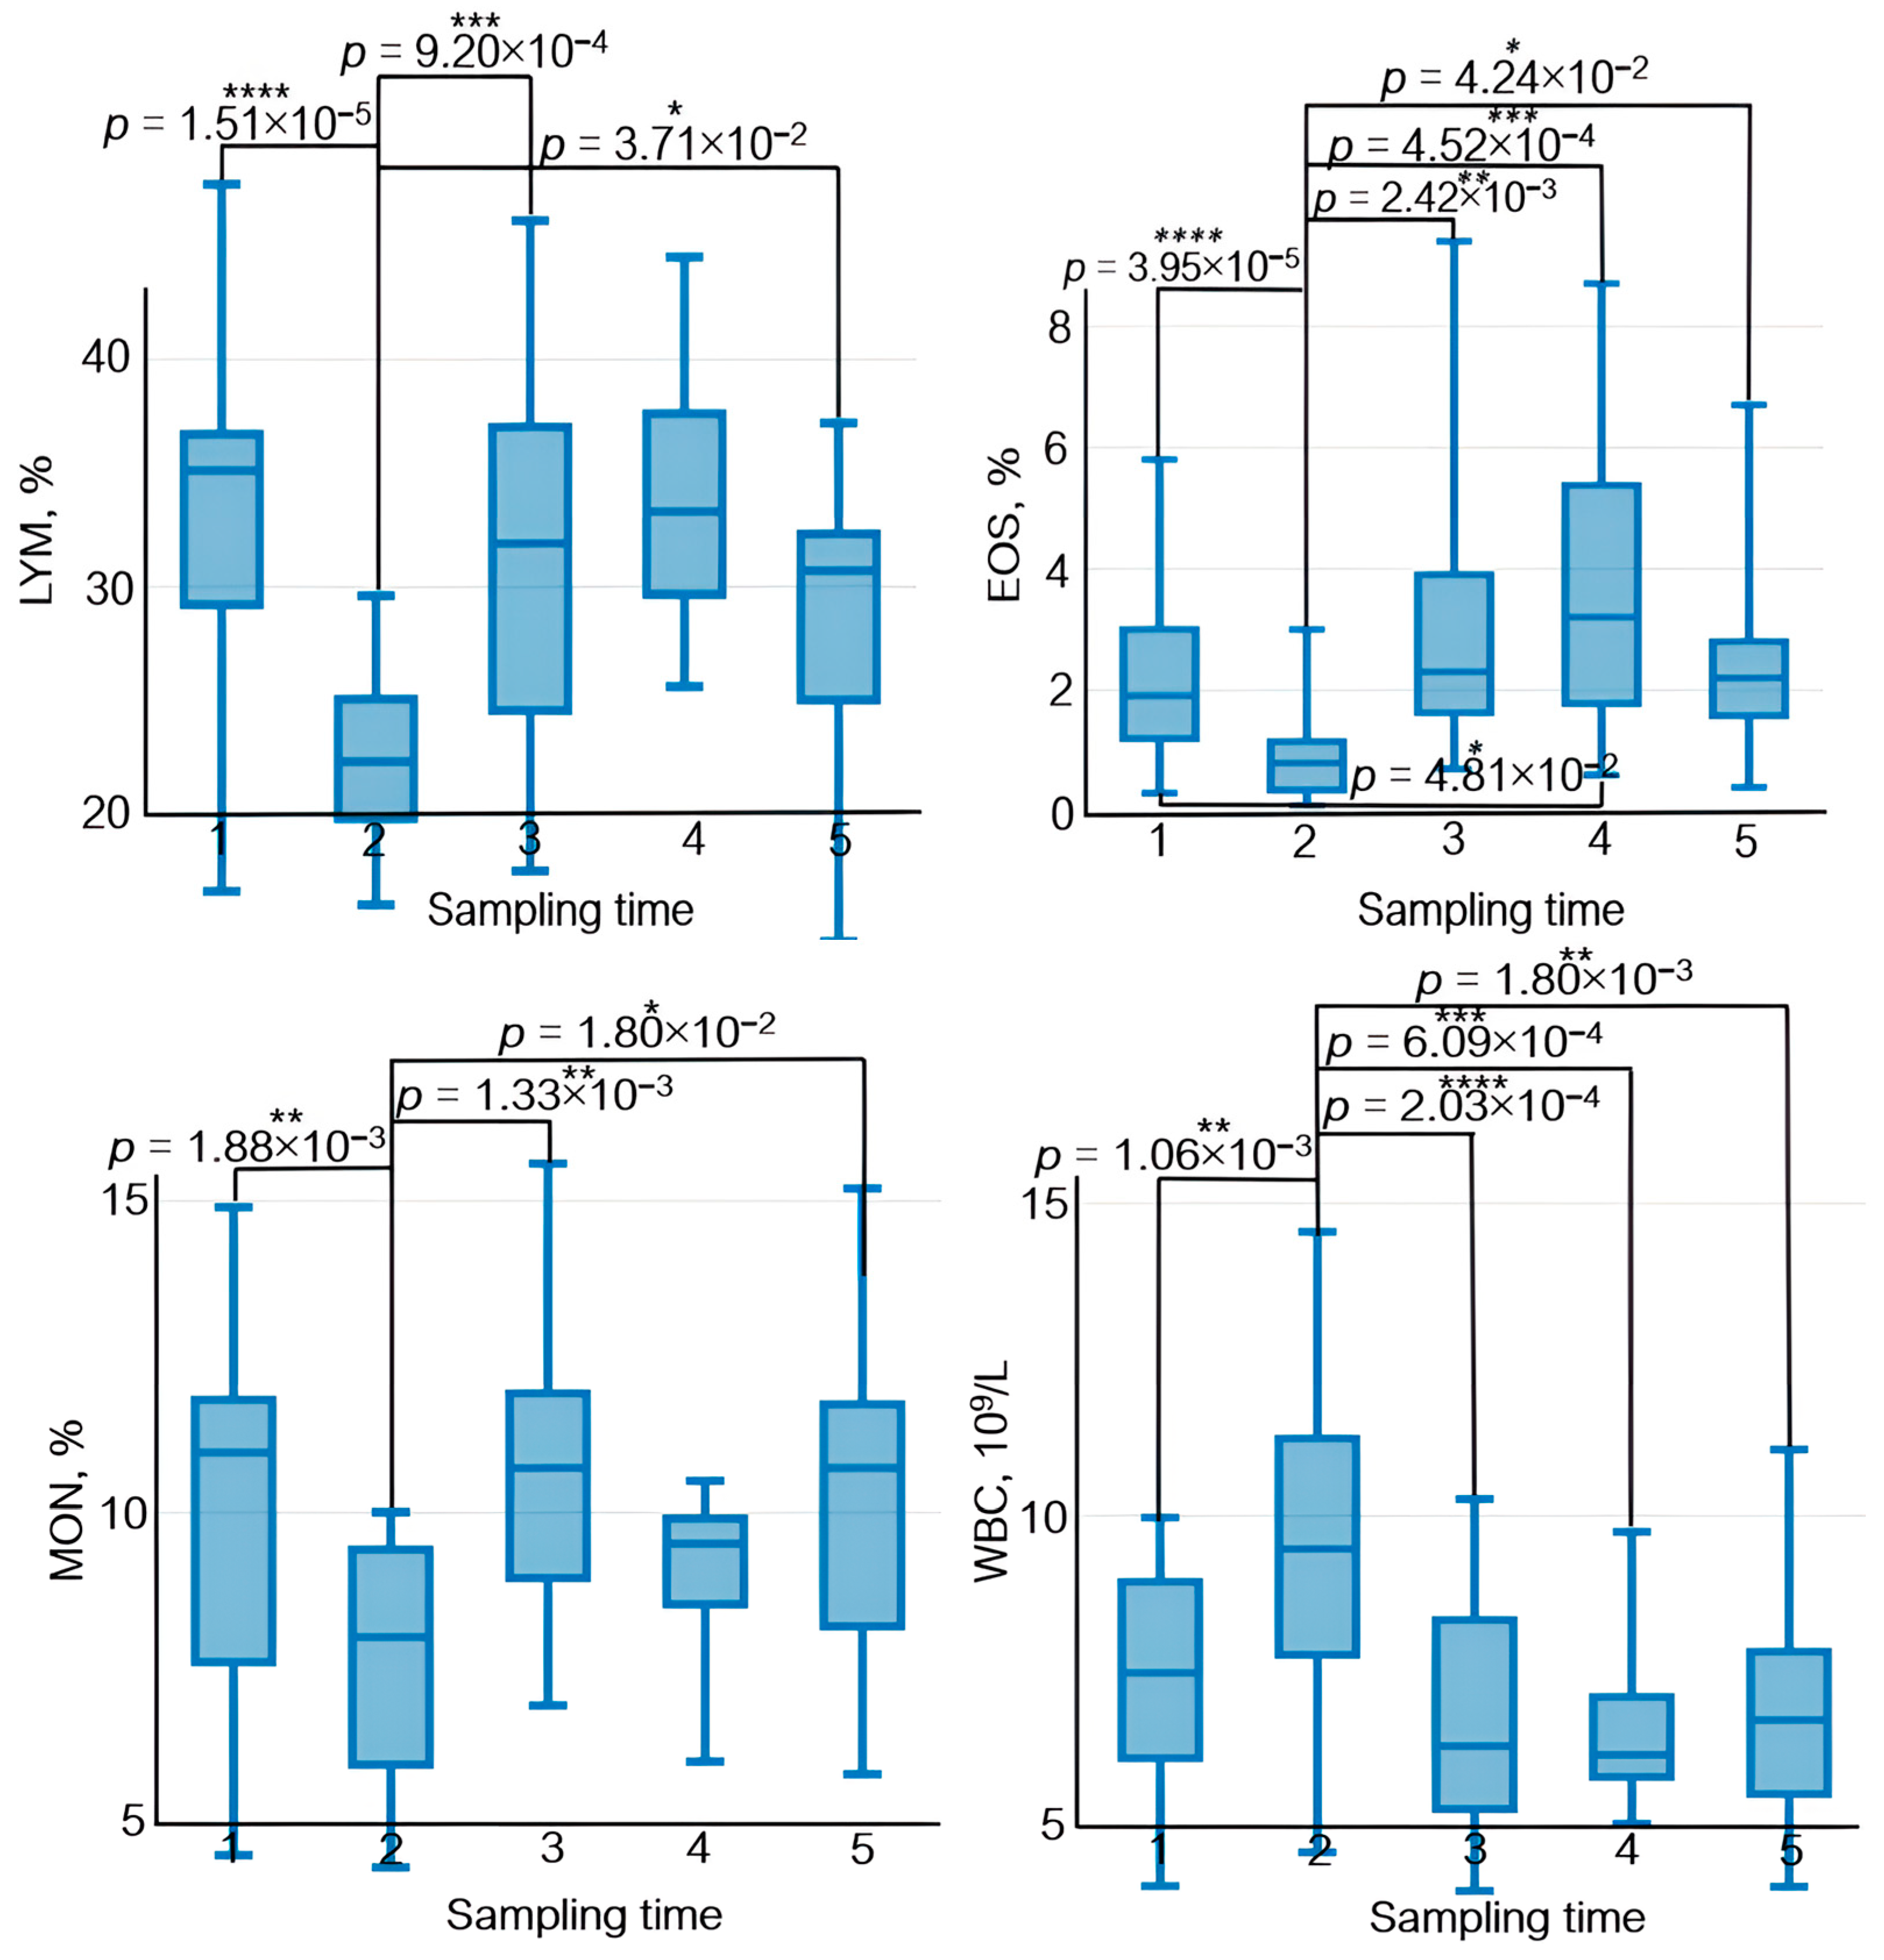
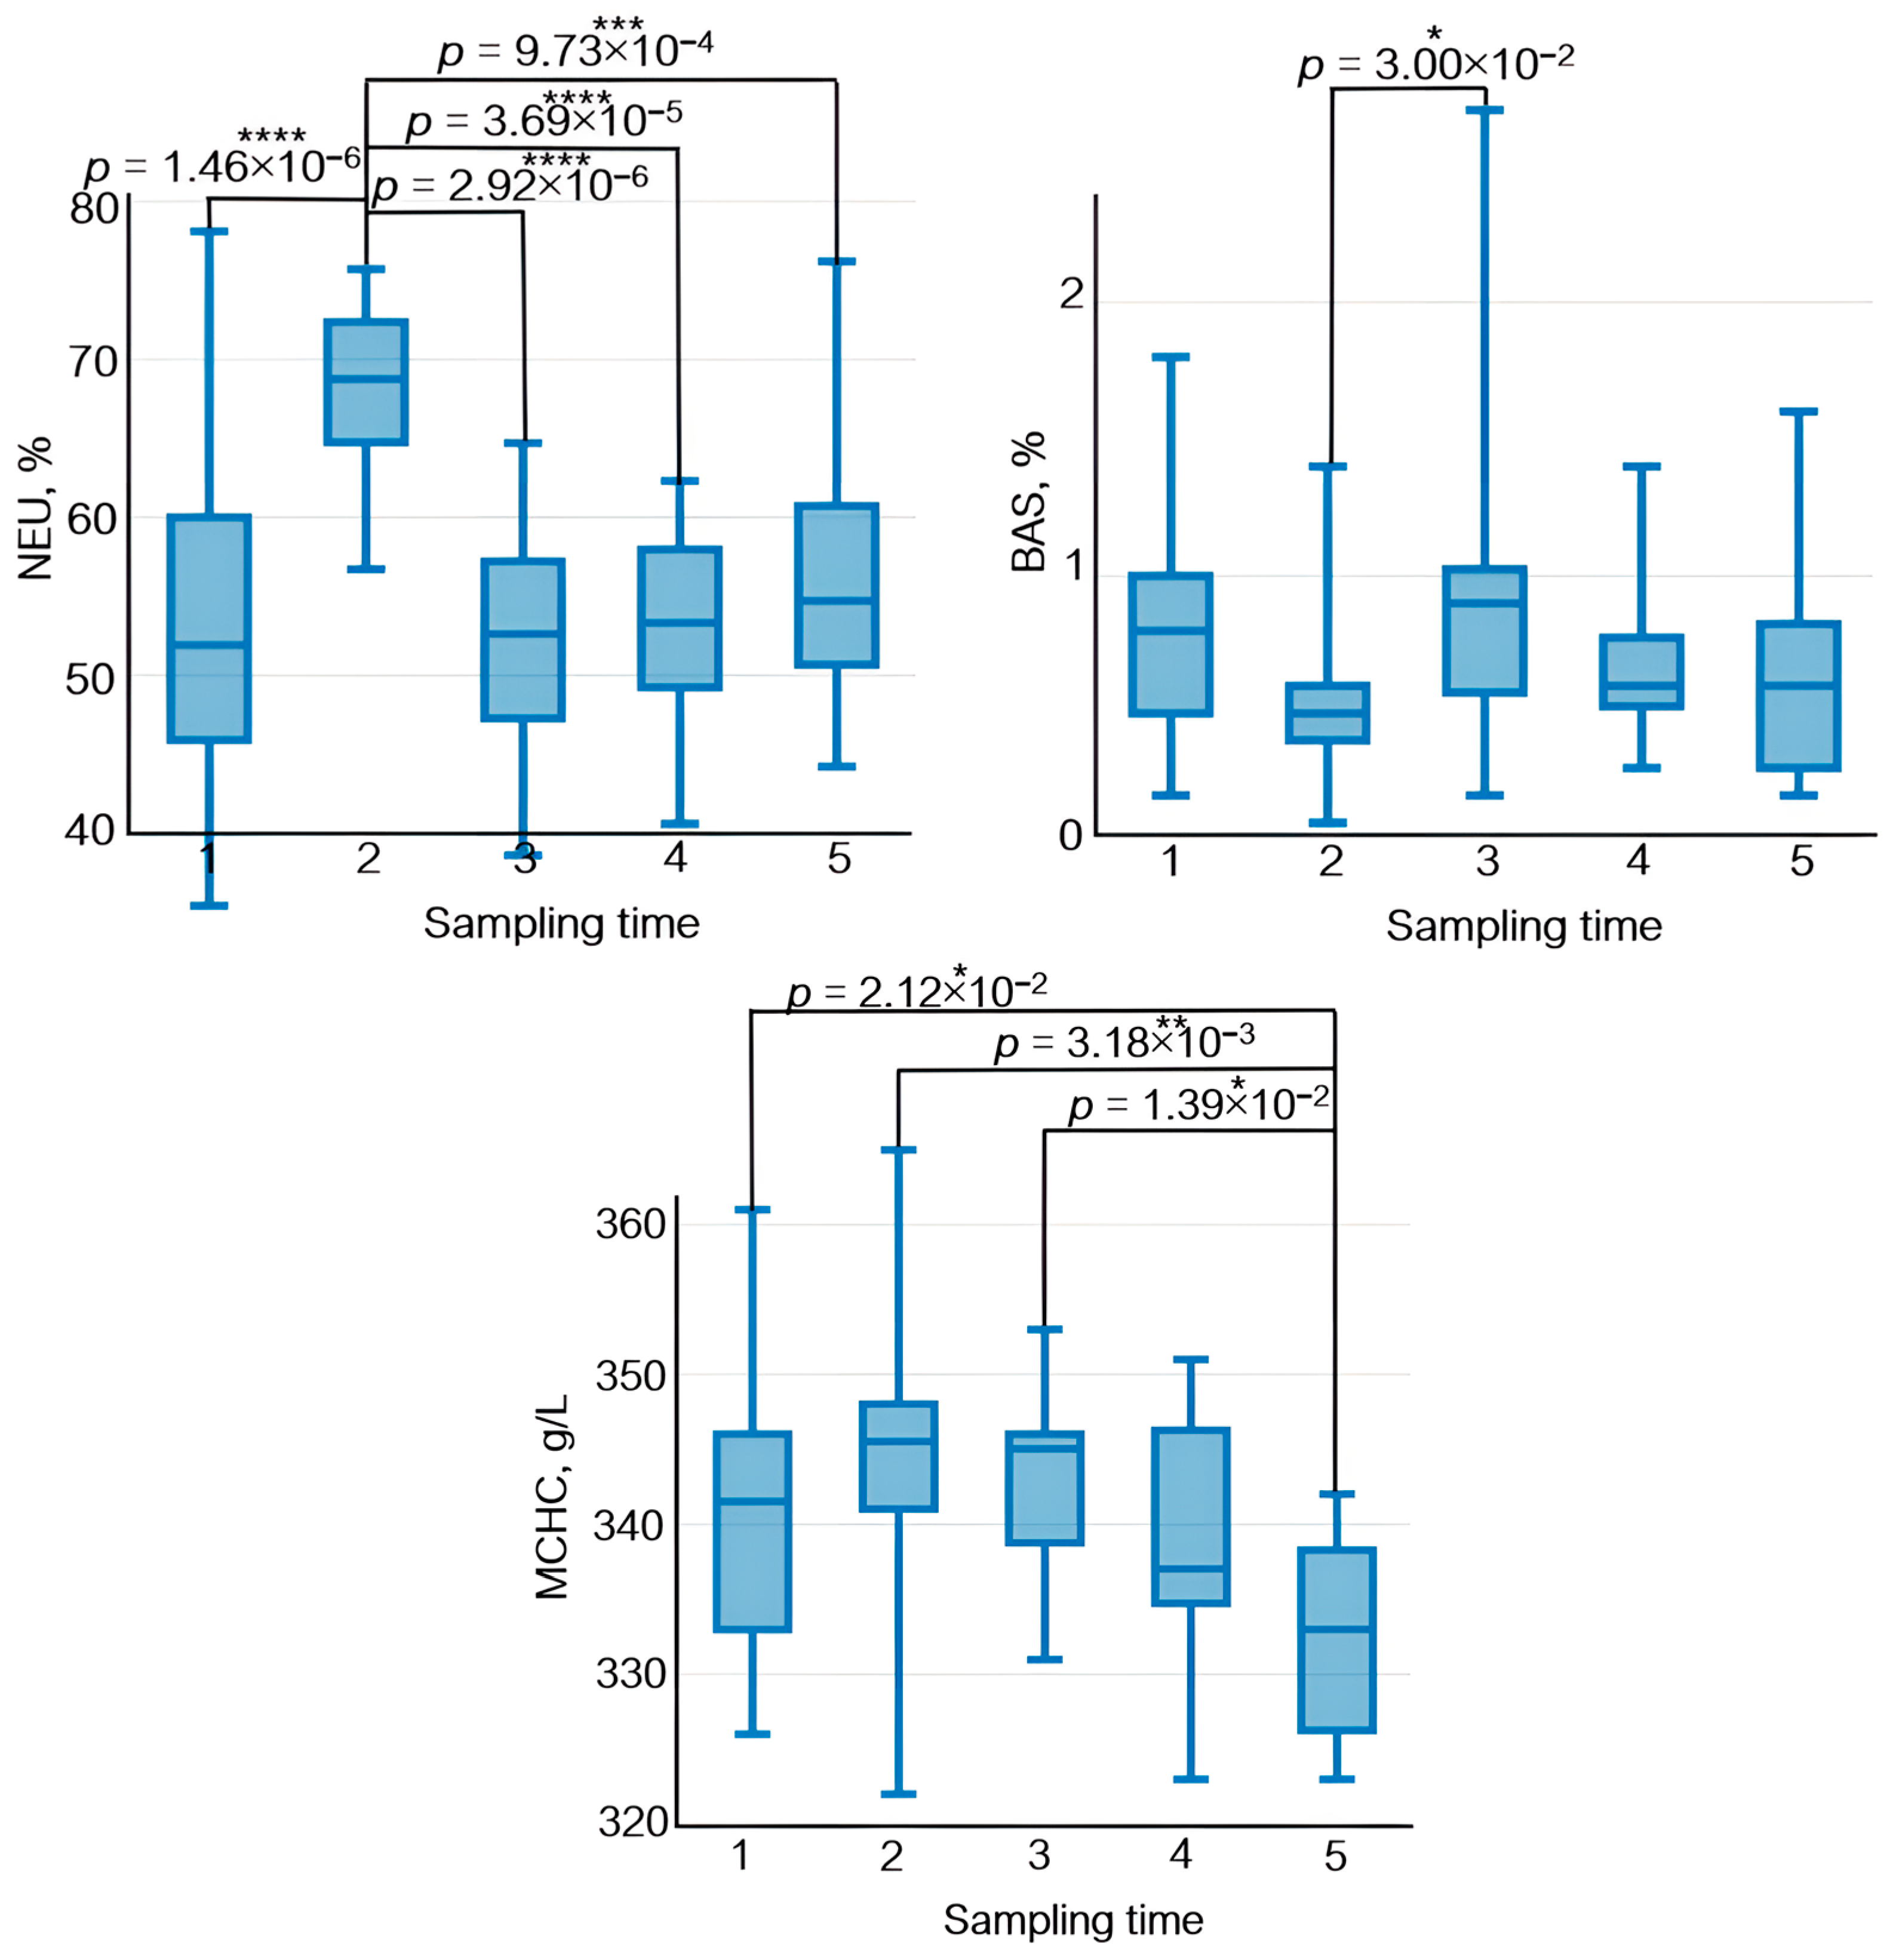
3.4. Analysis of Complete Blood Count Parameters
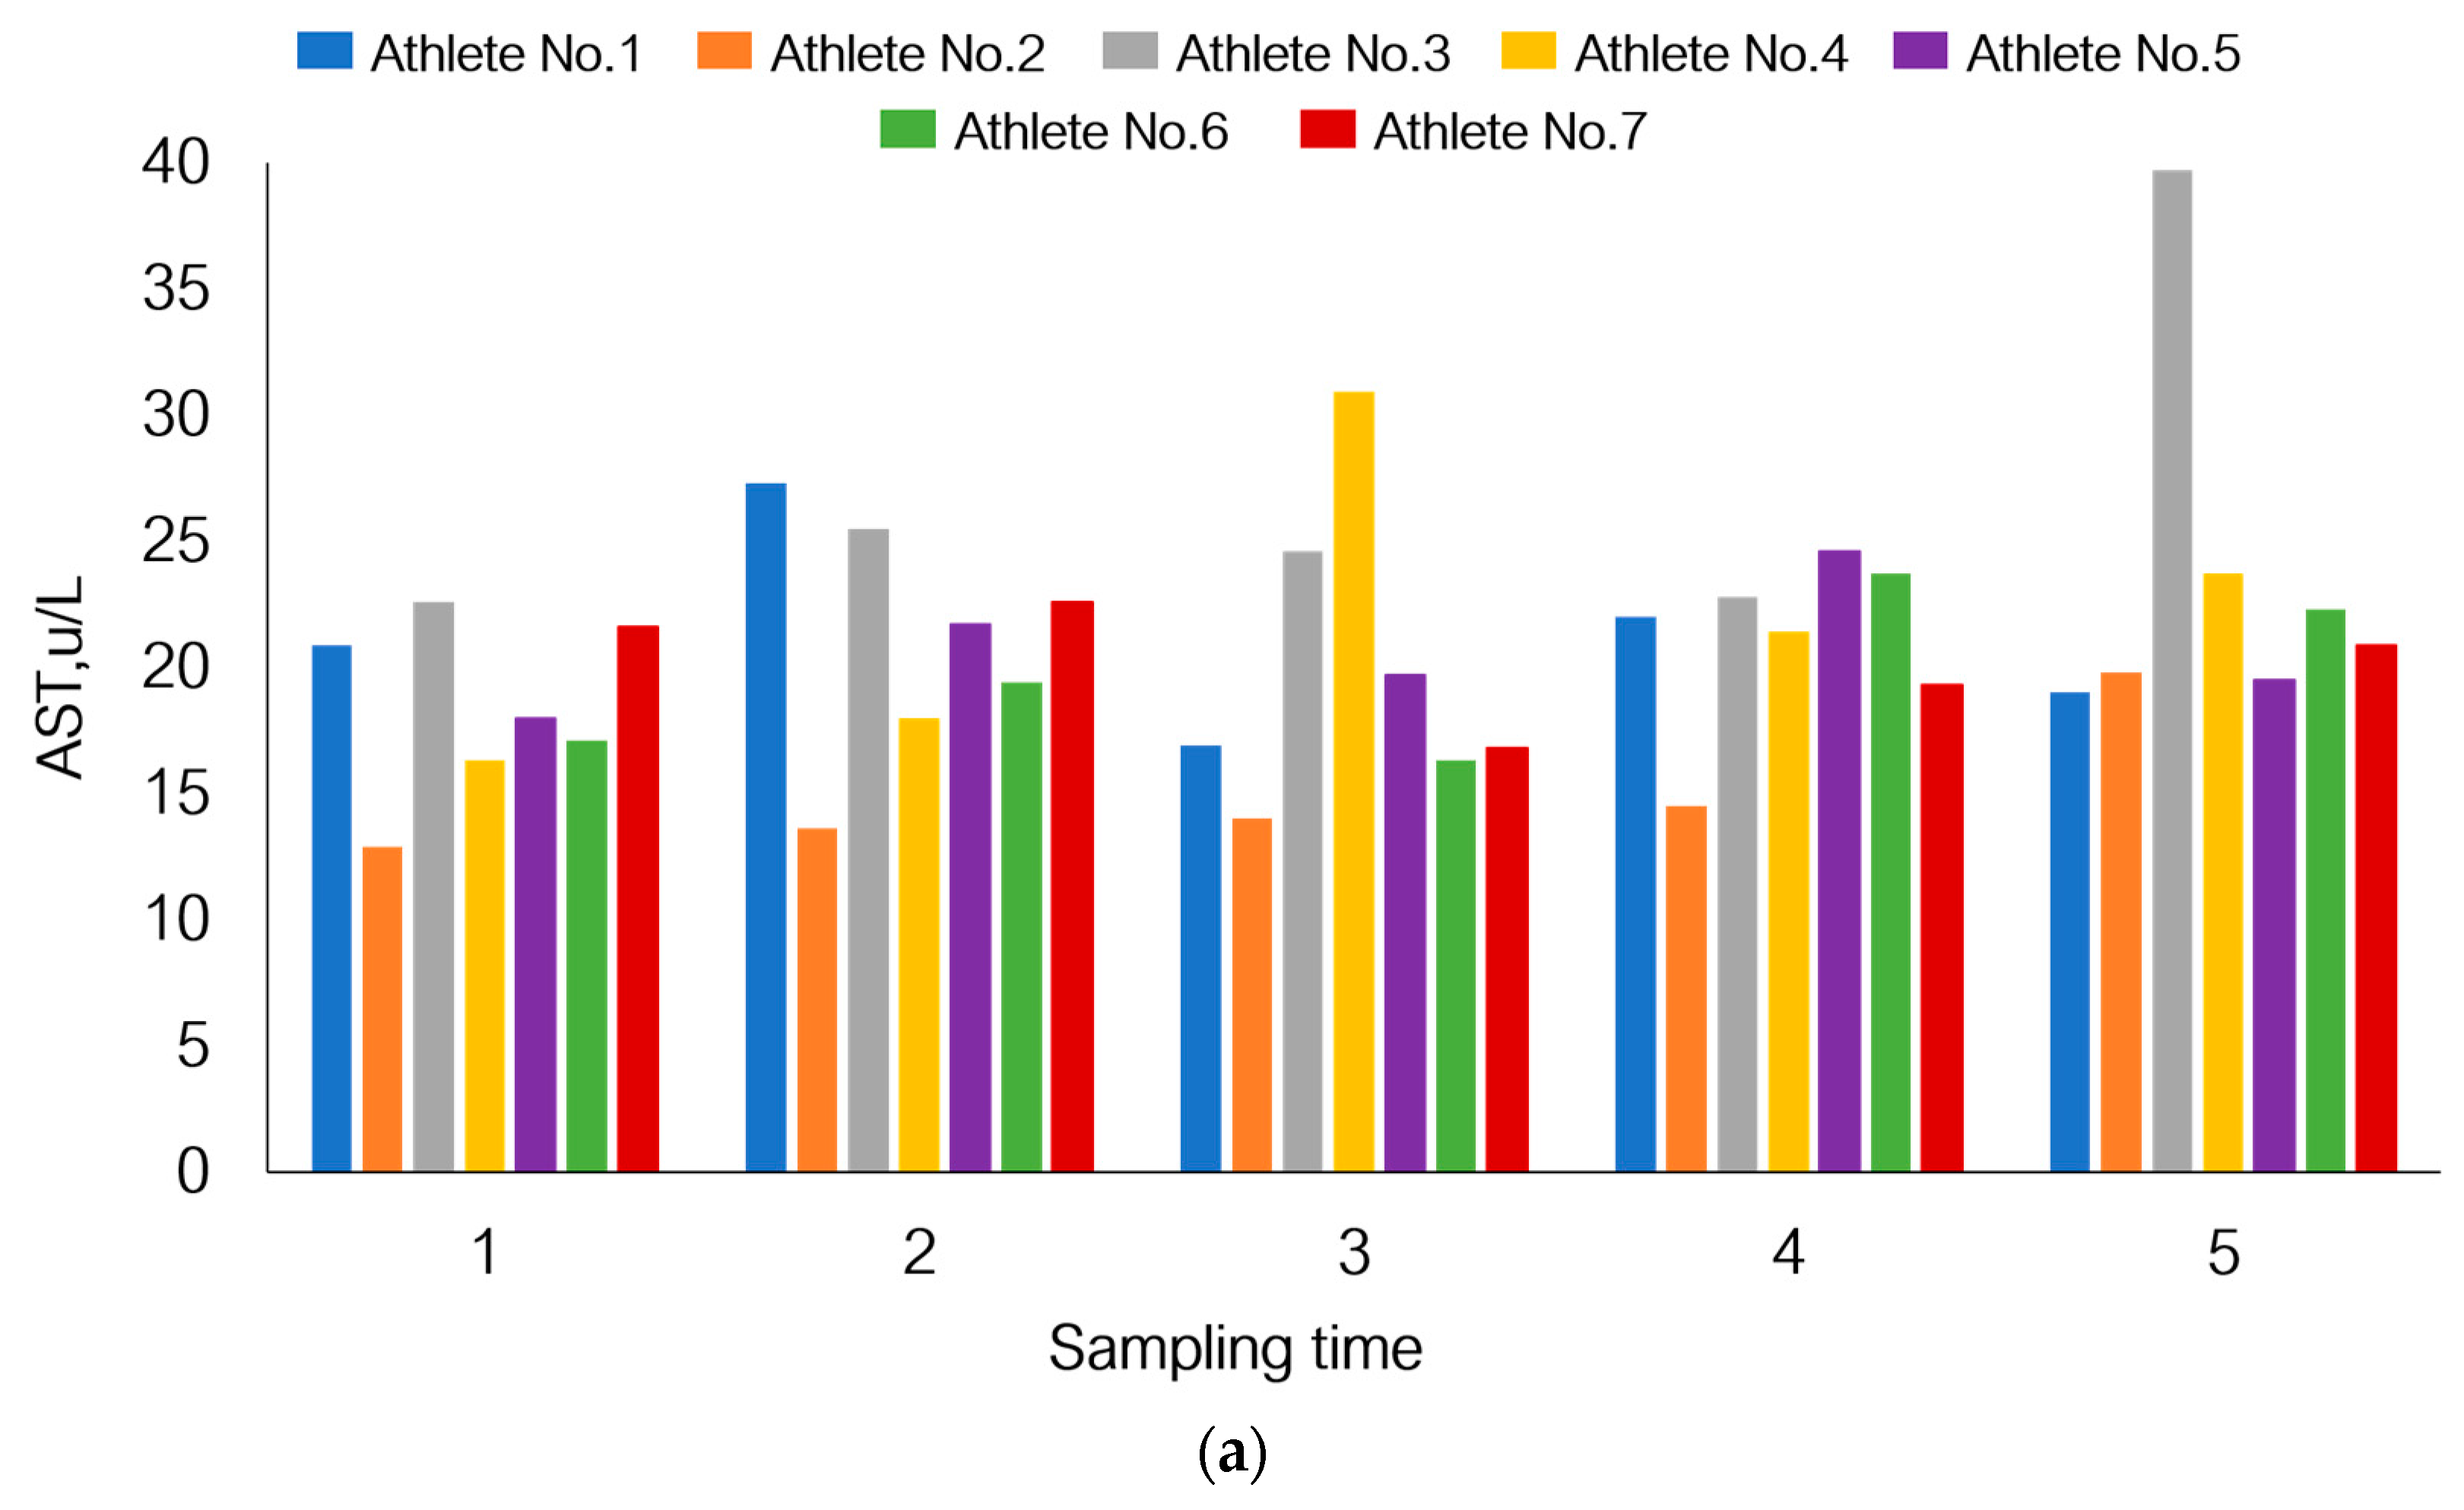
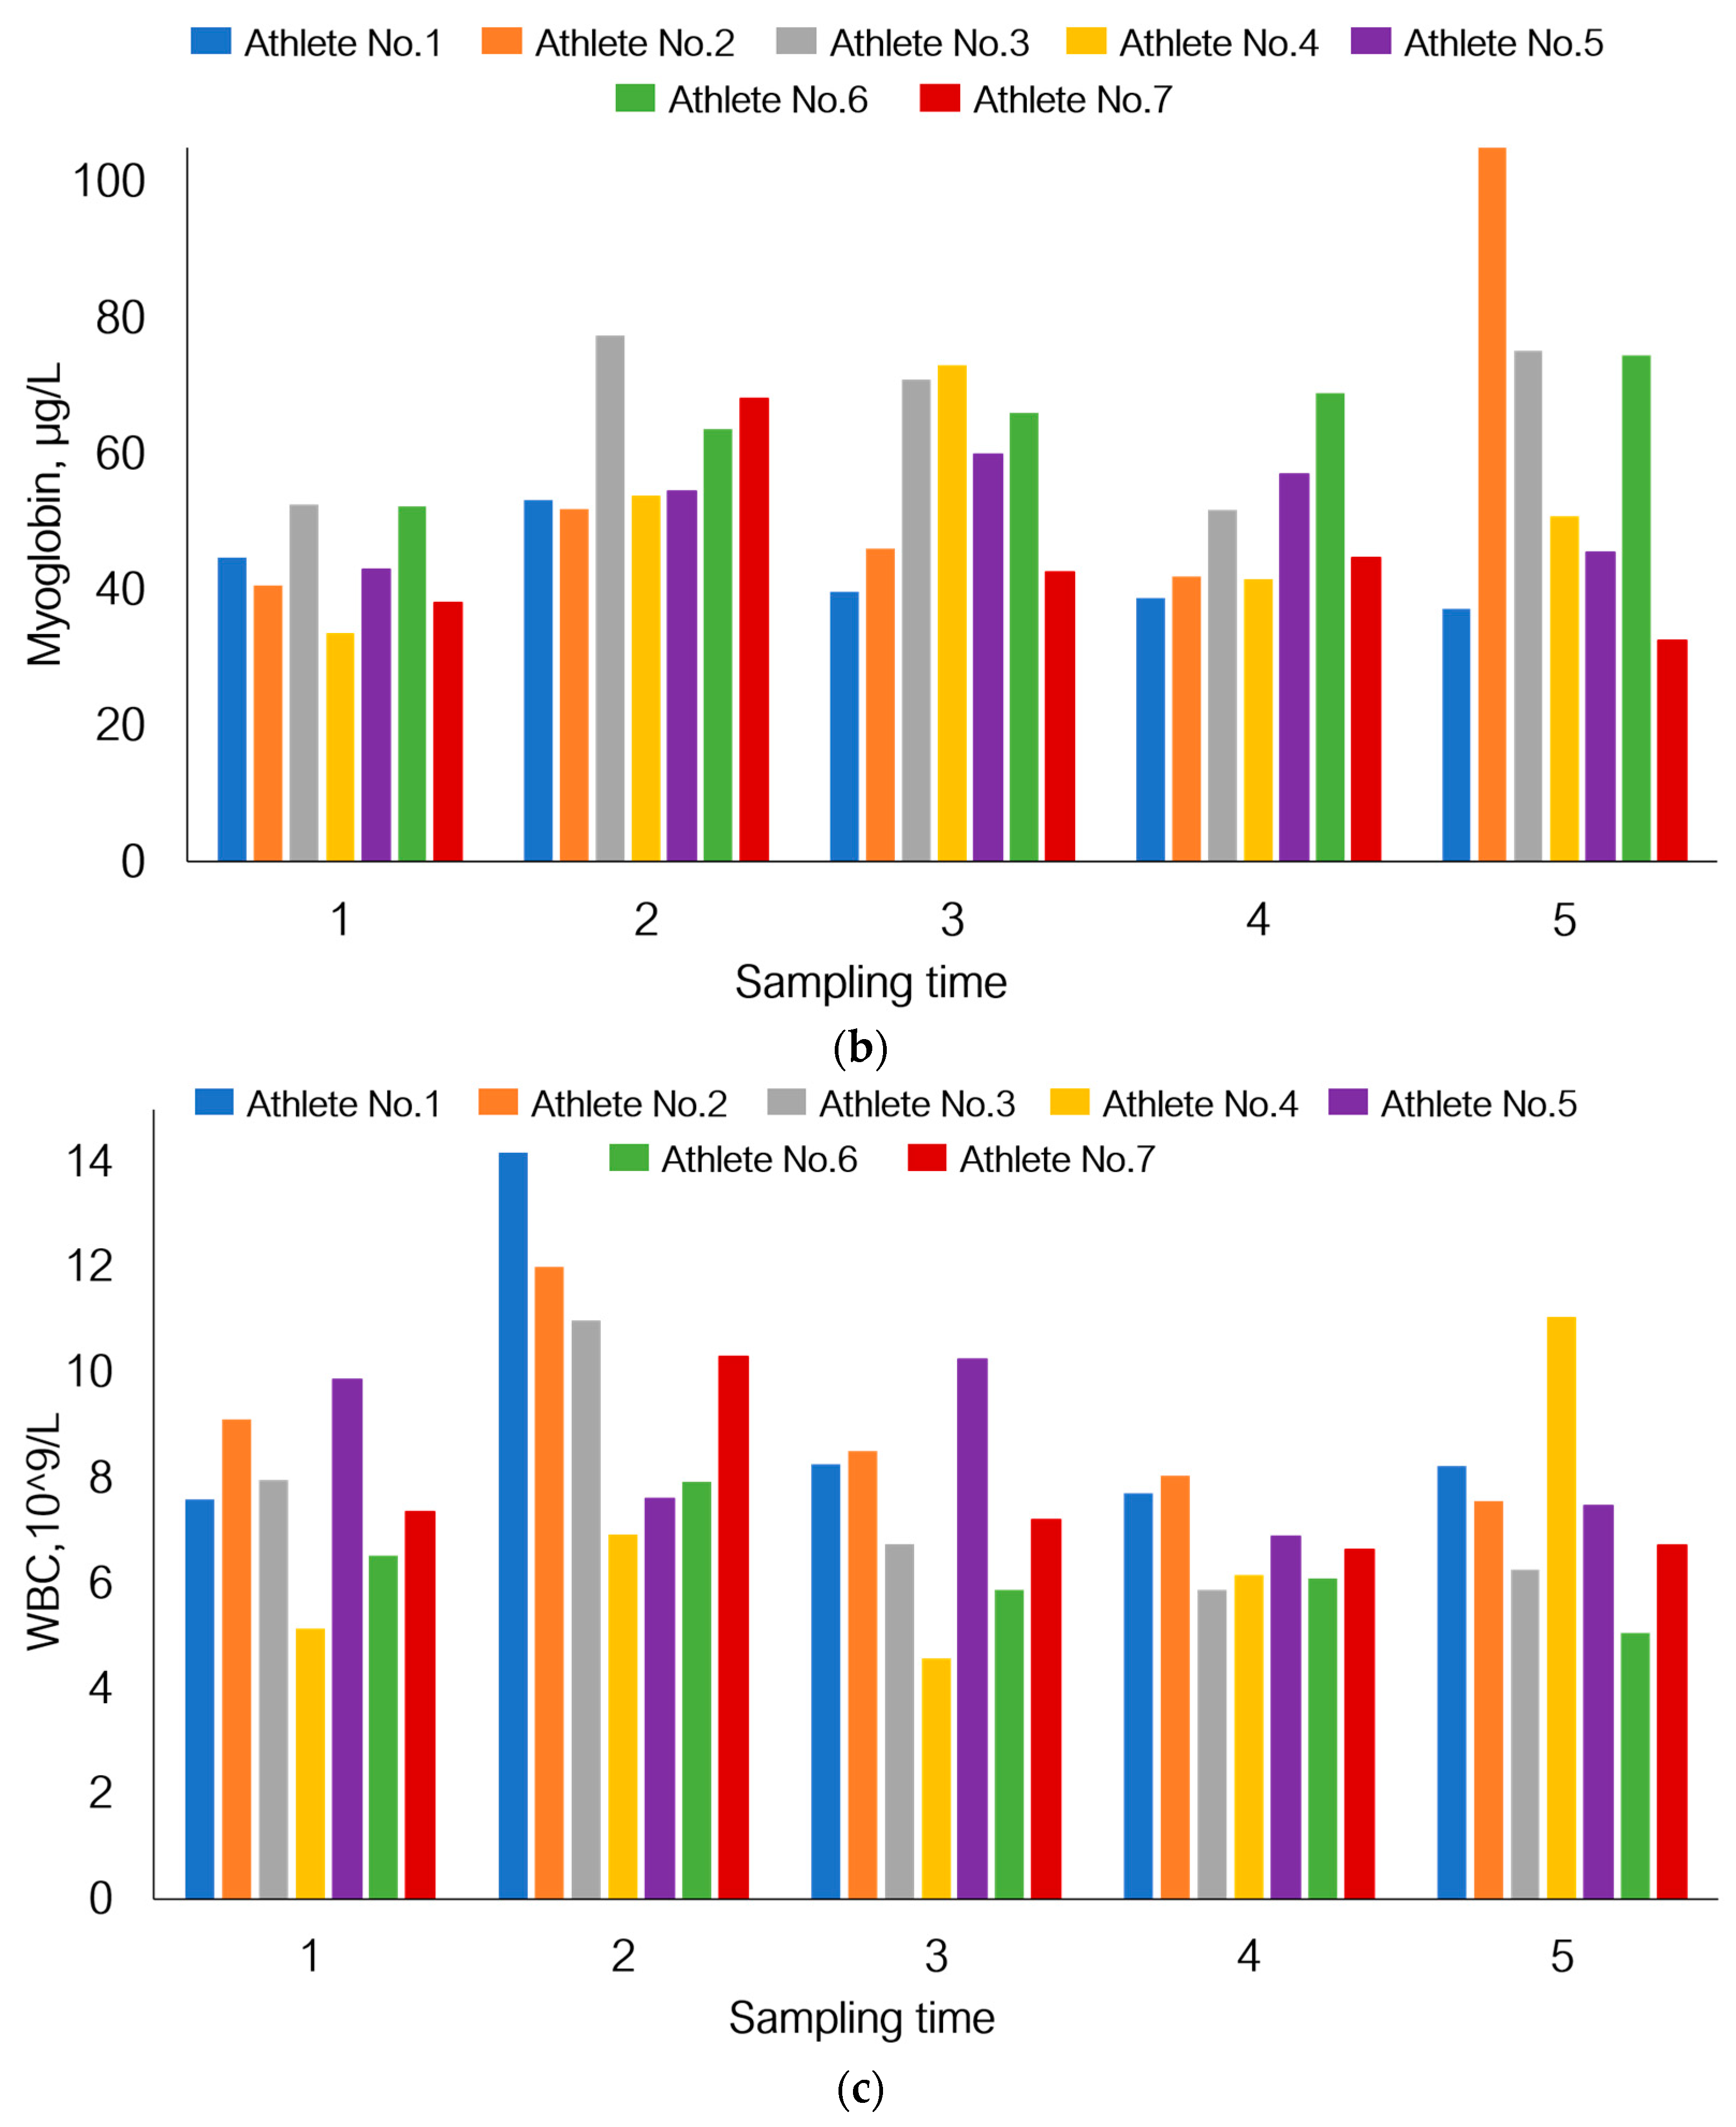
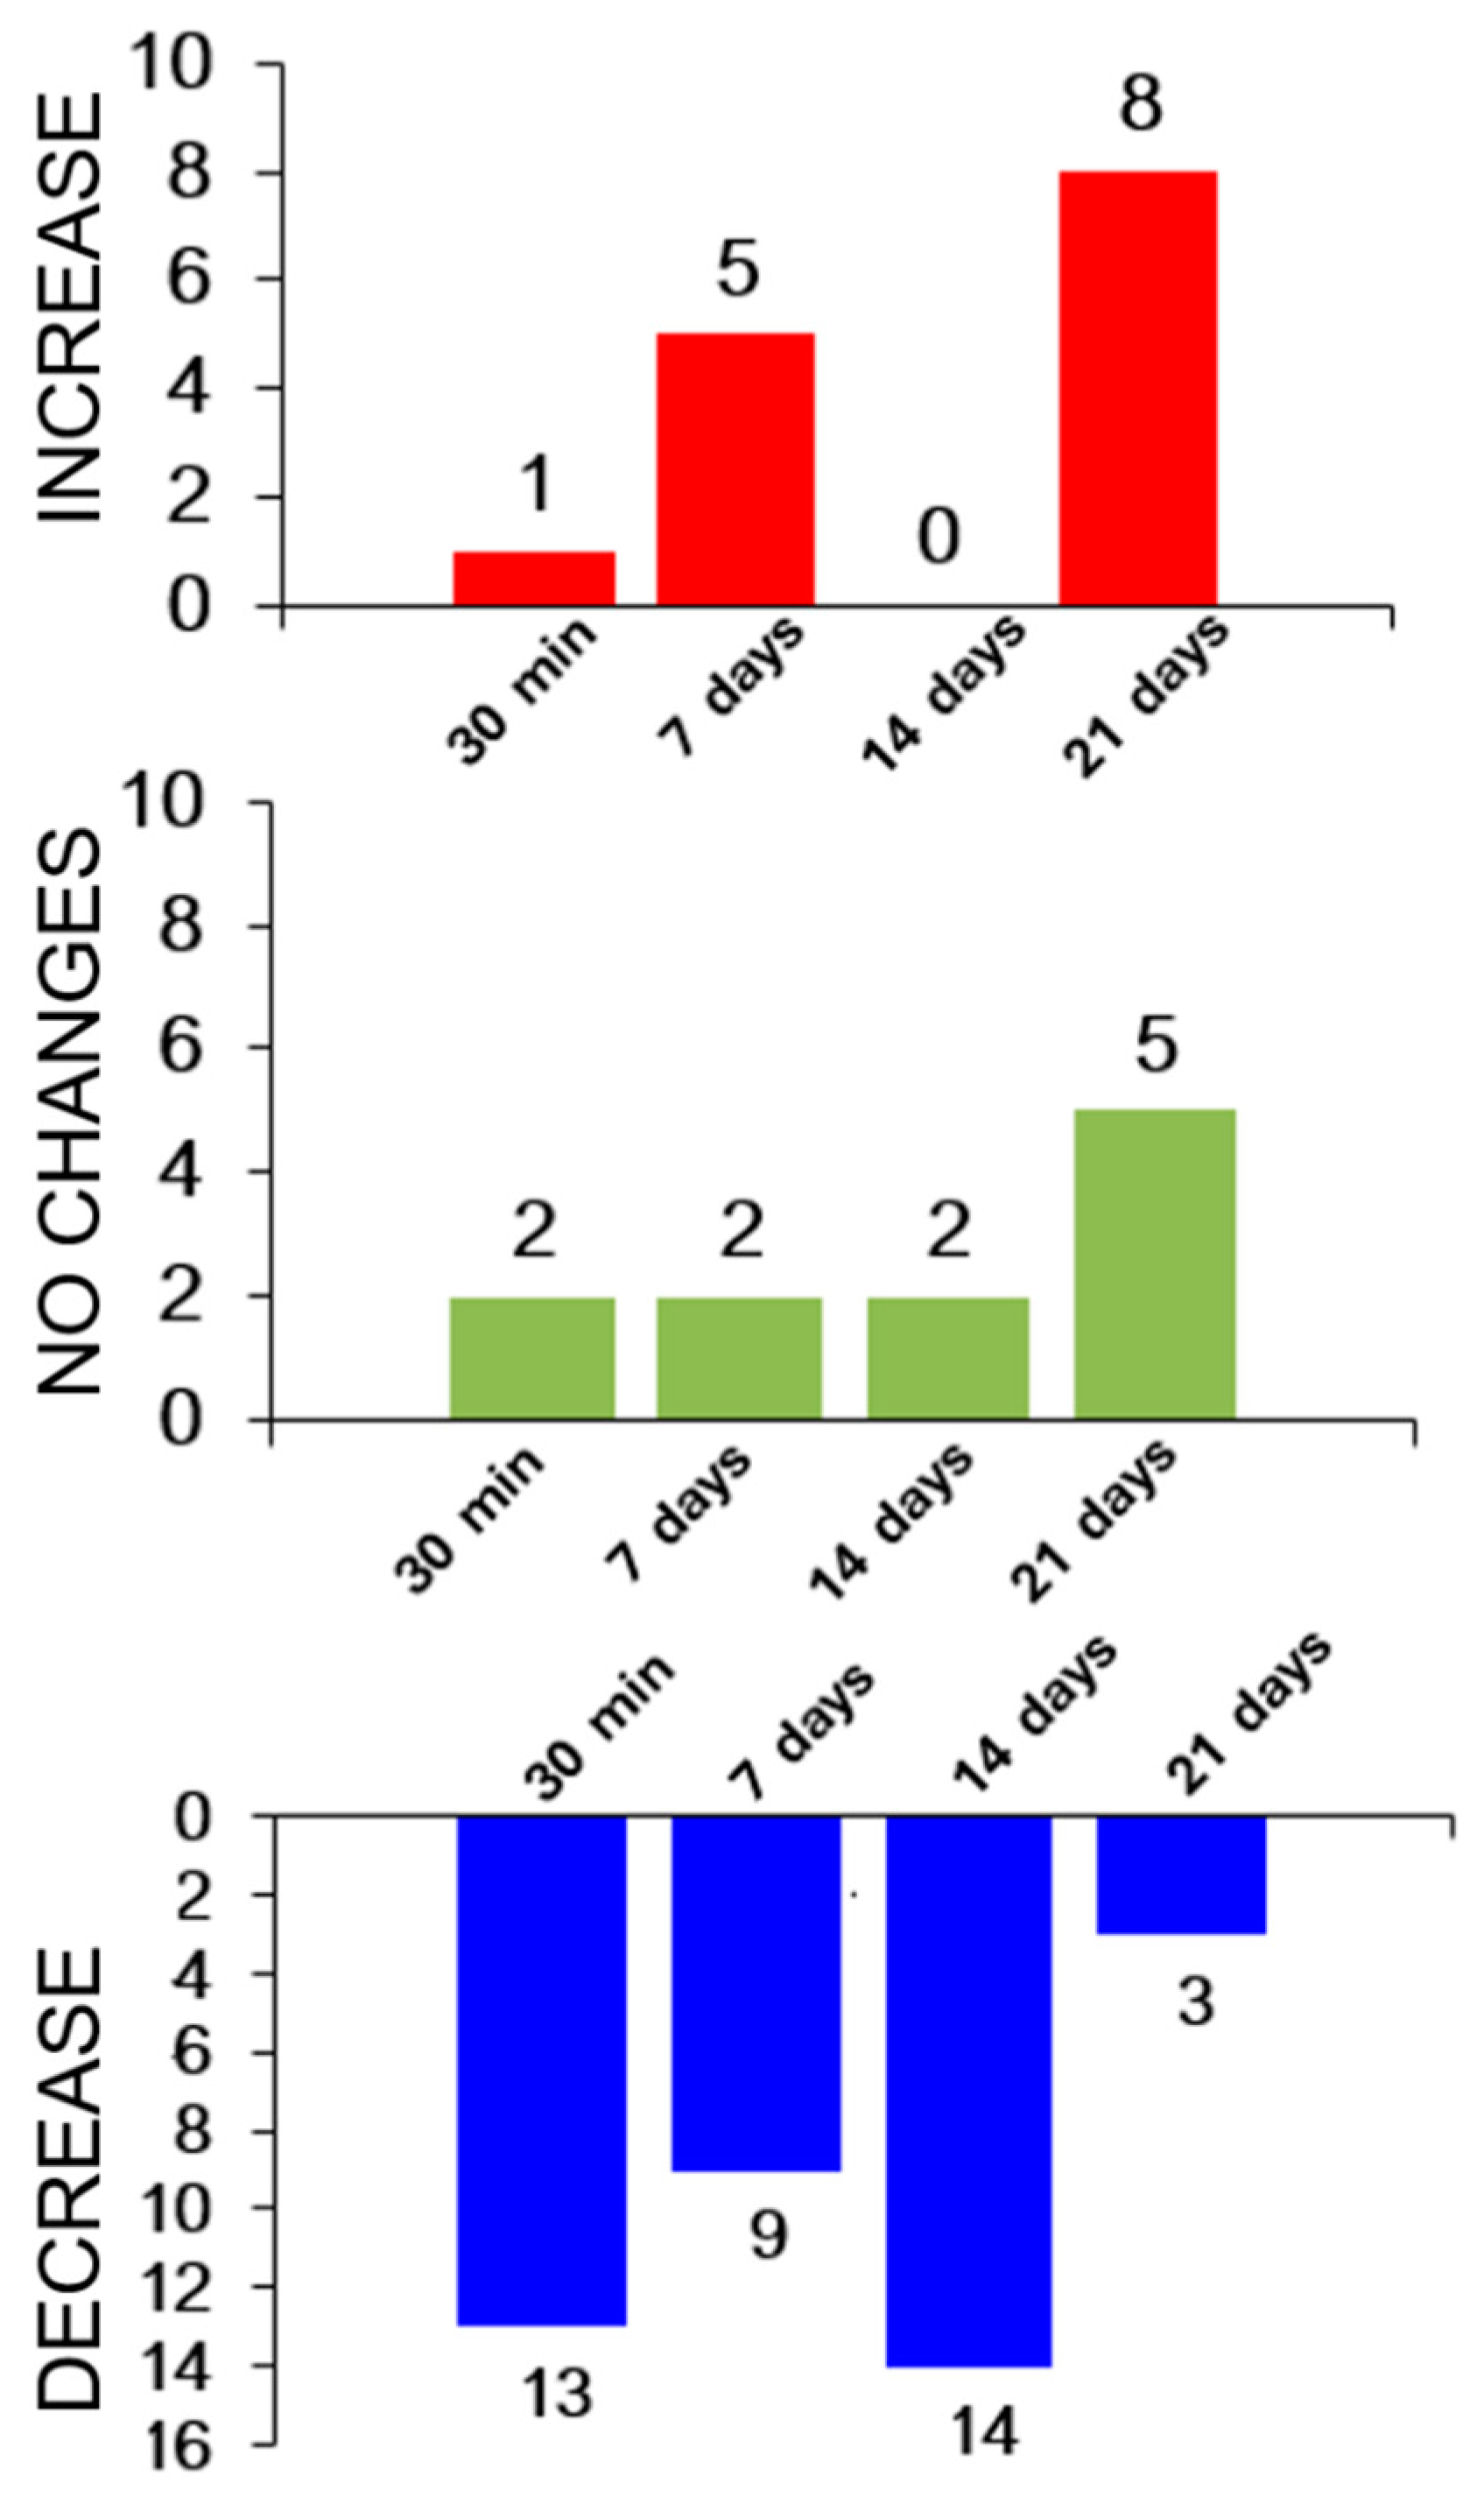
3.5. Individual Variations in Adaptation to Load under Hypoxic Conditions
4. Discussion
4.1. The Immune System and Exercise Load
4.2. Biomarkers for Oxygen Transport
4.3. Biomarkers for Muscle Damage and Inflammation
4.4. Biomarkers for Metabolic Fitness and Performance
4.5. Hemostasis and Physical Training
4.6. Health Risks for Athletes Performing Physical Activity under Hypoxic Conditions
4.7. The Prospects for the Research into Novel Biomarkers
5. Conclusions
6. Limitations
Supplementary Materials
Author Contributions
Funding
Institutional Review Board Statement
Informed Consent Statement
Data Availability Statement
Acknowledgments
Conflicts of Interest
References
- Malsagova, K.A.; Butkova, T.V.; Kopylov, A.T.; Izotov, A.A.; Rudnev, V.R.; Klyuchnikov, M.S.; Stepanov, A.A.; Kaysheva, A.L. Molecular Portrait of an Athlete. Diagnostics 2021, 11, 1095. [Google Scholar] [CrossRef] [PubMed]
- Contrepois, K.; Wu, S.; Moneghetti, K.J.; Hornburg, D.; Ahadi, S.; Tsai, M.-S.; Metwally, A.A.; Wei, E.; Lee-McMullen, B.; Quijada, J.V.; et al. Molecular Choreography of Acute Exercise. Cell 2020, 181, 1112–1130.e16. [Google Scholar] [CrossRef] [PubMed]
- Haller, N.; Reichel, T.; Zimmer, P.; Behringer, M.; Wahl, P.; Stöggl, T.; Krüger, K.; Simon, P. Blood-Based Biomarkers for Managing Workload in Athletes: Perspectives for Research on Emerging Biomarkers. Sports Med. 2023, 53, 2039–2053. [Google Scholar] [CrossRef] [PubMed]
- Elrayess, M.A.; Botrè, F.; Palermo, A. Editorial: OMICS-Based Approaches in Sports Research. Front. Mol. Biosci. 2022, 9, 870728. [Google Scholar] [CrossRef] [PubMed]
- Pitsiladis, Y.P.; Tanaka, M.; Eynon, N.; Bouchard, C.; North, K.N.; Williams, A.G.; Collins, M.; Moran, C.N.; Britton, S.L.; Fuku, N.; et al. Athlome Project Consortium: A Concerted Effort to Discover Genomic and Other “Omic” Markers of Athletic Performance. Physiol. Genomics 2016, 48, 183–190. [Google Scholar] [CrossRef] [PubMed]
- Tanisawa, K.; Wang, G.; Seto, J.; Verdouka, I.; Twycross-Lewis, R.; Karanikolou, A.; Tanaka, M.; Borjesson, M.; Di Luigi, L.; Dohi, M.; et al. Sport and Exercise Genomics: The FIMS 2019 Consensus Statement Update. Br. J. Sports Med. 2020, 54, 969–975. [Google Scholar] [CrossRef]
- Sellami, M.; Bragazzi, N.L. The Effect of Sport and Physical Activity on Transport Proteins: Implications for Cancer Prevention and Control. Adv. Protein Chem. Struct. Biol. 2021, 123, 17–26. [Google Scholar] [CrossRef]
- Williams, S.A.; Kivimaki, M.; Langenberg, C.; Hingorani, A.D.; Casas, J.P.; Bouchard, C.; Jonasson, C.; Sarzynski, M.A.; Shipley, M.J.; Alexander, L.; et al. Plasma Protein Patterns as Comprehensive Indicators of Health. Nat. Med. 2019, 25, 1851–1857. [Google Scholar] [CrossRef]
- Chow, L.S.; Gerszten, R.E.; Taylor, J.M.; Pedersen, B.K.; van Praag, H.; Trappe, S.; Febbraio, M.A.; Galis, Z.S.; Gao, Y.; Haus, J.M.; et al. Exerkines in Health, Resilience and Disease. Nat. Rev. Endocrinol. 2022, 18, 273–289. [Google Scholar] [CrossRef]
- Robbins, J.M.; Rao, P.; Deng, S.; Keyes, M.J.; Tahir, U.A.; Katz, D.H.; Beltran, P.M.J.; Marchildon, F.; Barber, J.L.; Peterson, B.; et al. Plasma Proteomic Changes in Response to Exercise Training Are Associated with Cardiorespiratory Fitness Adaptations. JCI Insight 2023, 8, e165867. [Google Scholar] [CrossRef]
- Guseh, J.S.; Churchill, T.W.; Yeri, A.; Lo, C.; Brown, M.; Houstis, N.E.; Aragam, K.G.; Lieberman, D.E.; Rosenzweig, A.; Baggish, A.L. An Expanded Repertoire of Intensity-Dependent Exercise-Responsive Plasma Proteins Tied to Loci of Human Disease Risk. Sci. Rep. 2020, 10, 10831. [Google Scholar] [CrossRef] [PubMed]
- Kurgan, N.; Noaman, N.; Pergande, M.R.; Cologna, S.M.; Coorssen, J.R.; Klentrou, P. Changes to the Human Serum Proteome in Response to High Intensity Interval Exercise: A Sequential Top-Down Proteomic Analysis. Front. Physiol. 2019, 10, 362. [Google Scholar] [CrossRef] [PubMed]
- Mi, M.Y.; Barber, J.L.; Rao, P.; Farrell, L.A.; Sarzynski, M.A.; Bouchard, C.; Robbins, J.M.; Gerszten, R.E. Plasma Proteomic Kinetics in Response to Acute Exercise. Mol. Cell. Proteomics 2023, 22, 100601. [Google Scholar] [CrossRef] [PubMed]
- Poortmans, J.; Jeanloz, R.W. Quantitative Immunological Determination of 12 Plasma Proteins Excreted in Human Urine Collected before and after Exercise. J. Clin. Investig. 1968, 47, 386–393. [Google Scholar] [CrossRef] [PubMed]
- Kristensen, J.H.; Karsdal, M.A.; Genovese, F.; Johnson, S.; Svensson, B.; Jacobsen, S.; Hägglund, P.; Leeming, D.J. The Role of Extracellular Matrix Quality in Pulmonary Fibrosis. Respir. Int. Rev. Thorac. Dis. 2014, 88, 487–499. [Google Scholar] [CrossRef] [PubMed]
- Genovese, F.; Karsdal, M.A. Protein Degradation Fragments as Diagnostic and Prognostic Biomarkers of Connective Tissue Diseases: Understanding the Extracellular Matrix Message and Implication for Current and Future Serological Biomarkers. Expert Rev. Proteomics 2016, 13, 213–225. [Google Scholar] [CrossRef] [PubMed]
- Bongiovanni, T.; Pintus, R.; Dessì, A.; Noto, A.; Sardo, S.; Finco, G.; Corsello, G.; Fanos, V. Sportomics: Metabolomics Applied to Sports. The New Revolution? Eur. Rev. Med. Pharmacol. Sci. 2019, 23, 11011–11019. [Google Scholar] [CrossRef] [PubMed]
- Long, T.; Hicks, M.; Yu, H.-C.; Biggs, W.H.; Kirkness, E.F.; Menni, C.; Zierer, J.; Small, K.S.; Mangino, M.; Messier, H.; et al. Whole-Genome Sequencing Identifies Common-to-Rare Variants Associated with Human Blood Metabolites. Nat. Genet. 2017, 49, 568–578. [Google Scholar] [CrossRef]
- Malsagova, K.A.; Kopylov, A.T.; Stepanov, A.A.; Enikeev, D.V.; Potoldykova, N.V.; Balakin, E.I.; Pustovoyt, V.I.; Kaysheva, A.L. Molecular Profiling of Athletes Performing High-Intensity Exercises in Extreme Environments. Sports 2023, 11, 36. [Google Scholar] [CrossRef]
- Nunes, M.J.; Moura, J.J.G.; Noronha, J.P.; Branco, L.C.; Samhan-Arias, A.; Sousa, J.P.; Rouco, C.; Cordas, C.M. Evaluation of Sweat-Sampling Procedures for Human Stress-Biomarker Detection. Analytica 2022, 3, 178–194. [Google Scholar] [CrossRef]
- Katsani, K.R.; Sakellari, D. Saliva Proteomics Updates in Biomedicine. J. Biol. Res.-Thessalon. 2019, 26, 17. [Google Scholar] [CrossRef]
- Kaur, G.; Poljak, A.; Ali, S.A.; Zhong, L.; Raftery, M.J.; Sachdev, P. Extending the Depth of Human Plasma Proteome Coverage Using Simple Fractionation Techniques. J. Proteome Res. 2021, 20, 1261–1279. [Google Scholar] [CrossRef]
- Tanaka, M.; Wang, G.; Pitsiladis, Y.P. Advancing Sports and Exercise Genomics: Moving from Hypothesis-Driven Single Study Approaches to Large Multi-Omics Collaborative Science. Physiol. Genom. 2016, 48, 173–174. [Google Scholar] [CrossRef] [PubMed]
- Wang, M.; Yu, G.; Ressom, H.W. Integrative Analysis of Proteomic, Glycomic, and Metabolomic Data for Biomarker Discovery. IEEE J. Biomed. Health Inform. 2016, 20, 1225–1231. [Google Scholar] [CrossRef] [PubMed]
- Al-Khelaifi, F.; Abraham, D.; Diboun, I.; Elrayess, M.A. Proteomics and Metabolomics Research in Exercise and Sport. In Sports, Exercise, and Nutritional Genomics; Elsevier: Amsterdam, The Netherlands, 2019; pp. 539–566. ISBN 978-0-12-816193-7. [Google Scholar]
- Morin, J.-B.; Samozino, P. Interpreting Power-Force-Velocity Profiles for Individualized and Specific Training. Int. J. Sports Physiol. Perform. 2016, 11, 267–272. [Google Scholar] [CrossRef] [PubMed]
- Sanford, J.A.; Nogiec, C.D.; Lindholm, M.E.; Adkins, J.N.; Amar, D.; Dasari, S.; Drugan, J.K.; Fernández, F.M.; Radom-Aizik, S.; Schenk, S.; et al. Molecular Transducers of Physical Activity Consortium (MoTrPAC): Mapping the Dynamic Responses to Exercise. Cell 2020, 181, 1464–1474. [Google Scholar] [CrossRef] [PubMed]
- Platonov, V.N. The System of Athletes Training in the Olympic Sport. In The General Theory and Its Practical Applications: Handbook for Trainer of Highest Qualification; Sovetsky Sport: Moscow, Russia, 2005; p. 820. [Google Scholar]
- Millet, G.P.; Roels, B.; Schmitt, L.; Woorons, X.; Richalet, J.P. Combining Hypoxic Methods for Peak Performance. Sports Med. Auckl. NZ 2010, 40, 1–25. [Google Scholar] [CrossRef] [PubMed]
- Millet, G.P.; Debevec, T.; Brocherie, F.; Malatesta, D.; Girard, O. Therapeutic Use of Exercising in Hypoxia: Promises and Limitations. Front. Physiol. 2016, 7, 224. [Google Scholar] [CrossRef] [PubMed]
- Stepanov, A.A.; Malsagova, K.A.; Kopylov, A.T.; Rudnev, V.R.; Karateev, D.E.; Markelova, E.I.; Luchikhina, E.L.; Borisova, E.E.; Kaysheva, A.L. Determination of Heterogeneous Proteomic and Metabolomic Response in Anti-TNF and Anti-IL-6 Treatment of Patients with Rheumatoid Arthritis. Life 2023, 13, 596. [Google Scholar] [CrossRef]
- Conway, J.; Lex, A.; Gehlenborg, N. UpSetR: An R Package for the Visualization of Intersecting Sets and Their Properties. Bioinforma. Oxf. Engl. 2017, 33. [Google Scholar] [CrossRef]
- Sinex, J.A.; Chapman, R.F. Hypoxic Training Methods for Improving Endurance Exercise Performance. J. Sport Health Sci. 2015, 4, 325–332. [Google Scholar] [CrossRef]
- Vellers, H.L.; Kleeberger, S.R.; Lightfoot, J.T. Inter-Individual Variation in Adaptations to Endurance and Resistance Exercise Training: Genetic Approaches towards Understanding a Complex Phenotype. Mamm. Genome 2018, 29, 48–62. [Google Scholar] [CrossRef] [PubMed]
- Martin, D.S.; Levett, D.Z.H.; Grocott, M.P.W.; Montgomery, H.E. Variation in Human Performance in the Hypoxic Mountain Environment. Exp. Physiol. 2010, 95, 463–470. [Google Scholar] [CrossRef] [PubMed]
- Prior, S.J.; Hagberg, J.M.; Phares, D.A.; Brown, M.D.; Fairfull, L.; Ferrell, R.E.; Roth, S.M. Sequence Variation in Hypoxia-Inducible Factor 1alpha (HIF1A): Association with Maximal Oxygen Consumption. Physiol. Genom. 2003, 15, 20–26. [Google Scholar] [CrossRef] [PubMed]
- Delves, P.J.; Martin, S.J.; Burton, D.R.; Roitt, I.M. Roitt’s Essential Immunology, 13th ed.; John Wiley & Sons Limited: Hoboken, NJ, USA; p. 218AD. ISBN 978-1-118-41606-8.
- Nieman, D.C.; Nehlsen-Cannarella, S.L. The Effects of Acute and Chronic Exercise of Immunoglobulins. Sports Med. Auckl. NZ 1991, 11, 183–201. [Google Scholar] [CrossRef] [PubMed]
- Nehlsen-Cannarella, S.L.; Nieman, D.C.; Jessen, J.; Chang, L.; Gusewitch, G.; Blix, G.G.; Ashley, E. The Effects of Acute Moderate Exercise on Lymphocyte Function and Serum Immunoglobulin Levels. Int. J. Sports Med. 1991, 12, 391–398. [Google Scholar] [CrossRef] [PubMed]
- Petibois, C.; Cazorla, G.; Déléris, G. The Biological and Metabolic Adaptations to 12 Months Training in Elite Rowers. Int. J. Sports Med. 2003, 24, 36–42. [Google Scholar] [CrossRef]
- Mackinnon, L.T.; Hooper, S. Mucosal (Secretory) Immune System Responses to Exercise of Varying Intensity and during Overtraining. Int. J. Sports Med. 1994, 15, S179–S183. [Google Scholar] [CrossRef] [PubMed]
- Mashiko, T.; Umeda, T.; Nakaji, S.; Sugawara, K. Effects of Exercise on the Physical Condition of College Rugby Players during Summer Training Camp. Br. J. Sports Med. 2004, 38, 186–190. [Google Scholar] [CrossRef]
- Nieman, D.; Tan, S.; Lee, J.; Berk, L. Complement and Immunoglobulin Levels in Athletes and Sedentary Controls. Int. J. Sports Med. 1989, 10, 124–128. [Google Scholar] [CrossRef]
- McKune, A.J.; Smith, L.L.; Semple, S.J.; Wadee, A.A. Influence of Ultra-Endurance Exercise on Immunoglobulin Isotypes and Subclasses. Br. J. Sports Med. 2005, 39, 665–670. [Google Scholar] [CrossRef] [PubMed]
- Mackinnon; Laurel, T. Advances in Exercise Immunology; Human Kinetics: Champaign, IL, USA, 1999. [Google Scholar]
- Kozlov, V.A.; Kudaeva, O.T. Immunity and Exercise Stress. Med. Immunol. 2002, 4, 427–438. [Google Scholar]
- Hoffman-Goetz, L.; Pedersen, B.K. Exercise and the Immune System: A Model of the Stress Response? Immunol. Today 1994, 15, 382–387. [Google Scholar] [CrossRef] [PubMed]
- Bousquet, J.; Chanez, P.; Mercier, J.; Prefaut, C. Monocytes, Exercise and the Inflammatory Response. Exerc. Immunol. Rev. 1996, 2, 35–44. [Google Scholar]
- Borges, G.F.; Rama, L.M.P.L.; Pedreiro, S.; Rosado, F.; Alves, F.; Santos, A.M.C.; Paiva, A.; Teixeira, A.M. Haematological Changes in Elite Kayakers during a Training Season. Appl. Physiol. Nutr. Metab. Physiol. Appliguee Nutr. Metab. 2012, 37, 1140–1146. [Google Scholar] [CrossRef]
- I San-Millán, I. Blood Biomarkers in Sports Medicine and Performance and the Future of Metabolomics. In Methods in Molecular Biology; Springer: Berlin/Heidelberg, Germany, 2019; pp. 431–446. [Google Scholar] [CrossRef]
- Eleftheriadis, T.; Liakopoulos, V.; Antoniadi, G.; Kartsios, C.; Stefanidis, I. The Role of Hepcidin in Iron Homeostasis and Anemia in Hemodialysis Patients. Semin. Dial. 2009, 22, 70–77. [Google Scholar] [CrossRef]
- Son, H.J.; Lee, Y.H.; Chae, J.H.; Kim, C.K. Creatine Kinase Isoenzyme Activity during and after an Ultra-Distance (200 Km) Run. Biol. Sport 2015, 32, 267–272. [Google Scholar] [CrossRef]
- Brancaccio, P.; Maffulli, N.; Limongelli, F.M. Creatine Kinase Monitoring in Sport Medicine. Br. Med. Bull. 2007, 81–82, 209–230. [Google Scholar] [CrossRef]
- Totsuka, M.; Nakaji, S.; Suzuki, K.; Sugawara, K.; Sato, K. Break Point of Serum Creatine Kinase Release after Endurance Exercise. J. Appl. Physiol. 2002, 93, 1280–1286. [Google Scholar] [CrossRef]
- Clarkson, P.M.; Kearns, A.K.; Rouzier, P.; Rubin, R.; Thompson, P.D. Serum Creatine Kinase Levels and Renal Function Measures in Exertional Muscle Damage. Med. Sci. Sports Exerc. 2006, 38, 623–627. [Google Scholar] [CrossRef]
- Ascensão, A.; Rebelo, A.; Oliveira, E.; Marques, F.; Pereira, L.; Magalhães, J. Biochemical Impact of a Soccer Match—Analysis of Oxidative Stress and Muscle Damage Markers throughout Recovery. Clin. Biochem. 2008, 41, 841–851. [Google Scholar] [CrossRef]
- Lovell, R.; Whalan, M.; Marshall, P.W.M.; Sampson, J.A.; Siegler, J.C.; Buchheit, M. Scheduling of Eccentric Lower Limb Injury Prevention Exercises during the Soccer Micro-cycle: Which Day of the Week? Scand. J. Med. Sci. Sports 2018, 28, 2216–2225. [Google Scholar] [CrossRef]
- Russell, M.; Northeast, J.; Atkinson, G.; Shearer, D.A.; Sparkes, W.; Cook, C.J.; Kilduff, L.P. Between-Match Variability of Peak Power Output and Creatine Kinase Responses to Soccer Match-Play. J. Strength Cond. Res. 2015, 29, 2079–2085. [Google Scholar] [CrossRef]
- Silva, J.R.; Rumpf, M.C.; Hertzog, M.; Castagna, C.; Farooq, A.; Girard, O.; Hader, K. Acute and Residual Soccer Match-Related Fatigue: A Systematic Review and Meta-Analysis. Sports Med. 2018, 48, 539–583. [Google Scholar] [CrossRef]
- Bonilla, D.A.; Pérez-Idárraga, A.; Odriozola-Martínez, A.; Kreider, R.B. The 4R’s Framework of Nutritional Strategies for Post-Exercise Recovery: A Review with Emphasis on New Generation of Carbohydrates. Int. J. Environ. Res. Public. Health 2020, 18, 103. [Google Scholar] [CrossRef]
- Lazarim, F.L.; Antunes-Neto, J.M.F.; da Silva, F.O.C.; Nunes, L.A.S.; Bassini-Cameron, A.; Cameron, L.-C.; Alves, A.A.; Brenzikofer, R.; de Macedo, D.V. The Upper Values of Plasma Creatine Kinase of Professional Soccer Players during the Brazilian National Championship. J. Sci. Med. Sport 2009, 12, 85–90. [Google Scholar] [CrossRef] [PubMed]
- Ceciliani, F.; Giordano, A.; Spagnolo, V. The Systemic Reaction during Inflammation: The Acute-Phase Proteins. Protein Pept. Lett. 2002, 9, 211–223. [Google Scholar] [CrossRef]
- Moshage, H. Cytokines and the Hepatic Acute Phase Response. J. Pathol. 1997, 181, 257–266. [Google Scholar] [CrossRef]
- Ogawa, K.; Sanada, K.; Machida, S.; Okutsu, M.; Suzuki, K. Resistance Exercise Training-Induced Muscle Hypertrophy Was Associated with Reduction of Inflammatory Markers in Elderly Women. Mediators Inflamm. 2010, 2010, 1–7. [Google Scholar] [CrossRef] [PubMed]
- Yerbury, J.J.; Rybchyn, M.S.; Easterbrook-Smith, S.B.; Henriques, C.; Wilson, M.R. The Acute Phase Protein Haptoglobin Is a Mammalian Extracellular Chaperone with an Action Similar to Clusterin. Biochemistry 2005, 44, 10914–10925. [Google Scholar] [CrossRef]
- Bernard, D.; Christophe, A.; Delanghe, J.; Langlois, M.; De Buyzere, M.; Comhaire, F. The Effect of Supplementation with an Antioxidant Preparation on LDL-Oxidation Is Determined by Haptoglobin Polymorphism. Redox Rep. Commun. Free Radic. Res. 2003, 8, 41–46. [Google Scholar] [CrossRef] [PubMed]
- Spitler, D.L.; Alexander, W.C.; Hoffler, G.W.; Doerr, D.F.; Buchanan, P. Haptoglobin and Serum Enzymatic Response to Maximal Exercise in Relation to Physical Fitness. Med. Sci. Sports Exerc. 1984, 16, 366–370. [Google Scholar] [CrossRef] [PubMed]
- Chen, C.-Y.; Hsieh, W.-L.; Lin, P.-J.; Chen, Y.-L.; Mao, S.J.T. Haptoglobin Is an Exercise-Responsive Acute-Phase Protein. In Acute Phase Proteins—Regulation and Functions of Acute Phase Proteins; Veas, F., Ed.; InTech: Talatona, Angola, 2011; ISBN 978-953-307-252-4. [Google Scholar]
- Nagashima, K.; Cline, G.W.; Mack, G.W.; Shulman, G.I.; Nadel, E.R. Intense Exercise Stimulates Albumin Synthesis in the Upright Posture. J. Appl. Physiol. Bethesda Md 1985 2000, 88, 41–46. [Google Scholar] [CrossRef] [PubMed]
- Lee, E.C.; Fragala, M.S.; Kavouras, S.A.; Queen, R.M.; Pryor, J.L.; Casa, D.J. Biomarkers in Sports and Exercise: Tracking Health, Performance, and Recovery in Athletes. J. Strength Cond. Res. 2017, 31, 2920–2937. [Google Scholar] [CrossRef]
- Santos, R.; Tufik, S.; De Mello, M. Exercise, Sleep and Cytokines: Is There a Relation? Sleep Med. Rev. 2007, 11, 231–239. [Google Scholar] [CrossRef]
- Kraus, R.M.; Stallings, H.W.; Yeager, R.C.; Gavin, T.P. Circulating Plasma VEGF Response to Exercise in Sedentary and Endurance-Trained Men. J. Appl. Physiol. 2004, 96, 1445–1450. [Google Scholar] [CrossRef]
- Donaldson, S.K.B.; Hermansen, L.; Bolles, L. Differential, Direct Effects of H+ on Ca2+ -Activated Force of Skinned Fibers from the Soleus, Cardiac and Adductor Magnus Muscles of Rabbits. Pflugers Arch. 1978, 376, 55–65. [Google Scholar] [CrossRef]
- Sahlin, K. Intracellular pH and Energy Metabolism in Skeletal Muscle of Man. With Special Reference to Exercise. Acta Paediatr. Scand. Suppl. 1978, 455, 1–56. [Google Scholar]
- Bredle, D.L.; Stager, J.M.; Brechue, W.F.; Farber, M.O. Phosphate Supplementation, Cardiovascular Function, and Exercise Performance in Humans. J. Appl. Physiol. 1988, 65, 1821–1826. [Google Scholar] [CrossRef]
- Dale, G.; Fleetwood, J.A.; Weddell, A.; Ellis, R.D.; Sainsbury, J.R. Fitness, Unfitness, and Phosphate. BMJ 1987, 294, 939. [Google Scholar] [CrossRef]
- Nebl, J.; Drabert, K.; Haufe, S.; Wasserfurth, P.; Eigendorf, J.; Tegtbur, U.; Hahn, A.; Tsikas, D. Exercise-Induced Oxidative Stress, Nitric Oxide and Plasma Amino Acid Profile in Recreational Runners with Vegetarian and Non-Vegetarian Dietary Patterns. Nutrients 2019, 11, 1875. [Google Scholar] [CrossRef]
- San-Millán, I.; Stefanoni, D.; Martinez, J.L.; Hansen, K.C.; D’Alessandro, A.; Nemkov, T. Metabolomics of Endurance Capacity in World Tour Professional Cyclists. Front. Physiol. 2020, 11, 578. [Google Scholar] [CrossRef]
- Wagenmakers, A.J. Muscle Amino Acid Metabolism at Rest and during Exercise: Role in Human Physiology and Metabolism. Exerc. Sport Sci. Rev. 1998, 26, 287–314. [Google Scholar] [CrossRef]
- Shakhmatov, I.I.; Alekseeva, O.V.; Kiselev, V.I. The Effect of Training on Reactions of the Hemostatic System under Hypoxic Conditions. Bull. Sib. Med. 2010, 9, 58–63. (In Russian) [Google Scholar] [CrossRef]
- Kutafina, N.V.; Medvedev, I.N. The influence of physical activity on the hemostatic system. Bull. Surgut State Pedagog. Univ. 2014, 3, 87–91. (In Russian) [Google Scholar]
- Bakhareva, A.S.; Isaev, A.P.; Savinykh, E.Y.; Baimukhametov, E.F. Physiological adaptation to huge endurance training loads in athletes. Hum. Sport Med. 2016, 1, 29–33. [Google Scholar] [CrossRef][Green Version]
- Collen, D.; Semeraro, N.; Tricot, J.P.; Vermylen, J. Turnover of Fibrinogen, Plasminogen, and Prothrombin during Exercise in Man. J. Appl. Physiol. 1977, 42, 865–873. [Google Scholar] [CrossRef]
- Kutafina, N.V.; Zavalishina, S.Y. The Mechanisms of Functioning of Vascular–Platelet Hemostasis. RUDN J. Ecol. Life Saf. 2012, 1, 30–37. (In Russian) [Google Scholar]
- Smith, J.E. Effects of Strenuous Exercise on Haemostasis. Br. J. Sports Med. 2003, 37, 433–435. [Google Scholar] [CrossRef]
- Schommer, K.; Menold, E.; Subudhi, A.W.; Bärtsch, P. Health Risk for Athletes at Moderate Altitude and Normobaric Hypoxia. Br. J. Sports Med. 2012, 46, 828–832. [Google Scholar] [CrossRef] [PubMed]
- Knowles, R.; Keeping, H.; Graeber, T.; Nguyen, K.; Garner, C.; D’Amico, R.; Simms, H.H. Cytokine Control of PMN Phagocytosis: Regulatory Effects of Hypoxemia and Hypoxemia-Reoxygenation. Am. J. Physiol. 1997, 272, C1352–C1364. [Google Scholar] [CrossRef] [PubMed]
- Ameln, H.; Gustafsson, T.; Sundberg, C.J.; Okamoto, K.; Jansson, E.; Poellinger, L.; Makino, Y. Physiological Activation of Hypoxia Inducible Factor-1 in Human Skeletal Muscle. FASEB J. Off. Publ. Fed. Am. Soc. Exp. Biol. 2005, 19, 1009–1011. [Google Scholar] [CrossRef] [PubMed]
- Flockhart, M.; Nilsson, L.C.; Tais, S.; Ekblom, B.; Apró, W.; Larsen, F.J. Excessive Exercise Training Causes Mitochondrial Functional Impairment and Decreases Glucose Tolerance in Healthy Volunteers. Cell Metab. 2021, 33, 957–970.e6. [Google Scholar] [CrossRef] [PubMed]
- Van Gool, A.; Corrales, F.; Čolović, M.; Krstić, D.; Oliver-Martos, B.; Martínez-Cáceres, E.; Jakasa, I.; Gajski, G.; Brun, V.; Kyriacou, K.; et al. Analytical Techniques for Multiplex Analysis of Protein Biomarkers. Expert Rev. Proteom. 2020, 17, 257–273. [Google Scholar] [CrossRef]
- Heaney, L.M.; Deighton, K.; Suzuki, T. Non-Targeted Metabolomics in Sport and Exercise Science. J. Sports Sci. 2019, 37, 959–967. [Google Scholar] [CrossRef]
- Saunders, P.U.; Garvican-Lewis, L.A.; Schmidt, W.F.; Gore, C.J. Relationship between Changes in Haemoglobin Mass and Maximal Oxygen Uptake after Hypoxic Exposure. Br. J. Sports Med. 2013, 47, i26–i30. [Google Scholar] [CrossRef]
- Furrer, R.; Hawley, J.A.; Handschin, C. The Molecular Athlete: Exercise Physiology from Mechanisms to Medals. Physiol. Rev. 2023, 103, 1693–1787. [Google Scholar] [CrossRef] [PubMed]


| Stages | Stage Objectives [28] | Methods |
|---|---|---|
| Primary stage | Elucidating whether mastering in a particular sport is reasonable. | Genomic methods (analysis of the markers of sports aptitude and developing occupational diseases). |
| Preliminary stage | Finding out whether a person has the potential to efficiently master a sport. Choosing a sports specialization. | Genomic (determining the potential of developing physical qualities, identifying the strengths and weaknesses of one’s body) and epigenomic methods. |
| Intermediate stage | Finding out whether a person has the potential of showing high sports performance and enduring strenuous training and competition load. | Pharmacogenomic, nutrigenomic, metagenomic, and standard biochemical methods; analysis of circulating DNA. |
| Main stage | Finding out whether a person has the potential to achieve international-level results. Elaborating the strategy and approaches to training and competitive activity. | Transcriptomic, proteomic, metabolomic, and standard biochemical methods. |
| Final stage | Finding out whether a person can maintain and improve the results achieved. Elucidating on whether it is reasonable to continue the athletic career. | Measuring telomere length and telomerase activity; transcriptomic, proteomic, metabolomic, and standard biochemical methods. |
| Sample No. # | Age (years) | Weight (kg) | Height (cm) | BMI (kg/m2) |
|---|---|---|---|---|
| 1 | 37 | 81 | 176 | 26.1 |
| 2 | 31 | 74 | 172 | 25 |
| 3 | 24 | 69 | 175 | 22.5 |
| 4 | 30 | 87 | 175 | 28.4 |
| 5 | 28 | 76 | 179 | 23.8 |
| 6 | 24 | 80 | 178 | 25.2 |
| 7 | 30 | 74 | 177 | 23.6 |
| 8 | 31 | 73 | 172 | 24.7 |
| 9 | 33 | 91 | 187 | 26 |
| 10 | 37 | 86 | 186 | 24.9 |
| 11 | 30 | 99 | 193 | 26.6 |
| 12 | 33 | 95 | 182 | 28.7 |
| 13 | 31 | 81 | 176 | 26.1 |
| 14 | 29 | 87 | 187 | 24.9 |
| 15 | 40 | 74 | 172 | 25 |
| 16 | 35 | 81 | 176 | 26.1 |
| 17 | 25 | 89 | 190 | 24.7 |
| 18 | 24 | 61 | 174 | 20.1 |
| Indicators | Units | Mean (SD) |
|---|---|---|
| VO2 max | mL/min/kg | 51 [47.5–54.4] |
| RR | amp | 54.9 [48.4–61.4] |
| Resting heart rate | bpm | 190 [185–195] |
| RER | relative units | 1.11 [1.09–1.14] |
| Aerobic threshold | ||
| VO2 | mL/min | 29.5 [26.6–32.5] |
| VE | L/min | 60.3 [51.5–69.1] |
| Heart rate | bpm | 129.2 [119–138] |
| Aanaerobic threshold | ||
| VO2 | mL/min | 48.1 [45.2–50.9] |
| VE | L/min | 125.6 [117.4–133.8] |
| Heart rate | bpm | 179 [174–184] |
| Parameter | Reference Values | Unit of Measure |
|---|---|---|
| Total protein | 66–87 | g/L |
| Albumin | 39.7–49.4 | g/L |
| Creatinine | 62–106 | μmol/L |
| Urea | 2.76–8.07 | mmol/L |
| Uric acid | 202–416 | mmol/L |
| Triglycerides | 0.4–1.7 | mmol/L |
| Total cholesterol | 3.9–5.2 | mmol/L |
| High-density lipoprotein cholesterol | 0.9–1.45 | mmol/L |
| Low-density lipoprotein cholesterol | 0.26–2.6 | mmol/L |
| Total bilirubin | 5–21 | μmol/L |
| Direct bilirubin | 0–5.1 | μmol/L |
| Alanine aminotransferase (ALT) | 5–41 | U/L |
| Aspartate aminotransferase (AST) | 5–40 | U/L |
| Creatine kinase (CK) | 7–190 | U/L |
| Creatine kinase—MB (CK-MB) | 3–25 | U/L |
| Lactate dehydrogenase (LDH) | 135–225 | U/L |
| Gamma GT (GGT) | 10–60 | U/L |
| Alkaline phosphatase (ALP) | 35–130 | U/L |
| Lactate | 0.5–2.2 | mmol/L |
| Amylase | 28–100 | U/L |
| Total calcium | 2.1–2.6 | mmol/L |
| Phosphorus | 0.81–1.45 | mmol/L |
| Magnesium | 0.66–1.07 | mmol/L |
| Iron | 5.83–34.5 | μmol/L |
| Acid phosphatase | 0.5–6.6 | U/L |
| Somatotropic hormone (STH) | 0.03–2.47 | ng/mL |
| Total testosterone | 8.64–29 | nmol/L |
| Cortisol | 171–536 | nmol/L |
| Thyrotropic hormone (TSH) | 0.27–4.2 | μME/mL |
| Free thyroxine (free T4) | 12–22 | pmol/L |
| Myoglobin | 23–72 | µg/L |
| UniProt ID | Protein Name | Sampling Time 2 | Sampling Time 3 | Sampling Time 4 | Sampling Time 5 | Biological Process | ||||
|---|---|---|---|---|---|---|---|---|---|---|
| FC | Log FC | FC | Log FC | FC | Log FC | FC | Log FC | |||
| B9A064 | Ig lambda-like polypeptide 5 | 0.91 | −0.12 | 0.92 | −0.11 | 0.28 | −1.78 | 0.47 | −1.06 | Adaptive immunity |
| P00734 | Prothrombin | 0.75 | −0.41 | 0.47 | −1.08 | 0.47 | −1.08 | 0.47 | −1.08 | Homeostasis |
| P00738 | Haptoglobin | 0.77 | −0.36 | 0.64 | −0.62 | 0.14 | −2.83 | 0.24 | −2.05 | An acute inflammatory response |
| P01700 | Ig lambda variable 1–47 | 1.22 | 0.29 | 0.87 | −0.19 | 0.54 | −0.88 | 0.54 | −0.88 | Adaptive immunity |
| P01780 | Ig heavy variable 3–7 | 0.74 | −0.42 | 1.01 | 0.02 | 0.22 | −2.13 | 0.18 | −2.45 | Adaptive immunity |
| P01825 | Ig heavy variable 4–59 | 0.69 | −0.52 | 0.60 | −0.71 | 0.46 | −1.10 | 0.46 | −1.10 | Adaptive immunity |
| P01859 | Ig heavy constant gamma 2 | 0.90 | −0.14 | 1.01 | 0.02 | 0.35 | −1.48 | 0.57 | −0.78 | Adaptive immunity |
| P01860 | Ig heavy constant gamma 3 | 0.93 | −0.10 | 0.67 | −0.56 | 0.35 | −1.48 | 0.43 | −1.20 | Adaptive immunity |
| P01861 | Ig heavy constant gamma 4 | 1.01 | 0.02 | 0.93 | −0.09 | 0.33 | −1.56 | 0.42 | −1.24 | Adaptive immunity |
| P01876 | Ig heavy constant alpha 1 | 0.83 | −0.26 | 0.74 | −0.43 | 0.55 | −0.84 | 0.46 | −1.10 | Adaptive immunity |
| P01877 | Ig heavy constant alpha 2 | 0.85 | −0.22 | 1.03 | 0.05 | 0.41 | −1.25 | 0.66 | −0.58 | Adaptive immunity |
| P02763 | Alpha-1-acid glycoprotein 1 | 1.37 | 0.46 | 0.54 | −0.86 | 0.60 | −0.72 | 0.99 | −0.00 | An acute inflammatory response |
| P04433 | Ig kappa variable 3–11 | 0.96 | −0.45 | 0.80 | −0.31 | 0.43 | −1.20 | 0.51 | −0.95 | Adaptive immunity |
| P0DOY3 | Ig lambda constant 3 | 0.91 | −0.12 | 0.92 | −0.11 | 0.50 | −0.97 | 0.47 | −1.06 | Adaptive immunity |
| P35542 | Serum amyloid A-4 protein | 0.62 | −0.67 | 0.43 | −1.19 | 0.43 | −1.19 | 0.43 | −0.19 | An acute inflammatory response |
| P68871 | Hemoglobin subunit beta | 0.90 | −0.14 | 2.5 | 1.32 | 0.81 | −0.29 | 0.84 | −0.24 | Oxygen transport |
| Company | Parameters | Identification Method | Biomaterial Type | Website |
|---|---|---|---|---|
| INVITRO (Moscow, Russia) | Plasma amino acids (48 parameters) | HPLC, MS/MS | Plasma (EDTA) | https://www.invitro.ru/en/about/ (accessed on 20 February 2024) |
| Chromsystems (Gräfelfing/ Munich, Germany) | Organic acids (60 parameters); amino acids (48 parameters); vitamins B3, B6, B9, B12, D; hormones and metabolites (18 parameters); acylcarnitines (15 parameters); vitamins A, E, C; coenzyme Q10 | HPLC-MS, LFIA, GC-MS, HPLC-FC, RPC | Blood (EDTA) Urine Plasma (EDTA) Serum | https://chromsystems.com/ (accessed on 20 February 2024) |
| Helix (Moscow, Russia) | Magnesium, transferrin, calcium, potassium, sodium, chlorine, zinc, vitamin B6, vitamin D, vitamin E. Cortisol, testosterone, LH, progesterone, T3, T4, TSH, FSH, estradiol, prolactin | Colorimetric analysis, immunoturbidimetry, ion-selective electrodes, HPLC, ECLIA, HPLC-MS | Venous blood | https://helix.ru/ (accessed on 20 February 2024) |
| AxisPharm (San Diego, CA, USA) | Amino acids, carbohydrates, alcohols, organic acids, amines, Krebs cycle intermediates, lipid macromolecules | GC-MS, LC-MS, NMR | Biofluids, tissues, cell cultures | https://axispharm.com/ (accessed on 20 February 2024) |
| MS-Omics (Vedbæk, Denmark) | Short-chain fatty acids, volatile polar and semi-polar metabolites, amino acids and organic acids, bile acids, lipids | GC-MS/MS, GC-MS | – | https://www.msomics.com/ (accessed on 20 February 2024) |
| EMBL (Hamburg, Germany) | Non-targeted metabolomics, targeted metabolomics, lipidomics, analysis of drugs and their metabolites | LC-MS/MS, HRMS in the mode of positive and/or negative ionization coupled with UHPLC in the HILIC mode, HRMS coupled with UHPLC in the RPC mode. | Cell cultures, tissues, plasma, serum, urine | https://www.embl.org/ (accessed on 20 February 2024) |
Disclaimer/Publisher’s Note: The statements, opinions and data contained in all publications are solely those of the individual author(s) and contributor(s) and not of MDPI and/or the editor(s). MDPI and/or the editor(s) disclaim responsibility for any injury to people or property resulting from any ideas, methods, instructions or products referred to in the content. |
© 2024 by the authors. Licensee MDPI, Basel, Switzerland. This article is an open access article distributed under the terms and conditions of the Creative Commons Attribution (CC BY) license (https://creativecommons.org/licenses/by/4.0/).
Share and Cite
Malsagova, K.A.; Kopylov, A.T.; Stepanov, A.A.; Kulikova, L.I.; Izotov, A.A.; Yurku, K.A.; Balakin, E.I.; Pustovoyt, V.I.; Kaysheva, A.L. Metabolomic and Proteomic Profiling of Athletes Performing Physical Activity under Hypoxic Conditions. Sports 2024, 12, 72. https://doi.org/10.3390/sports12030072
Malsagova KA, Kopylov AT, Stepanov AA, Kulikova LI, Izotov AA, Yurku KA, Balakin EI, Pustovoyt VI, Kaysheva AL. Metabolomic and Proteomic Profiling of Athletes Performing Physical Activity under Hypoxic Conditions. Sports. 2024; 12(3):72. https://doi.org/10.3390/sports12030072
Chicago/Turabian StyleMalsagova, Kristina A., Arthur T. Kopylov, Alexander A. Stepanov, Liudmila I. Kulikova, Alexander A. Izotov, Ksenia A. Yurku, Evgenii I. Balakin, Vasiliy I. Pustovoyt, and Anna L. Kaysheva. 2024. "Metabolomic and Proteomic Profiling of Athletes Performing Physical Activity under Hypoxic Conditions" Sports 12, no. 3: 72. https://doi.org/10.3390/sports12030072
APA StyleMalsagova, K. A., Kopylov, A. T., Stepanov, A. A., Kulikova, L. I., Izotov, A. A., Yurku, K. A., Balakin, E. I., Pustovoyt, V. I., & Kaysheva, A. L. (2024). Metabolomic and Proteomic Profiling of Athletes Performing Physical Activity under Hypoxic Conditions. Sports, 12(3), 72. https://doi.org/10.3390/sports12030072