Indicators of Fatigue during a Soccer Match Simulation Using GPS-Derived Workload Values: Which Metrics Are Most Useful?
Abstract
:1. Introduction
2. Materials and Methods
2.1. Participants
2.2. Study Design
2.3. Methodology
2.4. Workload Parameters
2.5. Countermovement Jump Testing
2.6. Statistical Analysis
3. Results
3.1. Workload Parameters
3.2. Countermovement Jump Parameters
4. Discussion
5. Practical Applications
Author Contributions
Funding
Institutional Review Board Statement
Informed Consent Statement
Data Availability Statement
Acknowledgments
Conflicts of Interest
References
- Harkness-Armstrong, A.; Till, K.; Datson, N.; Myhill, N.; Emmonds, S. A systematic review of match-play characteristics in women’s soccer. PLoS ONE 2022, 17, e0268334. [Google Scholar] [CrossRef] [PubMed]
- Bohner, J.D.; Hoffman, J.R.; McCormack, W.P.; Scanlon, T.C.; Townsend, J.R.; Stout, J.R.; Fragala, M.S.; Fukuda, D.H. Moderate Altitude Affects High Intensity Running Performance in a Collegiate Women’s Soccer Game. J. Hum. Kinet. 2015, 47, 147–154. [Google Scholar] [CrossRef] [PubMed]
- Bozzini, B.N.; McFadden, B.A.; Walker, A.J.; Arent, S.M. Varying demands and quality of play between in-conference and out-of-conference games in Division I collegiate women’s soccer. J. Strength Cond. Res. 2020, 34, 3364–3368. [Google Scholar] [CrossRef] [PubMed]
- Vescovi, J.D.; Favero, T.G. Motion characteristics of women’s college soccer matches: Female Athletes in Motion (FAiM) study. Int. J. Sports Physiol. Perf. 2014, 9, 405–414. [Google Scholar] [CrossRef] [PubMed]
- Wells, A.J.; Hoffman, J.R.; Beyer, K.S.; Hoffman, M.W.; Jajtner, A.R.; Fukuda, D.H.; Stout, J.R. Regular- and postseason comparisons of playing time and measures of running performance in NCAA Division I women soccer players. Appl. Physiol. Nutr. Metab. 2015, 40, 907–917. [Google Scholar] [CrossRef] [PubMed]
- Andersson, H.; Raastad, T.; Nilsson, J.; Paulsen, G.; Garthe, I.; Kadi, F. Neuromuscular Fatigue and Recovery in Elite Female Soccer: Effects of Active Recovery. Med. Sci. Sports Exerc. 2008, 40, 372–380. [Google Scholar] [CrossRef] [PubMed]
- Bradley, P.S.; Noakes, T.D. Match running performance fluctuations in elite soccer: Indicative of fatigue, pacing or situational influences? J. Sports Sci. 2013, 31, 1627–1638. [Google Scholar] [CrossRef]
- Mara, J.K.; Thompson, K.G.; Pumpa, K.L.; Morgan, S. Quantifying the High-Speed Running and Sprinting Profiles of Elite Female Soccer Players During Competitive Matches Using an Optical Player Tracking System. J. Strength Cond. Res. 2017, 31, 1500–1508. [Google Scholar] [CrossRef]
- Panduro, J.; Ermidis, G.; Røddik, L.L.; Vigh-larsen, J.F.; Madsen, E.E.; Larsen, M.N.; Pettersen, S.A.; Krustrup, P.; Randers, M.B. Physical performance and loading for six playing positions in elite female football: Full-game, end-game, and peak periods. Scand. Med. Sci. Sports 2022, 32, 115–126. [Google Scholar] [CrossRef]
- Mara, J.K.; Thompson, K.G.; Pumpa, K.L.; Morgan, S. The acceleration and deceleration profiles of elite female soccer players during competitive matches. J. Sci. Med. Sport 2017, 20, 867–872. [Google Scholar] [CrossRef]
- Abt, G.; Lovell, R. The use of individualized speed and intensity thresholds for determining the distance run at high-intensity in professional soccer. J. Sports Sci. 2009, 27, 893–898. [Google Scholar] [CrossRef] [PubMed]
- Datson, N.; Drust, B.; Weston, M.; Jarman, I.; Lisboa, P.; Gregson, W. Match physical performance of elite female soccer players during international competition. J. Strength Cond. Res. 2017, 31, 2379–2387. [Google Scholar] [CrossRef] [PubMed]
- Edwards, A.M.; Noakes, T.D. Dehydration: Cause of Fatigue or Sign of Pacing in Elite Soccer? Sports Med. 2009, 39, 1–13. [Google Scholar] [CrossRef] [PubMed]
- da Silva, C.D.; Lovell, R. External Validity of the T-SAFT90: A Soccer Simulation Including Technical and Jumping Activities. Int. J. Sports Physiol. 2020, 15, 1074–1080. [Google Scholar] [CrossRef]
- Mujika, I.; Santisteban, J.; Impellizzeri, F.M.; Castagna, C. Fitness determinants of success in men’s and women’s football. J. Sports Sci. 2009, 27, 107–114. [Google Scholar] [CrossRef] [PubMed]
- Badby, A.J.; Mundy, P.D.; Comfort, P.; Lake, J.P.; McMahon, J.J. The Validity of Hawkin Dynamics Wireless Dual Force Plates for Measuring Countermovement Jump and Drop Jump Variables. Sensors 2023, 23, 4820. [Google Scholar] [CrossRef]
- Kyprianou, E.; Di Salvo, V.; Lolli, L.; Al Haddad, H.; Villanueva, A.M.; Gregson, W.; Weston, M. To Measure Peak Velocity in Soccer, Let the Players Sprint. J. Strength Cond. Res. 2022, 36, 273–276. [Google Scholar] [CrossRef]
- Cohen, J. Statistical Power Analysis for the Behavioral Sciences; Psychology Press: New York, NY, USA, 2009. [Google Scholar]
- Griffin, J.; Newans, T.; Horan, S.; Keogh, J.; Andreatta, M.; Minahan, C. Acceleration and High-Speed Running Profiles of Women’s International and Domestic Football Matches. Front. Sports Act. Living 2021, 3, 604605. [Google Scholar] [CrossRef]
- Cone, J.R.; Berry, N.T.; Goldfarb, A.H.; Henson, R.A.; Schmitz, R.J.; Wideman, L.; Shultz, S.J. Effects of an Individualized Soccer Match Simulation on Vertical Stiffness and Impedance. J. Strength Cond. Res. 2012, 26, 2027–2036. [Google Scholar] [CrossRef]
- Sausaman, R.W.; Sams, M.L.; Mizuguchi, S.; DeWeese, B.H.; Stone, M.H. The Physical Demands of NCAA Division I Women’s College Soccer. J. Funct. Morphol. Kinesiol. 2019, 4, 73. [Google Scholar] [CrossRef]
- Ramos, G.; Nakamura, F.Y.; Pereira, L.A.; Junior, W.; Mahseredjian, F.; Wilke, C.F.; Garcia, E.; Coimbra, C. Movement Patterns of a U-20 National Women’s Soccer Team during Competitive Matches: Influence of Playing Position and Performance in the First Half. Int. J. Sports Med. 2017, 38, 747–754. [Google Scholar] [CrossRef] [PubMed]
- Romero-Moraleda, B.; Nedergaard, N.J.; Morencos, E.; Casamichana, D.; Ramirez-Campillo, R.; Vanrenterghem, J. External and internal loads during the competitive season in professional female soccer players according to their playing position: Differences between training and competition. Res. Sports Med. 2021, 29, 449–461. [Google Scholar] [CrossRef] [PubMed]
- Trewin, J.; Meylan, C.; Varley, M.C.; Cronin, J. The match-to-match variation of match-running in elite female soccer. J. Sci. Med. Sport 2018, 21, 196–201. [Google Scholar] [CrossRef] [PubMed]
- Trewin, J.; Meylan, C.; Varley, M.C.; Cronin, J.; Ling, D. The Effect of Match-Factors on the Running Performance of Elite Female Soccer Players. J. Strength Cond. Res. 2018, 32, 2002–2009. [Google Scholar] [CrossRef] [PubMed]
- Huthöfer, M.; Harbour, E.; Schwameder, H.; Kröll, J. Sprint mechanical properties of professional soccer players during a match simulation. In Proceedings of the International Society of Biomechanics in Sport Conference, Online, 20–24 July 2020. [Google Scholar]
- Page, R.M.; Marrin, K.; Brogden, C.M.; Greig, M. Biomechanical and Physiological Response to a Contemporary Soccer Match-Play Simulation. J. Strength Cond. Res. 2015, 29, 2860–2866. [Google Scholar] [CrossRef]
- Tanaka, H.; Monahan, K.D.; Seals, D.R. Age-predicted maximal heart rate revisited. J. Am. Coll. Cardiol. 2001, 37, 153–156. [Google Scholar] [CrossRef]


| Value (Unit) | Definition |
|---|---|
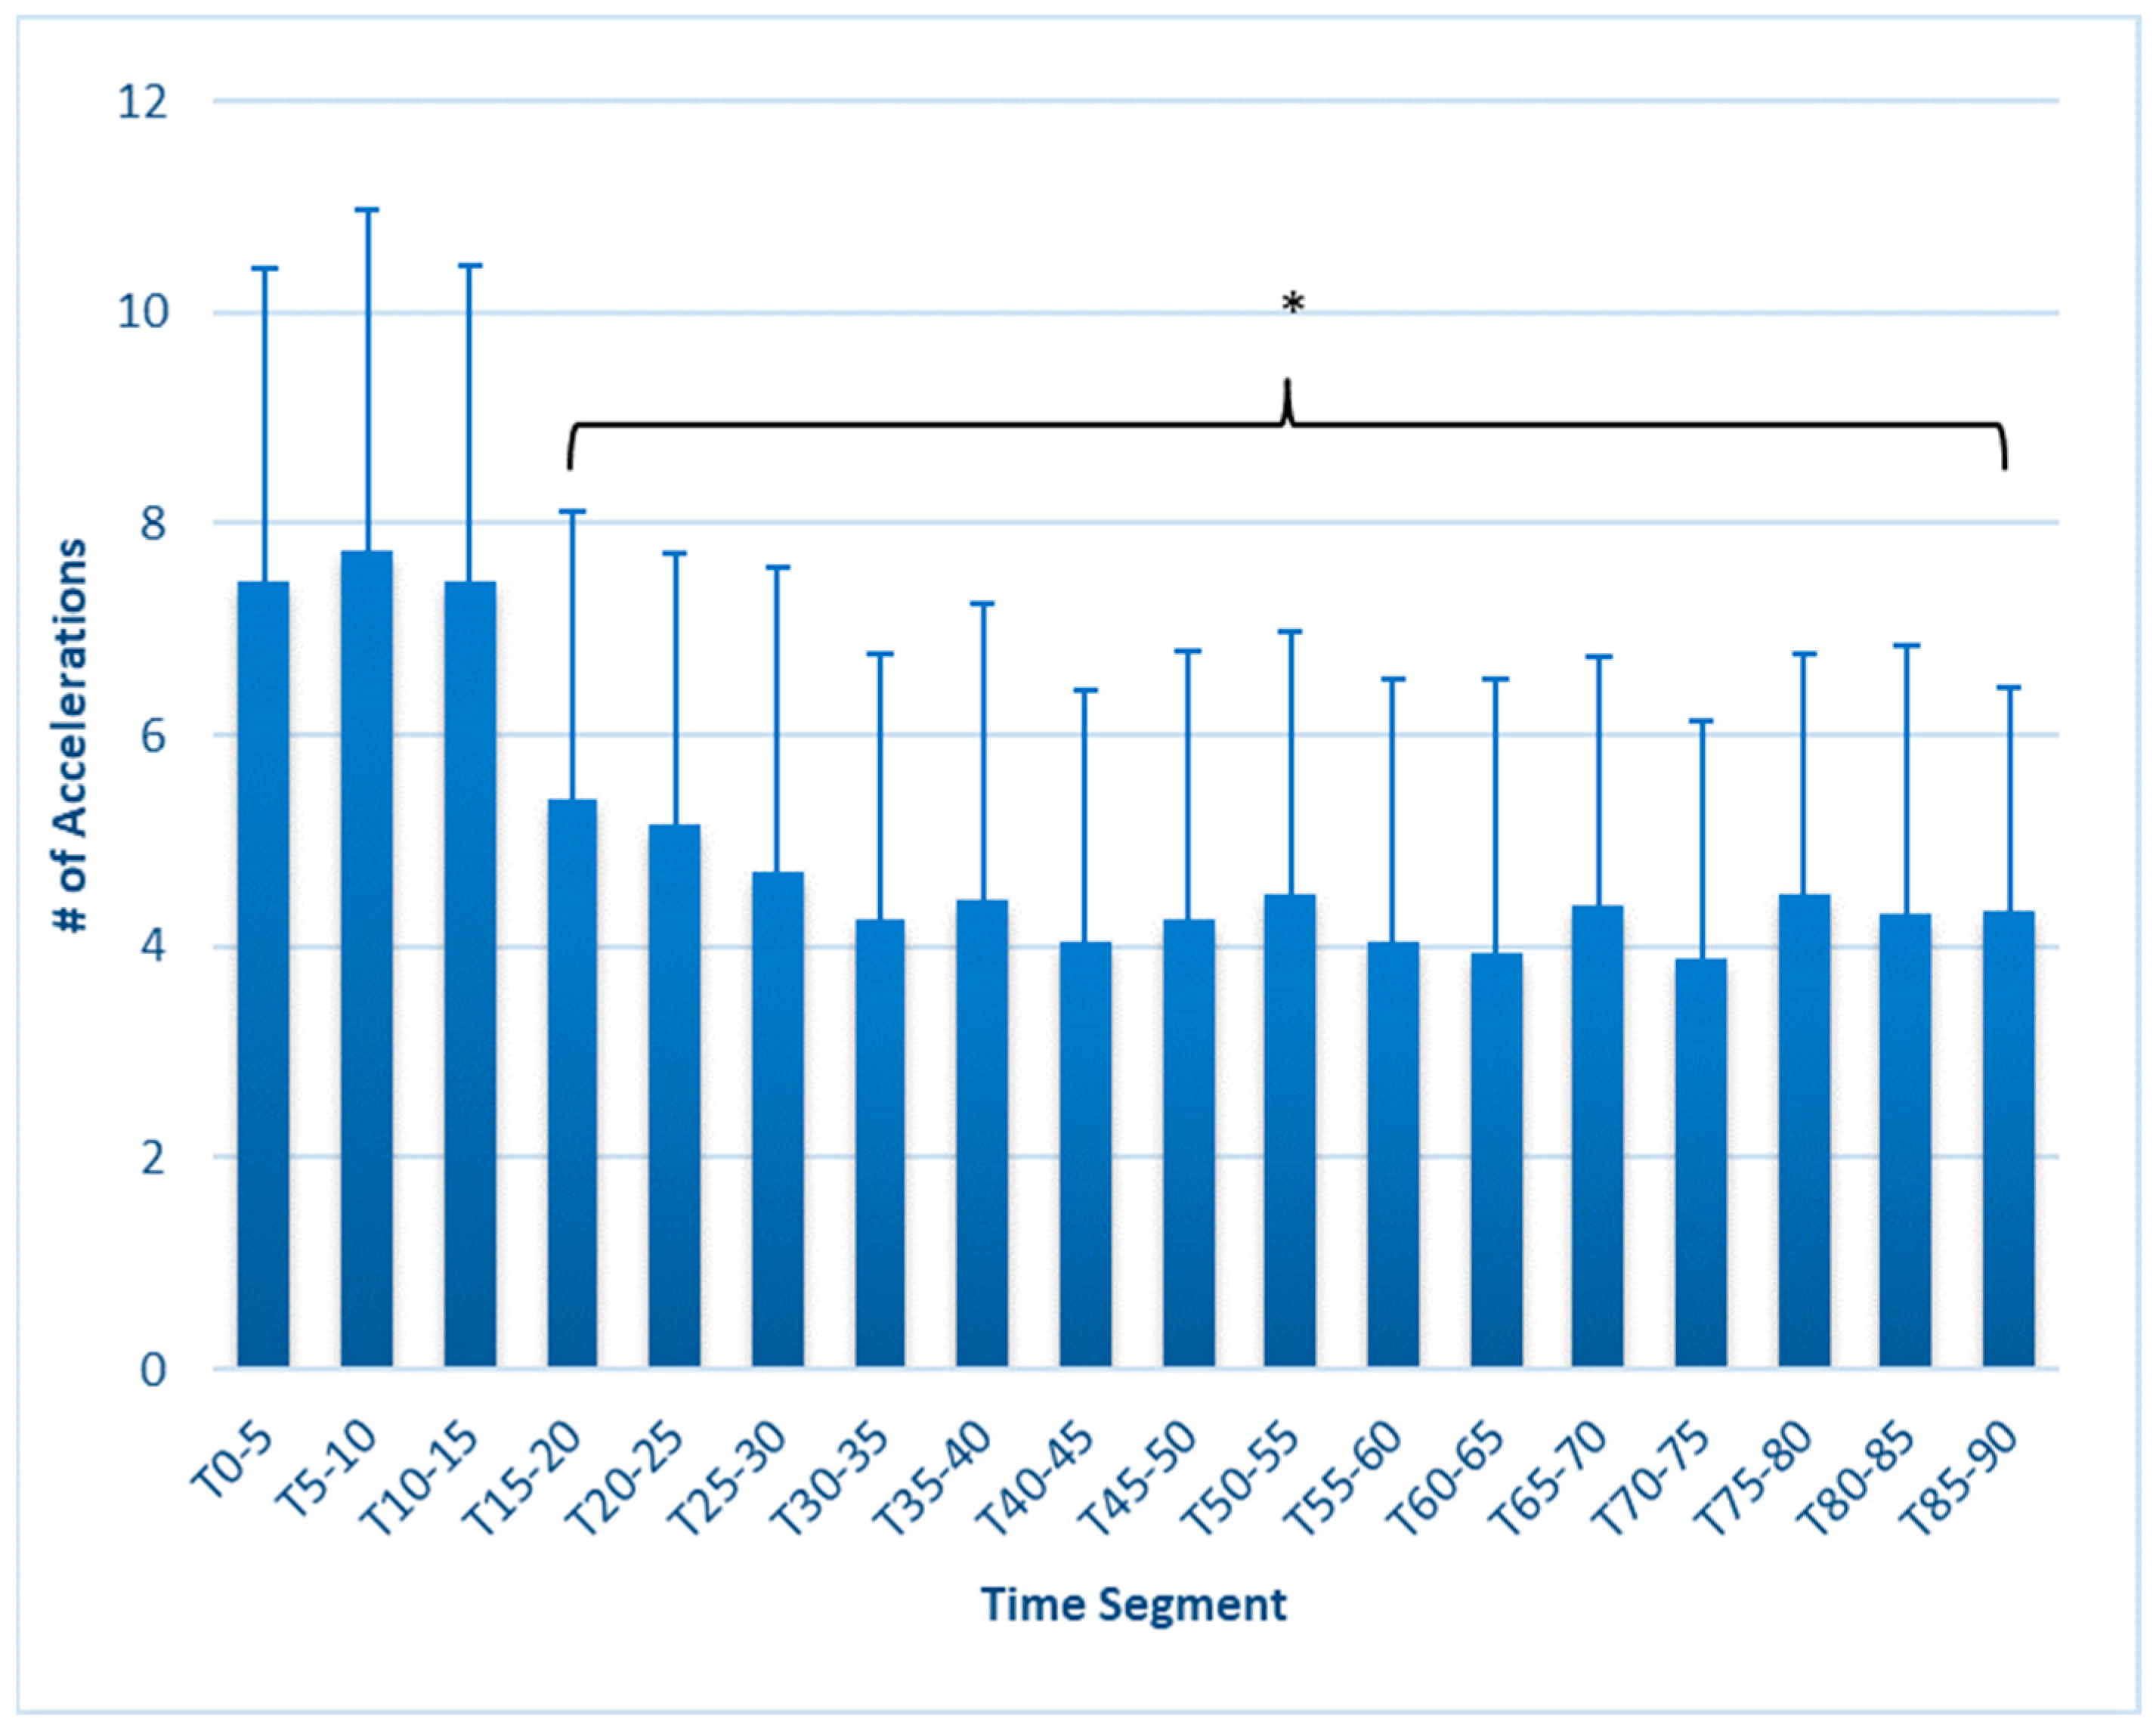
| Accelerations (#) | Number of accelerations of at least 0.5 m/s/s for 0.5 s. |
| Decelerations (#) | Number of decelerations of at least 0.5 m/s/s for 0.5 s. |
| Dynamix Stress Load (AU) | Total of weighted impacts above 2 g (scaled). |
| Fatigue Index (AU) | Dynamic stress load divided by speed intensity. |
| Heart Rate Exertion (AU) | , where i = 1 to n, the number of time points, C = scaling constant (0.0167), W = heart rate exertion weighting for time point i based on HR/MaxHR, and dt = time interval between successive HR values (0.1 s). |
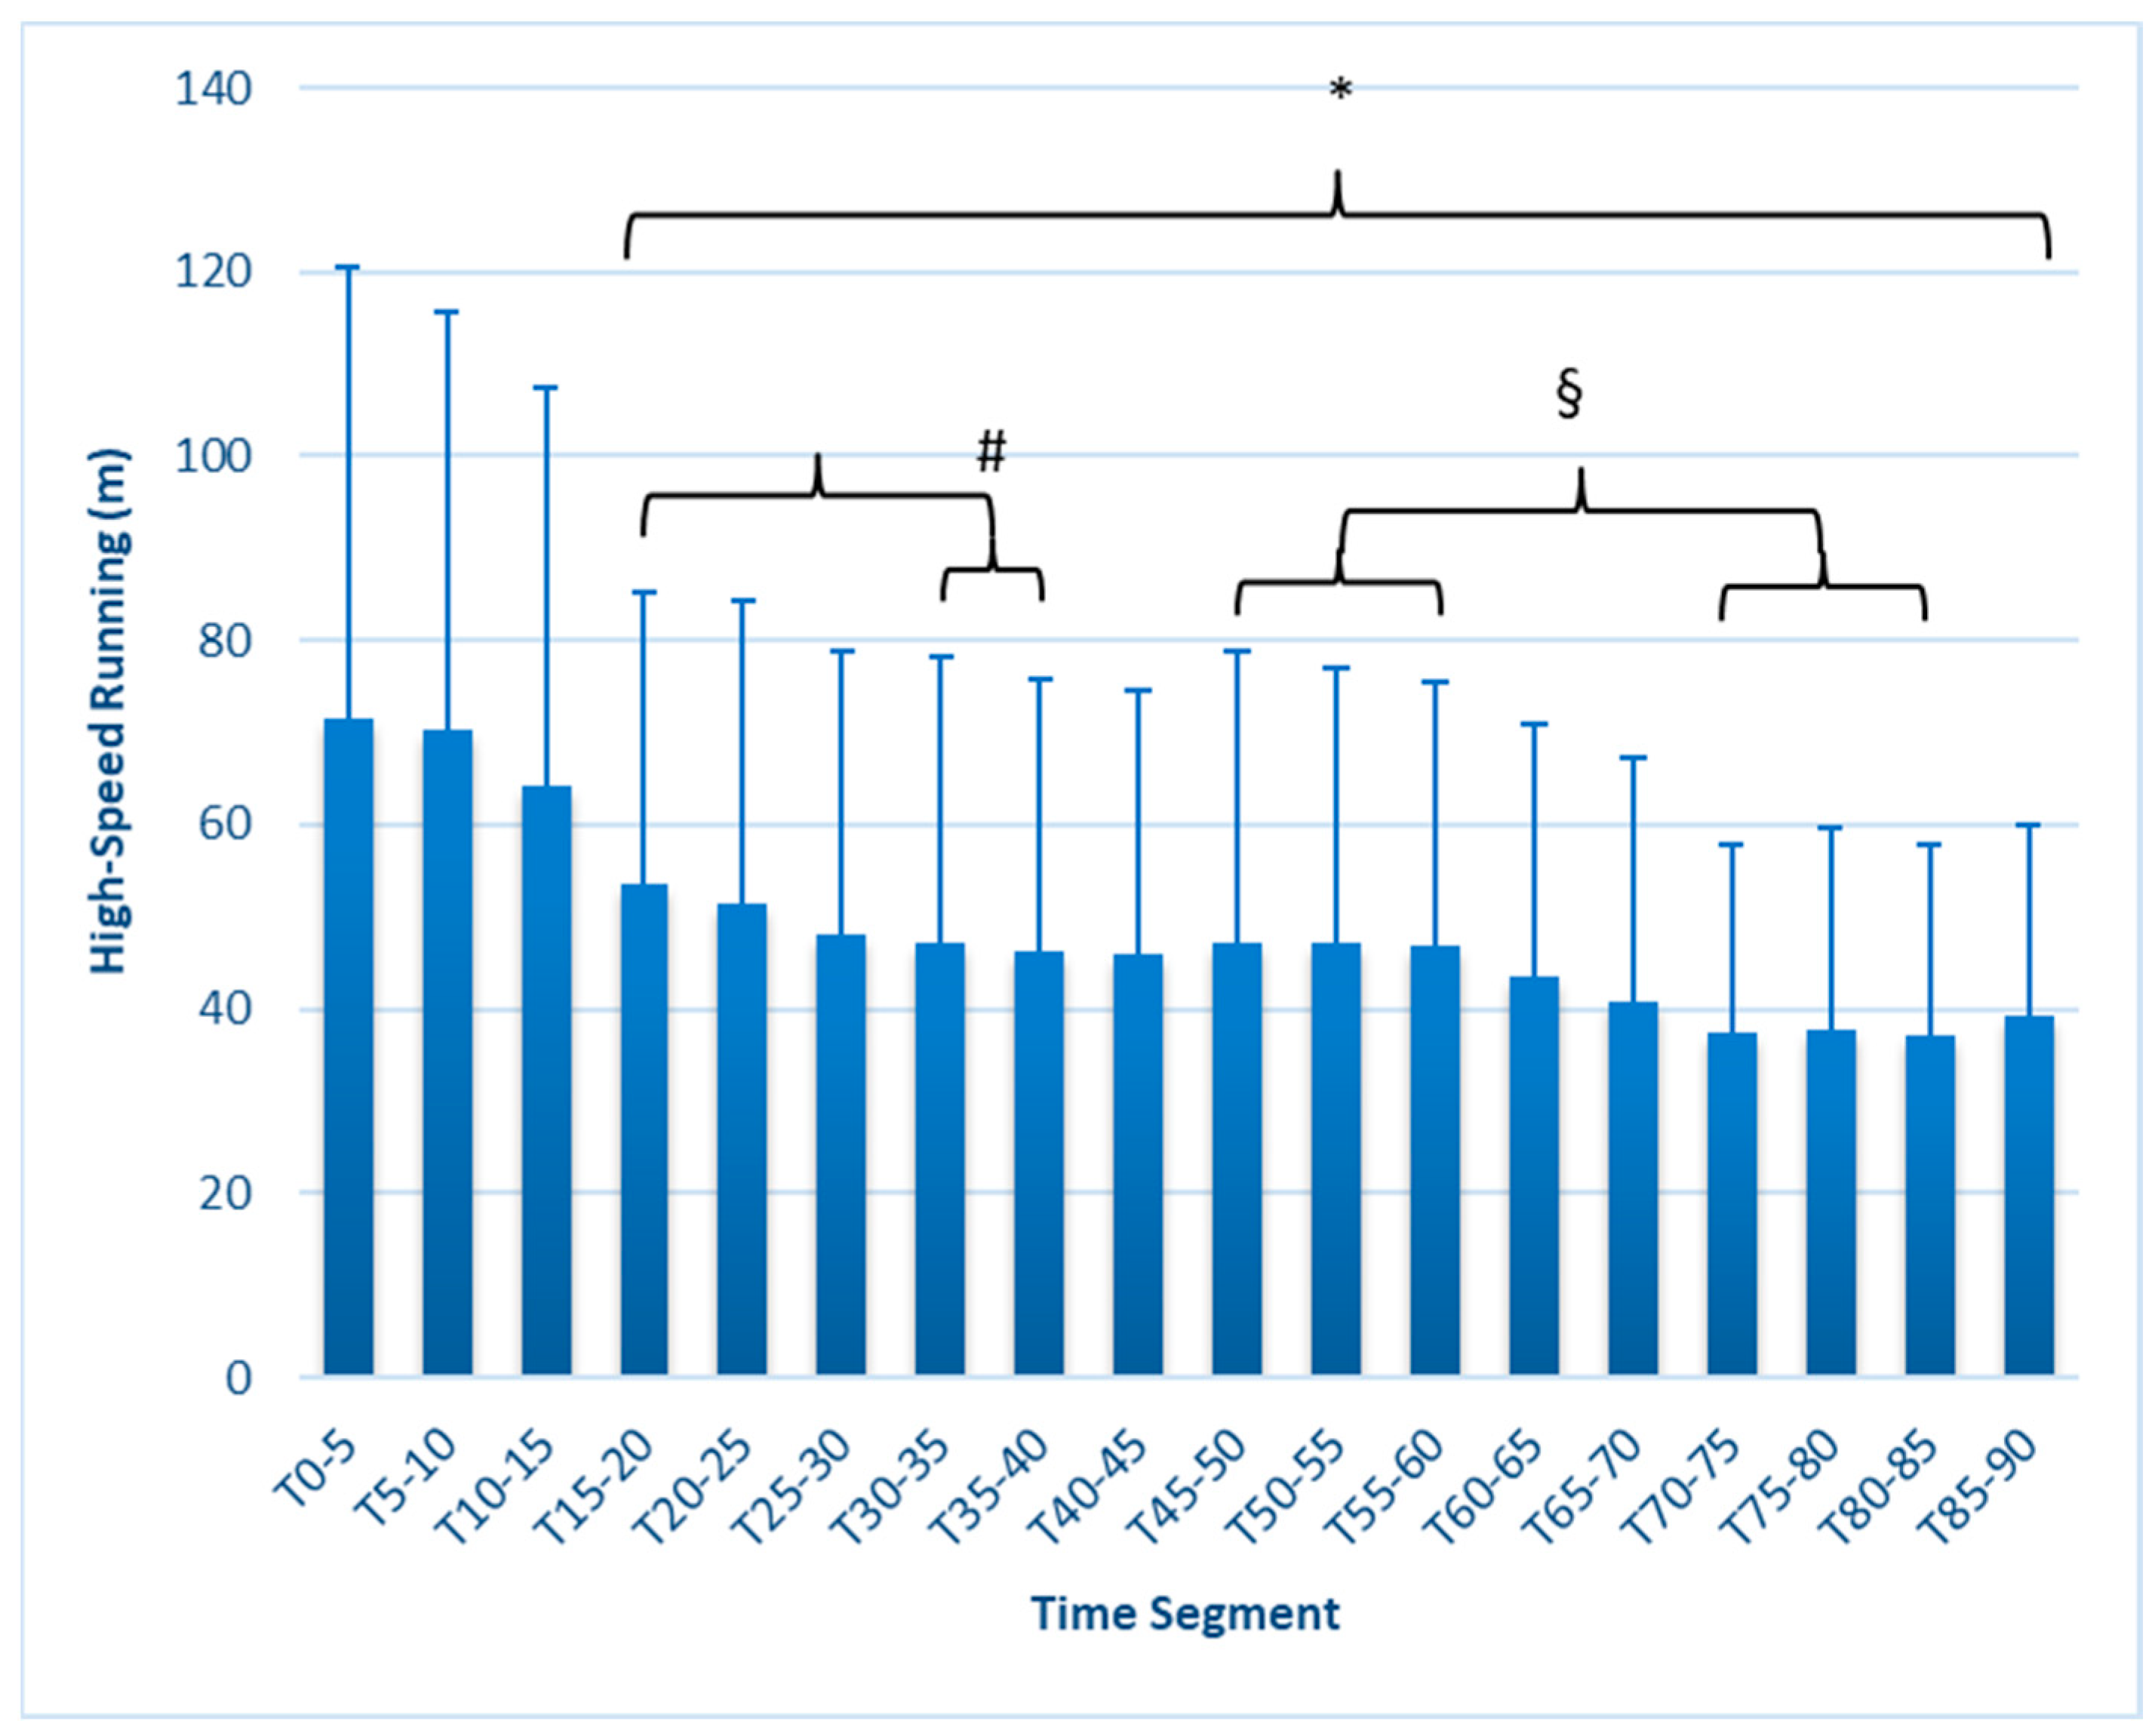
| High-Speed Running (meters) | Distance in meters traveled at 50% or greater of previously measured max speed. This variable was customized for the study and varies from software presets. |
| Speed Intensity (AU) | where i = 1 to n, the number of time points, W = speed intensity weighting for each time point, and dt = time interval between successive speed points (0.1 s). |
| Step Balance (%) | Ratio of the average peak impact force of the left foot to the sum of the average peak impact of the left and right foot. |
| Total Loading (AU) | Total of the forces on the subject over the entire session based on accelerometer values in three directions, sampled 100× per second, and scaled by 1000. |
| Value (Unit) | Definition |
|---|---|
| Jump height | The change in the system center of mass position between the instant of takeoff and peak positive vertical displacement of the system center of mass, calculated using the vertical velocity of the system center of mass at the instant of takeoff and the equations of uniformly accelerated motion. |
| Countermovement depth | The negative vertical displacement of the system center of mass (m). |
| Force at minimum displacement | The vertical ground reaction force applied to the system center of mass at the point of peak negative vertical displacement of the system center of mass. |
| Average relative propulsive force | The average vertical ground reaction force applied to the system center of mass during the propulsion phase as a percentage of system (body) weight. |
| Peak relative propulsive force | The peak instantaneous vertical ground reaction force applied to the system center of mass during the propulsion phase as a percentage of system (body) weight. |
| Peak relative propulsive power | The peak instantaneous mechanical power applied to the system center of mass during the propulsion phase relative to system mass (W/kg). |
| Propulsive phase | The time taken to complete the propulsion phase (from the time when a positive center of mass velocity has been achieved to the moment of takeoff). |
| Positive impulse | The total vertical impulse applied to the system center of mass during the braking phase and the propulsion phase (Ns). |
| Time to takeoff | The total time taken from the initiation of movement to the instant of takeoff. |
| Relative peak landing force | The peak instantaneous ground reaction force applied to the system center of mass during the landing phase (%). |
| L/R peak landing force | The asymmetry between the left and right vertical ground reaction forces applied to the system center of mass at the instant of peak vertical ground reaction force during the landing phase (%). |
| Time Segment/Metric | T15–20 | T20–25 | T25–30 | T30–35 | T35–40 | T40–45 | T45–50 | T50–55 | T55–60 | T60–65 | T65–70 | T70–75 | T75–80 | T80–85 | T85–90 |
|---|---|---|---|---|---|---|---|---|---|---|---|---|---|---|---|
| HSR | 0.43 | 0.48 | 0.57 | 0.59 | 0.62 | 0.63 | 0.58 | 0.59 | 0.61 | 0.4 | 0.77 | 0.9 | 0.89 | 0.91 | 0.85 |
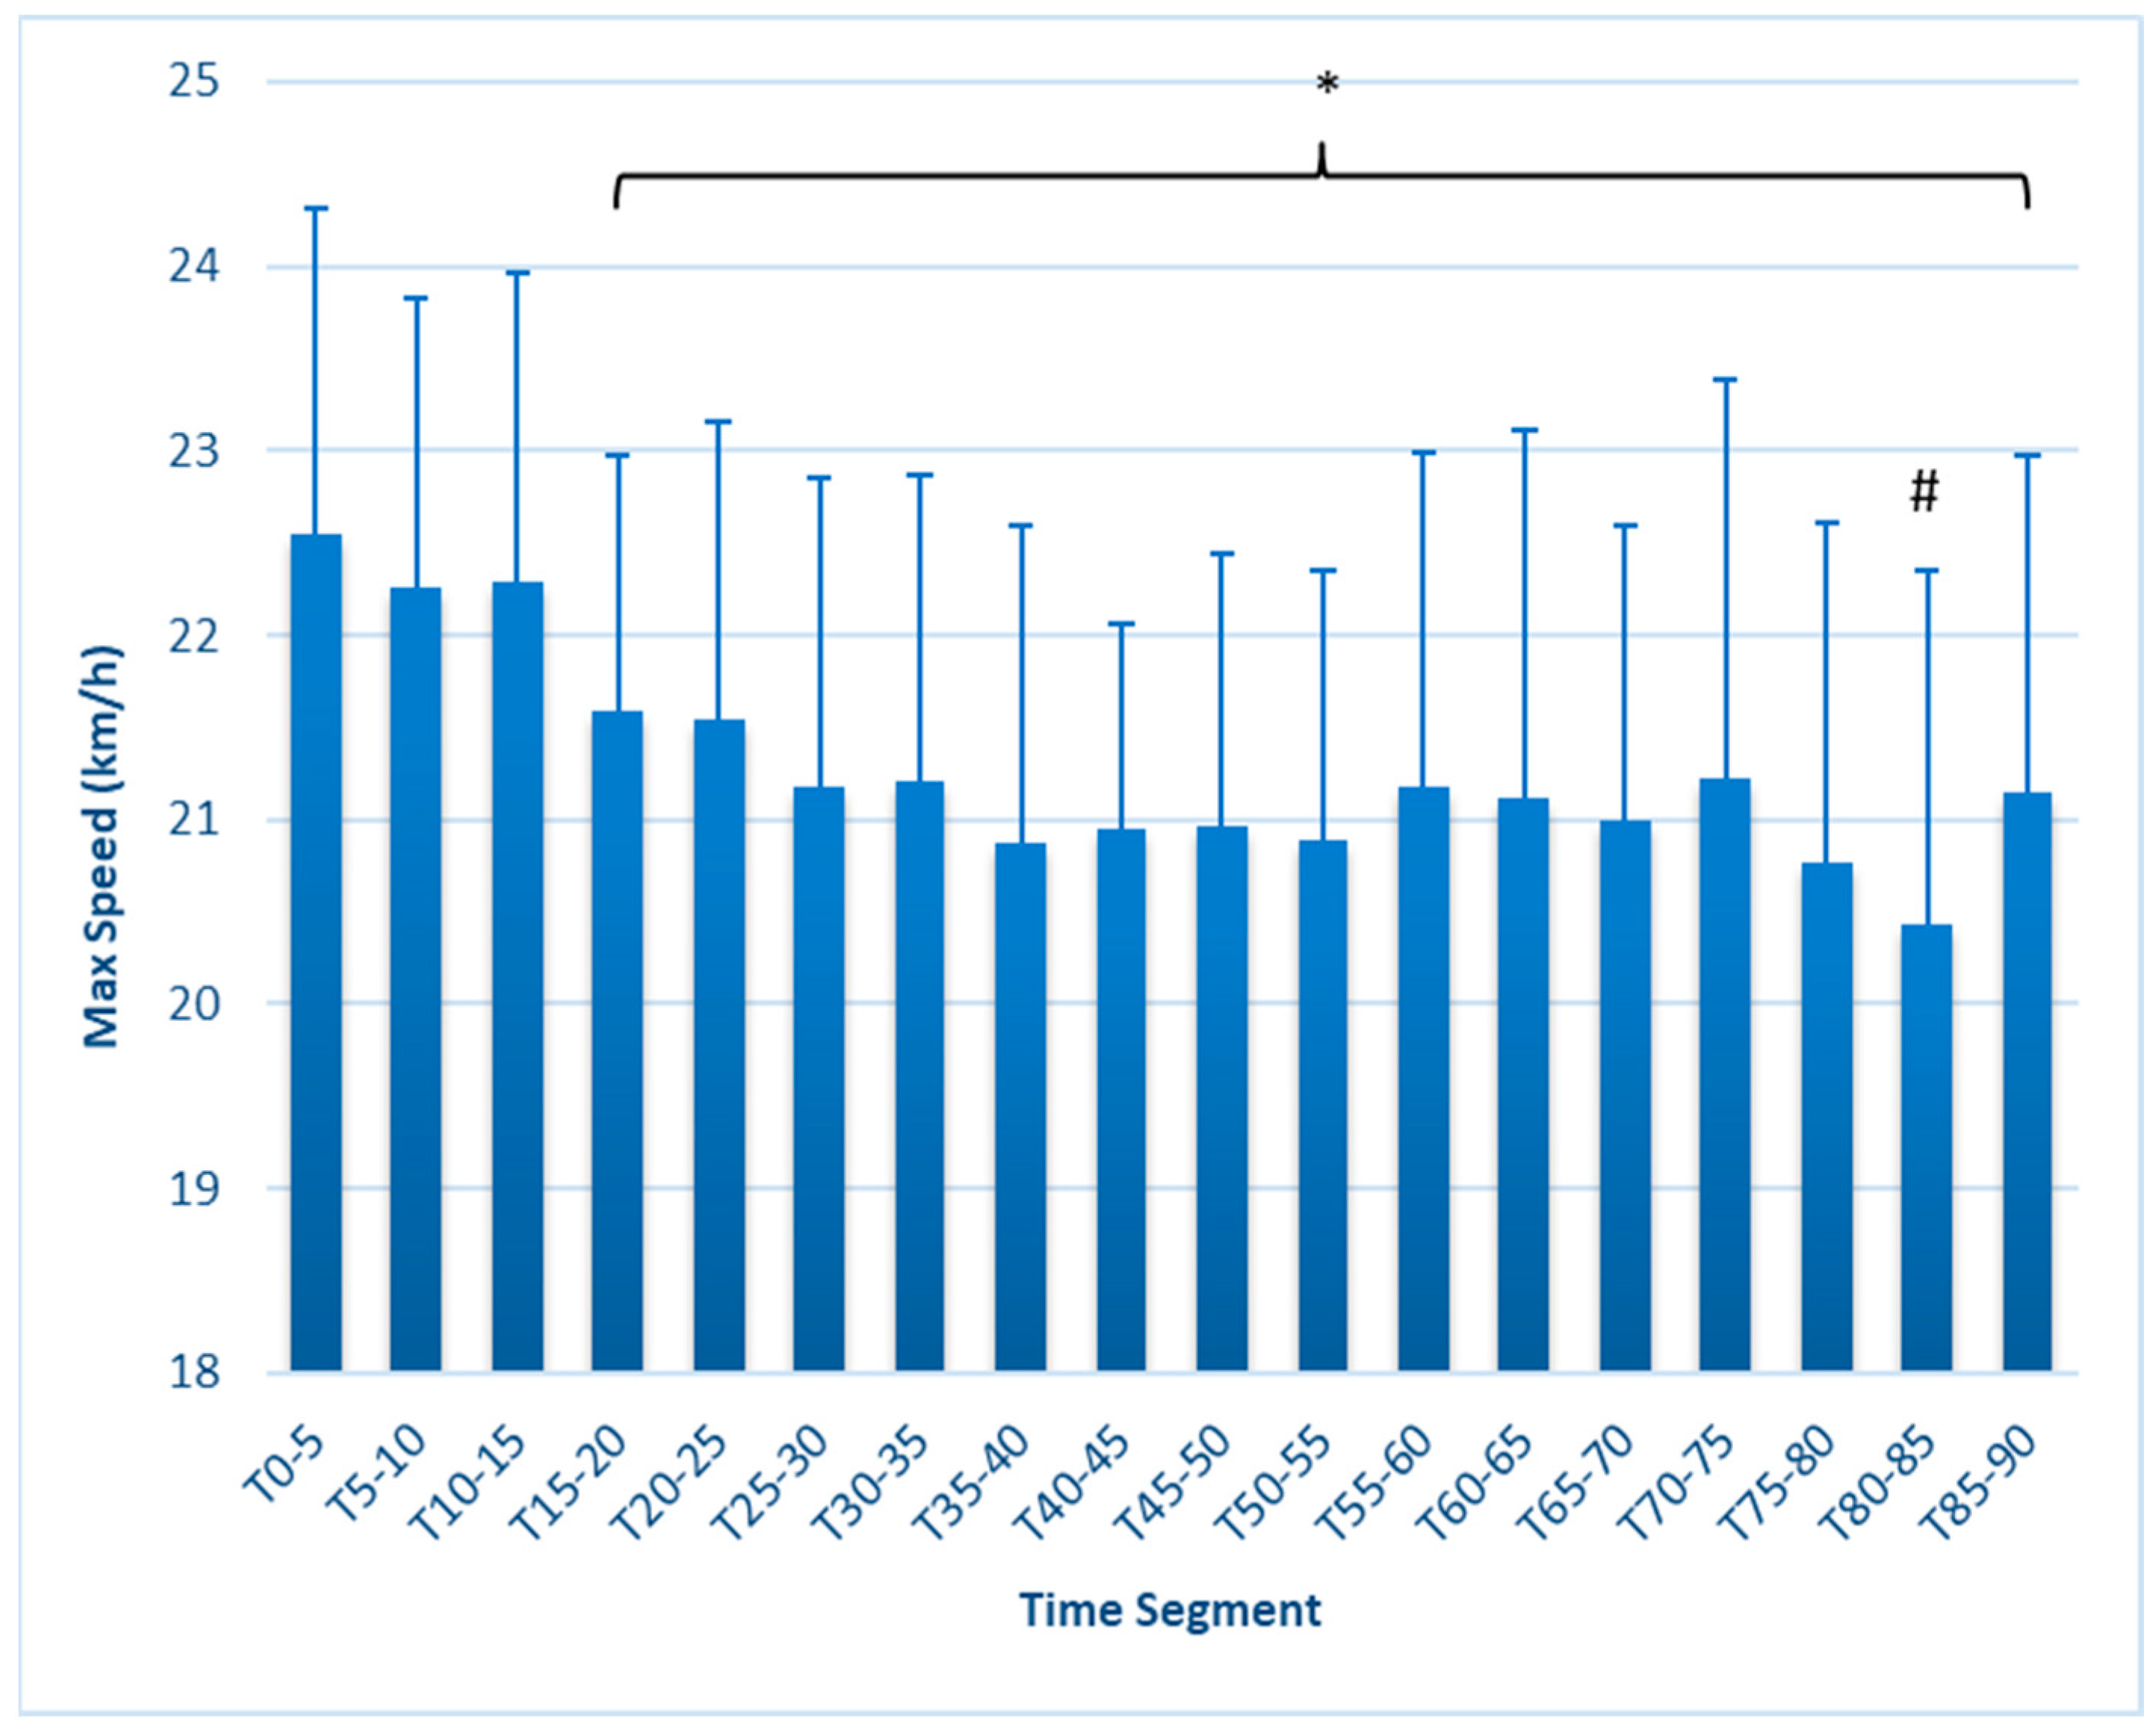
| Max Speed | NS | 0.83 | 0.94 | 1.17 | 1.04 | 1.27 | 1.16 | 1.08 | 1.24 | 1.26 | 1.14 | 1.35 | 1.12 | 1.14 | 1.2 |
| Average Speed | NS | NS | NS | 0.8 | 0.83 | NS | 0.93 | 0.86 | 1.03 | 1.02 | 1.14 | 1.14 | 1.33 | 1.33 | 1.42 |
| SI | 0.77 | 0.71 | 1.02 | 1.1 | 1.08 | 1.02 | 0.97 | 1.26 | 1.35 | 1.37 | 1.48 | 1.59 | 1.92 | 1.84 | 1.67 |
| ACC | NS | 0.83 | 0.94 | 1.17 | 1.04 | 1.27 | 1.16 | 1.08 | 1.24 | 1.26 | 1.14 | 1.35 | 1.12 | 1.14 | 1.2 |
| DEC | NS | 0.77 | 0.83 | 0.89 | 0.95 | 1.0 | 0.86 | 0.75 | 0.82 | 0.89 | 1.25 | 0.9 | 0.96 | 1.27 | 0.82 |
Disclaimer/Publisher’s Note: The statements, opinions and data contained in all publications are solely those of the individual author(s) and contributor(s) and not of MDPI and/or the editor(s). MDPI and/or the editor(s) disclaim responsibility for any injury to people or property resulting from any ideas, methods, instructions or products referred to in the content. |
© 2023 by the authors. Licensee MDPI, Basel, Switzerland. This article is an open access article distributed under the terms and conditions of the Creative Commons Attribution (CC BY) license (https://creativecommons.org/licenses/by/4.0/).
Share and Cite
Snyder, B.J.; Maung-Maung, C.; Whitacre, C. Indicators of Fatigue during a Soccer Match Simulation Using GPS-Derived Workload Values: Which Metrics Are Most Useful? Sports 2024, 12, 9. https://doi.org/10.3390/sports12010009
Snyder BJ, Maung-Maung C, Whitacre C. Indicators of Fatigue during a Soccer Match Simulation Using GPS-Derived Workload Values: Which Metrics Are Most Useful? Sports. 2024; 12(1):9. https://doi.org/10.3390/sports12010009
Chicago/Turabian StyleSnyder, Benjamin J., Cameron Maung-Maung, and Cameron Whitacre. 2024. "Indicators of Fatigue during a Soccer Match Simulation Using GPS-Derived Workload Values: Which Metrics Are Most Useful?" Sports 12, no. 1: 9. https://doi.org/10.3390/sports12010009
APA StyleSnyder, B. J., Maung-Maung, C., & Whitacre, C. (2024). Indicators of Fatigue during a Soccer Match Simulation Using GPS-Derived Workload Values: Which Metrics Are Most Useful? Sports, 12(1), 9. https://doi.org/10.3390/sports12010009


