

In-Season Longitudinal Hydration/Body Cell Mass Ratio Changes in Elite Rugby Players
 , ,
, ,  ,
,  ,
,  , and
, and 
Abstract
1. Introduction
2. Materials and Methods
2.1. Subjects
2.2. Procedures
2.2.1. Anthropometric Measurements
2.2.2. Bioelectrical Measurements
2.2.3. Urine-Specific Gravity Measurements
2.3. Statistical Analysis
3. Results
4. Discussion
5. Conclusions
Author Contributions
Funding
Institutional Review Board Statement
Informed Consent Statement
Data Availability Statement
Acknowledgments
Conflicts of Interest
References
- Silleras, B.d.M.; Ares, G.C.; Marcos, S.d.l.C.; Enciso, L.C.; Fernández, E.Q.; Río, P.R.d. Bioelectrical Impedance Vector Analysis (BIVA) and Somatotype in Female Rugby Players. Appl. Sci. 2023, 13, 5242. [Google Scholar] [CrossRef]
- Brazier, J.; Antrobus, M.; Stebbings, G.K.; Day, S.H.; Callus, P.; Erskine, R.M.; Bennett, M.A.; Kilduff, L.P.; Williams, A.G. Anthropometric and Physiological Characteristics of Elite Male Rugby Athletes. J. Strength Cond. Res. 2020, 34, 1790–1801. [Google Scholar] [CrossRef] [PubMed]
- Lukaski, H.C.; Raymond-Pope, C.J. New Frontiers of Body Composition in Sport. Int. J. Sports Med. 2021, 42, 588–601. [Google Scholar] [CrossRef] [PubMed]
- Nunes, R.F.H.; De Souza-Bezerra, E.; Orssatto, L.B.R.; Moreno, Y.M.; Loturco, I.; Duffield, R.; Silva, D.A.; Guglielmo, L.G.A. Assessing body composition in rugby players: Agreement between different methods and association with physical performance. J. Sports Med. Phys. Fitness. 2020, 60, 733–742. [Google Scholar] [CrossRef]
- Zemski, A.J.; Keating, S.E.; Broad, E.M.; Marsh, D.J.; Hind, K.; Slater, G.J. Preseason body composition adaptations in elite white and polynesian rugby union athletes. Int. J. Sports Nutr. Exerc. Metab. 2019, 29, 9–17. [Google Scholar] [CrossRef]
- García, M.; Martínez-Moreno, J.M.; Reyes-Ortiz, A.; Suarez Moreno-Arrones, L.; García, A.; Garcíacaballero, M. Changes in body composition of high competition rugby players during the phases of a regular season; influence of diet and exercise load. Nutr. Hosp. 2014, 29, 913–921. [Google Scholar] [CrossRef]
- Kyle, U.G.; Bosaeus, I.; De Lorenzo, A.D.; Deurenberg, P.; Elia, M.; Gómez, J.M.; Heitmann, B.L.; Kent-Smith, L.; Melchior, J.C.; Pirlich, M.; et al. Bioelectrical impedance analysis-Part I: Review of principles and methods. Clin. Nutr. 2004, 23, 1226–1243. [Google Scholar] [CrossRef]
- Ward, L.C. Bioelectrical Impedance Analysis for Body Composition Assessment: Reflections on Accuracy, Clinical Utility, and Standardisation. Eur. J. Clin. Nutr. 2019, 73, 194–199. [Google Scholar] [CrossRef]
- Campa, F.; Matias, C.N.; Marini, E.; Heymsfield, S.B.; Toselli, S.; Sardinha, L.B.; Silva, A.M. Identifying Athlete Body Fluid Changes During a Competitive Season with Bioelectrical Impedance Vector Analysis. Int. J. Sports Physiol. Perform. 2020, 15, 361–367. [Google Scholar] [CrossRef]
- Campa, F.; Gobbo, L.A.; Stagi, S.; Cyrino, L.T.; Toselli, S.; Marini, E.; Coratella, G. Bioelectrical impedance analysis versus reference methods in the assessment of body composition in athletes. Eur. J. Appl. Physiol. 2022, 122, 561–589. [Google Scholar] [CrossRef]
- Castizo-Olier, J.; Irurtia, A.; Jemni, M.; Carrasco-Marginet, M.; Fernández-García, R.; Rodríguez, F.A. Bioelectrical impedance vector analysis (BIVA) in sport and exercise: Systematic review and future perspectives. PLoS ONE 2018, 13, e0197957. [Google Scholar] [CrossRef] [PubMed]
- Piccoli, A.; Nigrelli, S.; Caberlotto, A.; Bottazzo, S.; Rossi, B.; Pillon, L.; Maggiore, Q. Bivariate normal values of the bioelectrical impedance vector in adult and elderly populations. Am. J. Clin. Nutr. 1995, 61, 269–270. [Google Scholar] [CrossRef] [PubMed]
- Lukaski, H.C.; Piccoli, A. Bioelectrical impedance vector analysis for assessment of hydration in physiological states and clinical conditions. In Handbook of Anthropometry: Physical Measures of Human Form in Health and Disease; Springer: Berlin/Heidelberg, Germany, 2012; pp. 287–305. [Google Scholar]
- Marini, E.; Campa, F.; Buffa, R.; Stagi, S.; Matias, C.N.; Toselli, S.; Sardinha, L.B.; Silva, A.M. Phase angle and bioelectrical impedance vector analysis in the evaluation of body composition in athletes. Clin. Nutr. 2020, 39, 447–454. [Google Scholar] [CrossRef] [PubMed]
- Lukaski, H.C. Body Composition: Health and Performance in Exercise and Sport; Orlando, F.L., Ed.; CRC Press Taylor & Francis Group: Boca Raton, FL, USA, 2017. [Google Scholar]
- Zubac, D.; Reale, R.; Karnincic, H.; Sivric, A.; Jelaska, I. Urine specific gravity as an indicator of dehydration in Olympic combat sport athletes; considerations for research and practice. Eur. J. Sports Sci. 2018, 18, 920–929. [Google Scholar] [CrossRef] [PubMed]
- Armstrong, L.E. Hydration assessment techniques. Nutr. Rev. 2005, 63 Pt 2, S40–S54. [Google Scholar] [CrossRef]
- Popowski, L.A.; Oppliger, R.A.; Lambert, G.P.; Johnson, R.F.; Johnson, A.K.; Gisolfi, C.V. Blood and urinary measures of hydration status during progressive acute dehydration. Med. Sci. Sports Exerc. 2001, 33, 747–753. [Google Scholar] [CrossRef]
- Hamouti, N.; Del Coso, J.; Ávila, A.; Mora-Rodriguez, R. Effects of athletes’ muscle mass on urinary markers of hydration status. Eur. J. Appl. Physiol. 2010, 109, 213–219. [Google Scholar] [CrossRef]
- Cosgrove, S.D.; Love, T.D.; Brown, R.C.; Baker, D.F.; Howe, A.S.; Black, K.E. Fluid and electrolyte balance during two different preseason training sessions in elite rugby union players. J. Strength Cond. Reseach. 2014, 28, 520–527. [Google Scholar] [CrossRef]
- World Medical Association (WMA). World Medical Association Declaration of Helsinki: Ethical Principles for Medical Research Involving Human Subjects. JAMA 2013, 310, 2191–2194. [Google Scholar] [CrossRef]
- Minton, D.M.; O’Neal, E.K.; Torres-McGehee, T.M. Agreement of urine specific gravity measurements between manual and digital refractometers. J. Athl. Train. 2015, 50, 59–64. [Google Scholar] [CrossRef]
- Sawka, M.N.; Burke, L.M.; Eichner, E.R.; Maughan, R.J.; Montain, S.J.; Stachenfeld, N.S. Exercise and fluid replacement. Med. Sci. Sports Exerc. 2007, 39, 377–390. [Google Scholar] [PubMed]
- Bakdash, J.Z.; Marusich, L.R. Repeated measures correlation. Front. Psychol. 2017, 8, 456. [Google Scholar] [CrossRef]
- Piccoli, A. BIVA SOFTWARE 2002; Order A J Theory Ordered Sets Its Appl; University of Padova: Padova, Italy, 2002; pp. 1–17. [Google Scholar]
- Campa, F.; Thomas, D.M.; Watts, K.; Clark, N.; Baller, D.; Morin, T.; Toselli, S.; Koury, J.C.; Melchiorri, G.; Andreoli, A.; et al. Reference Percentiles for Bioelectrical Phase Angle in Athletes. Biology 2022, 11, 264. [Google Scholar] [CrossRef]
- Silva, A.M. Structural and functional body components in athletic health and performance phenotypes. Eur. J. Clin. Nutr. 2019, 73, 215–224. [Google Scholar] [CrossRef] [PubMed]
- Campa, F.; Silva, A.M.; Matias, C.N.; Monteiro, C.P.; Paoli, A.; Nunes, J.P.; Talluri, J.; Lukaski, H.; Toselli, S. Body water content and morphological characteristics modify bioimpedance vector patterns in volleyball, soccer, and rugby players. Int. J. Environ. Res. Public Health 2020, 17, 6604. [Google Scholar] [CrossRef]
- Mascherini, G.; Gatterer, H.; Lukaski, H.; Burtscher, M.; Galanti, G. Changes in hydration, body-cell mass and endurance performance of professional soccer players through a competitive season. J. Sports Med. Phys. Fit. 2015, 55, 749–755. [Google Scholar]
- Reis, J.F.; Matias, C.N.; Campa, F.; Morgado, J.P.; Franco, P.; Quaresma, P.; Almeida, N.; Curto, D.; Toselli, S.; Monteiro, C.P. Bioimpedance vector patterns changes in response to swimming training: An ecological approach. Int. J. Environ. Res. Public. Health. 2020, 17, 4851. [Google Scholar] [CrossRef]
- Silva, A.M.; Fields, D.A.; Heymsfield, S.B.; Sardinha, L.B. Body composition and power changes in elite judo athletes. Int. J. Sports Med. 2010, 31, 737–741. [Google Scholar] [CrossRef]
- Silva, A.M.; Fields, D.A.; Heymstleld, S.B.; Sardinha, L.B. Relationship between changes in total-body water and fluid distribution with maximal forearm strength in elite judo athletes. J. Strength Cond. Res. 2011, 25, 2488–2495. [Google Scholar] [CrossRef]
- Silva, A.M.; Matias, C.N.; Santos, D.A.; Rocha, P.M.; Minderico, C.S.; Sardinha, L.B. Increases in intracellular water explain strength and power improvements over a season. Int. J. Sports Med. 2014, 35, 1101–1105. [Google Scholar] [CrossRef]
- Hetherington-Rauth, M.; Leu, C.G.; Júdice, P.B.; Correia, I.R.; Magalhães, J.P.; Sardinha, L.B. Whole body and regional phase angle as indicators of muscular performance in athletes. Eur. J. Sports Sci. 2021, 21, 1684–1692. [Google Scholar] [CrossRef] [PubMed]
- Sedeaud, A.; Marc, A.; Schipman, J.; Schaal, K.; Danial, M.; Guillaume, M.; Berthelot, G.; Toussaint, J.F. Secular trend: Morphology and performance. J. Sports Sci. 2014, 32, 1146–1154. [Google Scholar] [CrossRef] [PubMed]
- Ackland, T.R.; Lohman, T.G.; Sundgot-Borgen, J.; Maughan, R.J.; Meyer, N.L.; Stewart, A.D.; Müller, W. Current Status of Body Composition Assessment in Sport. Sport. Med. 2012, 42, 227–249. [Google Scholar] [CrossRef]
- Cutrufello, P.T.; Dixon, C.B.; Zavorsky, G.S. Hydration assessment among marathoners using urine specific gravity and bioelectrical impedance analysis. Res. Sports Med. 2016, 24, 234–242. [Google Scholar] [CrossRef]
- Wekre, S.L.; Landsverk, H.D.; Lautridou, J.; Hjelde, A.; Imbert, J.P.; Balestra, C.; Eftedal, I. Hydration status during commercial saturation diving measured by bioimpedance and urine specific gravity. Front. Physiol. 2022, 13, 971757. [Google Scholar] [CrossRef] [PubMed]
- Francisco, R.; Jesus, F.; Nunes, C.L.; Cioffi, I.; Alvim, M.; Mendonca, G.V.; Lukaski, H.; Sardinha, L.B.; Silva, A.M. Athletes with different habitual fluid intakes differ in hydration status but not in body water compartments. Scand. J. Med. Sci. Sports 2023, 33, 1072–1078. [Google Scholar] [CrossRef]
- Zubac, D.; Antelj, T.; Olujic, D.; Ivancev, V.; Morrison, S.A. Fluid balance and hydration assessment during the weight-stable preparation phase in elite youth boxers. J. Sports Sci. 2017, 35, 719–726. [Google Scholar] [CrossRef]
- Barley, O.R.; Chapman, D.W.; Abbiss, C.R. Reviewing the current methods of assessing hydration in athletes. J. Int. Soc. Sports Nutr. 2020, 17, 52. [Google Scholar] [CrossRef]


| T1 | T2 | T3 | T4 | T5 | ANOVA | |
|---|---|---|---|---|---|---|
| BM (kg) | 100.7 ± 13.0 e | 100.9 ± 13.2 | 100.9 ± 12.9 e | 102.1 ± 13.2 | 102.3 ± 13.1 a,c | <0.001 |
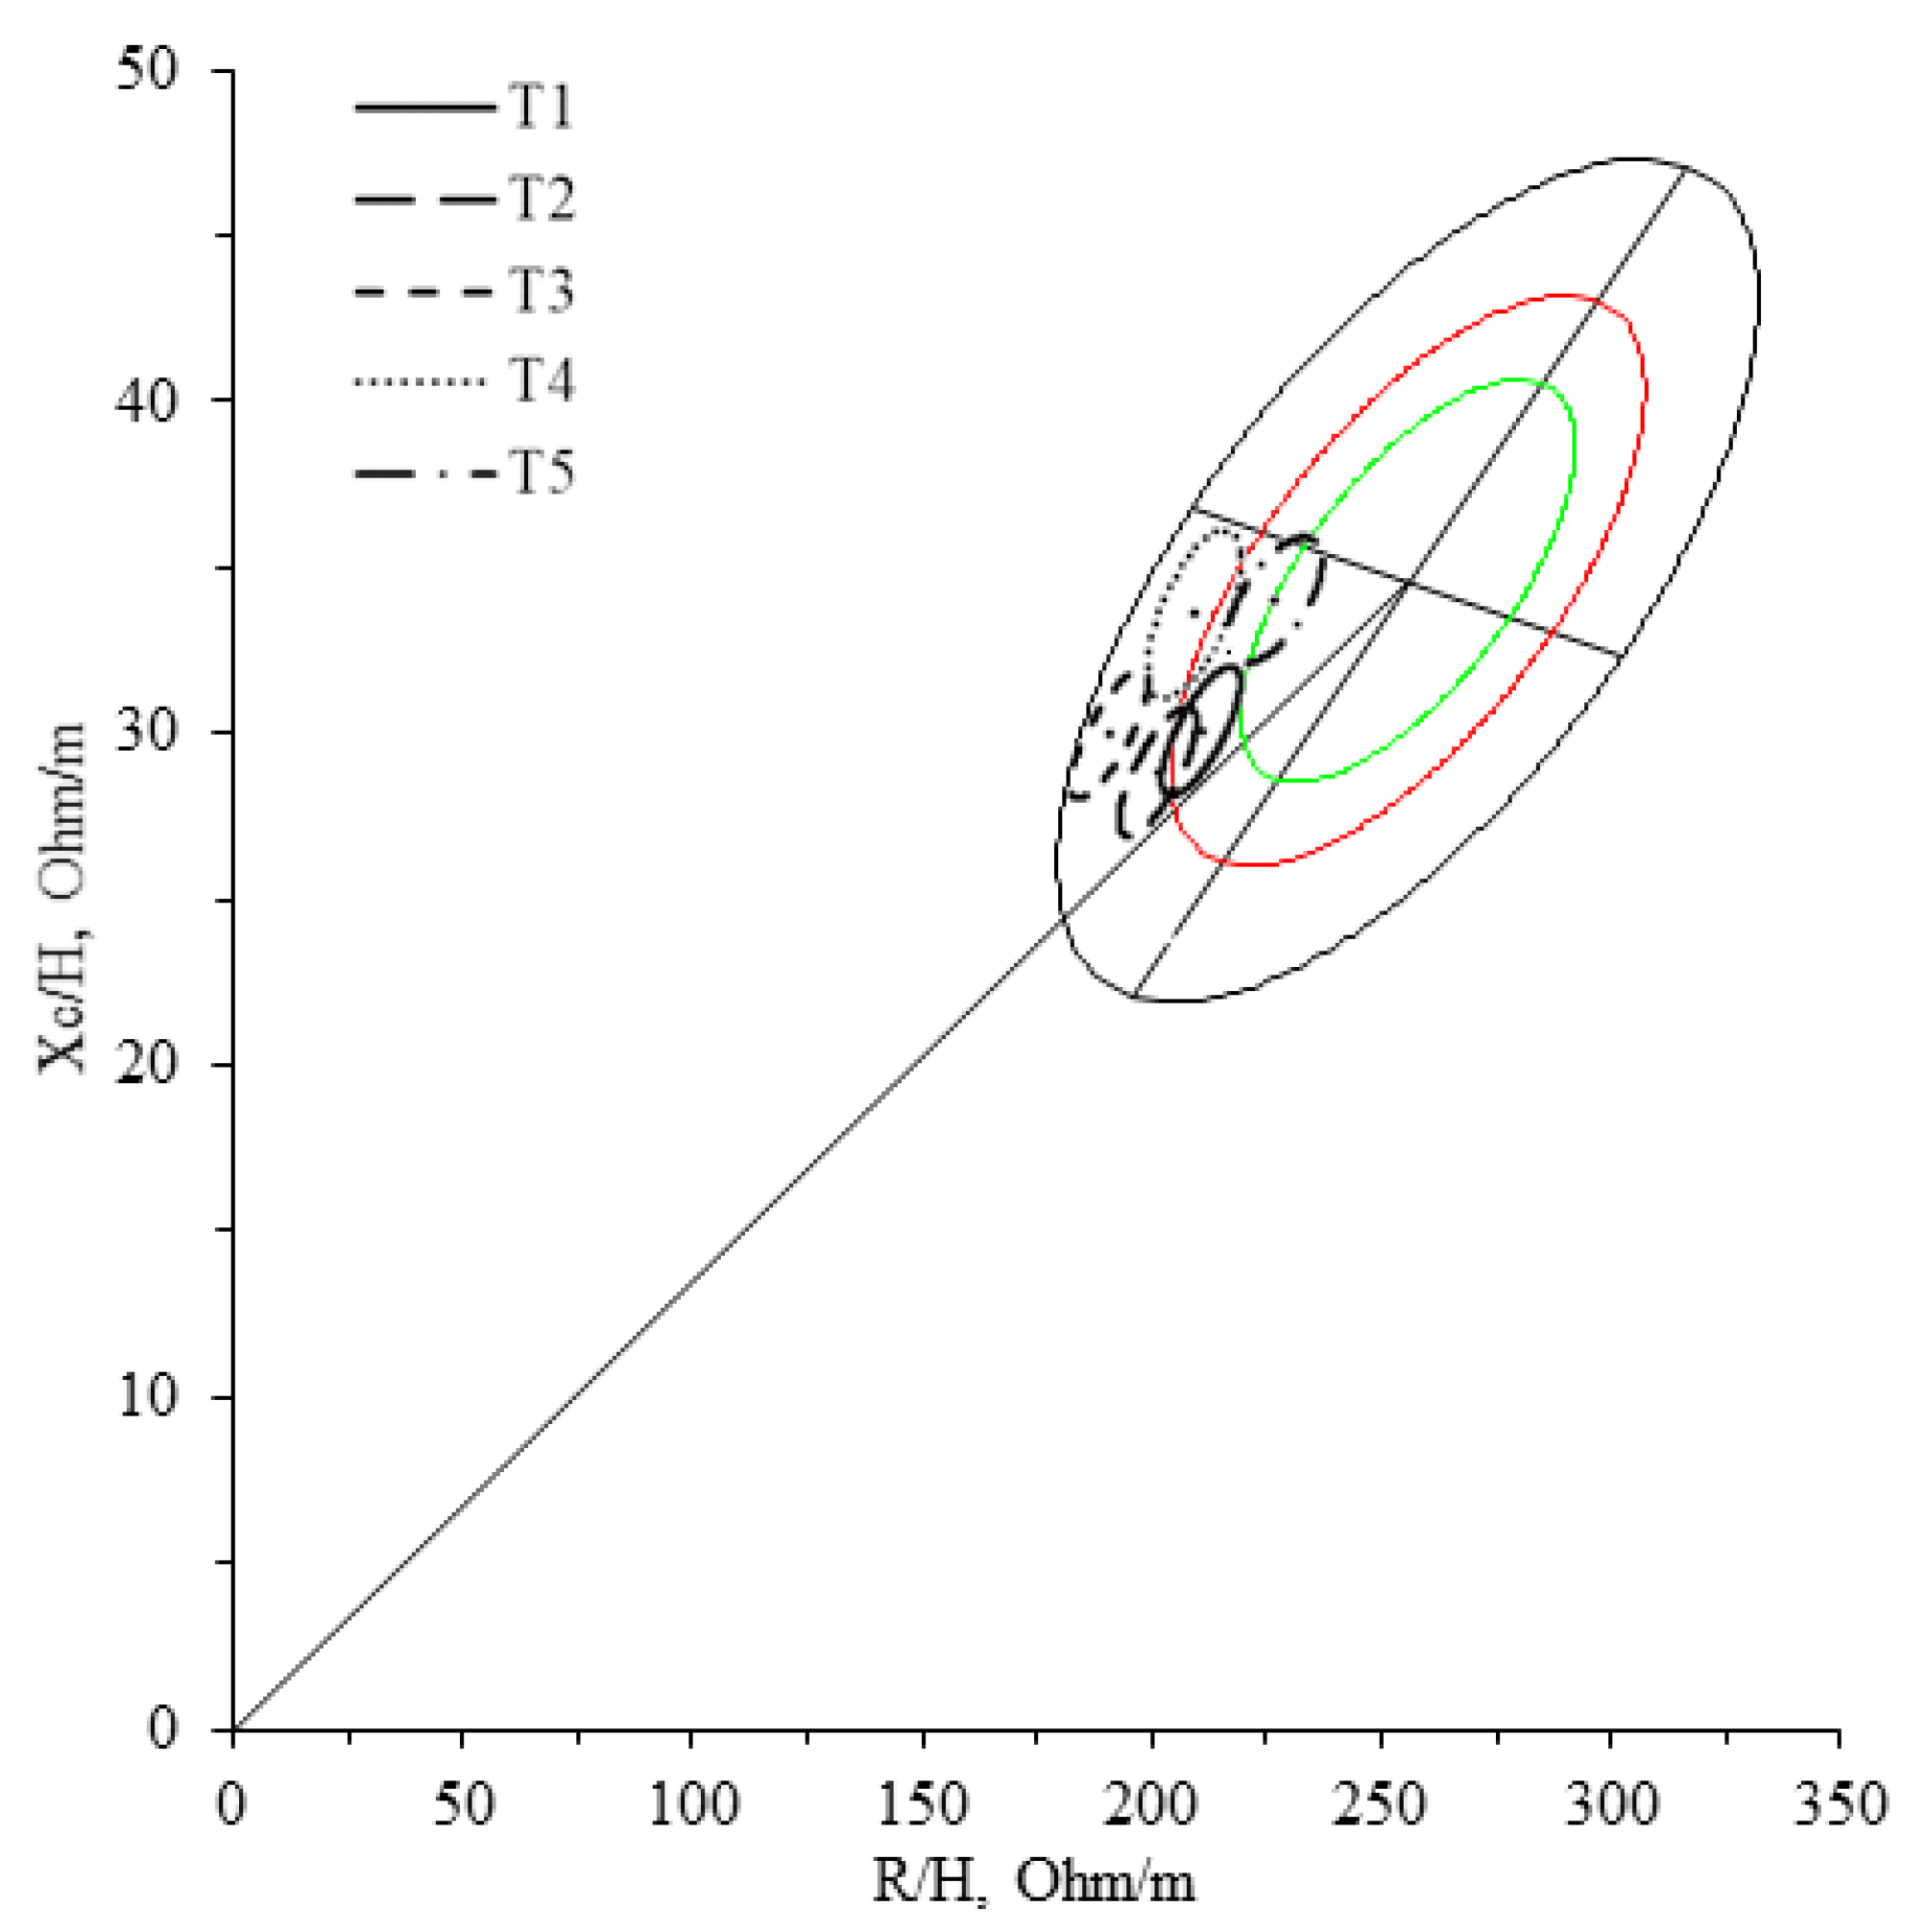
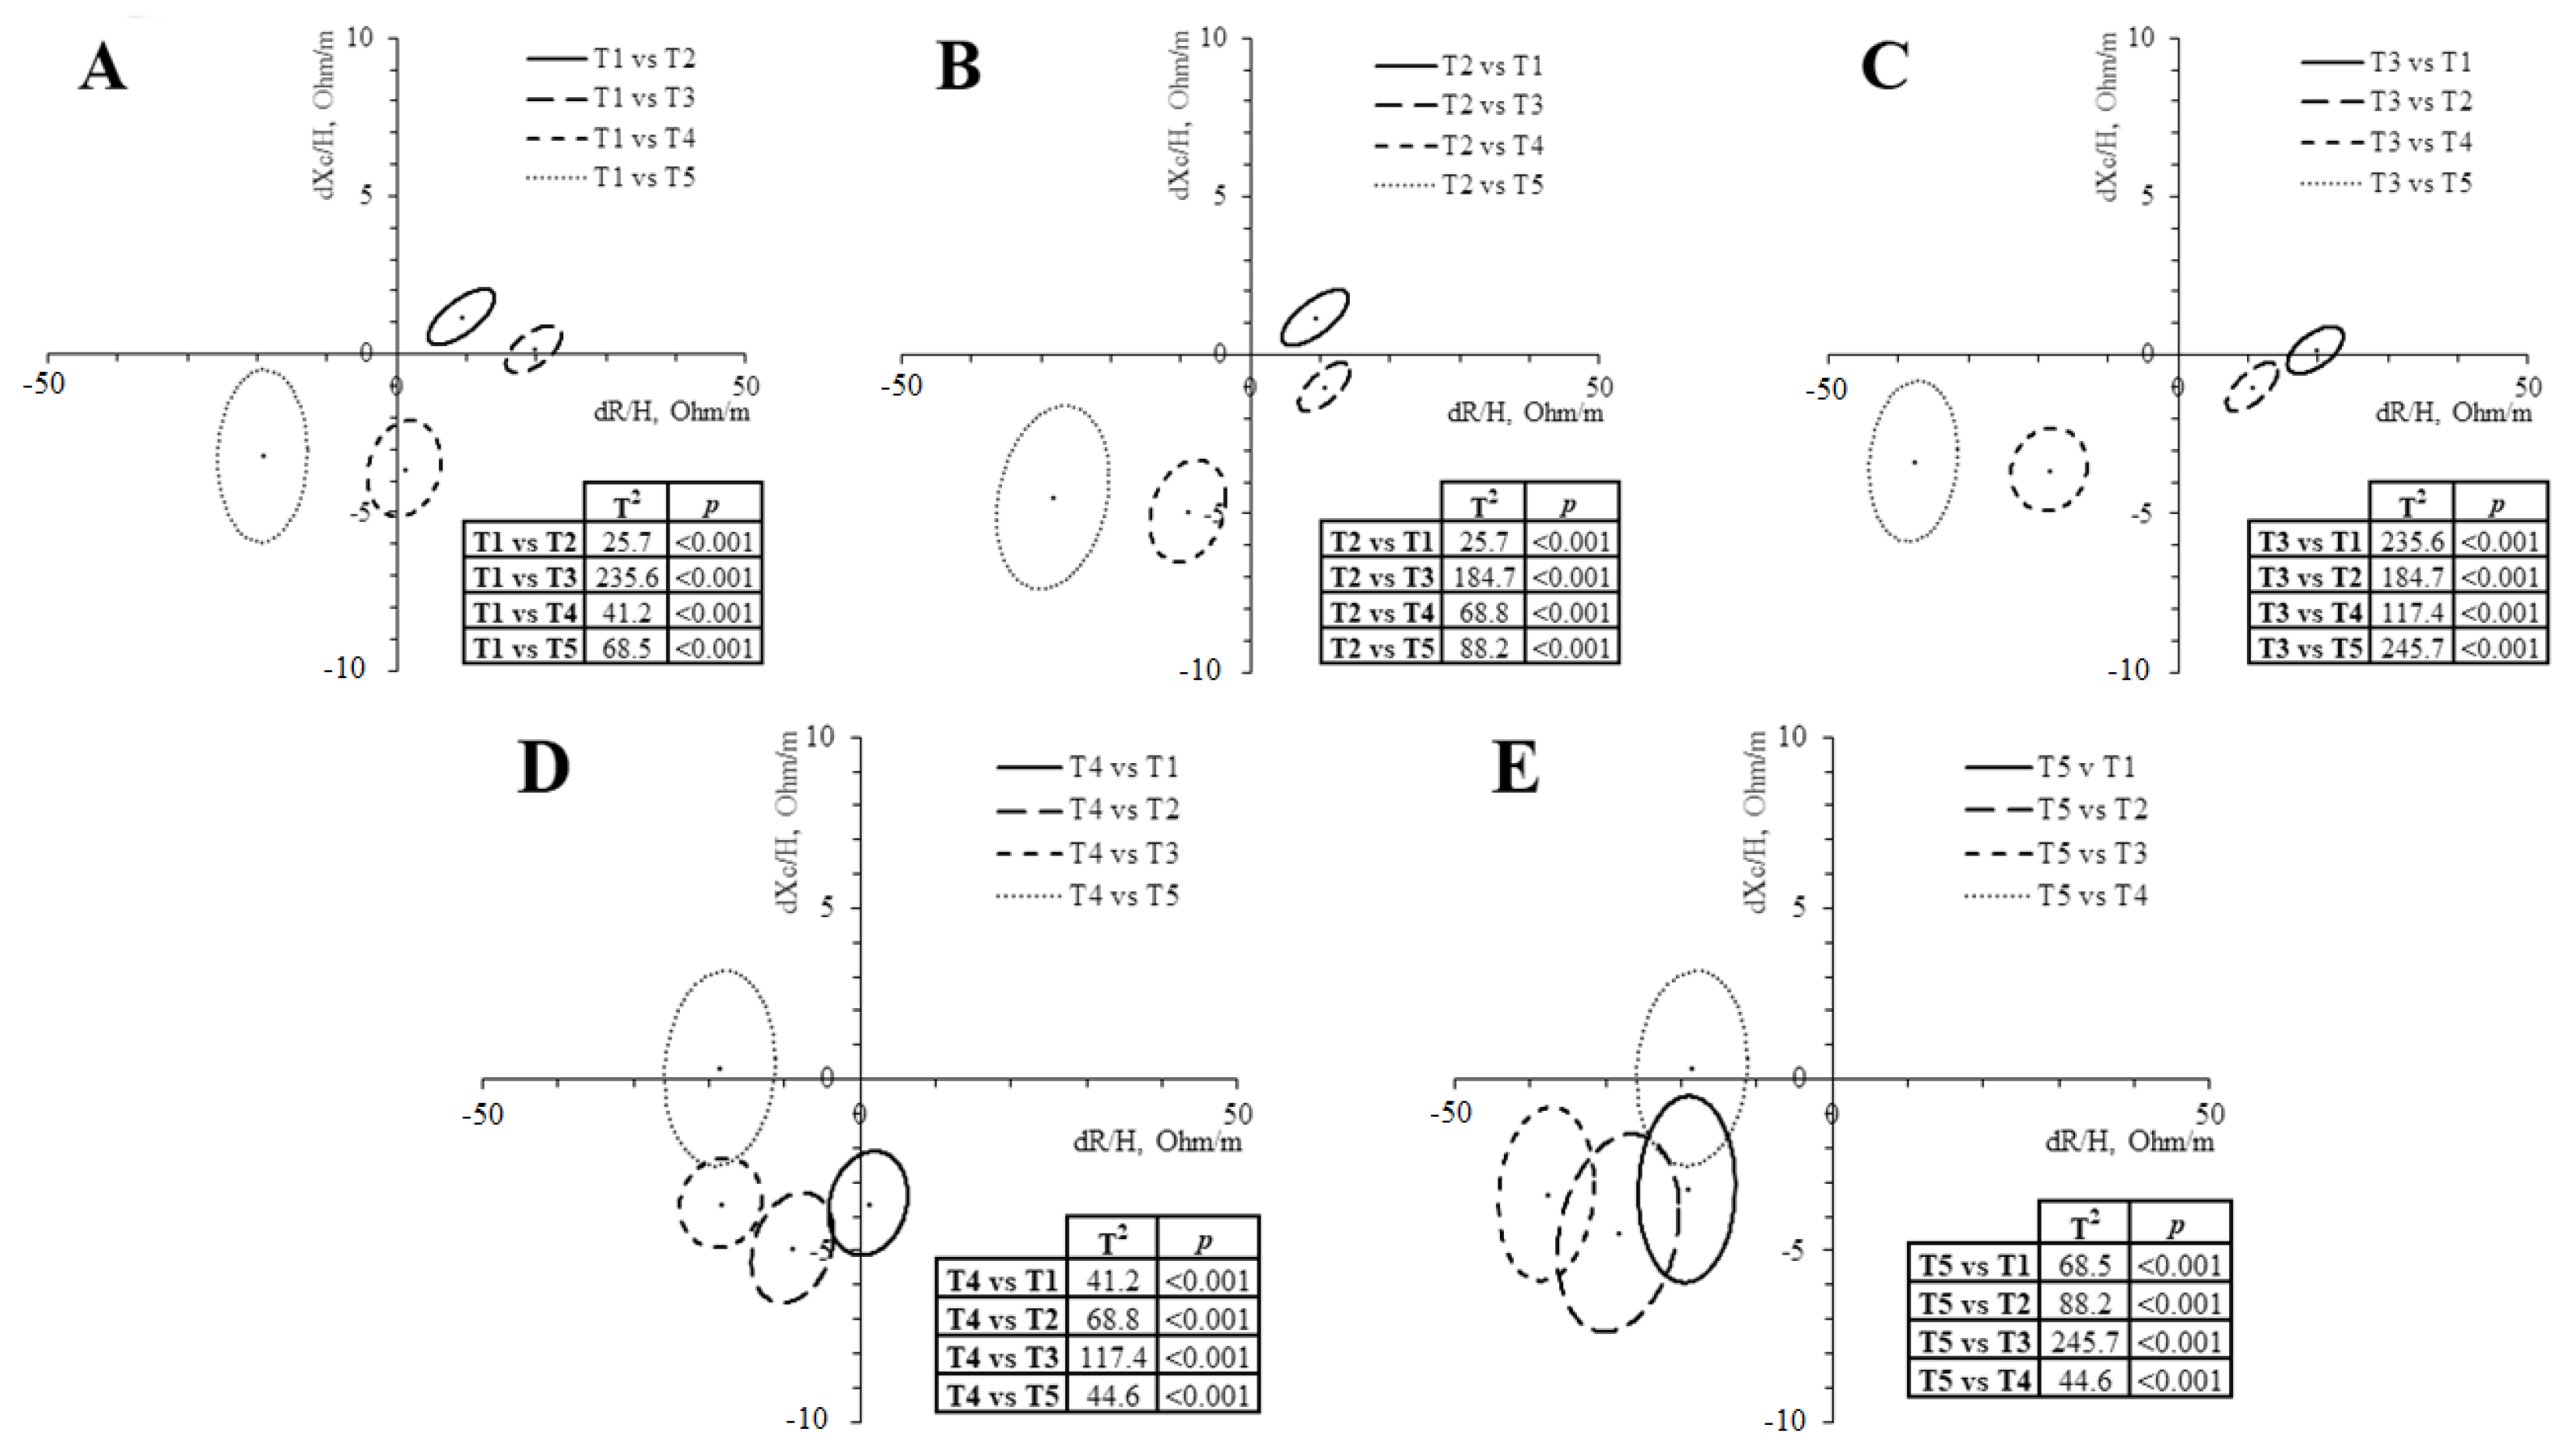
| R/H (Ω/m) | 204.6 ± 18.4 b,c,e | 195.2 ± 18.3 a,c,d,e | 185.0 ± 18.9 a,b,d,e | 205.0 ± 23.0 b,c,e | 224.3 ± 24.6 a,b,c,d | 0.003 |
| Xc/H (Ω/m) | 29.6 ± 4.3 b,d,e | 28.3 ± 4.0 a,c,d,e | 29.3 ± 4.2 b,d,e | 33.3 ± 5.8 a,b,c | 34.0 ± 4.5 a,b,c | 0.001 |
| Z/H (Ω/m) | 206.7 ± 18.7 b,c,e | 197.2 ± 18.6 a,c,d,e | 187.3 ± 19.2 a,b,d,e | 207.8 ± 23.4 b,c,e | 226.9 ± 24.8 a,b,c,d | 0.004 |
| PhA (°) | 8.2 ± 0.8 c,d,e | 8.2 ± 0.8 c,d,e | 9.0 ± 0.8 a,b,e | 9.2 ± 1.2 a,b,e | 8.6 ± 0.9 a,b,c,d | <0.001 |
| USG (g·mL−1) | 1.021 ± 0.009 | 1.023 ± 0.008 | 1.023 ± 0.005 | 1.019 ± 0.009 | 1.021 ± 0.007 | 0.754 |
| USG | ||||||||||||
|---|---|---|---|---|---|---|---|---|---|---|---|---|
| Pearson’s Correlation | Rmcorr | |||||||||||
| T1 | T2 | T3 | T4 | T5 | Whole Season | |||||||
| r | p | r | p | r | p | r | p | r | p | r | p | |
| R/H | 0.23 | 0.216 | 0.15 | 0.452 | 0.07 | 0.716 | −0.08 | 0.687 | 0.43 | 0.019 | −0.08 | 0.438 |
| Xc/H | 0.03 | 0.858 | 0.01 | 0.956 | −0.05 | 0.801 | −0.15 | 0.463 | 0.15 | 0.428 | −0.17 | 0.082 |
| Z/H | 0.23 | 0.226 | 0.14 | 0.462 | 0.07 | 0.729 | −0.09 | 0.678 | 0.42 | 0.021 | −0.08 | 0.422 |
| PhA | −0.16 | 0.394 | −0.14 | 0.468 | −0.18 | 0.359 | −0.13 | 0.546 | −0.27 | 0.144 | 0.15 | 0.134 |
Disclaimer/Publisher’s Note: The statements, opinions and data contained in all publications are solely those of the individual author(s) and contributor(s) and not of MDPI and/or the editor(s). MDPI and/or the editor(s) disclaim responsibility for any injury to people or property resulting from any ideas, methods, instructions or products referred to in the content. |
© 2023 by the authors. Licensee MDPI, Basel, Switzerland. This article is an open access article distributed under the terms and conditions of the Creative Commons Attribution (CC BY) license (https://creativecommons.org/licenses/by/4.0/).
Share and Cite
Cebrián-Ponce, Á.; Petri, C.; Izzicupo, P.; Micheli, M.L.; Cortis, C.; Fusco, A.; Carrasco-Marginet, M.; Mascherini, G. In-Season Longitudinal Hydration/Body Cell Mass Ratio Changes in Elite Rugby Players. Sports 2023, 11, 142. https://doi.org/10.3390/sports11080142
Cebrián-Ponce Á, Petri C, Izzicupo P, Micheli ML, Cortis C, Fusco A, Carrasco-Marginet M, Mascherini G. In-Season Longitudinal Hydration/Body Cell Mass Ratio Changes in Elite Rugby Players. Sports. 2023; 11(8):142. https://doi.org/10.3390/sports11080142
Chicago/Turabian StyleCebrián-Ponce, Álex, Cristian Petri, Pascal Izzicupo, Matteo Levi Micheli, Cristina Cortis, Andrea Fusco, Marta Carrasco-Marginet, and Gabriele Mascherini. 2023. "In-Season Longitudinal Hydration/Body Cell Mass Ratio Changes in Elite Rugby Players" Sports 11, no. 8: 142. https://doi.org/10.3390/sports11080142
APA StyleCebrián-Ponce, Á., Petri, C., Izzicupo, P., Micheli, M. L., Cortis, C., Fusco, A., Carrasco-Marginet, M., & Mascherini, G. (2023). In-Season Longitudinal Hydration/Body Cell Mass Ratio Changes in Elite Rugby Players. Sports, 11(8), 142. https://doi.org/10.3390/sports11080142