
Reliability and Effectiveness of a Lateral Countermovement Jump for Stratifying Shuffling Performance Amongst Elite Basketball Players

Abstract
1. Introduction
2. Materials and Methods
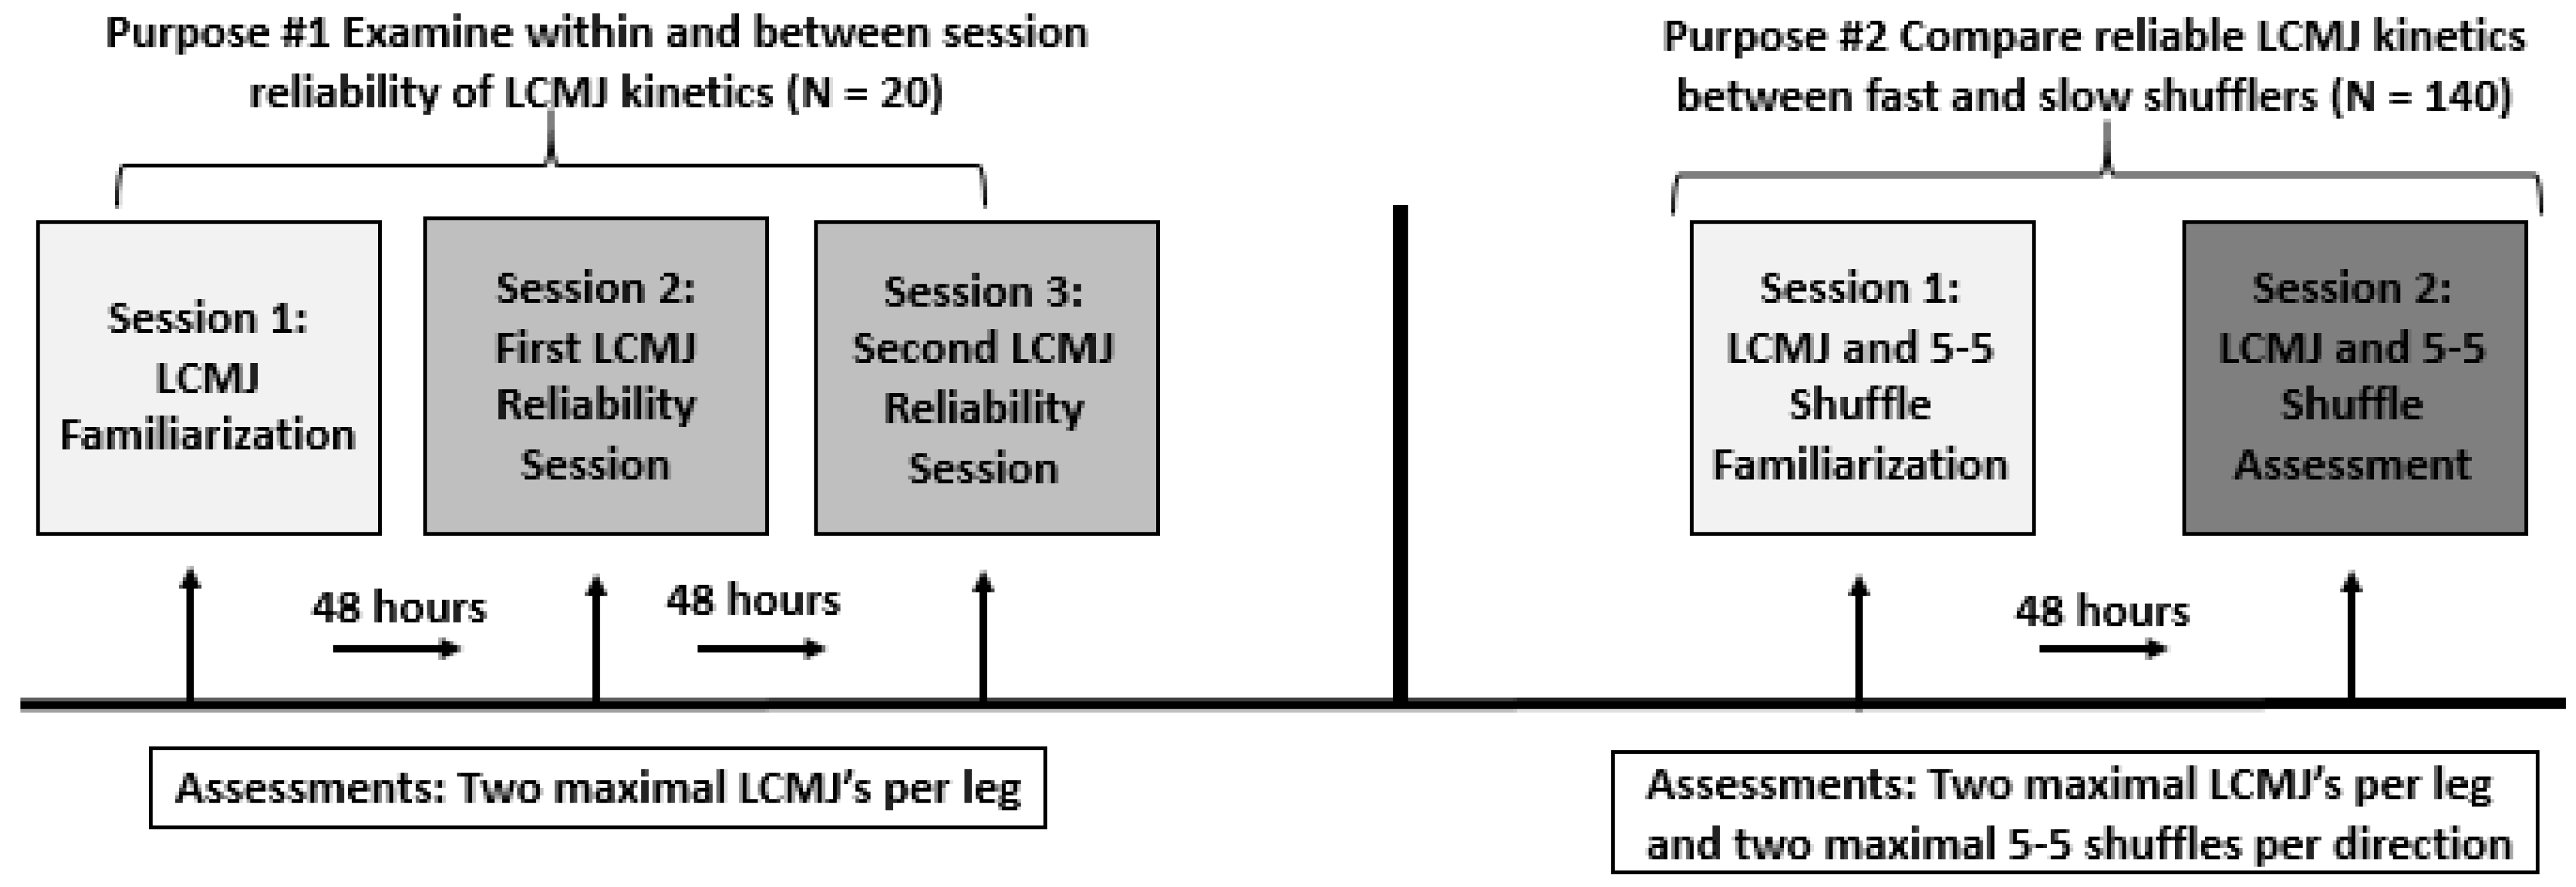
2.1. Experimental Approach to the Problem
2.2. Participants
2.3. Testing Procedures
2.4. Assessments
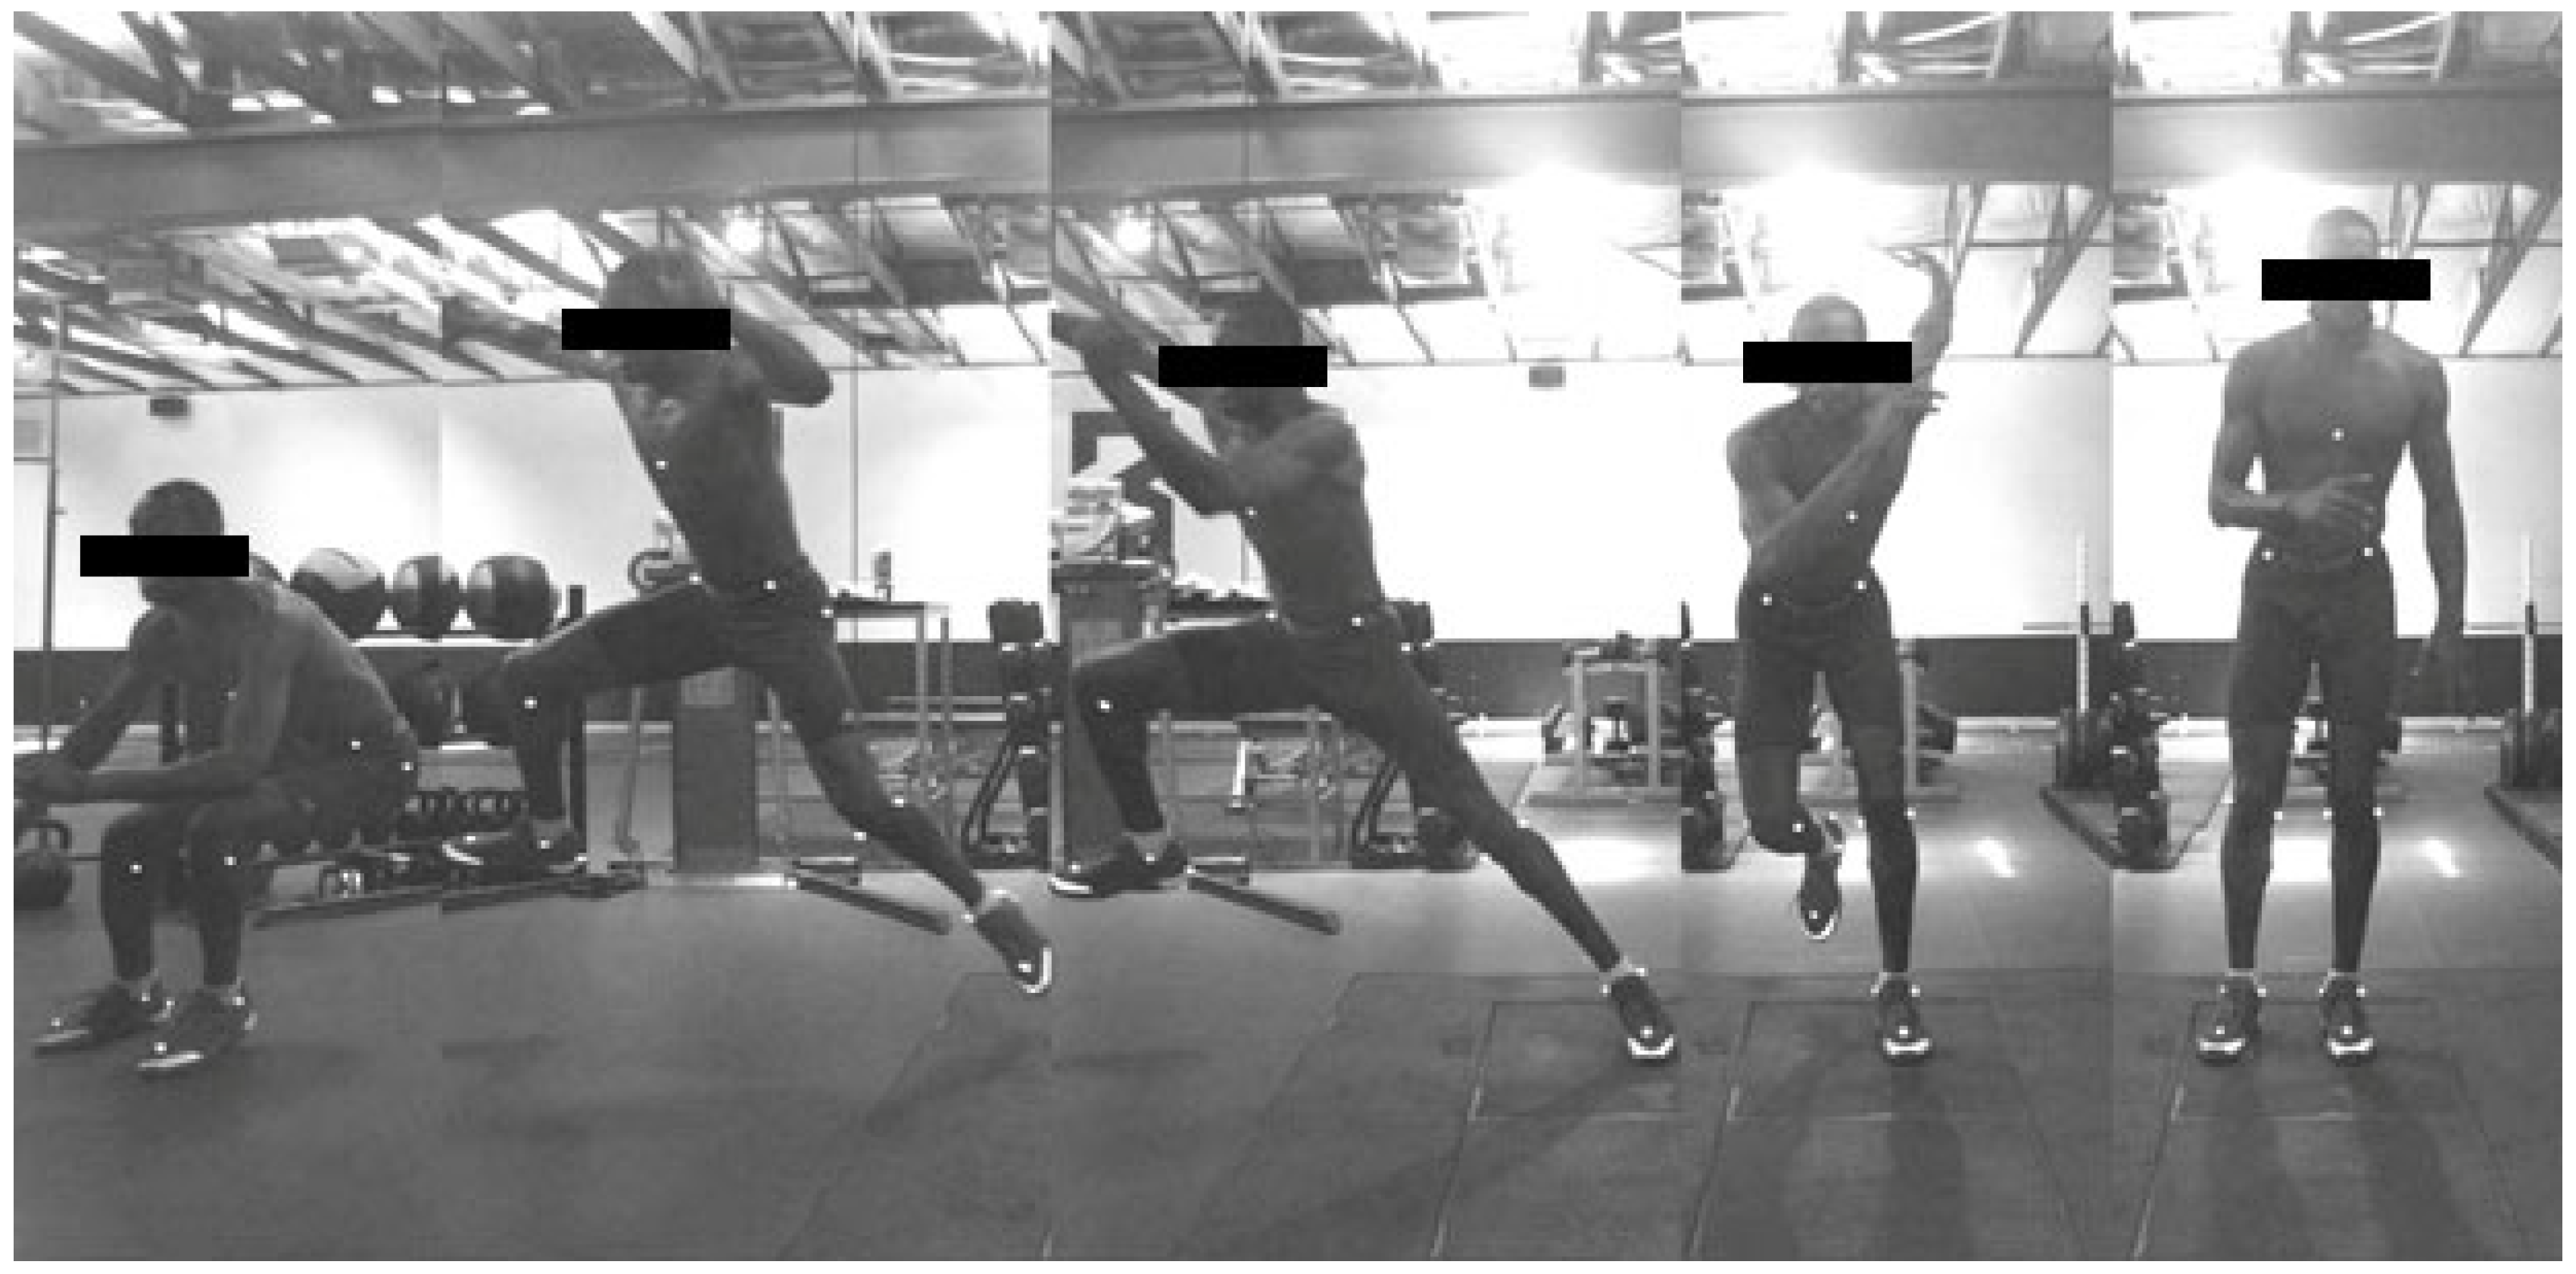
2.4.1. Lateral Countermovement Jump (LCMJ)
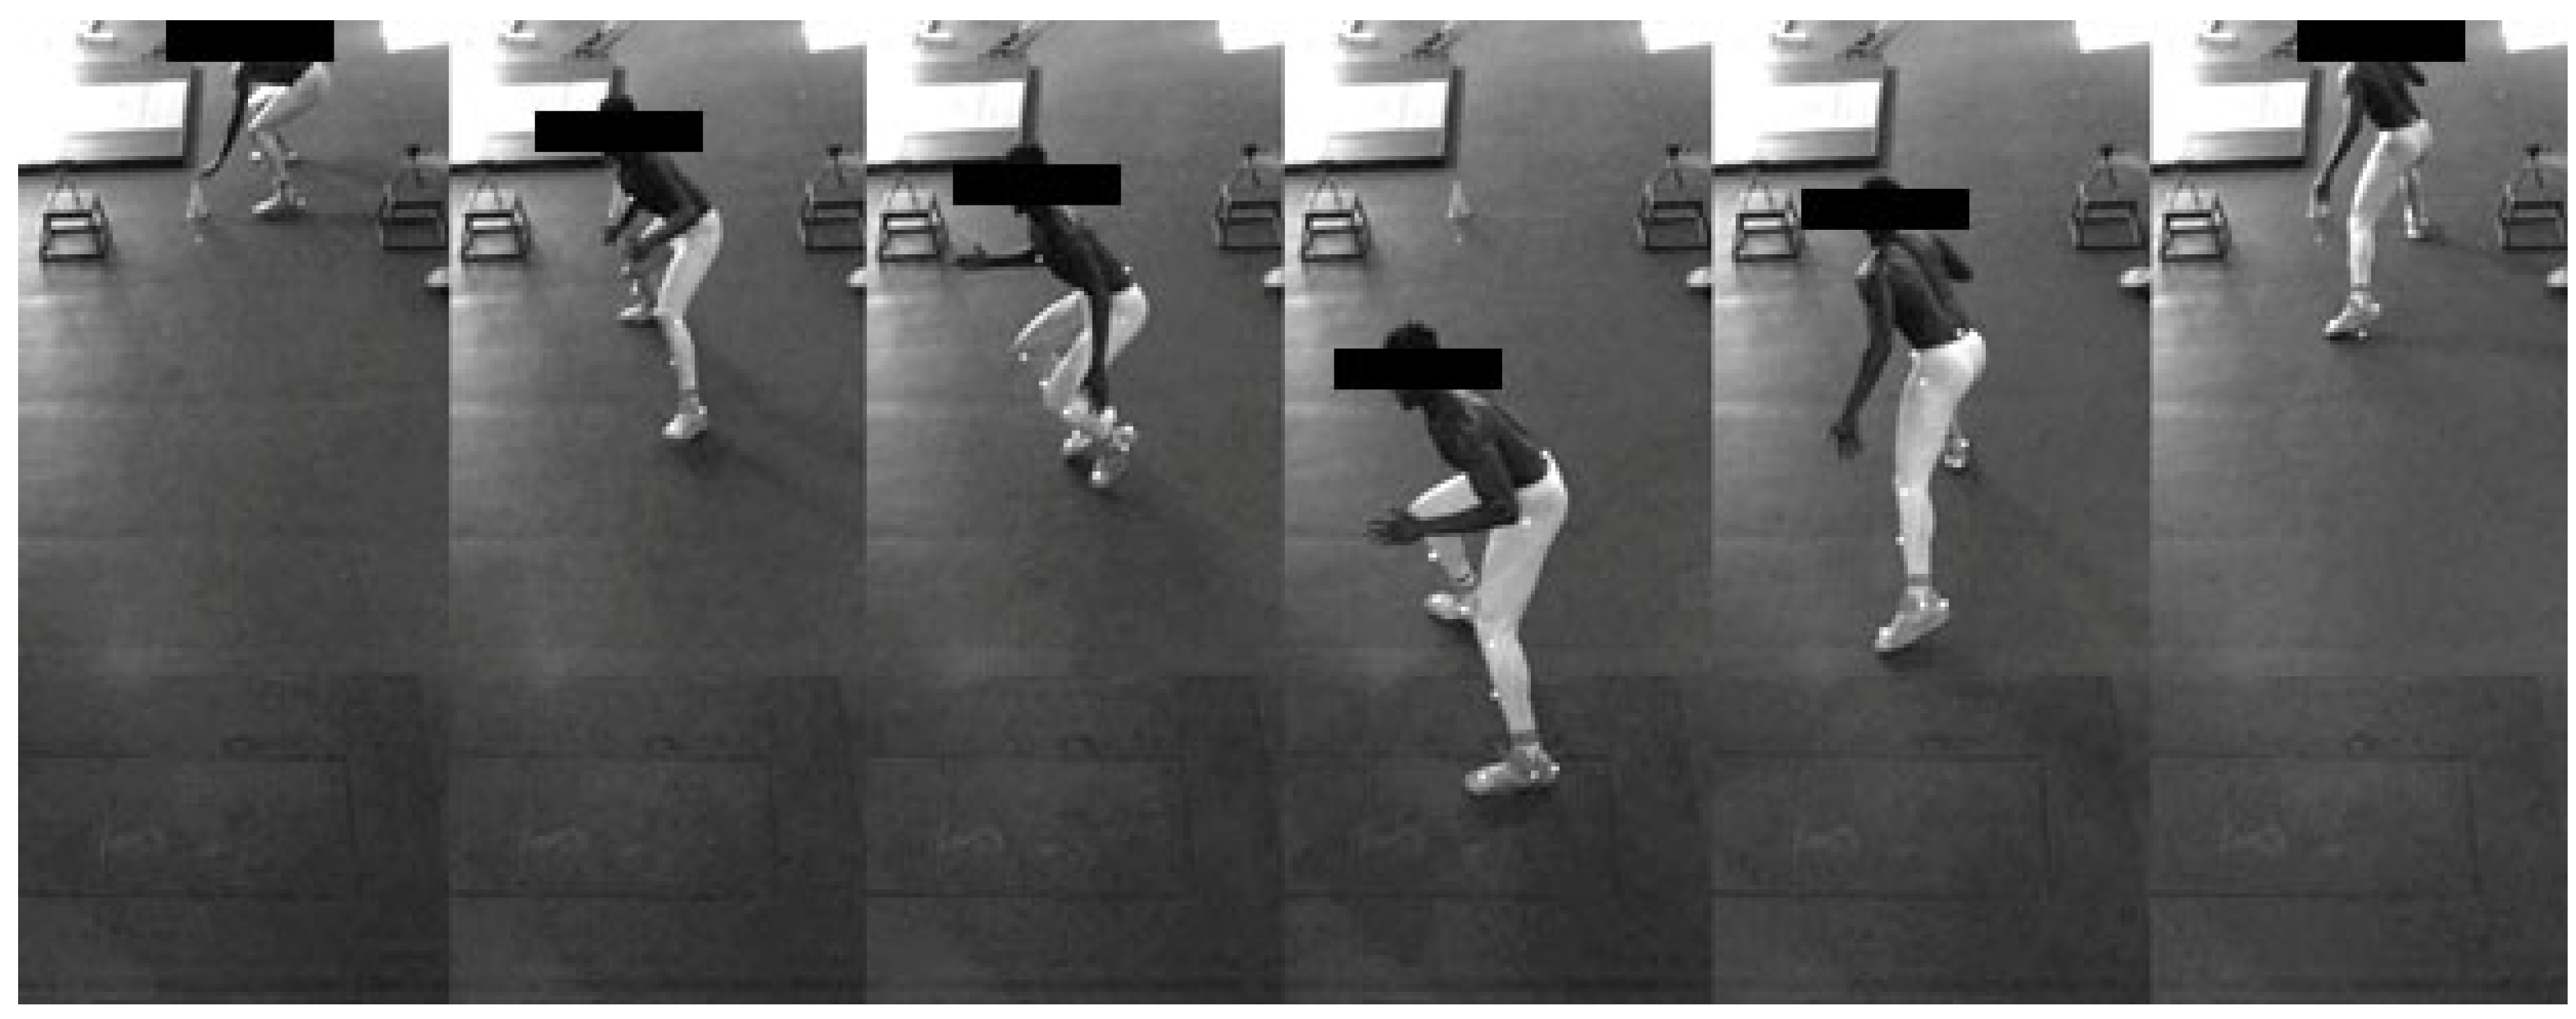
2.4.2. 5-5 Shuffle
2.5. Data Analysis
2.6. Statistical Analysis
3. Results
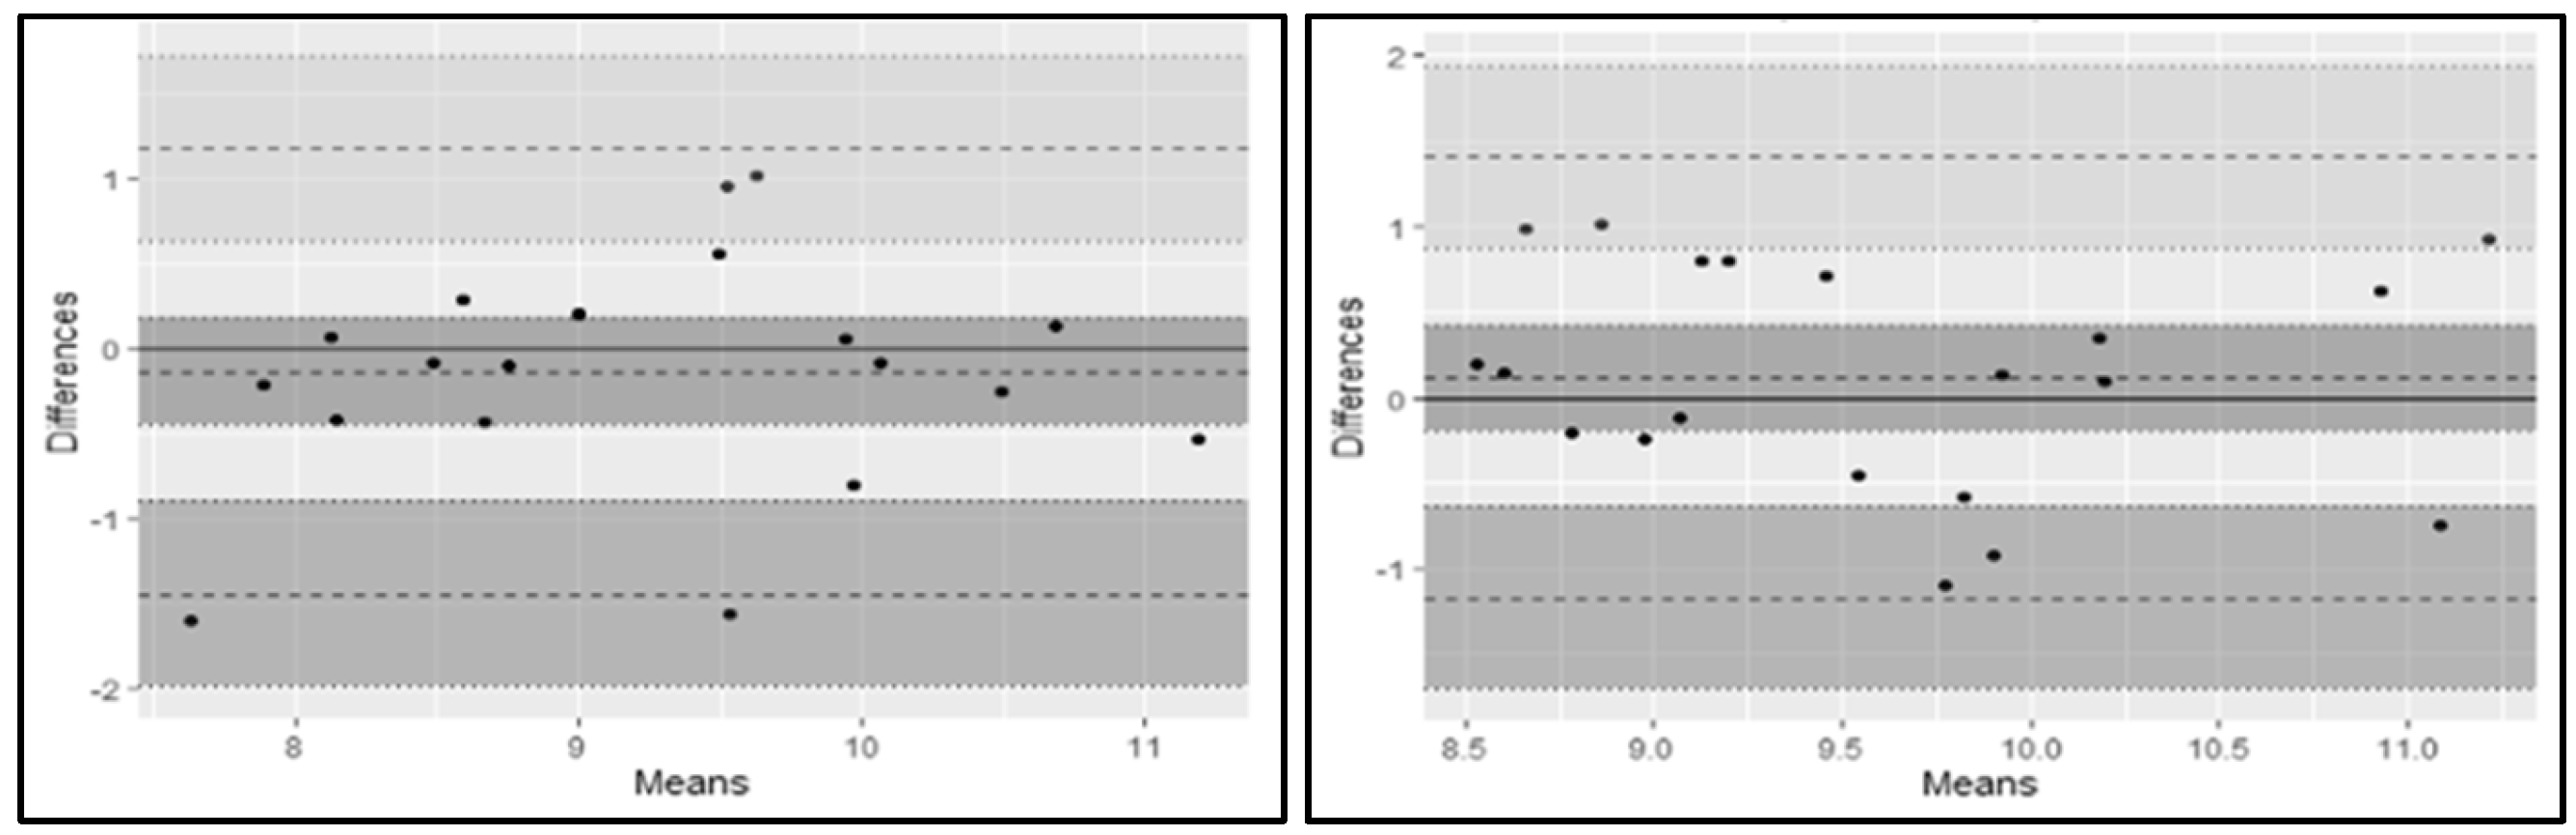
3.1. Reliability
3.2. Independent t-test Comparing Average Shuffling Performance between “Fast” and “Slow” Participants
3.3. Independent t-test Comparing Anthropometrics and LCMJ Kinetics between “Fast” and “Slow” Participants
4. Discussion
5. Conclusions
Author Contributions
Funding
Institutional Review Board Statement
Informed Consent Statement
Acknowledgments
Conflicts of Interest
References
- Petway, A.J.; Freitas, T.T.; Calleja-González, J.; Leal, D.M.; Alcaraz, P.E. Training Load and Match-Play Demands in Basketball Based on Competition Level: A Systematic Review. PLoS ONE 2020, 15, e0229212. [Google Scholar] [CrossRef] [PubMed]
- Ben Abdelkrim, N.; El Fazaa, S.; EL Ati, J.; Tabka, Z. Time-Motion Analysis and Physiological Data of Elite under-19-Year-Old Basketball Players during Competition. Br. J. Sports Med. 2007, 41, 69–75. [Google Scholar] [CrossRef] [PubMed]
- McInnes, S.E.; Carlson, J.S.; Jones, C.J.; McKenna, M.J. The Physiological Load Imposed on Basketball Players during Competition. J. Sports Sci. 1995, 13, 387–397. [Google Scholar] [CrossRef] [PubMed]
- Ziv, G.; Lidor, R. Vertical Jump in Female and Male Basketball Players-A Review of Observational and Experimental Studies. J. Sci. Med. Sport 2010, 13, 332–339. [Google Scholar] [CrossRef] [PubMed]
- Teramoto, M.; Cross, C.L.; Rieger, R.H.; Maak, T.G.; Willick, S.E. Predictive Validity of National Basketball Association Draft Combine on Future Performance. J. Strength Cond. Res. 2018, 32, 396–408. [Google Scholar] [CrossRef]
- Rauch, J.; Leidersdorf, E.; Reeves, T.; Borkan, L.; Elliott, M.; Ugrinowitsch, C. Different Movement Strategies in the Countermovement Jump amongst a Large Cohort of NBA Players. Int. J. Environ. Res. Public Health 2020, 17, 6394. [Google Scholar] [CrossRef]
- Harper, D.J.; Cohen, D.D.; Carling, C.; Kiely, J. Can Countermovement Jump Neuromuscular Performance Qualities Differentiate Maximal Horizontal Deceleration Ability in Team Sport Athletes? Sports 2020, 8, 76. [Google Scholar] [CrossRef]
- Shimokochi, Y.; Ide, D.; Kokubu, M.; Nakaoji, T. Relationships among Performance of Lateral Cutting Maneuver from Lateral Sliding and Hip Extension and Abduction Motions, Ground Reaction Force, and Body Center of Mass Height. J. Strength Cond. Res. 2013, 27, 1851–1860. [Google Scholar] [CrossRef]
- Meylan, C.M.P.; Nosaka, K.; Green, J.; Cronin, J.B. Temporal and Kinetic Analysis of Unilateral Jumping in the Vertical, Horizontal, and Lateral Directions. J. Sports Sci. 2010, 28, 545–554. [Google Scholar] [CrossRef]
- Donskov, A.S.; Brooks, J.S.; Dickey, J.P. Reliability of the Single-Leg, Medial Countermovement Jump in Youth Ice Hockey Players. Sports 2021, 9, 64. [Google Scholar] [CrossRef]
- Heishman, A.D.; Daub, B.D.; Miller, R.M.; Freitas, E.D.S.; Frantz, B.A.; Bemben, M.G. Countermovement Jump Reliability Performed with and without an Arm Swing in NCAA Division 1 Intercollegiate Basketball Players. J. Strength Cond. Res. 2020, 34, 546–558. [Google Scholar] [CrossRef] [PubMed]
- Scanlan, A.T.; Wen, N.; Pyne, D.B.; Stojanoví, E.; Milanoví, Z.; Conte, D.; Vaquera, A.; Dalbo, V.J. Power-Related Determinants of Modified Agility t-test Performance in Male Adolescent Basketball Players. J. Strength Cond. Res. 2021, 35, 2248–2254. [Google Scholar] [CrossRef] [PubMed]
- Armstrong, R.A. When to Use the Bonferroni Correction. Ophthalmic Physiol. Opt. 2014, 34, 502–508. [Google Scholar] [CrossRef] [PubMed]
- Cohen, J. Statistical Power Analysis for the Behavioral Sciences, 2nd ed.; Routledge: London, UK, 2013. [Google Scholar]
- Mclellan, C.P.; Lovell, D.I.; Gass, G.C. The Role of Rate of Force Development on Vertical Jump Performance. J. Strength Cond. Res. 2011, 25, 379–385. [Google Scholar] [CrossRef] [PubMed]
- Moir, G.L.; Garcia, A.; Dwyer, G.B. Intersession Reliability of Kinematic and Kinetic Variables during Vertical Jumps in Men and Women. Int. J. Sports Physiol. Perform. 2009, 4, 317–330. [Google Scholar] [CrossRef]
- Nimphius, S.; Callaghan, S.J.; Bezodis, N.E.; Lockie, R.G. Change of Direction and Agility Tests: Challenging Our Current Measures of Performance. Strength Cond. J. 2018, 40, 26–38. [Google Scholar] [CrossRef]
- Papla, M.; Perenc, D.; Zając, A.; Maszczyk, A.; Krzysztofik, M. Contribution of Strength, Speed and Power Characteristics to Change of Direction Performance in Male Basketball Players. Appl. Sci. 2022, 12, 8484. [Google Scholar] [CrossRef]
- Tricoli, V.; Lamas, L.; Carnevale, R.; Ugrinowitsch, C. Short-Term Effects on Lower-Body Functional Power Development: Weightlifting vs. Vertical Jump Training Programs. J. Strength Cond. Res. 2005, 19, 433–437. [Google Scholar] [CrossRef]
- Young, W.B.; James, R.; Montgomery, I. Is Muscle Power Related to Running Speed with Changes of Direction? J. Sport. Med. Phys. Fit. 2002, 42, 282–288. [Google Scholar]
- Sheppard, J.M.; Young, W.B. Agility Literature Review: Classifications, Training and Testing. J. Sports Sci. 2006, 24, 919–932. [Google Scholar] [CrossRef]
- Dos’Santos, T.; Thomas, C.; Jones, P.A.; Comfort, P. Mechanical Determinants of Faster Change of Direction Speed Performance in Male Athletes. J. Strength Cond. Res. 2017, 31, 696–705. [Google Scholar] [CrossRef]
- Bourgeois, F.A.; McGuigan, M.R.; Gill, N.D.; Gamble, P. Physical Characteristics and Performance in Change of Direction Tasks a Brief Review and Training Considerations. J. Aust. Strength Cond. 2017, 25, 104–117. [Google Scholar]


| Variables | Trial 1 | Trial 2 | Bias | Upper LOA | Lower LOA | CV | TE | ICC |
|---|---|---|---|---|---|---|---|---|
| Peak Vert F (Nz) | 1746.57 ± 198.21 | 1713.34± 1 95.57 | 33.24 | 198.74 | −132.26 | 2.72 | 59.71 | 0.90 |
| Rel Peak Vert F (Nz/kg) | 9.42 ± 1.90 | 9.23 ± 1.80 | 0.19 | 2.34 | −1.96 | 6.90 | 0.78 | 0.83 |
| Peak Lat F (Nx) | 829.24 ± 120.09 | 841.32 ± 110.96 | −12.09 | 111.71 | −135.88 | 3.72 | 44.66 | 0.85 |
| Rel Peak Lat F (Nx/Kg) | 9.17 ± 1.08 | 9.31 ± 0.98 | −0.13 | 1.18 | −1.45 | 3.72 | 0.47 | 0.79 |
| Rel Net F (Nz + Nx/kg) | 13.23 ± 1.57 | 13.16 ± 1.62 | 0.07 | 2.09 | −1.95 | 4.48 | 0.73 | 0.80 |
| Vert RFD (Nz/s) | 3746.91 ± 1393.65 | 3626.42 ± 1397.80 | 120.49 | 1536.62 | −1295.65 | 10.2 * | 510.90 | 0.87 |
| Lat RFD (Nx/s) | 1581.30 ± 404.77 | 1553.23 ± 386.94 | 28.08 | 618.77 | −562.61 | 9.12 | 213.10 | 0.72 |
| Lat IMP (N·s) | 241.85 ± 39.14 | 248.88 ± 43.36 | −7.04 | 19.64 | −33.72 | 3.47 | 9.63 | 0.88 |
| RelLatImp (N·s/kg−1) | 2.67 ± 0.32 | 2.74 ± 0.37 | −0.08 | 0.23 | −0.38 | 3.47 | 0.11 | 0.88 |
| TMT (s) | 0.66 ± 0.15 | 0.68 ± 0.14 | −0.02 | 0.19 | −0.23 | 7.29 | 0.08 | 0.72 |
| Variables | Trial 1 | Trial 2 | Bias | Upper LOA | Lower LOA | CV | TE | ICC |
|---|---|---|---|---|---|---|---|---|
| Peak Vert F (Nz) | 1750.92 ± 192.54 | 1775.00 ± 236.67 | −24.08 | 260.18 | −308.35 | 4.79 | 102.55 | 0.78 |
| Rel Vert F (Nz/kg) | 9.57 ± 2.13 | 9.57 ± 1.77 | 0.00 | 3.07 | −3.06 | 10.05 * | 1.10 | 0.70 |
| Peak Lat F (Nx) | 876.34 ± 107.77 | 872.12 ± 113.08 | 4.22 | 127.25 | −118.80 | 4.46 | 44.38 | 0.85 |
| Rel Lat F (Nx/Kg) | 9.62 ± 0.86 | 9.58 ± 0.98 | 0.13 | 1.49 | −1.23 | 4.46 | 0.49 | 0.72 |
| Rel Net F (Nz + Nx/kg) | 13.68 ± 1.73 | 13.58 ± 1.40 | 0.10 | 2.72 | −2.51 | 5.44 | 0.94 | 0.66 * |
| Vert RFD (Nz/s) | 3296.12 ± 924.91 | 3611.39 ± 1376.28 | −315.27 | 3062.57 | −3693.11 | 27.01 * | 1218.62 | 0.08 * |
| Lat RFD (Nx/s) | 1496.43 ± 331.59 | 1575.35 ± 400.40 | −78.93 | 1110.32 | −1268.18 | 22.09 * | 429.04 | −0.34 * |
| Lat IMP (N·s) | 256.70 ± 47.18 | 254.42 ± 40.92 | 2.28 | 60.33 | −55.76 | 6.92 | 20.94 | 0.79 |
| RelLatImp (N·s/kg−1) | 2.81 ± 0.29 | 2.78 ± 0.38 | 0.03 | 0.66 | −0.59 | 6.78 | 0.23 | 0.58 * |
| TMT (s) | 0.72 ± 0.17 | 0.69 ± 0.14 | 0.04 | 0.53 | −0.46 | 19.64 * | 0.18 | −0.24 * |
| Variables | Fast N = 70 | Slow N = 70 | % Diff | ES | p-Value |
|---|---|---|---|---|---|
| AVG 5-5 Shuffle (s) | 2.67 ± 0.07 | 2.87 ± 0.08 | 7.22% | 2.67 | 0.0000 * |
| BM (kg) | 96.07 ± 11.03 | 100.72 ± 12.39 | 4.73% | 0.39 | 0.0217 |
| Height (cm) | 198.84 ± 7.85 | 201.71 ± 7.89 | 1.43% | 0.37 | 0.0325 |
| Peak Vert N (Nz) | 1792.2 ± 249.1 | 1807.3 ± 255.2 | 0.83% | 0.06 | 0.7240 |
| Peak Lat N (Nx) | 909.4 ± 107.7 | 903.1 ± 112.1 | 0.65% | 0.06 | 0.7363 |
| Rel Lat N (Nx/kg) | 9.51 ± 0.8 | 8.93 ± 0.87 | 6.29% | 0.70 | 0.0000 * |
| Lat Imp (N·s) | 252.20 ± 39.21 | 257.76 ± 38.16 | 2.18% | 0.24 | 0.3979 |
Publisher’s Note: MDPI stays neutral with regard to jurisdictional claims in published maps and institutional affiliations. |
© 2022 by the authors. Licensee MDPI, Basel, Switzerland. This article is an open access article distributed under the terms and conditions of the Creative Commons Attribution (CC BY) license (https://creativecommons.org/licenses/by/4.0/).
Share and Cite
Leidersdorf, E.; Rauch, J.; Reeves, T.; Borkan, L.; Francis, J.; Storey, L.; Souza, E.O.D.; Elliott, M.; Ugrinowitsch, C. Reliability and Effectiveness of a Lateral Countermovement Jump for Stratifying Shuffling Performance Amongst Elite Basketball Players. Sports 2022, 10, 186. https://doi.org/10.3390/sports10110186
Leidersdorf E, Rauch J, Reeves T, Borkan L, Francis J, Storey L, Souza EOD, Elliott M, Ugrinowitsch C. Reliability and Effectiveness of a Lateral Countermovement Jump for Stratifying Shuffling Performance Amongst Elite Basketball Players. Sports. 2022; 10(11):186. https://doi.org/10.3390/sports10110186
Chicago/Turabian StyleLeidersdorf, Eric, Jacob Rauch, Trent Reeves, Leah Borkan, Javan Francis, Luke Storey, Eduardo Oliveira De Souza, Marcus Elliott, and Carlos Ugrinowitsch. 2022. "Reliability and Effectiveness of a Lateral Countermovement Jump for Stratifying Shuffling Performance Amongst Elite Basketball Players" Sports 10, no. 11: 186. https://doi.org/10.3390/sports10110186
APA StyleLeidersdorf, E., Rauch, J., Reeves, T., Borkan, L., Francis, J., Storey, L., Souza, E. O. D., Elliott, M., & Ugrinowitsch, C. (2022). Reliability and Effectiveness of a Lateral Countermovement Jump for Stratifying Shuffling Performance Amongst Elite Basketball Players. Sports, 10(11), 186. https://doi.org/10.3390/sports10110186