
Predictive Analytic Techniques to Identify Hidden Relationships between Training Load, Fatigue and Muscle Strains in Young Soccer Players


Abstract
: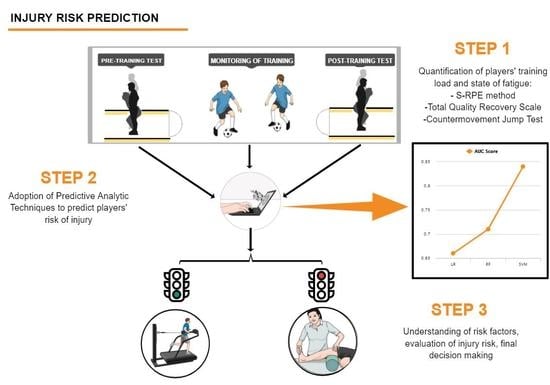
1. Introduction
2. Materials and Methods
2.1. Participants
2.2. Injuries Data Collection
2.3. Anthropometric Data, Maturity Status and Maturity Timing Estimation
2.3.1. Anthropometric Data
2.3.2. Peak Height Velocity (PHV)
2.3.3. Skeletal Maturity
2.4. Internal Load Markers and State of Recovery
2.5. Neuromuscular Fatigue
3. Statistical Analysis
3.1. Injury Incidence
3.2. Intrasession CMJ Reliability
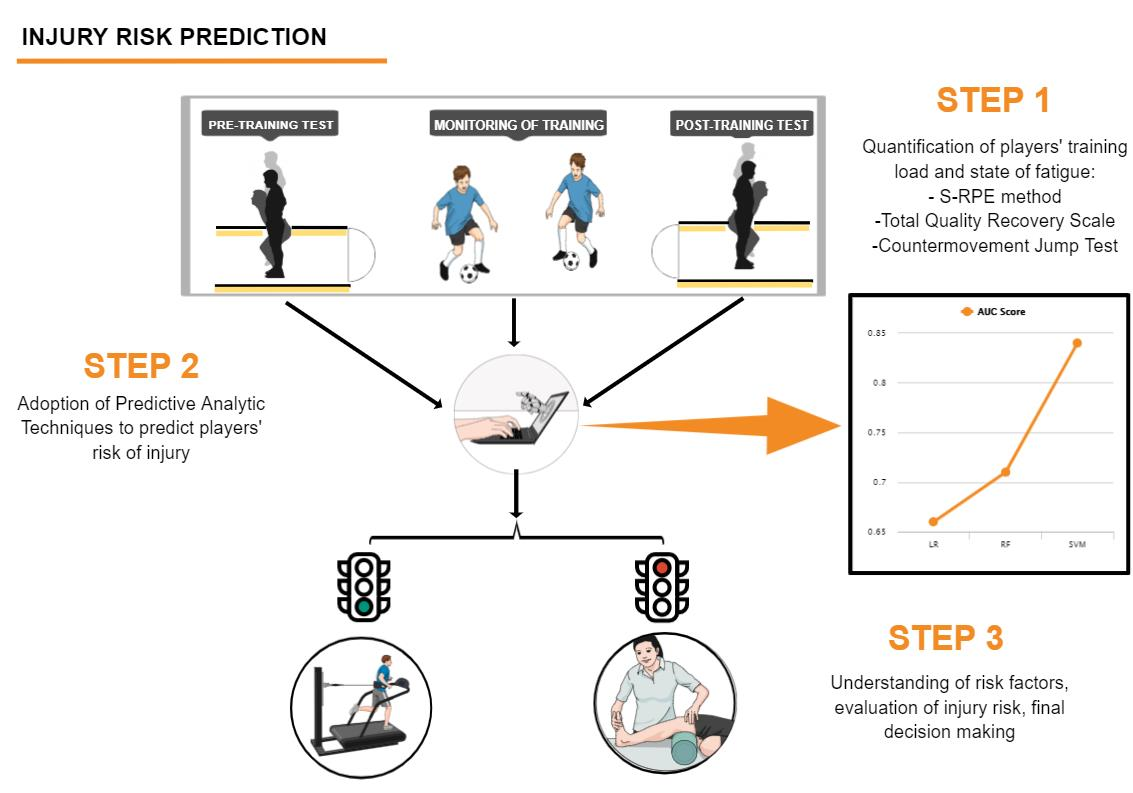
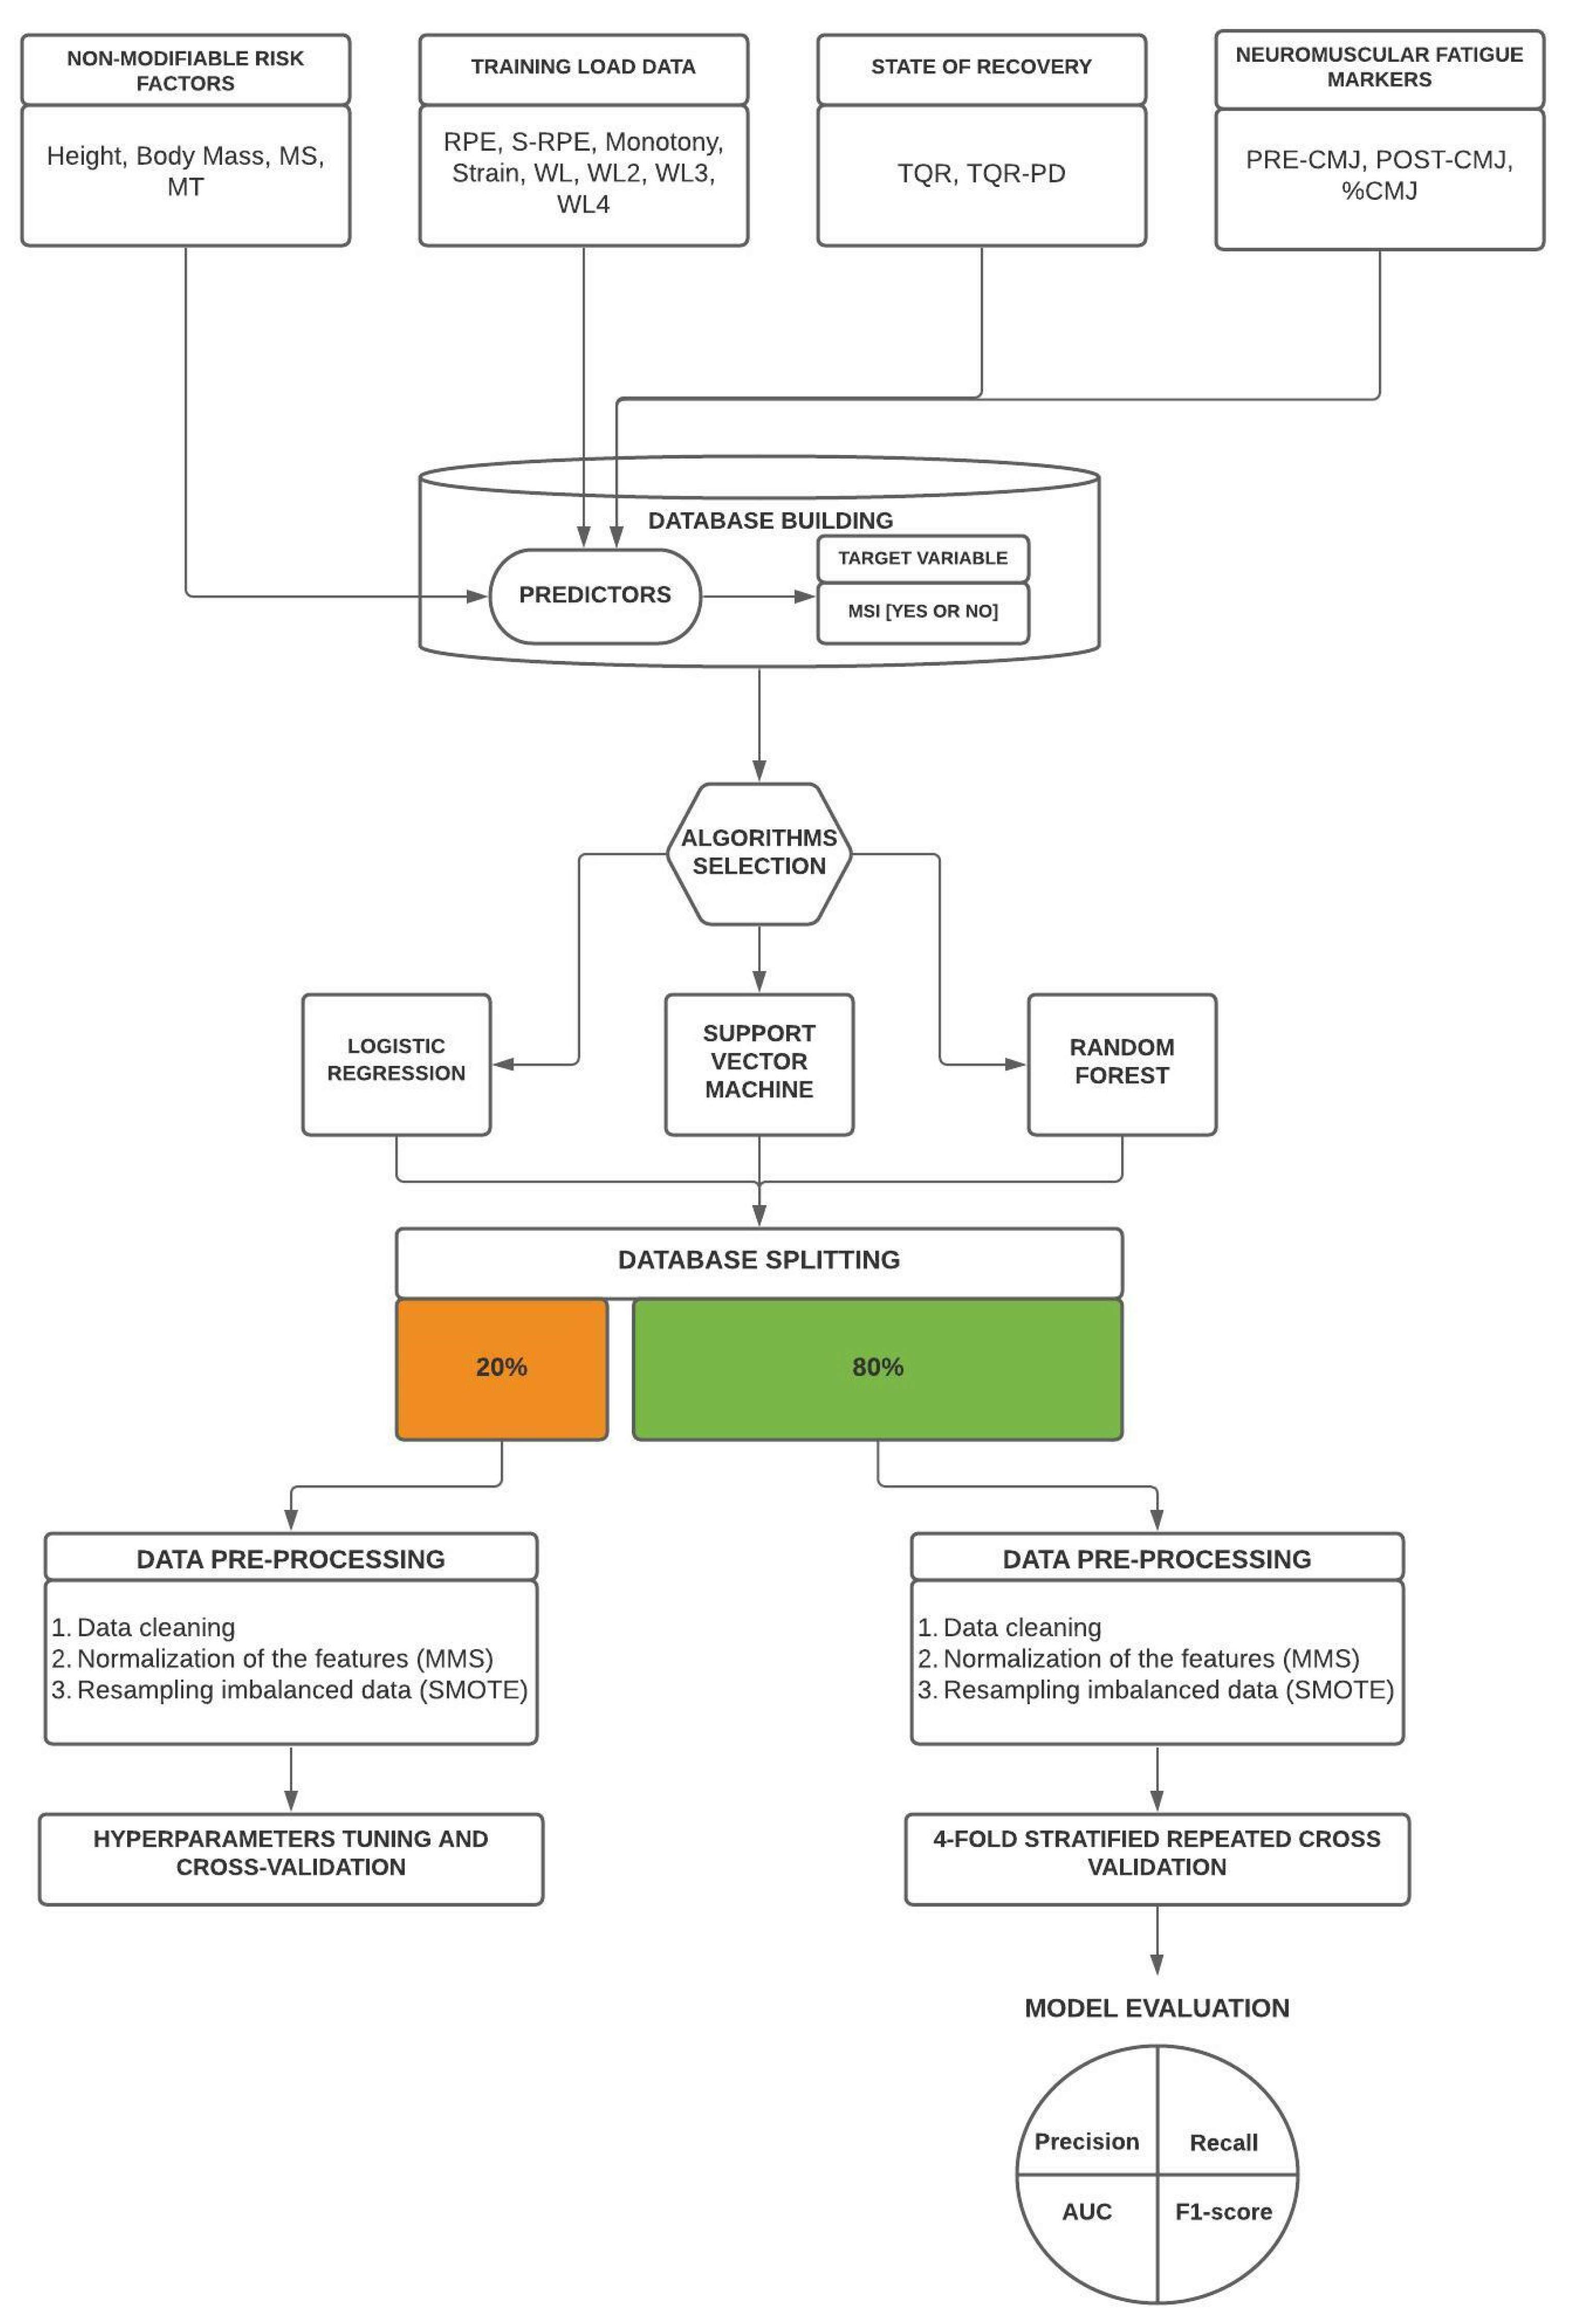
3.3. Predictive Analytics Setting
3.4. Algorithms Selection
- Logistic Regression (LR).
- Random Forest (RF).
- Support vector machine (SVM).
3.5. Hyperparameters Tuning and Cross-Validation
3.6. Data Pre-Processing
3.7. Model Evaluation
4. Results
4.1. MSI Incidence
4.2. Intrasession CMJ Reliability
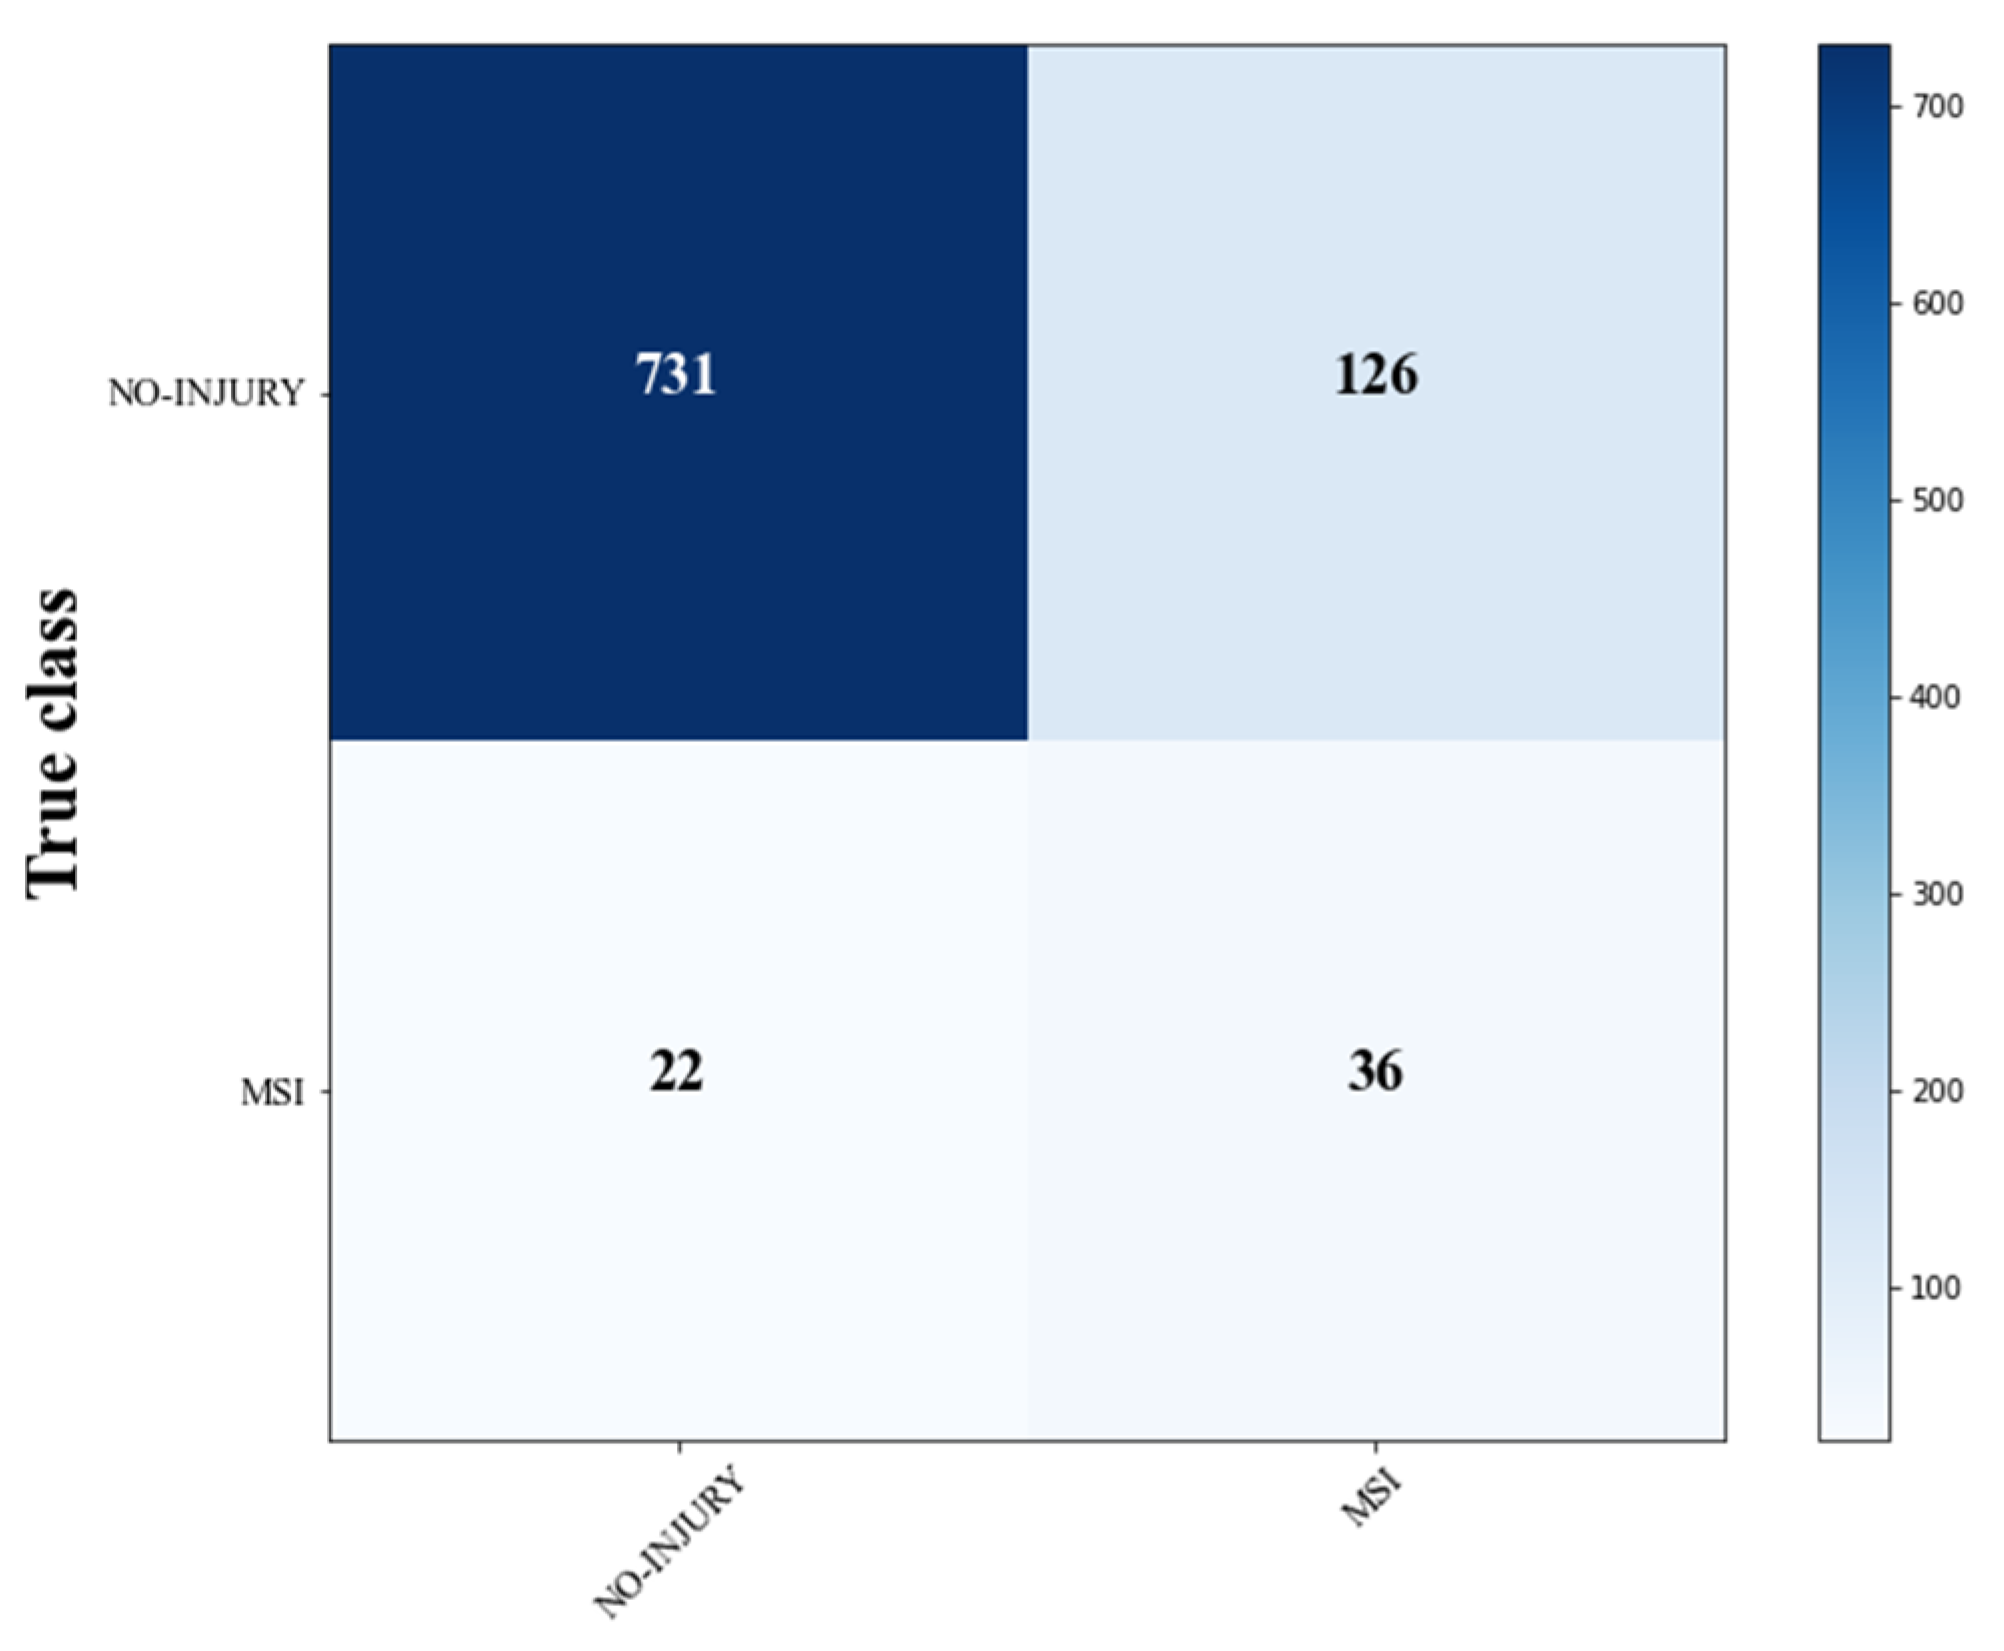
4.3. Predictive Analytics Models for MSI
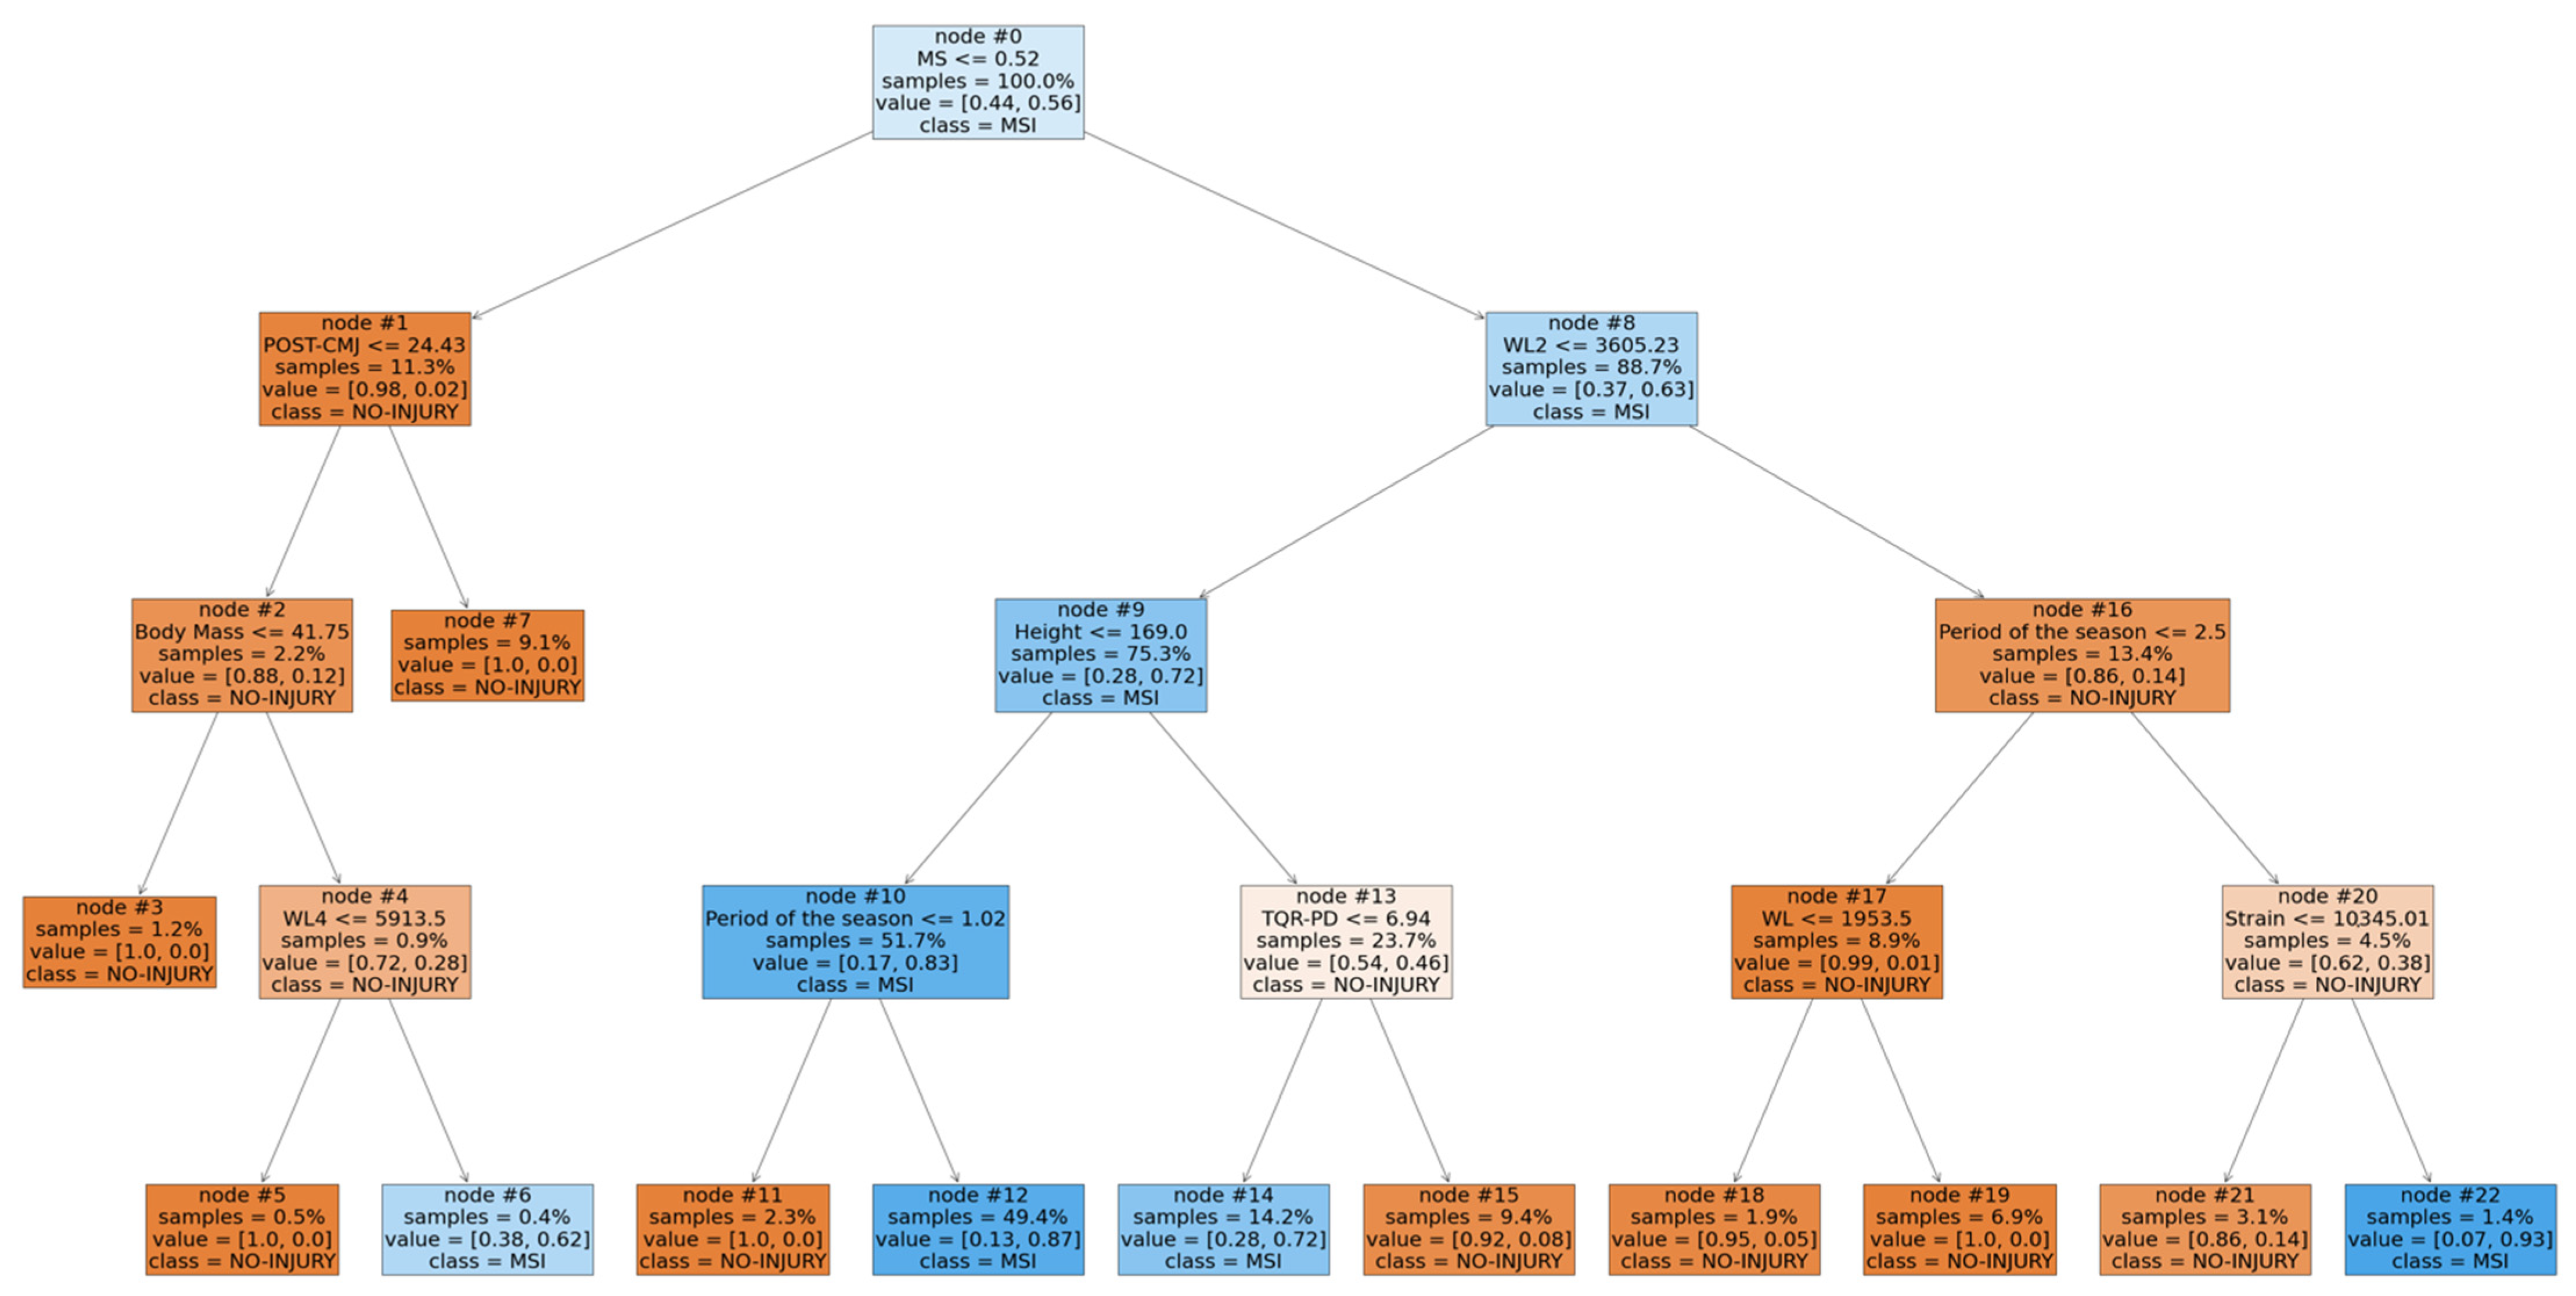
4.4. Interpretation of the SVM-Lag Model
- POST-CMJ (≤24.43 cm, node 1) combined with a high body mass (>41.75 kg, node 2) and a high WL4 (>5913.5 AU, node 4).
- A low WL2 (≤3605.23 AU, node 8) combined with a high height (>169 cm, node 9) and a low recovery status (TQR-PD ≤6.94 AU, node 13).
- A low WL2 (≤3605.23 AU, node 8) combined with a low height (≤169 cm, node 9) during the second and third part of the season (node 10).
- A high WL2 (>3605.23 AU, node 8) during the third part of the season (node 16) and combined with a high strain (>10,345.01 AU, node 20).
5. Discussion
- Risk of injury could change according to the maturity status of the players.
- Monitoring CMJ before and after training could be a useful tool to identify a greater state of fatigue and, therefore, a higher predisposition to injury.
- The susceptibility to injury could be modified by anthropometric factors (body mass and height).
- A high workload and a low players’ recovery status could increase predisposition to muscle injuries.
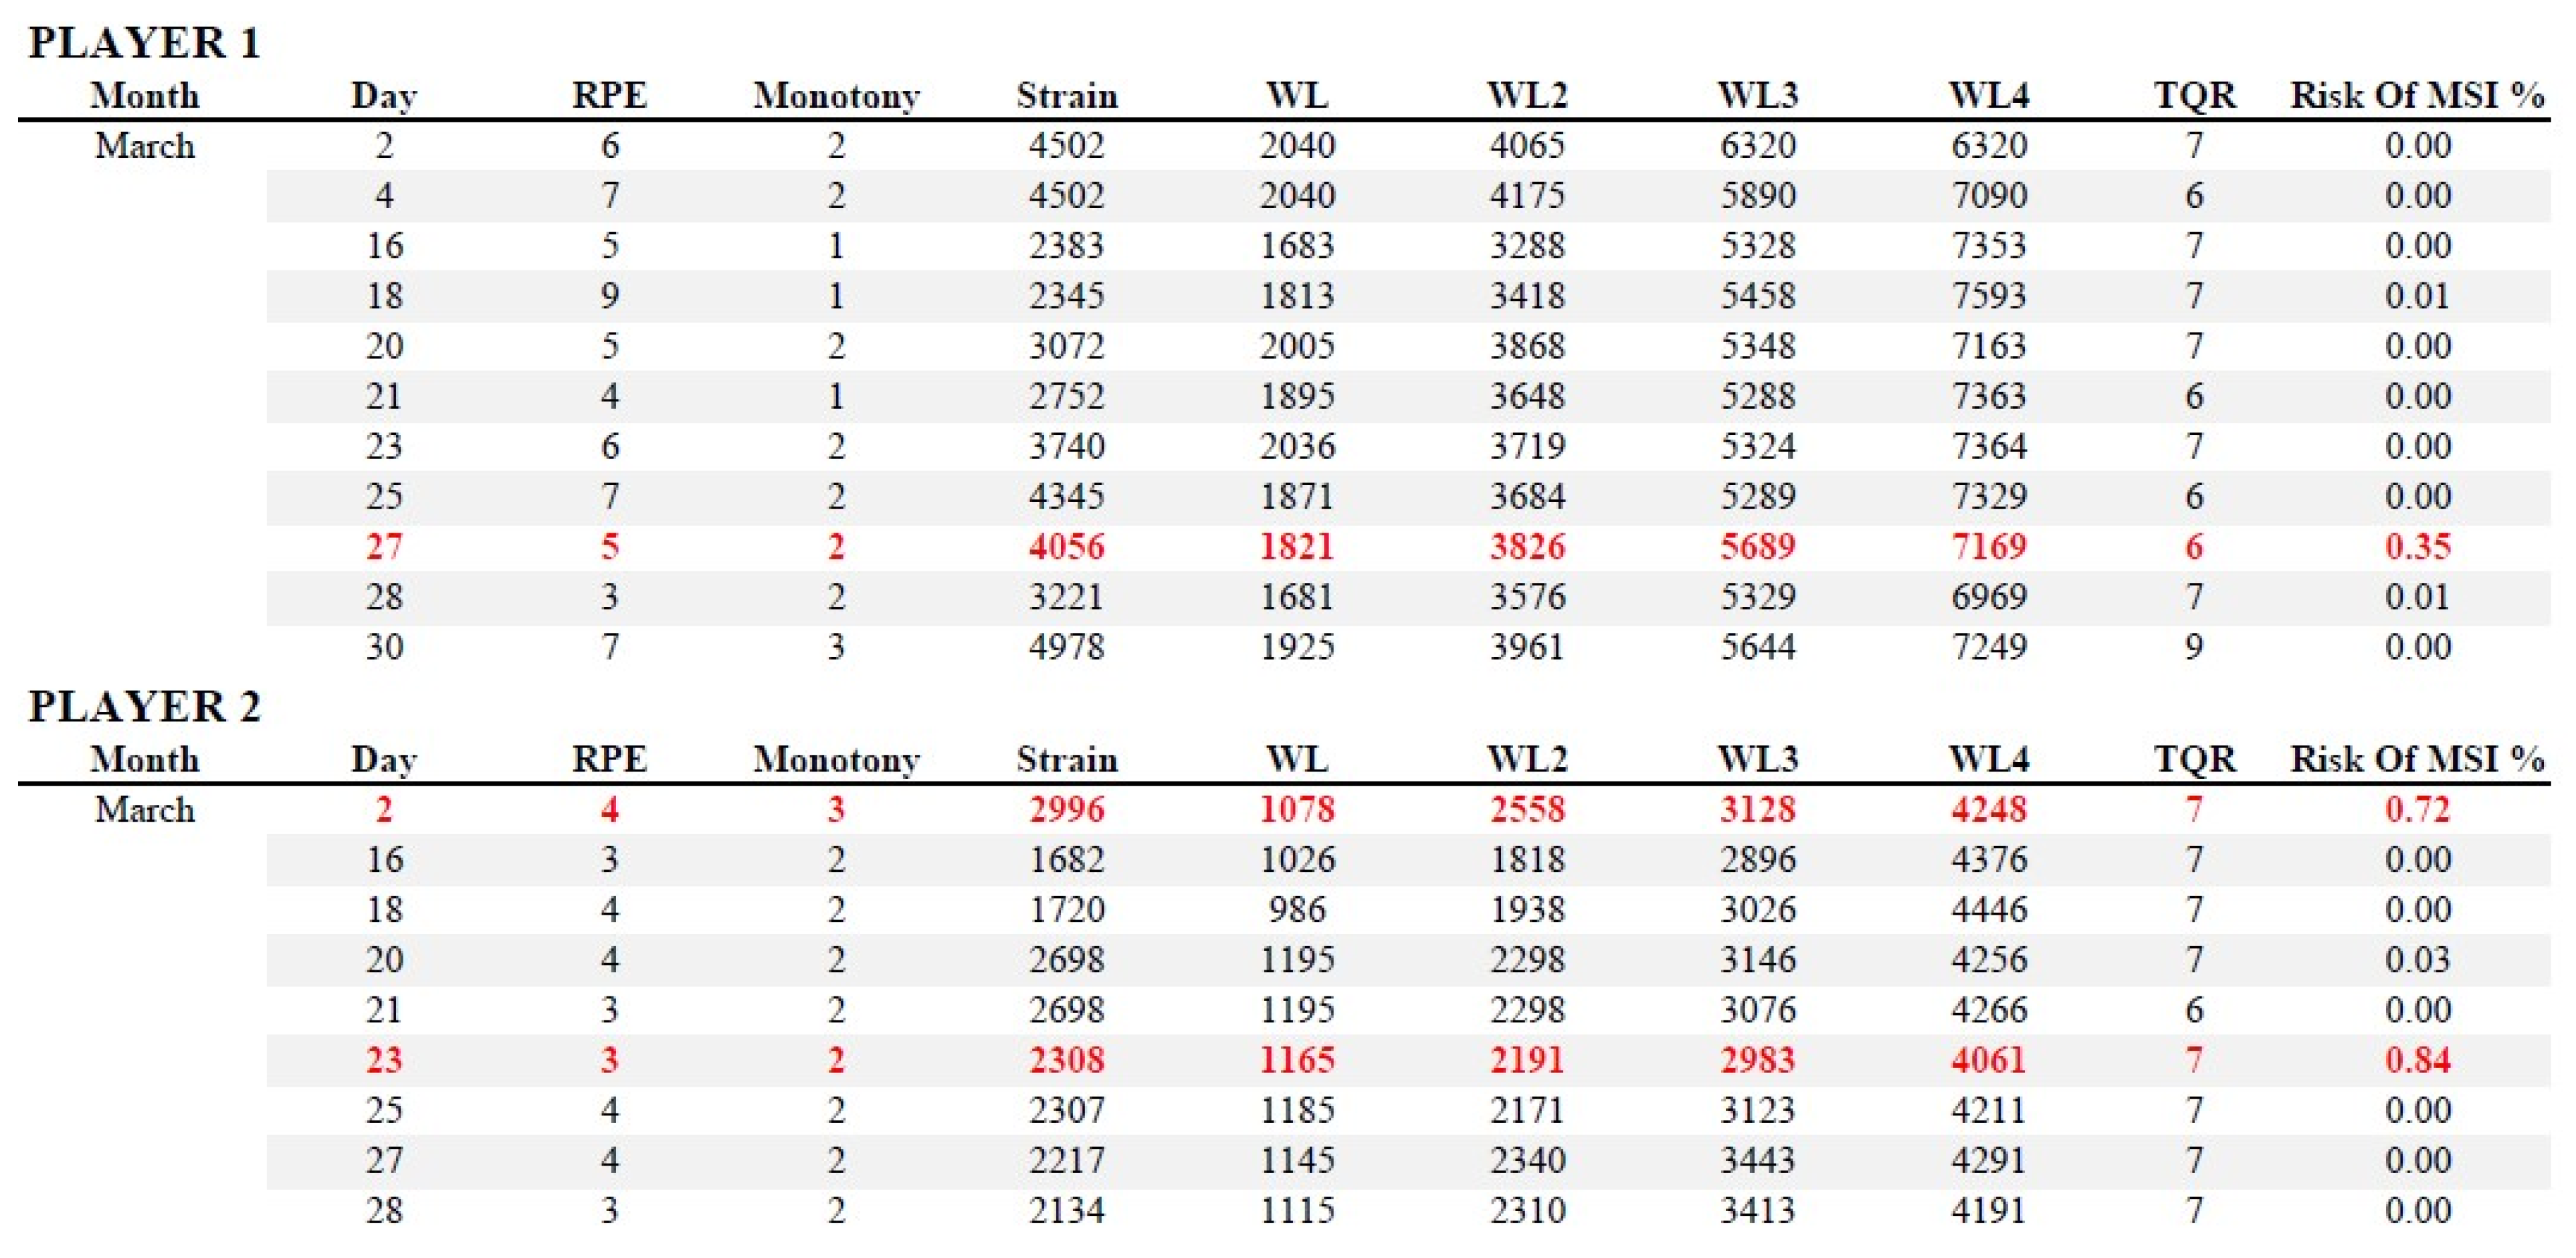
6. Practical Applications
7. Conclusions
Author Contributions
Funding
Institutional Review Board Statement
Informed Consent Statement
Data Availability Statement
Acknowledgments
Conflicts of Interest
References
- Read, P.J.; Oliver, J.L.; De Ste Croix, M.B.; Myer, G.D.; Lloyd, R.S. An Audit of Injuries in Six English Professional Soccer Academies. J. Sports Sci. 2018, 36, 1542–1548. [Google Scholar] [CrossRef]
- Renshaw, A.; Goodwin, P.C. Injury Incidence in a Premier League Youth Soccer Academy Using the Consensus Statement: A Prospective Cohort Study. BMJ Open Sport Exerc. Med. 2016, 2, e000132. [Google Scholar] [CrossRef] [Green Version]
- Marshall, D.A.; Lopatina, E.; Lacny, S.; Emery, C.A. Economic Impact Study: Neuromuscular Training Reduces the Burden of Injuries and Costs Compared to Standard Warm-up in Youth Soccer. Br. J. Sports Med. 2016, 50, 1388–1393. [Google Scholar] [CrossRef] [PubMed]
- Timpka, T.; Risto, O.; Björmsjö, M. Boys Soccer League Injuries: A Community-Based Study of Time-Loss from Sports Participation and Long-Term Sequelae. Eur. J. Public Health 2008, 18, 19–24. [Google Scholar] [CrossRef] [Green Version]
- Kucera, K.L.; Marshall, S.W.; Kirkendall, D.T.; Marchak, P.M.; Garrett, W.E. Injury History as a Risk Factor for Incident Injury in Youth Soccer. Br. J. Sports Med. 2005, 39, 462. [Google Scholar] [CrossRef] [Green Version]
- Enoka, R.M.; Duchateau, J. Muscle Fatigue: What, Why and How It Influences Muscle Function. J. Physiol. 2008, 586, 11–23. [Google Scholar] [CrossRef]
- Raya-González, J.; Suárez-Arrones, L.; Navandar, A.; Balsalobre-Fernández, C.; de Villarreal, E.S. Injury Profile of Elite Male Young Soccer Players in a Spanish Professional Soccer Club: A Prospective Study during 4 Consecutive Seasons. J. Sport Rehabil. 2019, 29, 801–807. [Google Scholar] [CrossRef] [PubMed]
- Raya-González, J.; de Ste Croix, M.; Read, P.; Castillo, D. A Longitudinal Investigation of Muscle Injuries in an Elite Spanish Male Academy Soccer Club: A Hamstring Injuries Approach. Appl. Sci. 2020, 10, 1610. [Google Scholar] [CrossRef] [Green Version]
- Mandorino, M.; Figueiredo, A.J.; Gjaka, M.; Tessitore, A. Injury Incidence and Risk Factors in Youth Soccer Players: A Systematic Literature Review. Part II: Intrinsic and Extrinsic Risk Factors. Biol. Sport 2022, 39. in press. [Google Scholar]
- Lehnert, M.; De Ste Croix, M.; Zaatar, A.; Hughes, J.; Varekova, R.; Lastovicka, O. Muscular and Neuromuscular Control Following Soccer-specific Exercise in Male Youth: Changes in Injury Risk Mechanisms. Scand. J. Med. Sci. Sports 2017, 27, 975–982. [Google Scholar] [CrossRef]
- Mair, S.D.; Seaber, A.V.; Glisson, R.R.; Garrett JR, W.E. The Role of Fatigue in Susceptibility to Acute Muscle Strain Injury. Am. J. Sports Med. 1996, 24, 137–143. [Google Scholar] [CrossRef]
- Halson, S.L. Monitoring Training Load to Understand Fatigue in Athletes. Sports Med. 2014, 44, 139–147. [Google Scholar] [CrossRef] [PubMed] [Green Version]
- Foster, C.; Florhaug, J.A.; Franklin, J.; Gottschall, L.; Hrovatin, L.A.; Parker, S.; Doleshal, P.; Dodge, C. A New Approach to Monitoring Exercise Training. J. Strength Cond. Res. 2001, 15, 109–115. [Google Scholar] [PubMed]
- Impellizzeri, F.M.; Rampinini, E.; Coutts, A.J.; Sassi, A.; Marcora, S.M. Use of RPE-Based Training Load in Soccer. Med. Sci. Sports Exerc. 2004, 36, 1042–1047. [Google Scholar] [CrossRef]
- Twist, C.; Highton, J. Monitoring Fatigue and Recovery in Rugby League Players. Int. J. Sports Physiol. Perform. 2013, 8, 467–474. [Google Scholar] [CrossRef] [PubMed] [Green Version]
- Jones, C.M.; Griffiths, P.C.; Mellalieu, S.D. Training Load and Fatigue Marker Associations with Injury and Illness: A Systematic Review of Longitudinal Studies. Sports Med. 2017, 47, 943–974. [Google Scholar] [CrossRef] [PubMed] [Green Version]
- Montella, A.; de Oña, R.; Mauriello, F.; Riccardi, M.R.; Silvestro, G. A Data Mining Approach to Investigate Patterns of Powered Two-Wheeler Crashes in Spain. Accid. Anal. Prev. 2020, 134, 105251. [Google Scholar] [CrossRef] [PubMed]
- Bahr, R.; Holme, I. Risk Factors for Sports Injuries—A Methodological Approach. Br. J. Sports Med. 2003, 37, 384–392. [Google Scholar] [CrossRef]
- Mandorino, M.; Figueiredo, A.J.; Cima, G.; Tessitore, A. A Data Mining Approach to Predict Non-Contact Injuries in Young Soccer Players. Int. J. Comput. Sci. Sport 2021, 20, 147–163. [Google Scholar] [CrossRef]
- Carey, D.L.; Ong, K.; Whiteley, R.; Crossley, K.M.; Crow, J.; Morris, M.E. Predictive Modelling of Training Loads and Injury in Australian Football. Int. J. Comput. Sci. Sport 2018, 17, 49–66. [Google Scholar] [CrossRef] [Green Version]
- Ayala, F.; López-Valenciano, A.; Jose, A.; De Ste Croix, M.B.; Vera-García, F.; García-Vaquero, M.; Ruiz-Pérez, I.; Myer, G. A Preventive Model for Hamstring Injuries in Professional Soccer: Learning Algorithms. Int. J. Sports Med. 2019, 40, 344–353. [Google Scholar] [CrossRef]
- Rossi, A.; Pappalardo, L.; Cintia, P.; Iaia, F.M.; Fernández, J.; Medina, D. Effective Injury Forecasting in Soccer with GPS Training Data and Machine Learning. PLoS ONE 2018, 13, e0201264. [Google Scholar] [CrossRef] [Green Version]
- Vallance, E.; Sutton-Charani, N.; Imoussaten, A.; Montmain, J.; Perrey, S. Combining Internal-and External-Training-Loads to Predict Non-Contact Injuries in Soccer. Appl. Sci. 2020, 10, 5261. [Google Scholar] [CrossRef]
- Rommers, N.; Rössler, R.; Verhagen, E.; Vandecasteele, F.; Verstockt, S.; Vaeyens, R.; Lenoir, M.; D’Hondt, E.; Witvrouw, E. A Machine Learning Approach to Assess Injury Risk in Elite Youth Football Players. Med. Sci. Sports Exerc. 2020, 52, 1745–1751. [Google Scholar] [CrossRef]
- Towlson, C.; Salter, J.; Ade, J.D.; Enright, K.; Harper, L.D.; Page, R.M.; Malone, J.J. Maturity-Associated Considerations for Training Load, Injury Risk, and Physical Performance within Youth Soccer: One Size Does Not Fit All. J. Sport Health Sci. 2020, 10, 403–412. [Google Scholar] [CrossRef] [PubMed]
- Mandorino, M.; Figueiredo, A.J.; Condello, G.; Tessitore, A. The Influence of Maturity on Recovery and Perceived Exertion, and Its Relationship with Illnesses and Non-Contact Injuries in Young Soccer Players. Biol. Sport 2022, 39, 839–848. [Google Scholar] [CrossRef]
- Winter, E.M.; Maughan, R.J. Requirements for Ethics Approvals. J. Sports Sci. 2009, 27, 985. [Google Scholar] [CrossRef]
- Fuller, C.W.; Ekstrand, J.; Junge, A.; Andersen, T.E.; Bahr, R.; Dvorak, J.; Hägglund, M.; McCrory, P.; Meeuwisse, W.H. Consensus Statement on Injury Definitions and Data Collection Procedures in Studies of Football (Soccer) Injuries. Scand. J. Med. Sci. Sports 2006, 16, 83–92. [Google Scholar] [CrossRef]
- Venturelli, M.; Schena, F.; Zanolla, L.; Bishop, D. Injury Risk Factors in Young Soccer Players Detected by a Multivariate Survival Model. J. Sci. Med. Sport 2011, 14, 293–298. [Google Scholar] [CrossRef]
- Johnson, D.M.; Williams, S.; Bradley, B.; Sayer, S.; Fisher, J.M.; Cumming, S. Growing Pains: Maturity Associated Variation in Injury Risk in Academy Football. Eur. J. Sport Sci. 2020, 20, 544–552. [Google Scholar] [CrossRef]
- Mirwald, R.L.; Baxter-Jones, A.D.; Bailey, D.A.; Beunen, G.P. An Assessment of Maturity from Anthropometric Measurements. Med. Sci. Sports Exerc. 2002, 34, 689–694. [Google Scholar]
- Roche, A.F.; Thissen, D.; Chumlea, W. Assessing the Skeletal Maturity of the Hand-Wrist: Fels Method; Charles C Thomas: Springfield, IL, USA, 1988; ISBN 0-398-05452-5. [Google Scholar]
- Malina, R.M.; Reyes, M.P.; Eisenmann, J.C.; Horta, L.; Rodrigues, J.; Miller, R. Height, Mass and Skeletal Maturity of Elite Portuguese Soccer Players Aged 11–16 Years. J. Sports Sci. 2000, 18, 685–693. [Google Scholar] [CrossRef] [PubMed]
- Figueiredo, A.J.; Gonçalves, C.E.; Silva, M.J.C.E.; Malina, R.M. Youth Soccer Players, 11–14 Years: Maturity, Size, Function, Skill and Goal Orientation. Ann. Hum. Biol. 2009, 36, 60–73. [Google Scholar] [CrossRef] [PubMed] [Green Version]
- Foster, C.; Hector, L.L.; Welsh, R.; Schrager, M.; Green, M.A.; Snyder, A.C. Effects of Specific versus Cross-Training on Running Performance. Eur. J. Appl. Physiol. 1995, 70, 367–372. [Google Scholar] [CrossRef] [PubMed]
- Foster, C. Monitoring Training in Athletes with Reference to Overtraining Syndrome. Occup. Health Ind. Med. 1998, 4, 189. [Google Scholar] [CrossRef]
- Sansone, P.; Tschan, H.; Foster, C.; Tessitore, A. Monitoring Training Load and Perceived Recovery in Female Basketball: Implications for Training Design. J. Strength Cond. Res. 2020, 34, 2929–2936. [Google Scholar] [CrossRef] [PubMed]
- Cormack, S.J.; Newton, R.U.; McGuigan, M.R.; Doyle, T.L. Reliability of Measures Obtained during Single and Repeated Countermovement Jumps. Int. J. Sports Physiol. Perform. 2008, 3, 131–144. [Google Scholar] [CrossRef] [Green Version]
- Gathercole, R.; Sporer, B.; Stellingwerff, T.; Sleivert, G. Alternative Countermovement-Jump Analysis to Quantify Acute Neuromuscular Fatigue. Int. J. Sports Physiol. Perform. 2015, 10, 84–92. [Google Scholar] [CrossRef]
- Gathercole, R.J.; Sporer, B.C.; Stellingwerff, T.; Sleivert, G.G. Comparison of the Capacity of Different Jump and Sprint Field Tests to Detect Neuromuscular Fatigue. J. Strength Cond. Res. 2015, 29, 2522–2531. [Google Scholar] [CrossRef]
- Le Gall, F.; Carling, C.; Reilly, T.; Vandewalle, H.; Church, J.; Rochcongar, P. Incidence of Injuries in Elite French Youth Soccer Players: A 10-Season Study. Am. J. Sports Med. 2006, 34, 928–938. [Google Scholar] [CrossRef]
- Baumgartner, T.A.; Chung, H. Confidence Limits for Intraclass Reliability Coefficients. Meas. Phys. Educ. Exerc. Sci. 2001, 5, 179–188. [Google Scholar] [CrossRef]
- Hulin, B.T.; Gabbett, T.J.; Lawson, D.W.; Caputi, P.; Sampson, J.A. The Acute: Chronic Workload Ratio Predicts Injury: High Chronic Workload May Decrease Injury Risk in Elite Rugby League Players. Br. J. Sports Med. 2016, 50, 231–236. [Google Scholar] [CrossRef] [Green Version]
- Kemper, G.L.J.; Van Der Sluis, A.; Brink, M.S.; Visscher, C.; Frencken, W.G.P.; Elferink-Gemser, M.T. Anthropometric Injury Risk Factors in Elite-Standard Youth Soccer. Int. J. Sports Med. 2015, 36, 1112–1117. [Google Scholar] [CrossRef] [PubMed]
- Read, P.J.; Oliver, J.L.; De Ste Croix, M.B.A.; Myer, G.D.; Lloyd, R.S. A Prospective Investigation to Evaluate Risk Factors for Lower Extremity Injury Risk in Male Youth Soccer Players. Scand. J. Med. Sci. Sports 2018, 28, 1244–1251. [Google Scholar] [CrossRef] [PubMed]
- Singh, D.; Singh, B. Investigating the Impact of Data Normalization on Classification Performance. Appl. Soft Comput. 2020, 97, 105524. [Google Scholar] [CrossRef]
- Ruddy, J.; Shield, A.; Maniar, N.; Williams, M.; Duhig, S.; Timmins, R.; Hickey, J.; Bourne, M.; Opar, D. Predictive Modeling of Hamstring Strain Injuries in Elite Australian Footballers. Med. Sci. Sports Exerc. 2018, 50, 906–914. [Google Scholar] [CrossRef] [PubMed] [Green Version]
- Han, H.; Wang, W.-Y.; Mao, B.-H. Borderline-SMOTE: A New over-Sampling Method in Imbalanced Data Sets Learning. In Proceedings of the International Conference on Intelligent Computing, Hefei, China, 23–26 August 2005; Springer: Berlin/Heidelberg, Germany, 2005; pp. 878–887. [Google Scholar]
- Hosmer, D.W., Jr.; Lemeshow, S.; Sturdivant, R.X. Applied Logistic Regression; John Wiley & Sons: Hoboken, NJ, USA, 2013; Volume 398, ISBN 0-470-58247-2. [Google Scholar]
- Baesens, B.; Van Gestel, T.; Viaene, S.; Stepanova, M.; Suykens, J.; Vanthienen, J. Benchmarking State-of-the-Art Classification Algorithms for Credit Scoring. J. Oper. Res. Soc. 2003, 54, 627–635. [Google Scholar] [CrossRef]
- Martens, D.; Huysmans, J.; Setiono, R.; Vanthienen, J.; Baesens, B. Rule Extraction from Support Vector Machines: An Overview of Issues and Application in Credit Scoring. Rule Extr. Support Vector Mach. 2008, 80, 33–63. [Google Scholar]
- Sugimoto, D.; Howell, D.R.; Tocci, N.X.; Meehan III, W.P. Risk Factors Associated with Self-Reported Injury History in Female Youth Soccer Players. Phys. Sportsmed. 2018, 46, 312–318. [Google Scholar] [CrossRef] [PubMed]
- Bittencourt, N.F.N.; Meeuwisse, W.H.; Mendonça, L.D.; Nettel-Aguirre, A.; Ocarino, J.M.; Fonseca, S.T. Complex Systems Approach for Sports Injuries: Moving from Risk Factor Identification to Injury Pattern Recognition—Narrative Review and New Concept. Br. J. Sports Med. 2016, 50, 1309–1314. [Google Scholar] [CrossRef] [Green Version]
- López-Valenciano, A.; Ayala, F.; Puerta, J.M.; Croix, M.D.S.; Vera-García, F.; Hernández-Sánchez, S.; Ruiz-Pérez, I.; Myer, G. A Preventive Model for Muscle Injuries: A Novel Approach Based on Learning Algorithms. Med. Sci. Sports Exerc. 2018, 50, 915. [Google Scholar] [CrossRef] [PubMed]
- Le Gall, F.; Carling, C.; Reilly, T. Biological Maturity and Injury in Elite Youth Football. Scand. J. Med. Sci. Sports 2007, 17, 564–572. [Google Scholar]
- Ratel, S.; Duché, P.; Williams, C.A. Muscle Fatigue during High-Intensity Exercise in Children. Sports Med. 2006, 36, 1031–1065. [Google Scholar] [CrossRef] [PubMed]
- Materne, O.; Chamari, K.; Farooq, A.; Weir, A.; Hölmich, P.; Bahr, R.; Greig, M.; McNaughton, L.R. Association of Skeletal Maturity and Injury Risk in Elite Youth Soccer Players: A 4-Season Prospective Study with Survival Analysis. Orthop. J. Sports Med. 2021, 9, 2325967121999113. [Google Scholar] [CrossRef]
- Malone, S.; Owen, A.; Newton, M.; Mendes, B.; Collins, K.D.; Gabbett, T.J. The Acute: Chonic Workload Ratio in Relation to Injury Risk in Professional Soccer. J. Sci. Med. Sport 2017, 20, 561–565. [Google Scholar] [CrossRef] [PubMed] [Green Version]
- Jaspers, A.; Kuyvenhoven, J.P.; Staes, F.; Frencken, W.G.; Helsen, W.F.; Brink, M.S. Examination of the External and Internal Load Indicators’ Association with Overuse Injuries in Professional Soccer Players. J. Sci. Med. Sport 2018, 21, 579–585. [Google Scholar] [CrossRef]
- Bastos, F.N.; Vanderlei, F.M.; Vanderlei, L.C.M.; Júnior, J.N.; Pastre, C.M. Investigation of Characteristics and Risk Factors of Sports Injuries in Young Soccer Players: A Retrospective Study. Int. Arch. Med. 2013, 6, 14. [Google Scholar] [CrossRef] [PubMed]
- Rössler, R.; Junge, A.; Chomiak, J.; Němec, K.; Dvorak, J.; Lichtenstein, E.; Faude, O. Risk Factors for Football Injuries in Young Players Aged 7 to 12 Years. Scand. J. Med. Sci. Sports 2018, 28, 1176–1182. [Google Scholar] [CrossRef]
- Brink, M.S.; Visscher, C.; Arends, S.; Zwerver, J.; Post, W.J.; Lemmink, K.A. Monitoring Stress and Recovery: New Insights for the Prevention of Injuries and Illnesses in Elite Youth Soccer Players. Br. J. Sports Med. 2010, 44, 809–815. [Google Scholar] [CrossRef]
- Kenttä, G.; Hassmén, P. Overtraining and Recovery. Sports Med. 1998, 26, 1–16. [Google Scholar] [CrossRef]
- Petticrew, M.P.; Sowden, A.J.; Lister-Sharp, D.; Wright, K. False-Negative Results in Screening Programmes: Systematic Review of Impact and Implications. Health Technol. Assess. 2000, 4, 1–120. [Google Scholar] [CrossRef] [PubMed] [Green Version]


| Variables | Definition | Collection/Calculation | Average Values |
|---|---|---|---|
| Maturity timing (MT) | Years from peak height velocity (PHV) | Mirwald et al. [31] algorithm | −0.2 ± 0.66 years |
| Maturity status (MS) | Level of maturation at the chronological age (CA) of observation | Skeletal age (SA) − CA | 1.09 ± 1.04 years |
| RPE | Rate of perceived exertion | CR-10 Borg’s scale modified by Foster et al. [35] | 4.6 ± 1.89 AU |
| S-RPE | Subjective internal training load (TL) | Training duration | 426.8 ± 283.1 AU |
| Monotony | Statistical analysis of trainings’ variation over time | 2.96 ± 2.96 AU | |
| Strain | Overall stress of the training week | sum of weekly TL | 4613 ± 4008 AU |
| WL | Cumulative loads for a period of one week | Sum of the loads of all training/match sessions over a period of one week | 1679 ± 1043 AU |
| WL2 | Cumulative loads for a period of two weeks | Sum of the loads of all training/match sessions over a period of two weeks | 3126 ± 1717 AU |
| WL3 | Cumulative loads for a period of three weeks | Sum of the loads of all training/match sessions over a period of three weeks | 4325 ± 1843 AU |
| WL4 | Cumulative loads for a period of four weeks | Sum of the loads of all training/match sessions over a period of four weeks | 5486 ± 2028 AU |
| TQR | Recovery status before the training session | TQR scale | 7 ± 1.49 AU |
| TQR-PD | Previous day’s recovery status | TQR scale | 7 ± 1.47 AU |
| PRE-CMJ | Jump height assessed before the training session | Infrared platform (Optojump system) | 31.25 ± 5.30 cm |
| POST-CMJ | Jump height assessed after the training session | Infrared platform (Optojump system) | 30.60 ± 5.09 cm |
| %CMJ | Percentage variation between PRE-CMJ and POST-CMJ | −1.60 ± 9.28% |
| Injury Outcome | Number of Injuries (Frequency) |
|---|---|
| MSI | 27 (0.024) |
| MSI-lag | 64 (0.057) |
| Total sessions (trainings and matches) | 1118 |
| Models | Condition | Precision | Recall | F1-Score | AUC |
|---|---|---|---|---|---|
| LR | NI | 0.97 ± 0.01 | 0.97 ± 0.02 | 0.97 ± 0.01 | 0.63 ± 0.09 |
| MSI | 0.04 ± 0.1 | 0.05 ± 0.09 | 0.04 ± 0.08 | ||
| RF | NI | 0.97 ± 0.01 | 0.98 ± 0.01 | 0.98 ± 0.01 | 0.58 ± 0.14 |
| MSI | 0.03 ± 0.12 | 0.03 ± 0.08 | 0.03 ± 0.08 | ||
| SVM | NI | 0.98 ± 0.01 | 0.86 ± 0.03 | 0.91 ± 0.02 | 0.55 ± 0.16 |
| MSI | 0.04 ± 0.03 | 0.2 ± 0.16 | 0.06 ± 0.05 | ||
| LR-lag | NI | 0.95 ± 0.01 | 0.75 ± 0.05 | 0.84 ± 0.03 | 0.66 ± 0.07 |
| MSI | 0.1 ± 0.04 | 0.39 ± 0.17 | 0.15 ± 0.06 | ||
| RF-lag | NI | 0.95 ± 0.01 | 0.85 ± 0.07 | 0.89 ± 0.04 | 0.71 ± 0.07 |
| MSI | 0.12 ± 0.07 | 0.29 ± 0.17 | 0.16 ± 0.08 | ||
| SVM-lag | NI | 0.97 ± 0.01 | 0.86 ± 0.03 | 0.91 ± 0.02 | 0.84 ± 0.05 |
| MSI | 0.21 ± 0.05 | 0.55 ± 0.14 | 0.3 ± 0.07 |
Publisher’s Note: MDPI stays neutral with regard to jurisdictional claims in published maps and institutional affiliations. |
© 2021 by the authors. Licensee MDPI, Basel, Switzerland. This article is an open access article distributed under the terms and conditions of the Creative Commons Attribution (CC BY) license (https://creativecommons.org/licenses/by/4.0/).
Share and Cite
Mandorino, M.; Figueiredo, A.J.; Cima, G.; Tessitore, A. Predictive Analytic Techniques to Identify Hidden Relationships between Training Load, Fatigue and Muscle Strains in Young Soccer Players. Sports 2022, 10, 3. https://doi.org/10.3390/sports10010003
Mandorino M, Figueiredo AJ, Cima G, Tessitore A. Predictive Analytic Techniques to Identify Hidden Relationships between Training Load, Fatigue and Muscle Strains in Young Soccer Players. Sports. 2022; 10(1):3. https://doi.org/10.3390/sports10010003
Chicago/Turabian StyleMandorino, Mauro, António J. Figueiredo, Gianluca Cima, and Antonio Tessitore. 2022. "Predictive Analytic Techniques to Identify Hidden Relationships between Training Load, Fatigue and Muscle Strains in Young Soccer Players" Sports 10, no. 1: 3. https://doi.org/10.3390/sports10010003
APA StyleMandorino, M., Figueiredo, A. J., Cima, G., & Tessitore, A. (2022). Predictive Analytic Techniques to Identify Hidden Relationships between Training Load, Fatigue and Muscle Strains in Young Soccer Players. Sports, 10(1), 3. https://doi.org/10.3390/sports10010003