1. Introduction
Theory suggests that consumers should forage in ways that will maximize the benefits received from resources, while minimizing the energetic costs of obtaining those resources [
1]. One way to accomplish this is to forage in areas with concentrated resources as these resource-dense patches should be easier to find and provide more resources to distribute foraging efforts (resource concentration effects (RCE) [
2,
3]). Additionally, because of the greater density of resources, foragers can minimize the energetic costs of moving between patches to find food [
1]. Many studies have looked for the existence of RCE in a variety of different consumer-resource systems with predators [
4], herbivores [
5,
6,
7], pollinators [
8,
9] and seed predators [
10]. While theory suggests that foragers should distribute their foraging efforts in ways to maximize fitness [
11], results from empirical studies are mixed. For instance, Otway
et al. [
6] found a negative relationship between resource density and insect load (a resource dilution effect) for nine specialist herbivores, while Tubbesing
et al. [
9] found resource concentration effects for bumble bees.
One reason for the inconsistent results and contrasting patterns could be due to differences in the search modes of the consumers, which could vary with spatial scales. Consumers use a variety of different cues (visual, contact, and olfactory) to inform foraging decisions and employ different strategies of obtaining resources efficiently. Because decision-making processes are often times hierarchical [
6,
12,
13,
14] where foragers must first select a patch in which to forage (between-patch selection) and then target resources once inside a patch (within-patch selection [
3,
15,
16]), relationships between resource density and foraging rates might vary with spatial scale. For example, Jha and Vandermeer [
13] observed positive relationships between visitation rates of bees and coffee floral resources at large (100 m) spatial scales (resource concentration effects), but found negative relationships at small (plant-level) spatial scales (resource dilution effects). Resource-dense patches may have been easier to find at large spatial scales, especially for foragers that use visual cues. However, once inside a patch, other cues (contact or olfactory) may have been used to assess resource quality and selection [
12,
17,
18,
19]; each cue having varying relationships with resource density. Furthermore, within a given spatial scale, life-history differences of consumers might influence foraging rates and resource density relationships. For example, social animals that convey information to others (e.g., mass recruitment behavior, such as leaving pheromone trails, or signaler limited recruitment, such as the waggle dance [
20]) might exhibit a resource concentration effect, in efforts to increase foraging efficiency and colony performance [
21,
22]. In contrast, the opposite effect (a resource dilution effect), or no density response may also be observed for solitary foragers, if they are avoiding competition [
14], or if high resource density patches provide fewer resources for foragers to distribute their efforts (
i.e., saturation effects [
19,
23]).
From the plant’s perspective, different relationships between resource densities and foraging rates could have varying consequences for fitness. If plants with greater floral resources attract more pollinators per unit resource (and thus, have greater pollination rates and seed set), then producing many flowers might be the optimal strategy for plants. On the other hand, if plants with a greater number of seeds (due to increased pollination) attract seed consumers (thus increasing seed predation), then producing many floral resources might not be the best strategy. Therefore, insect-pollinated plants may face tradeoffs between investing energetic resources towards traits, such as size and flowers that will attract mutualistic partners, while avoiding antagonistic interactions (e.g., seed predation and herbivory). If antagonistic and mutualistic partners use the same plant traits to select host plants [
24], there might be opposing selection pressures for these plant traits, resulting in an optimal plant phenotype.
In this study, we experimentally examined the foraging patterns of pollinators and seed predators across a range of resource densities. Specifically, we asked how resource densities (number of flowers and seeds per plant) affected visitation and seed removal rates, respectively. We predicted that if resource concentration effects occur, the per-unit resource visitation and seed removal rates would be greater on resource-dense plants compared to resource-sparse plants, because resource-dense plants could provide a more cost-efficient foraging opportunity [
2]. Alternatively, if the per-unit visitation and seed removal rates are low in resource-dense plants, it would suggest resource dilution effects [
6]. Because pollinators and seed predators have been known to respond to resource variation at both small (plant-level) and large (field-level) scales [
12,
13,
14,
25], we examined whether foraging rate and resource density relationships were site-dependent. We predicted that in a site with low naturally-occurring resources, the relationships between resource density and foraging rates would be weak because consumers would flock to plants at all resources levels equally compared to the site where there are high levels of naturally-occurring resources available. Finally, we were interested in the fitness consequences of concentrated floral resources for the plants by examining the relationships between resource density and the final number of seeds remaining after predation.
3. Results
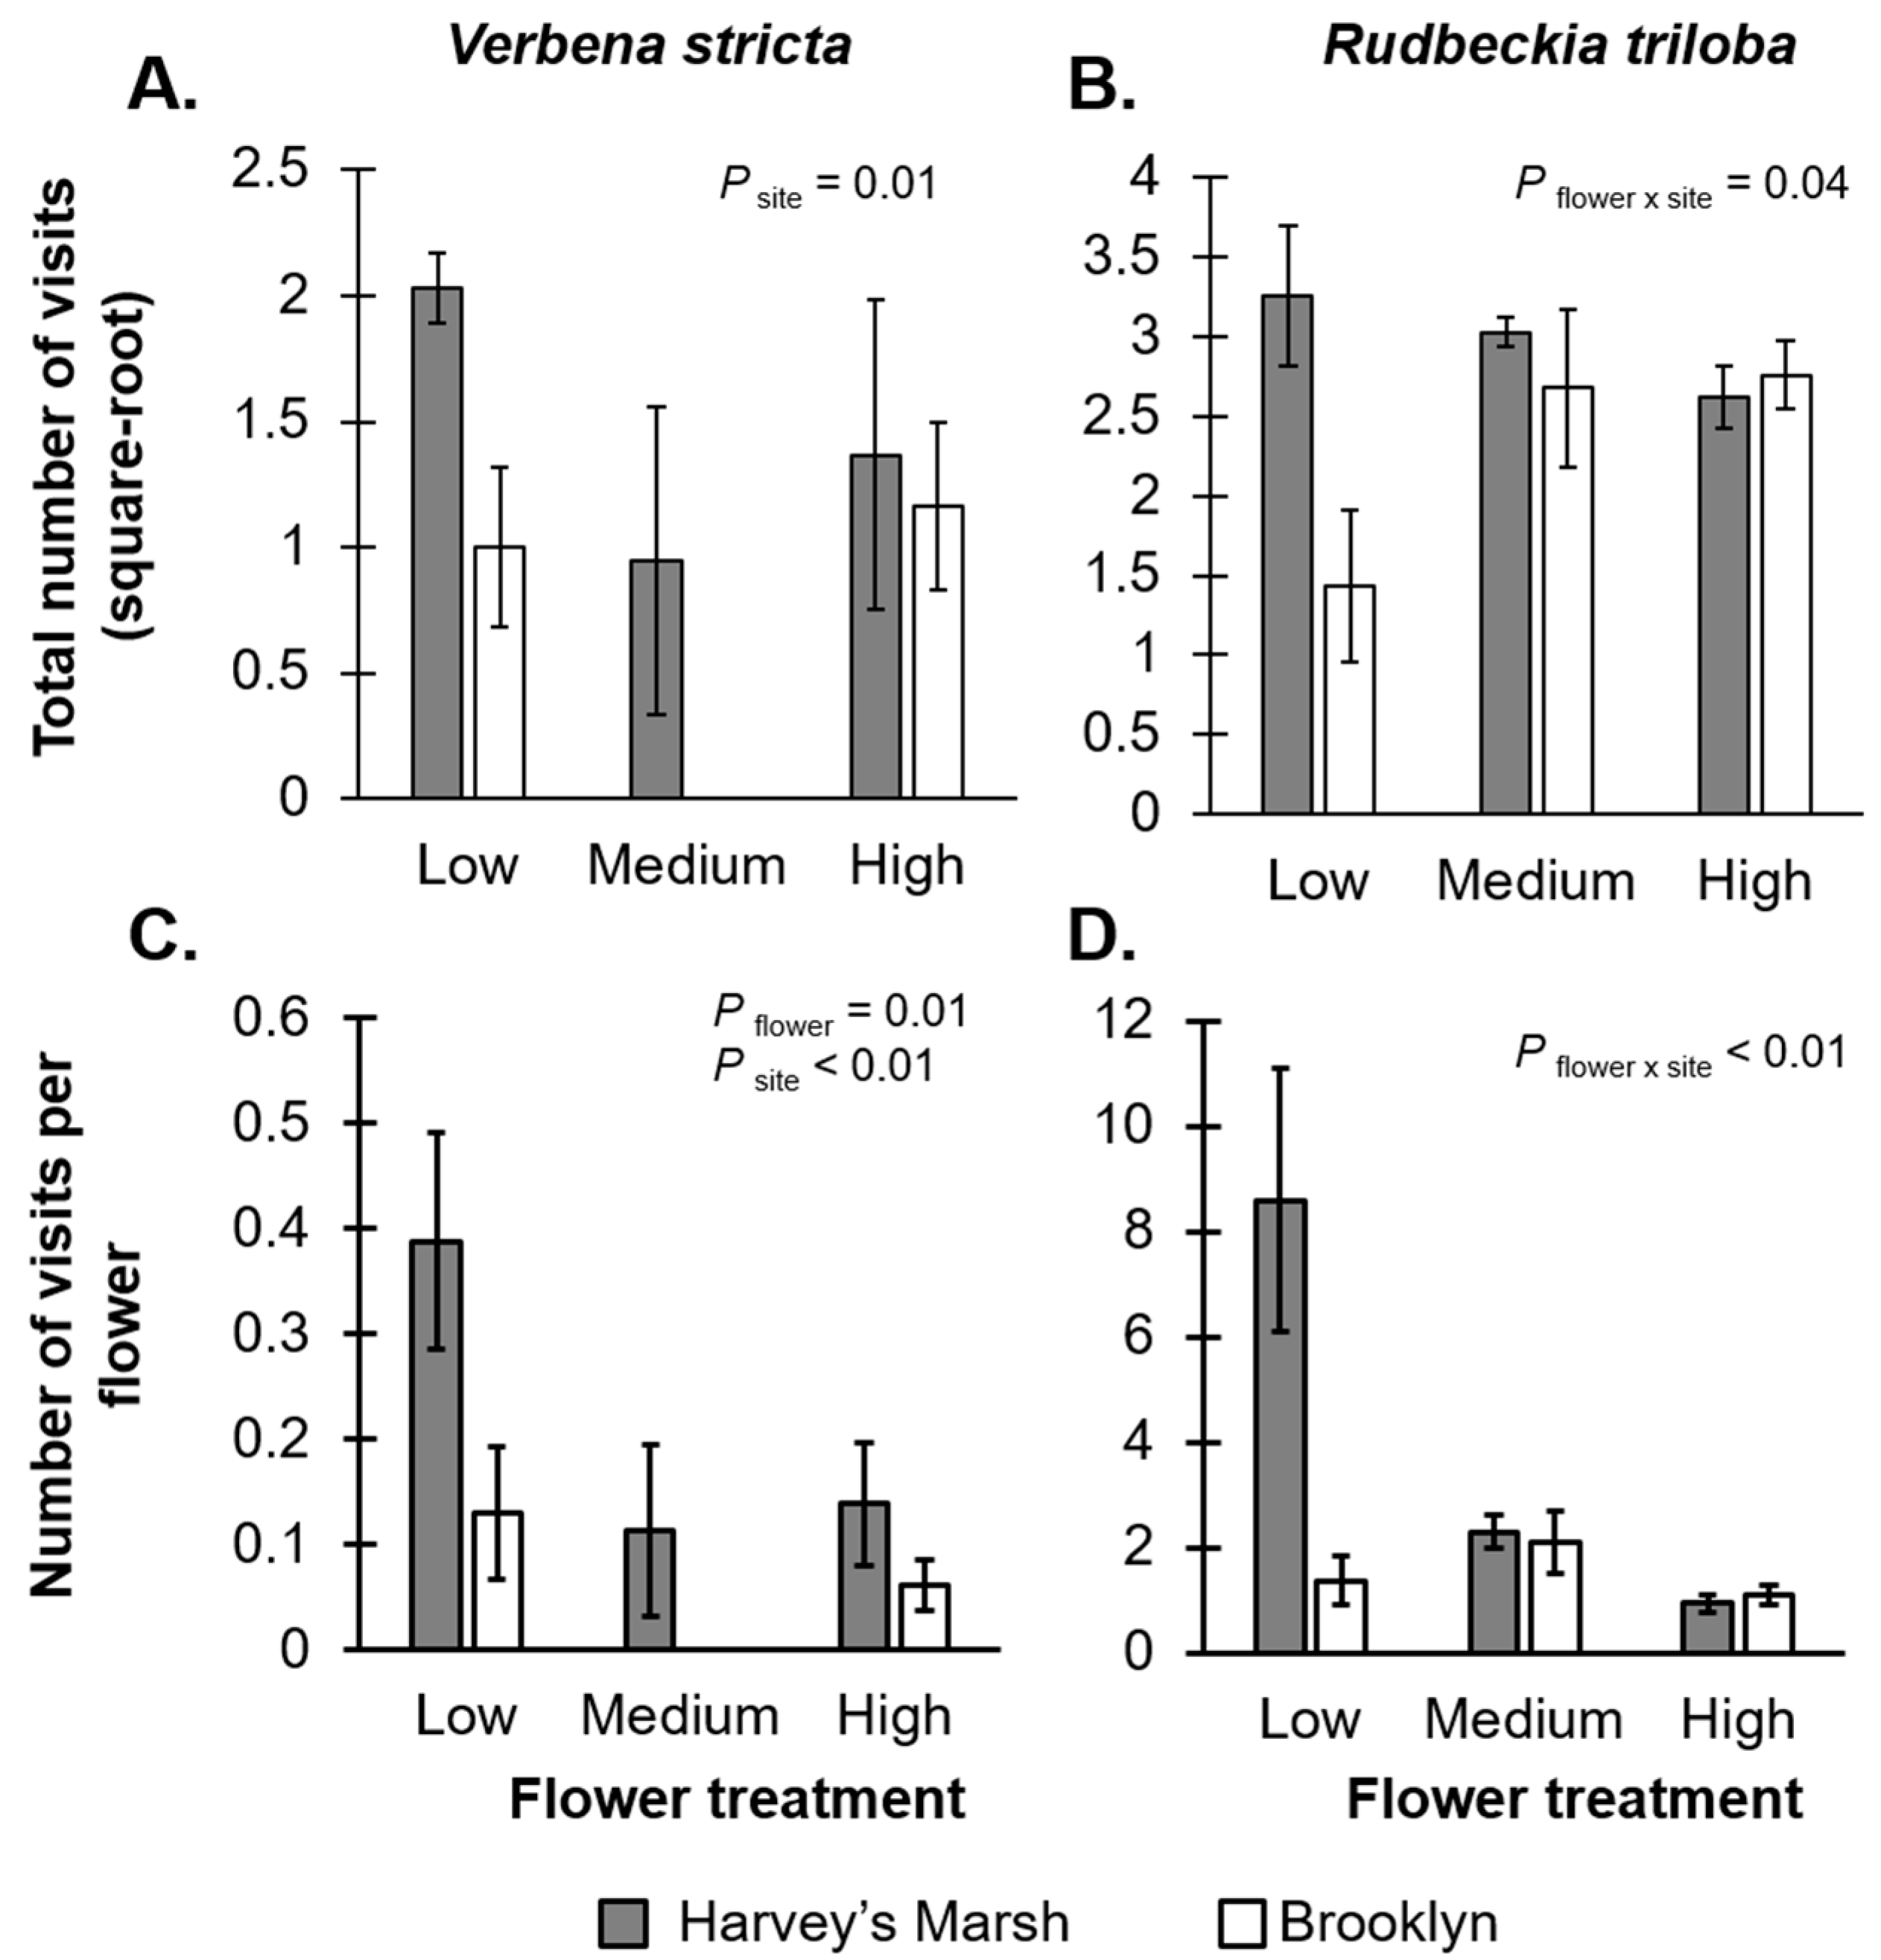
3.1. Flower Visitation
We recorded 236 visits to
R. tribola and 75 visits to
V. stricta. The most commonly-observed pollinator insects visiting both
V. stricta and
R. triloba was syrphid flies (mainly
Toxomerus marginatus, 34.4%–83.3% of visits) and halictid bees (mainly
Augochlora pura, 14.8%–30.6% of visits) at both sites.
Verbena stricta was also visited by
Apis mellifera (18.6% visits). For
V. stricta, there was a marginally significant, negative relationship between flower density treatment and the total number of visits (
F2,24 = 2.67,
p = 0.08;
Figure 1A,
Table S1A) and a significant, negative relationship with the per-unit resource visitation rate (
F2,24 = 5.42,
p = 0.01;
Figure 1C,
Table S1A), suggesting resource dilution effects. There was also a significant site effect on visitation rates (total visits:
F1,24 = 7.77,
p = 0.01; visits per unit-resource:
F1,24 = 8.02,
p < 0.01); there were more visits to plants at the Harvey’s Marsh (a low resource site) than at Brooklyn (a high resource site). There was no interaction between flower treatment and site on visitation rates (total visits:
F2,24 = 0.05,
p = 0.94; visits per unit-resource:
F2,24 = 1.08,
p = 0.35) or the total time on plants (
F2,24 = 1.45,
p = 0.25;
Table S1A).
For
R. triloba, there was an interaction between site and flower treatment on both the total visitation rate (
F2,24 = 3.65,
p = 0.04;
Figure 1B,
Table S1B) and per-unit resource visitation rates (
F2,24 = 6.67,
p < 0.01;
Figure 1D,
Table S1B). At Harvey’s Marsh (a low resource site), total visitation to plants remained constant, irrespective of floral density, but there was a negative relationship between the per-unit resource visitation rates and flower density, again suggesting a resource dilution effect. On the other hand, at Brooklyn (a high resource site), total visitation rates increased with flower density, but there was no effect of floral density on the per-unit resource visitation rates. The total time that all visitors spent on
R. triloba flowers was significantly greater at Harvey’s Marsh (52.0 min per plant) than at Brooklyn (26.3 min per plants,
F1,24 = 4.84,
p = 0.03;
Table S1B).
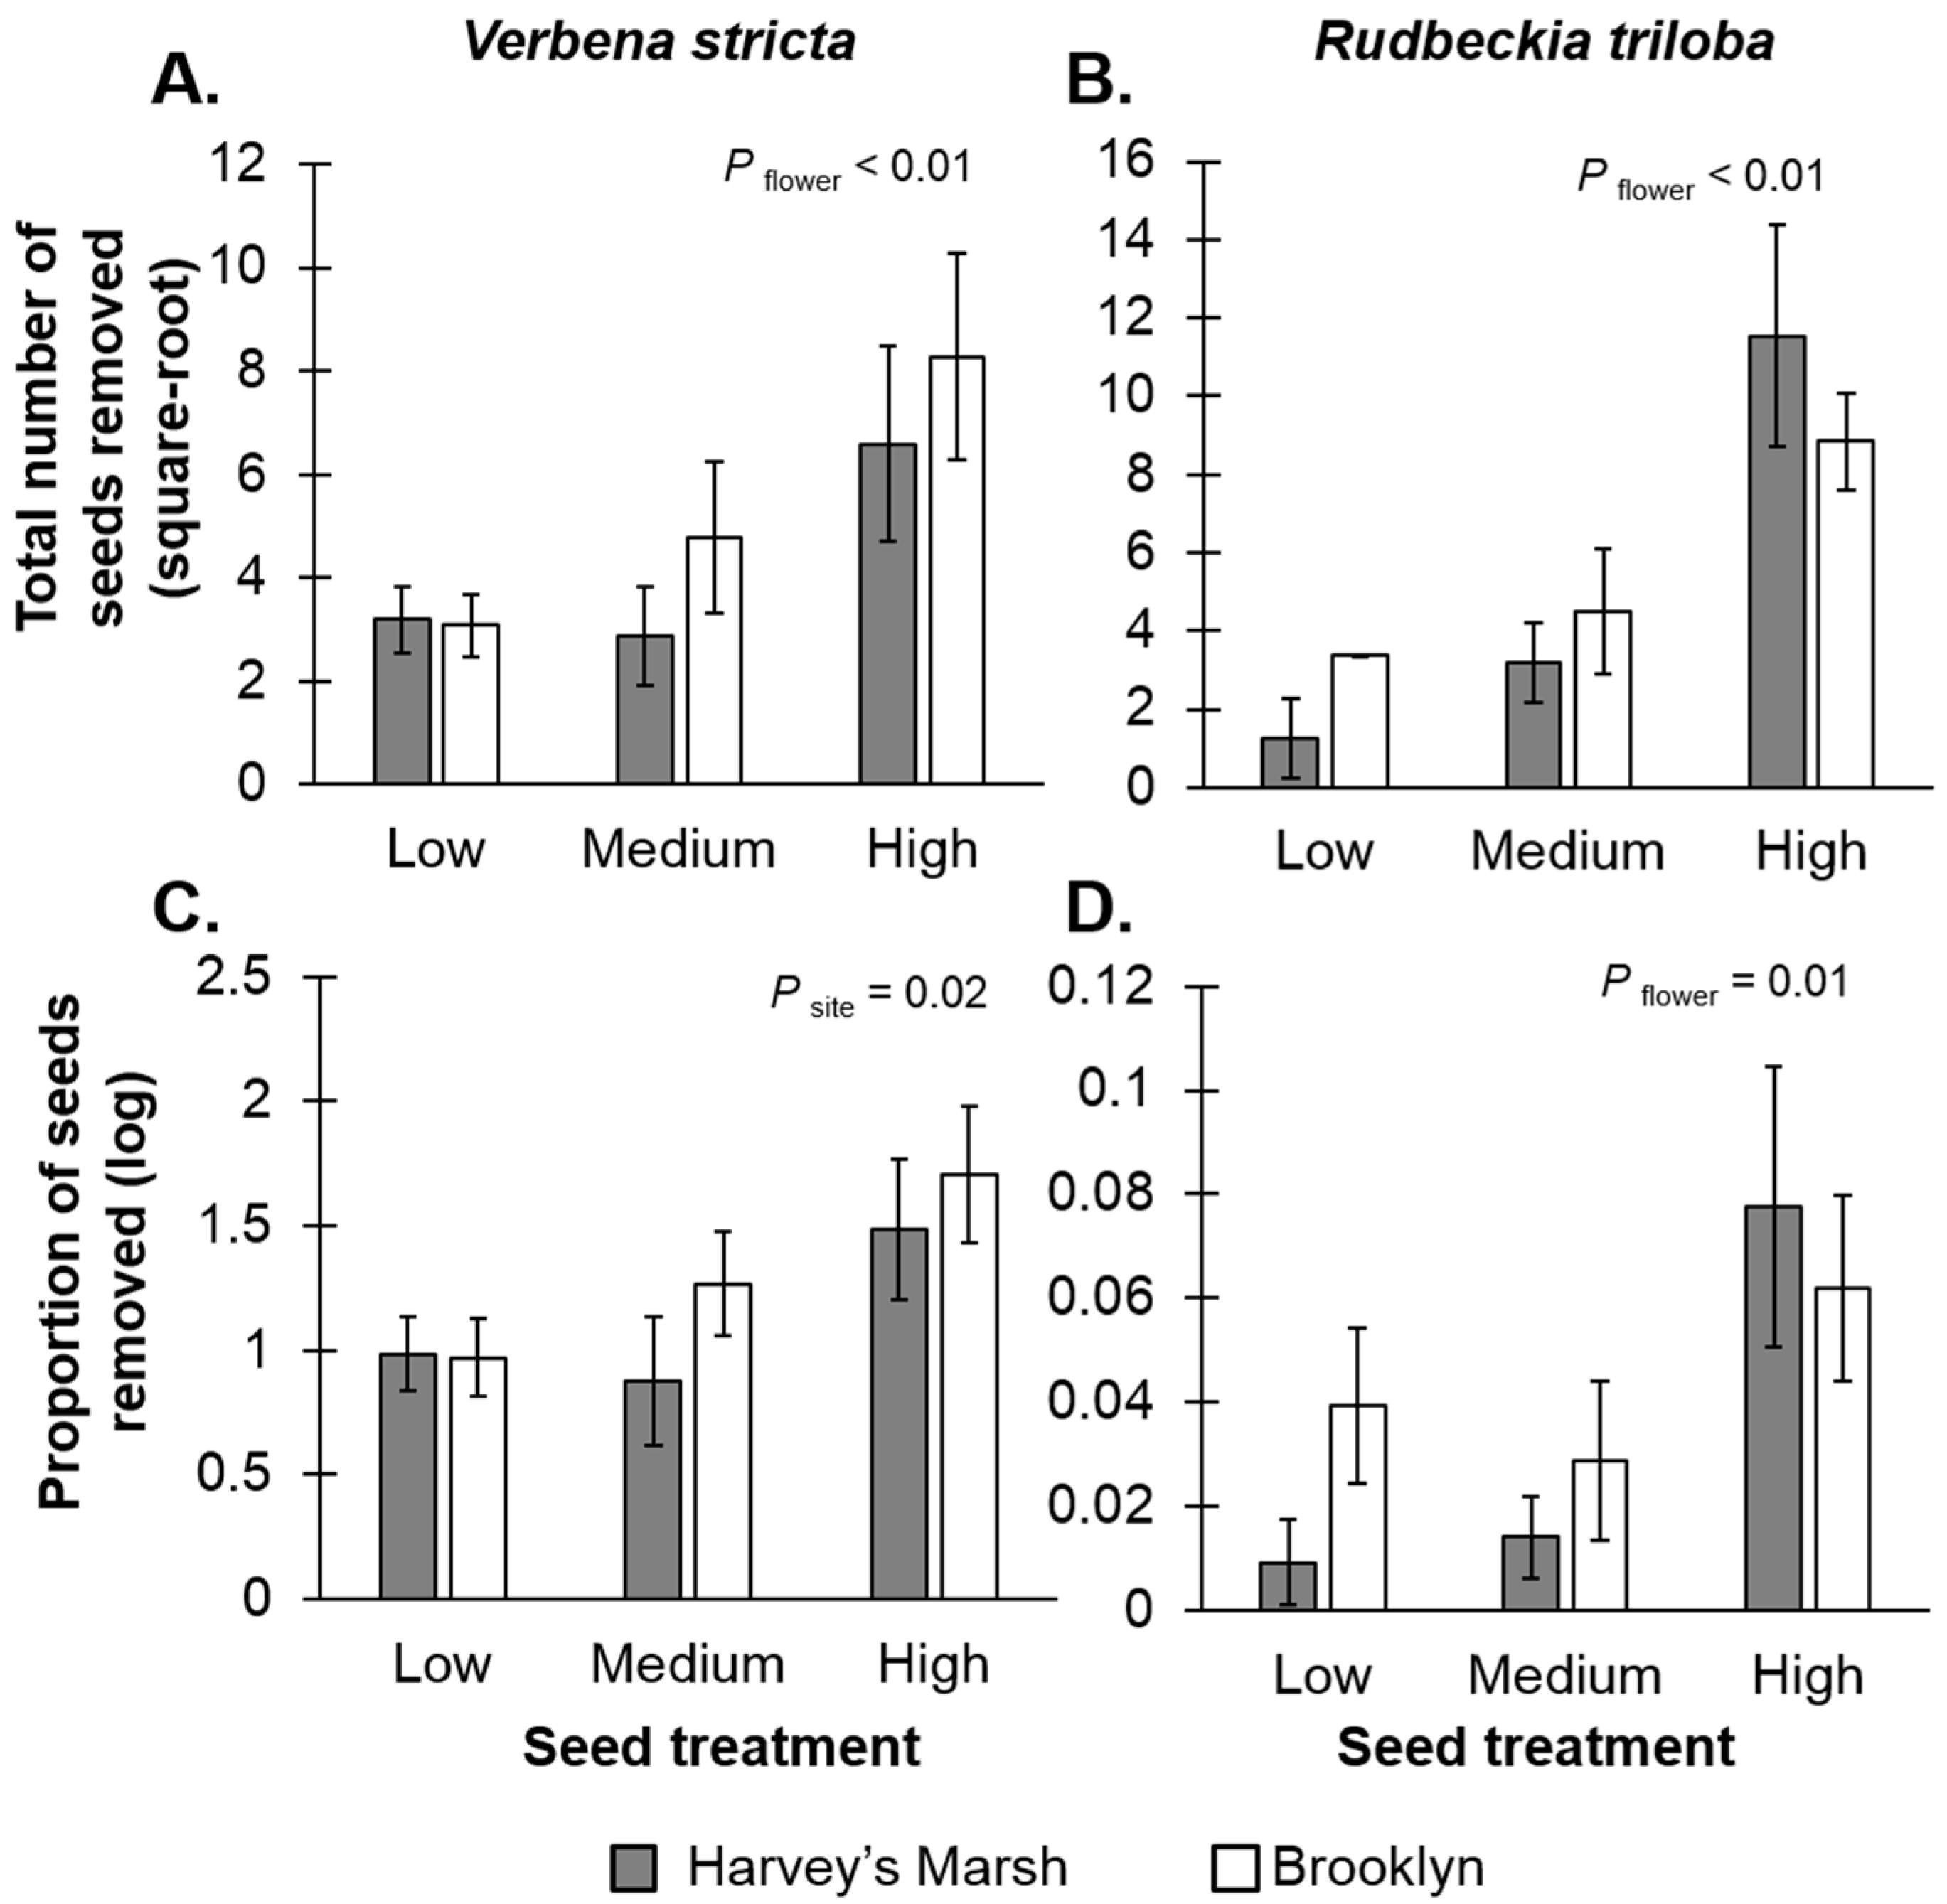
3.2. Seed Removal
There was a positive relationship between flower treatment and seeds produced (V. stricta F2,24= 18.00, p < 0.01, R2 = 0.44; R. triloba F2,24 = 28.15, p < 0.01, R2 = 0.65), therefore individuals belonging to any one of the three flower treatments (“low”, “medium” and “high” flower treatment) had similar corresponding seed densities (for R. triloba: mean “low” seed density = 16.7 ± 3.25 (SE), “medium” seeds = 82.5 ± 16.93, “high” seeds = 197.5 ± 30.61; for V. stricta: mean “low” seed densities = 108.4 ± 28.5, “medium” seeds = 207.3 ± 54.47 and “high” seeds = 456.6 ± 65.34). There was also a significant difference in the number of seeds produced for V. stricta (F2,24 = 13.65, p < 0.01). Verbena stricta plants in Harvey’s Marsh (a low resource site) produced more flowers (mean number of seeds per plant = 340.6 ± 58.14 (SE) than plant at Brooklyn (a high resource site, mean number of seeds per plant = 174.2 ± 46.32).
Seed resource densities affected seed removal rates. For
V. stricta, there was a positive relationship between seed density and the total number of seeds removed (
F2,24 = 5.69,
p < 0.01;
Figure 2A,
Table S1A), suggesting resource concentration effects, but no relationship with seed-resource density and the per-unit resource removal rates (
F2,24 = 0.05,
p = 0.94;
Figure 2C,
Table S1A). The per-unit resource removal rates did vary with site (
F1,24 = 5.78,
p = 0.02); there were higher seed predation rates at Brooklyn, a high resource site (mean removal rates 28%) compared to Harvey’s Marsh, a low resource site (mean removal rates = 7.5%). For
R. triloba, there were positive relationships with resource densities and removal rates (total seeds removed:
F2,24 = 12.74,
p < 0.01,
Figure 2B; per-unit removal rate:
F2,24 = 4.66,
p = 0.01,
Figure 2D,
Table S1B) again, suggesting resource concentration effects. Site had no effect on removal rates (
F1,24 < 0.01,
p = 0.92) nor was there an interaction between site and seed treatment (
F2,24 = 1.23,
p = 0.31).
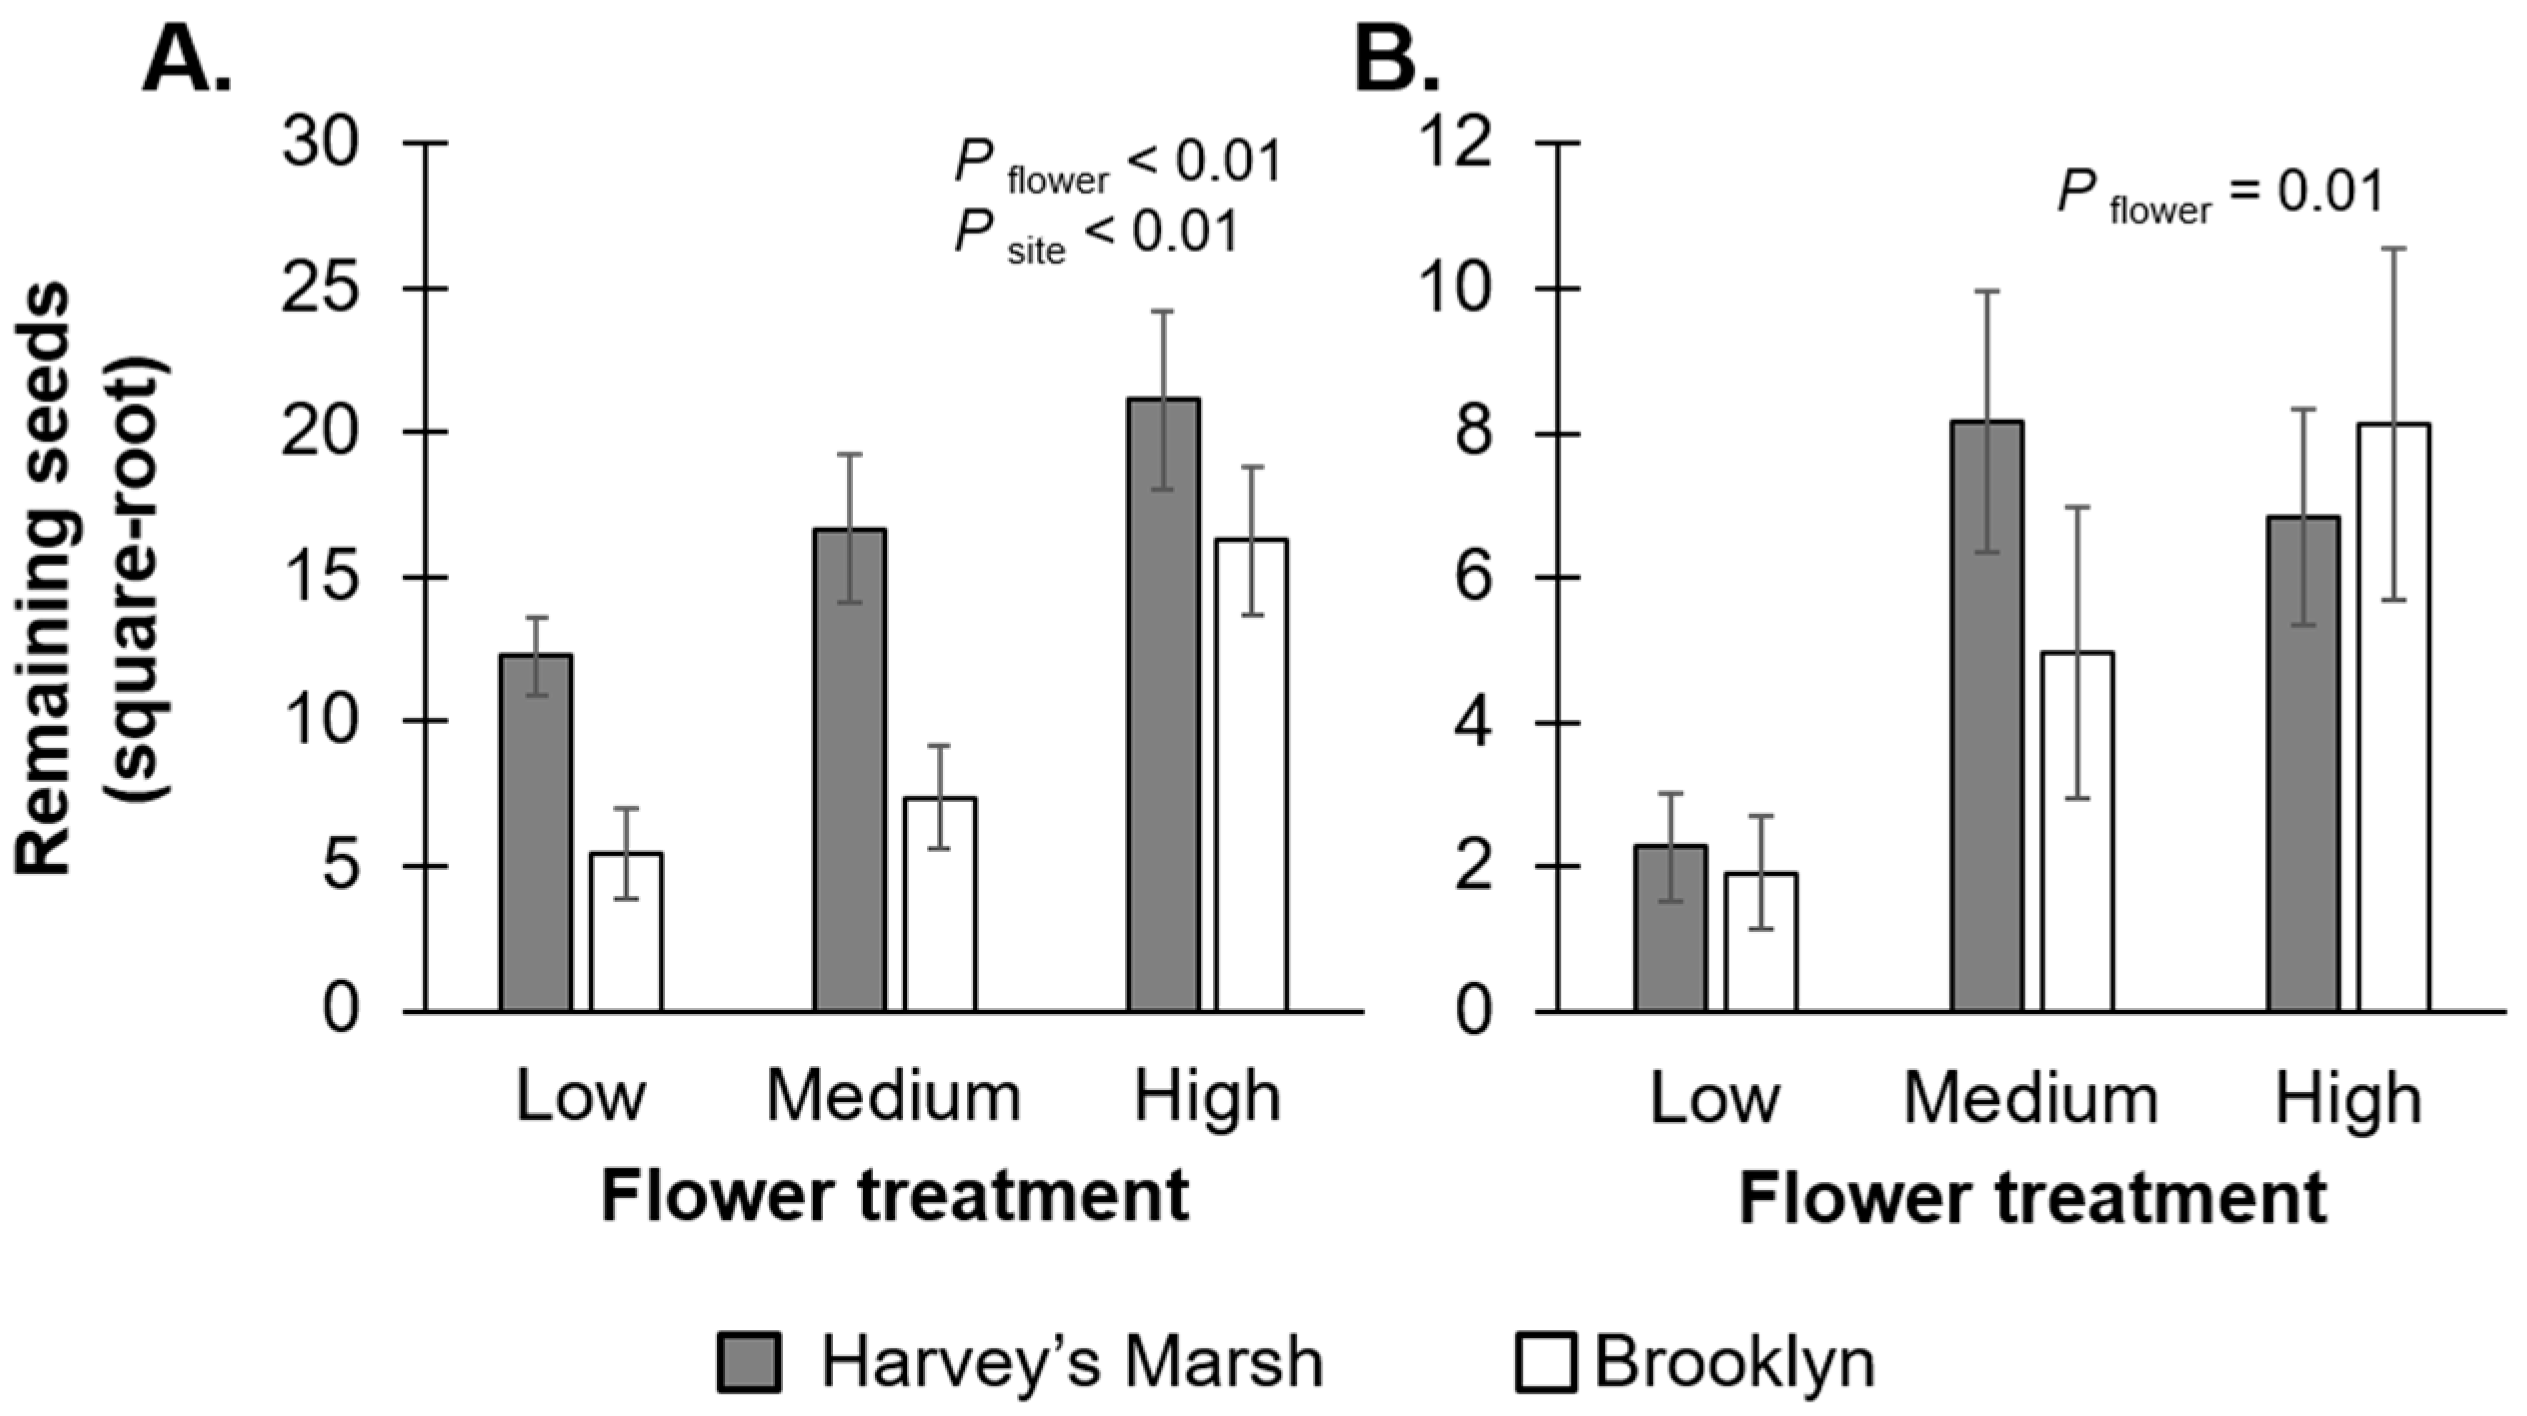
3.3. Fitness Consequences of Pollination and Seed Predation for Plants
For R. triloba, insect pollination was important for seed set because experimental (unbagged) plants produced significantly more seeds (mean = 101.75 seeds) than the control (bagged) plants (mean = 50.12 seeds, F1,43 = 3.96, p = 0.05). For V. stricta, unbagged experimental plants produced a similar number of seeds (mean = 257.4 seeds) as control plants (mean = 277.33, F1,46 = 0.08, p = 0.76), indicating that insect pollination was not important for V. stricta seed set.
At the end of both the pollination and seed predation experiments, there were positive relationships between the initial number of flowers on the plant and the final number of seeds remaining for
V. stricta (F
2,24 = 10.29,
p < 0.01;
Figure 3A,
Table S1A) and
R. triloba (F
2,24 = 5.25,
p = 0.01;
Figure 3B,
Table S1B). For
V. stricta, the final number of seeds was also strongly affected by site (
F1,24 = 14.85,
p < 0.01); Brooklyn had more seeds left over after the pollination and seed removal experiments. On the other hand, for
R. triloba, there was no difference in the final number of seeds between the two sites (
F1,24 = 0.26,
p = 0.60).
4. Discussion
In this prairie system, resource density influenced the visitation and seed removal rates of two common forbs, but the relationships varied with consumer type. In general, we found negative relationships between floral resource density and the visitation rates of potential pollinators for both plant species, suggesting resource dilution effects. That is, as resources became more abundant locally, plants received relatively fewer visits per flower. In contrast, we found a positive relationship between resource density and seed removal rates by seed predators in support of the resource concentration effect. We also found that pollination and seed removal rates were site dependent. Plants in Brooklyn (a high resource density site) received fewer visits to flowers, but suffered greater seed removal rates. These findings indicate that pollinators and seed predators may respond differently to variation in resource density and that future studies should consider life history traits and foraging behavior when investigating resource concentration effects.
4.1. Possible Mechanisms of Density Effects on Pollination and Seed Predation
We found different relationships between resource density and foraging rates for pollinators and seed predators: resource dilution effects for visitation rates, but resource concentration effects for seed removal. One possibility for the different relationships between resource density and foraging rates could be due to the different life history traits of the consumers. Work by others (see [
33,
34]) has found similar resource dilution effects for wild (solitary) bees, but resource concentration effects for managed (social) honey bees. Social insects, such as honey bees and ants, use recruitment-based foraging to inform other colony members of available resources. If there is a greater density of resource available, conveying information to other members of the colony might be advantageous for the colony, thus leading to a greater number of individuals concentrating at the resource location. On the other hand, solitary insects, such as some wild bees, may want to minimize competition for resources and/or avoid predation risks while foraging and, therefore, might forage in less desirable areas for food [
13]. Dilution effects may also occur due to saturation, where in resource-dense patches, there are not enough resources for foragers to distribute their foraging efforts compared to resource-sparse patches [
23]. In our study, because the total visits to plants remains constant (or increased) across flower density treatments, the negative relationships between resource density and the per-unit resource visitation rates on plants is likely due to saturation effects for
V. stricta (
Figure 1A,C) and
R. triloba (
Figure 1B,D).
4.2. Context-Dependency in Pollination and Seed Removal Rates
Pollination rates varied with site where plants at Harvey’s Marsh (a low resource density site) received more visits than Brooklyn (a high resource density site). One reason for the site-level differences could be due to the difference in the relative quantity of naturally-occurring floral resources between sites. The availability of naturally-occurring resources at Harvey’s Marsh was low; therefore, as we predicted, pollinators may have been attracted to the newly-placed experimental plants at the site and visited plants from all resource-density treatments equally (i.e., visitors were not selective about which plants they visited). On the other hand, Brooklyn had greater abundance of naturally-occurring floral resources; therefore, our experimental plants might not have been considered attractive to the pollinators relative to the other plant species within the field. Pollinators that did visit the experimental plants may have been more selective, especially with R. triloba, where pollinators visited plants with greater floral resources compared to plants with fewer flowers.
Site also affected seed removal rates, but only for
V. stricta seeds. Between-site differences could be due to the overall differences in ant abundances and seed preference. In a previous study [
29], Brooklyn had greater ant abundances (2612 individuals, mainly
Lasius neoniger) compared to Harvey’s Marsh (739 individuals) and could explain why there was greater removal rates in Brooklyn compared to Harvey’s Marsh. It is unclear, however, why site level differences were observed for
V. stricta and not
R. triloba. One possibility could be due to ant preference for
V. stricta seeds compared to
R. triloba (
V. stricta mean removal rate = 19.2%
vs. R. triloba mean removal rate = 9.4%:
t = 1.95,
df = 57,
p = 0.05). If ants preferred
V. stricta, then demand for these resources would be greater at the site with more ants (Brooklyn). Conducting feeding trials with ants would help elucidate whether seed preferences contributed to differences between sites, and conducting similar studies at more sites would be helpful to determine the generality of the results.
4.3. Potential Fitness Consequences of Visitation and Seed Predation for Plants
Plants may face trade-offs between producing many flowers to attract pollinators, but not too many to attract seed predators, resulting in balancing selection towards an optimal phenotype [
24]. In our study, we found that plants with a low number of flowers had greater visitation rates and also lower seed removal rates, favoring a phenotype with fewer flowers. Producing fewer flowers might be an optimal strategy for various reasons. First, if plants produce fewer flowers with limited resources, the resulting seeds may be larger in size or quality, which could increase the likelihood of germination or survival [
35]. Second, our study plants were perennials, so investing less energy towards reproduction and more towards growth may be the optimal strategy for lifetime fitness and survival [
36].
While producing fewer flowers might seem like an optimal strategy to increase visitation rates and lower seed removal rates respectively, the total (net) seeds remaining at the end of the experiment (after pollination and seed predation) was greater in the high floral resource treatment than the low floral resource treatment. When considering the total number of seeds remaining (rather than pollination and seed predation rates), this suggests that the optimal strategy for plants is the opposite; to produce many flowers. One caveat, however, is that this study was conducted for a short period where the duration of the pollination and seed removal experiments varied (one week for the pollination experiment and 48 h for the seed removal experiment). While the short time frame in our study allowed us to quantify visitation and seed removal rates when resources are the most “attractive”, it is possible that our snapshot of fitness was not representative of the whole season or lifetime fitness for plants. Furthermore, we only focused on post-dispersal seed removal rates and did not estimate pre-dispersal seed removal rates, which could increase the effects of seed predators on plants. A longer study examining the interaction between pollinators and seed predators (both pre- and post-dispersal) would allow us to better examine the evolutionary implications of pollinators and seed predators on the phenotype of plants.


