Article

Evolutionary Dynamics of Glycoside Hydrolase Family 1 Provide Insights into Insect–Plant Interactions in Lepidoptera

1
College of Life Sciences, Chongqing Normal University, Chongqing 401331, China
2
Chongqing Key Laboratory of Vector Control and Utilization, Institute of Entomology and Molecular Biology, Chongqing Normal University, Chongqing 401331, China
3
College of Environment and Ecology, Chongqing University, Shabeijie Str. 83, Chongqing 400045, China
4
Faculty of Forestry and Wood Sciences, Czech University of Life Sciences Prague, Kamýcká 129, 165 00 Prague, Czech Republic
*
Author to whom correspondence should be addressed.
These authors contributed equally to this work.
Insects 2025, 16(7), 727; https://doi.org/10.3390/insects16070727
Submission received: 11 June 2025 / Revised: 14 July 2025 / Accepted: 14 July 2025 / Published: 17 July 2025
(This article belongs to the Special Issue Lepidoptera: Behavior, Ecology, and Biology)

Simple Summary

Lepidopteran insects rely on special enzymes to break down plant materials and protect themselves from plant toxicants. One important group of these enzymes is glycoside hydrolase family 1 (GH1). In this study, we examined GH1 genes in 61 species of butterflies and moths to understand how these genes evolved and how they help insects interact with plants. We identified 996 GH1 genes and grouped them into 11 categories, with each displaying different species diversity. Most GH1 genes originated through gene duplications, especially tandem and dispersed duplications. In addition, we examined the expression of these genes in the silkworm and found certain highly expressed GH1 genes during larval stages, especially in tissues involved in digestion. These results showed that the evolutionary history of GH1 genes in Lepidoptera reflects their adaptation to plant feeding, providing insights for further investigation into plant–insect interactions.

Abstract

Glycoside hydrolase family 1 (GH1) enzymes are essential for plant cell wall digestion and the detoxification of plant metabolites in insects, yet their evolutionary history in Lepidoptera remains unresolved. This study systematically identified GH1 genes across 61 Lepidopteran genomes and analyzed their evolutionary dynamics. In addition, the expression profiles of GH1 genes in the silkworm (Bombyx mori) across various developmental stages and tissues were related to their evolutionary histories. A total of 996 GH1 genes were annotated and classified into 11 groups, with each showing distinct species diversity. Gene duplication and loss analysis revealed frequent duplications and losses during Lepidoptera evolution; these duplications primarily originated through tandem and dispersed duplications and were located in syntenic regions. Transcriptomic analysis of the silkworm revealed that the groups and duplications of GH1 genes were correlated to their expression patterns, with high expression in the larval midgut and fat body. These findings suggest that GH1 gene duplications and losses and expression have played a significant role in Lepidopteran adaptation to diverse host plants. Overall, this study provides comprehensive insights into the evolutionary trajectories of GH1 genes, highlighting their potential contribution to insect–plant interactions in Lepidoptera.

1. Introduction

Lepidopteran insects, comprising butterflies and moths, encompass a remarkable diversity of species, with approximately 180,000 described species [1,2]. The adults play essential ecological roles as pollinators, feeding primarily on nectar or pollen, while their larvae are predominantly herbivorous. Most Lepidopteran larvae primarily consume leaves, while some feed on stems, flowers, fruits, or wood. Several species are of major agricultural concern, as their larvae are destructive pests that cause significant damage to agricultural production [3]. These herbivorous larvae rely on a diverse suite of carbohydrate-active enzymes (CAZymes) to digest and metabolize plant cell components. Among these, glycoside hydrolases (GHs), a class of enzymes that hydrolyze glycosidic compounds, are critical in breaking down plant cell wall polysaccharides.
Within the GH class, glycoside hydrolase family 1 (GH1) is a key enzyme that plays a pivotal role in the herbivory of Lepidopteran larvae by mediating the digestion of plant cell walls and detoxification of plant secondary metabolites. GH1 enzymes contribute to the degradation of plant cell wall cellulose by acting synergistically with other cellulases (e.g., endoglucanases and exoglucanases) to convert β-glucans into glucose monomers, thereby facilitating cellulose breakdown [4,5]. For instance, the codling moth Cydia pomonella employs GH1 enzymes to degrade hemicellulose released from plant cell walls into monosaccharides, facilitating cellulose digestion [6]. In addition, GH1 enzymes are also involved in the detoxification of phytotoxin precursors by specifically hydrolyzing glycosidic bonds in plant defensive secondary metabolites, such as cyanogenic glycosides and glucosinolates [7]. This enzymatic activity mitigates toxicity and enables larvae to feed on chemically defended plants. A notable example is the cabbage white butterfly Pieris rapae, which uses GH1 enzymes to cleave the thioglucosidic bonds of glucosinolates, converting toxic precursors into less harmful nitriles [8]. The integration of these functions not only underscores the dual role of GH1 in energy acquisition and defensive detoxification but also reveals its evolutionary strategy in enabling herbivorous insects to overcome both the physical barriers and chemical defenses of plants.
Despite the functional importance of GH1, the evolutionary dynamics of this gene family in Lepidoptera and its potential role in driving ecological adaptation to diverse plant hosts remain poorly understood. In particular, it is unclear how variations in GH1 gene copy number, duplication mode, and expression patterns contribute to differences in dietary specialization and ecological niche occupation among Lepidopteran lineages.
Glycoside hydrolase family 1 (GH1) exhibits a highly conserved catalytic mechanism across bacteria, insects, vertebrates, and plants [9]. It possesses the canonical (β/α)8 TIM barrel supersecondary structure [10]. Its active site is situated in the loop regions of β-strands within the hydrophobic core, where a catalytic triad (conserved glutamate/aspartate residues) facilitates glycosidic bond cleavage through an acid–base catalytic mechanism [11]. This structural conservation underpins the functional diversity of GH1 [12], while the differential fusion of auxiliary domains at its termini drives lineage-specific functional expansion in herbivorous insects during adaptation-driven evolution [13].
This study employed a comprehensive analysis of the GH1 gene family in 61 Lepidoptera genomes, representing a broad taxonomic and ecological spectrum, to investigate the adaptive evolution of the GH1 gene family in insect–plant interactions. After exhaustively annotating the GH1 genes, we explored their evolutionary trajectories by inferring their phylogeny and duplication histories, as well as analyzing their duplication patterns and collinearity. We further integrated transcriptomic data across developmental stages and tissues of the silkworm (Bombyx mori) to assess the role of GH1 in mediating the intricate Lepidoptera–plant interactions, providing novel insights into the coevolutionary dynamics between insects and their host plants.

2. Materials and Methods

2.1. Data Collection

In this study, we downloaded genome data for 61 Lepidoptera species (representing a broad taxonomic and ecological spectrum) from the NCBI database (Table 1). The quality of genome assemblies was assessed using BUSCO v5.4.3 and the insecta_odb10 database [14], with genomic data filtered based on a completeness threshold of 95%. A transcriptomic dataset for the silkworm (B. mori) was obtained from the NCBI SRA database (BioProject ID: PRJNA559726). This dataset encompasses transcriptomes from ten developmental stages (4th instar day 3, fourth larval molting, 5th instar day 0, 5th instar day 3, wandering, pre-pupa, pupa day 1, pupa day 4, pupa day 7–8, and moth day 1) and 16 body tissues (anterior silk gland, middle silk gland, posterior silk gland, testis, ovary, midgut, fat body, malpighian tubules, hemolymph, trachea, epidermis, head, thorax, antennae, legs, and wings) [15].

2.2. Genome-Wide Identification of GH1

The GH1 family genes were identified from genomic data in the RefSeq and GenBank databases using distinct strategies. For RefSeq data, the longest transcript isoform of each gene was first extracted as the representative sequence using the R package orthologr [16]. Subsequently, the protein sequences encoded by these transcripts were subjected to GH1 prediction using the run_dbcan tool v4.14. This tool integrates three methods—HMMER, Diamond, and dbCAN_sub [17]—and only genes encoding proteins with consistent predictions across all three methods were classified as GH1 family members.
For GenBank data, we employed a combined approach of homology prediction and run_dbcan analysis to identify GH1 genes. Firstly, CD-HIT v4.8.1 [18] was used to cluster GH1 protein sequences predicted from RefSeq genomes with a sequence identity threshold of 0.95 and a word size of 5, constructing a non-redundant GH1 database. Subsequently, genblastG was utilized to perform homology alignment between GenBank genomic data and the non-redundant GH1 database to identify potential GH1 genes. CDS sequences lacking start or stop codons were filtered using GffRead v0.12.7 [19], and redundant sequences were removed. For GH1 gene models with overlapping genomic positions, the model with the highest genblastG score was selected as the final candidate. Finally, following the same annotation pipeline as applied to RefSeq data, run_dbcan was used to further validate the protein sequences of the filtered GH1 gene models. Only gene models encoding proteins annotated as GH1 through this pipeline were retained as high-confidence GH1 genes.

2.3. Gene Tree Inference

To infer the phylogenetic relationships of GH1 genes in Lepidoptera, we aligned the predicted GH1 protein sequences using MAFFT v7.520 [20] and MUSCLE v3.8.1551 [21]. The alignment was subsequently refined with rascal v1.34 [22], and both the raw and refined alignments were scored using normd v1.2. The highest-scoring alignment was selected for phylogenetic tree construction via the maximum likelihood method implemented in IQ-TREE v2.2.0 [23] with 1000 ultrafast bootstrap replicates and the NQ insect substitution model. Subsequently, we categorized the GH1 genes into groups by using Possvm v1.2 with default settings, which uses species overlap and Markov clustering algorithms to cluster the gene families into orthology clusters [24]. Finally, the phylogenetic tree was visualized using iTOL v7 [25].

2.4. Gene Duplication and Loss Inference

To analyze changes in GH1 gene number during the evolutionary history of Lepidoptera, we reconciled the GH1 gene tree with a published species tree [26] using Notung v2.9 [27] to infer gene duplication and loss events. Parameters for Notung were set as the following default settings: loss cost = 1.0; duplication cost = 1.5; transfer cost = 3.0; co-divergence cost = 0; and edge weight threshold = 90% of the maximum edge weight.

2.5. Duplicate Mode Inference and Collinearity Analysis

Seven representative species, spanning the main Lepidopteran families, with chromosomal level genome assemblies from the RefSeq database were selected for analysis, including B. mori, Hyposmocoma kahamanoa, Ostrinia furnacalis, Pectinophora gossypiella, Bicyclus anynana, Papilio machaon, and Colias croceus. The duplication modes of GH1 genes in these species were inferred using the duplicate_gene_classifier tool in MCScanX v1.0.0 [28]. Collinearity analysis was subsequently performed with MCScanX, and Circos plots were generated using TBtools v2.119 [29] to visualize genomic collinearity.

2.6. Expression of GH1 Genes in Developmental Stages and Tissues of B. mori

Raw transcriptomic data of B. mori were subjected to quality control and filtering using Fastp v0.23.4 [30] to obtain high-quality reads. These reads were aligned to the reference genome analyzed in this study using HISAT2 v2.2.1 [31]. Gene quantification was performed using FeatureCounts v2.0.6 [32] to generate a gene expression matrix. Raw expression counts were normalized as Transcripts Per Million (TPM) values, followed by log2 (TPM + 1) transformation. Finally, the expression profiles of target genes were visualized using the pheatmap v 1.0.12 R package.
Table 1. The number of GH1 genes in Lepidoptera species.
SuperfamilyFamilyGenusSpeciesAccession No.GH1Feeding Habit
BombycoideaBombycidaeBombyxmoriGCF_014905235.120M
BombycoideaBombycidaeTrilochavariansGCA_030269945.218P
BombycoideaLasiocampidaeDendrolimuspiniGCA_949752895.110P
CopromorphoideaCarposinidaeCarposinasasakiiGCA_014607495.210P
CossoideaCossidaeZeuzerapyrinaGCA_907165235.19P
GelechioideaColeophoridaeColeophoradeauratellaGCA_958295455.110M
GelechioideaColeophoridaeColeophoraflavipennellaGCA_947284805.113
GelechioideaCosmopterigidaeHyposmocomakahamanoaGCF_003589595.115
GelechioideaGelechiidaeAnarsiainnoxiellaGCA_947563765.118
GelechioideaGelechiidaeAthripsmouffetellaGCA_947532105.114M
GelechioideaGelechiidaeCarpatolechiafugitivellaGCA_951230895.18P
GelechioideaGelechiidaePectinophoragossypiellaGCF_024362695.110P
GelechioideaGelechiidaeScrobipalpacostellaGCA_949820665.110M
GeometroideaGeometridaeBistonstratariusGCA_950106695.112
GeometroideaGeometridaeEulithistestataGCA_947507515.111P
GeometroideaGeometridaeHemistolachrysoprasariaGCA_947063395.114M
GeometroideaGeometridaeHorismevitalbataGCA_951804965.19M
GeometroideaGeometridaeLampropteryxsuffumataGCA_948098915.116M
HesperioideaHesperiidaeCarterocephaluspalaemonGCA_944567765.118M
HesperioideaHesperiidaeErynnistagesGCA_905147235.122M
HesperioideaHesperiidaePyrgusmalvaeGCA_911387765.116M
HesperioideaHesperiidaeThymelicusacteonGCA_951805285.122M
HesperioideaHesperiidaeThymelicussylvestrisGCA_911387775.119M
IncurvarioideaAdelidaeNematopogonswammerdamellusGCA_946902875.113
IncurvarioideaIncurvariidaeIncurvariamasculellaGCA_946894095.114M
NoctuoideaErebidaeEuproctissimilisGCA_905147225.211P
NoctuoideaErebidaeLeucomasalicisGCA_948253155.113P
NoctuoideaErebidaeLymantriadisparGCA_016802235.114P
NoctuoideaErebidaeLymantriamonachaGCA_905163515.217P
NoctuoideaErebidaeOrgyiaantiquaGCA_916999025.113P
NoctuoideaNotodontidaeClosteracurtulaGCA_905475355.28M
NoctuoideaNotodontidaeFurculafurculaGCA_911728495.117P
NoctuoideaNotodontidaeNotodontadromedariusGCA_905147325.114P
NoctuoideaNotodontidaePhalerabucephalaGCA_905147815.29P
NoctuoideaNotodontidaePtilodoncapucinusGCA_914767695.110
PapilionoideaLycaenidaeAriciaagestisGCF_905147365.129P
PapilionoideaLycaenidaeCelastrinaargiolusGCA_905187575.213P
PapilionoideaLycaenidaeCyanirissemiargusGCA_905187585.118P
PapilionoideaLycaenidaeLycaenaphlaeasGCA_905333005.221P
PapilionoideaLycaenidaePolyommatusicarusGCA_937595015.124P
PapilionoideaNymphalidaeBicyclusanynanaGCF_947172395.135M
PapilionoideaNymphalidaeDanausplexippusGCF_009731565.119M
PapilionoideaNymphalidaeMelitaeacinxiaGCF_905220565.126M
PapilionoideaNymphalidaeNymphalisioGCF_905147045.113P
PapilionoideaNymphalidaeParargeaegeriaGCF_905163445.117M
PapilionoideaPapilionidaeBattusphilenorGCA_028537555.118P
PapilionoideaPapilionidaeIphiclidespodaliriusGCA_933534255.120P
PapilionoideaPapilionidaePapiliomachaonGCF_912999745.118M
PapilionoideaPieridaeColiascroceusGCF_905220415.122M
PapilionoideaPieridaeLeptideasinapisGCF_905404315.142M
PapilionoideaPieridaePierisrapaeGCF_905147795.121M
PapilionoideaPieridaePierisbrassicaeGCF_905147105.125P
PapilionoideaPieridaePierisnapiGCF_905475465.127M
PyraloideaCrambidaeCalamotrophapaludellaGCA_927399485.111M
PyraloideaCrambidaeChilosuppressalisGCA_902850365.218M
PyraloideaCrambidaeCnaphalocrocismedinalisGCA_014851415.112P
PyraloideaCrambidaeOstriniafurnacalisGCF_004193835.315P
SesioideaChoreutidaeChoreutisnemoranaGCA_949316135.19M
YponomeutoideaArgyresthiidaeArgyresthiagoedartellaGCA_949825045.113M
YponomeutoideaLyonetiidaeLeucopteracoffeellaGCA_030578115.110M
ZygaenoideaLimacodidaeApodalimacodesGCA_946406115.123M
P: polyphagous, M: monophagous. The feeding habits of the Lepidopteran species were defined based on data from the HOSTS database and a previously published study [33]. A species is categorized as polyphagous if it feeds on plants from more than one family.

3. Results

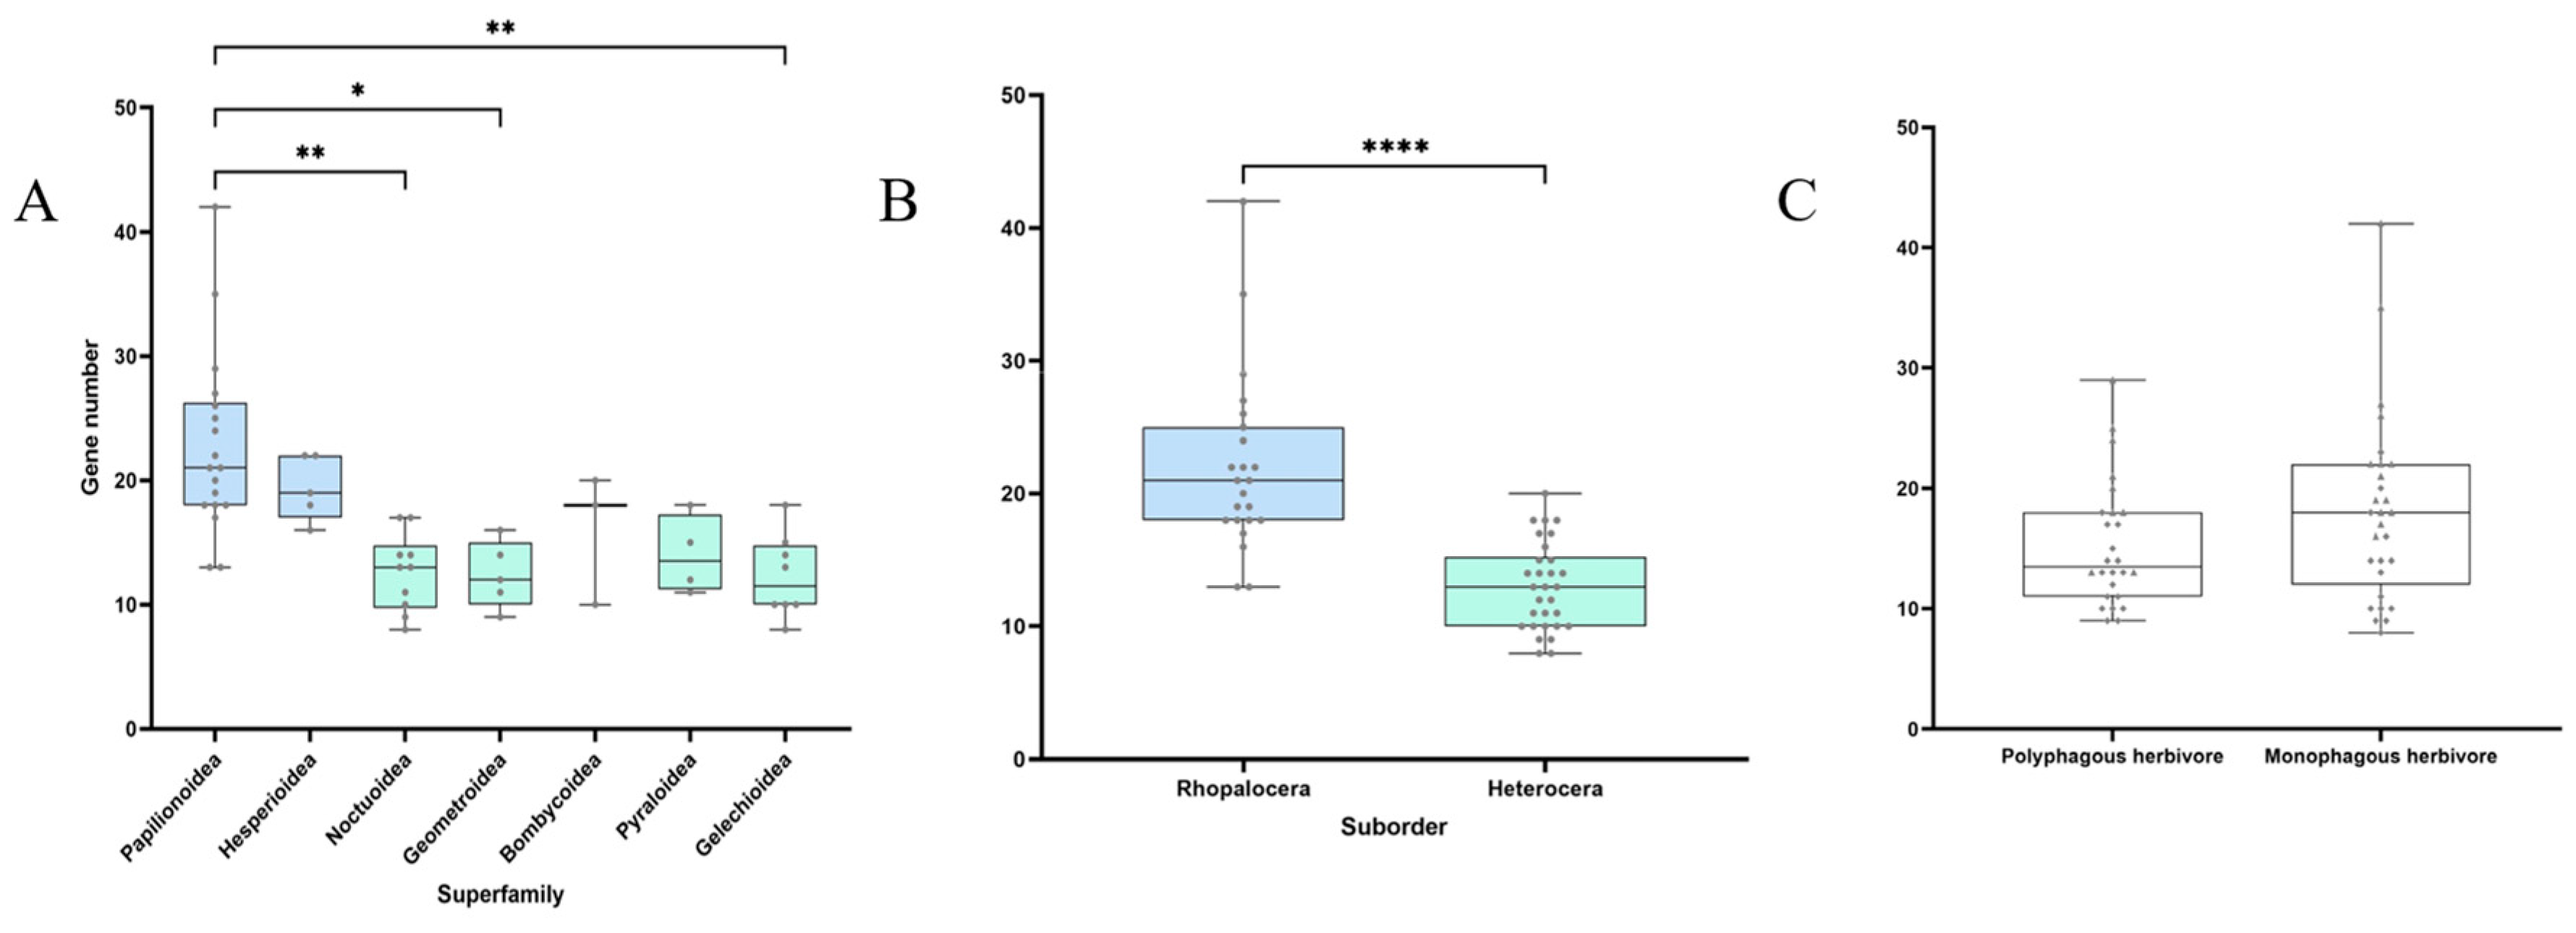
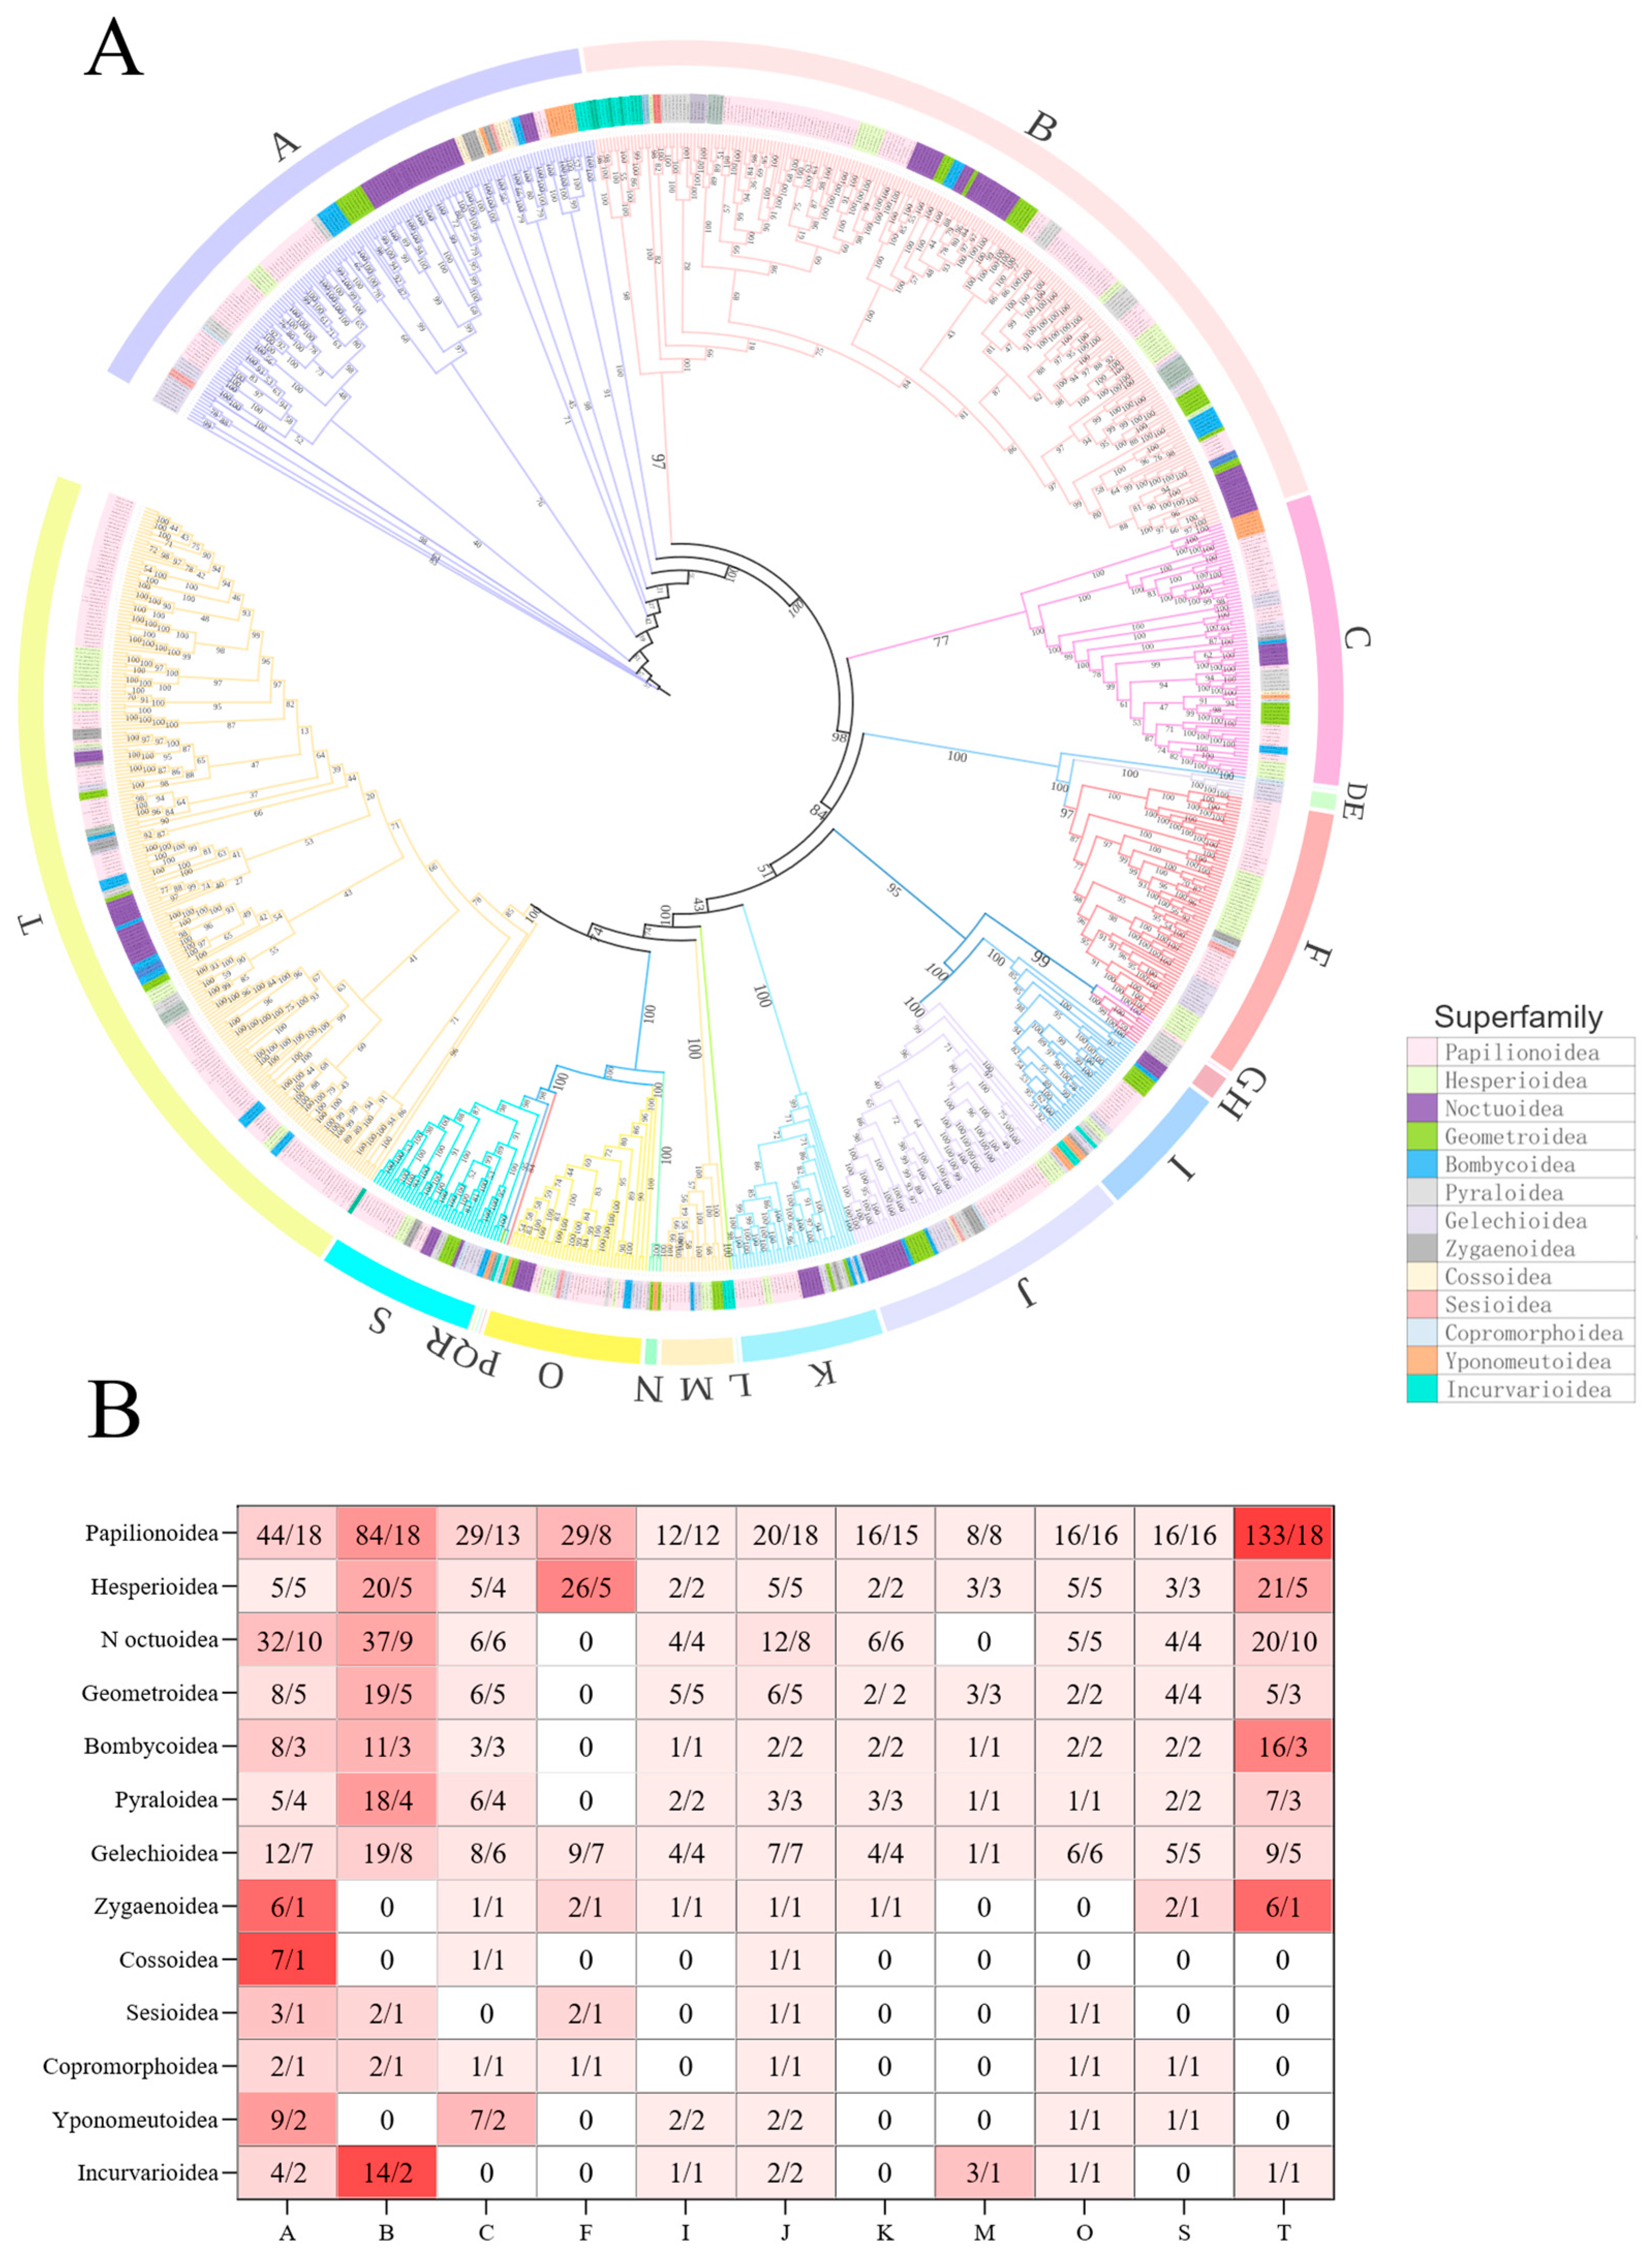
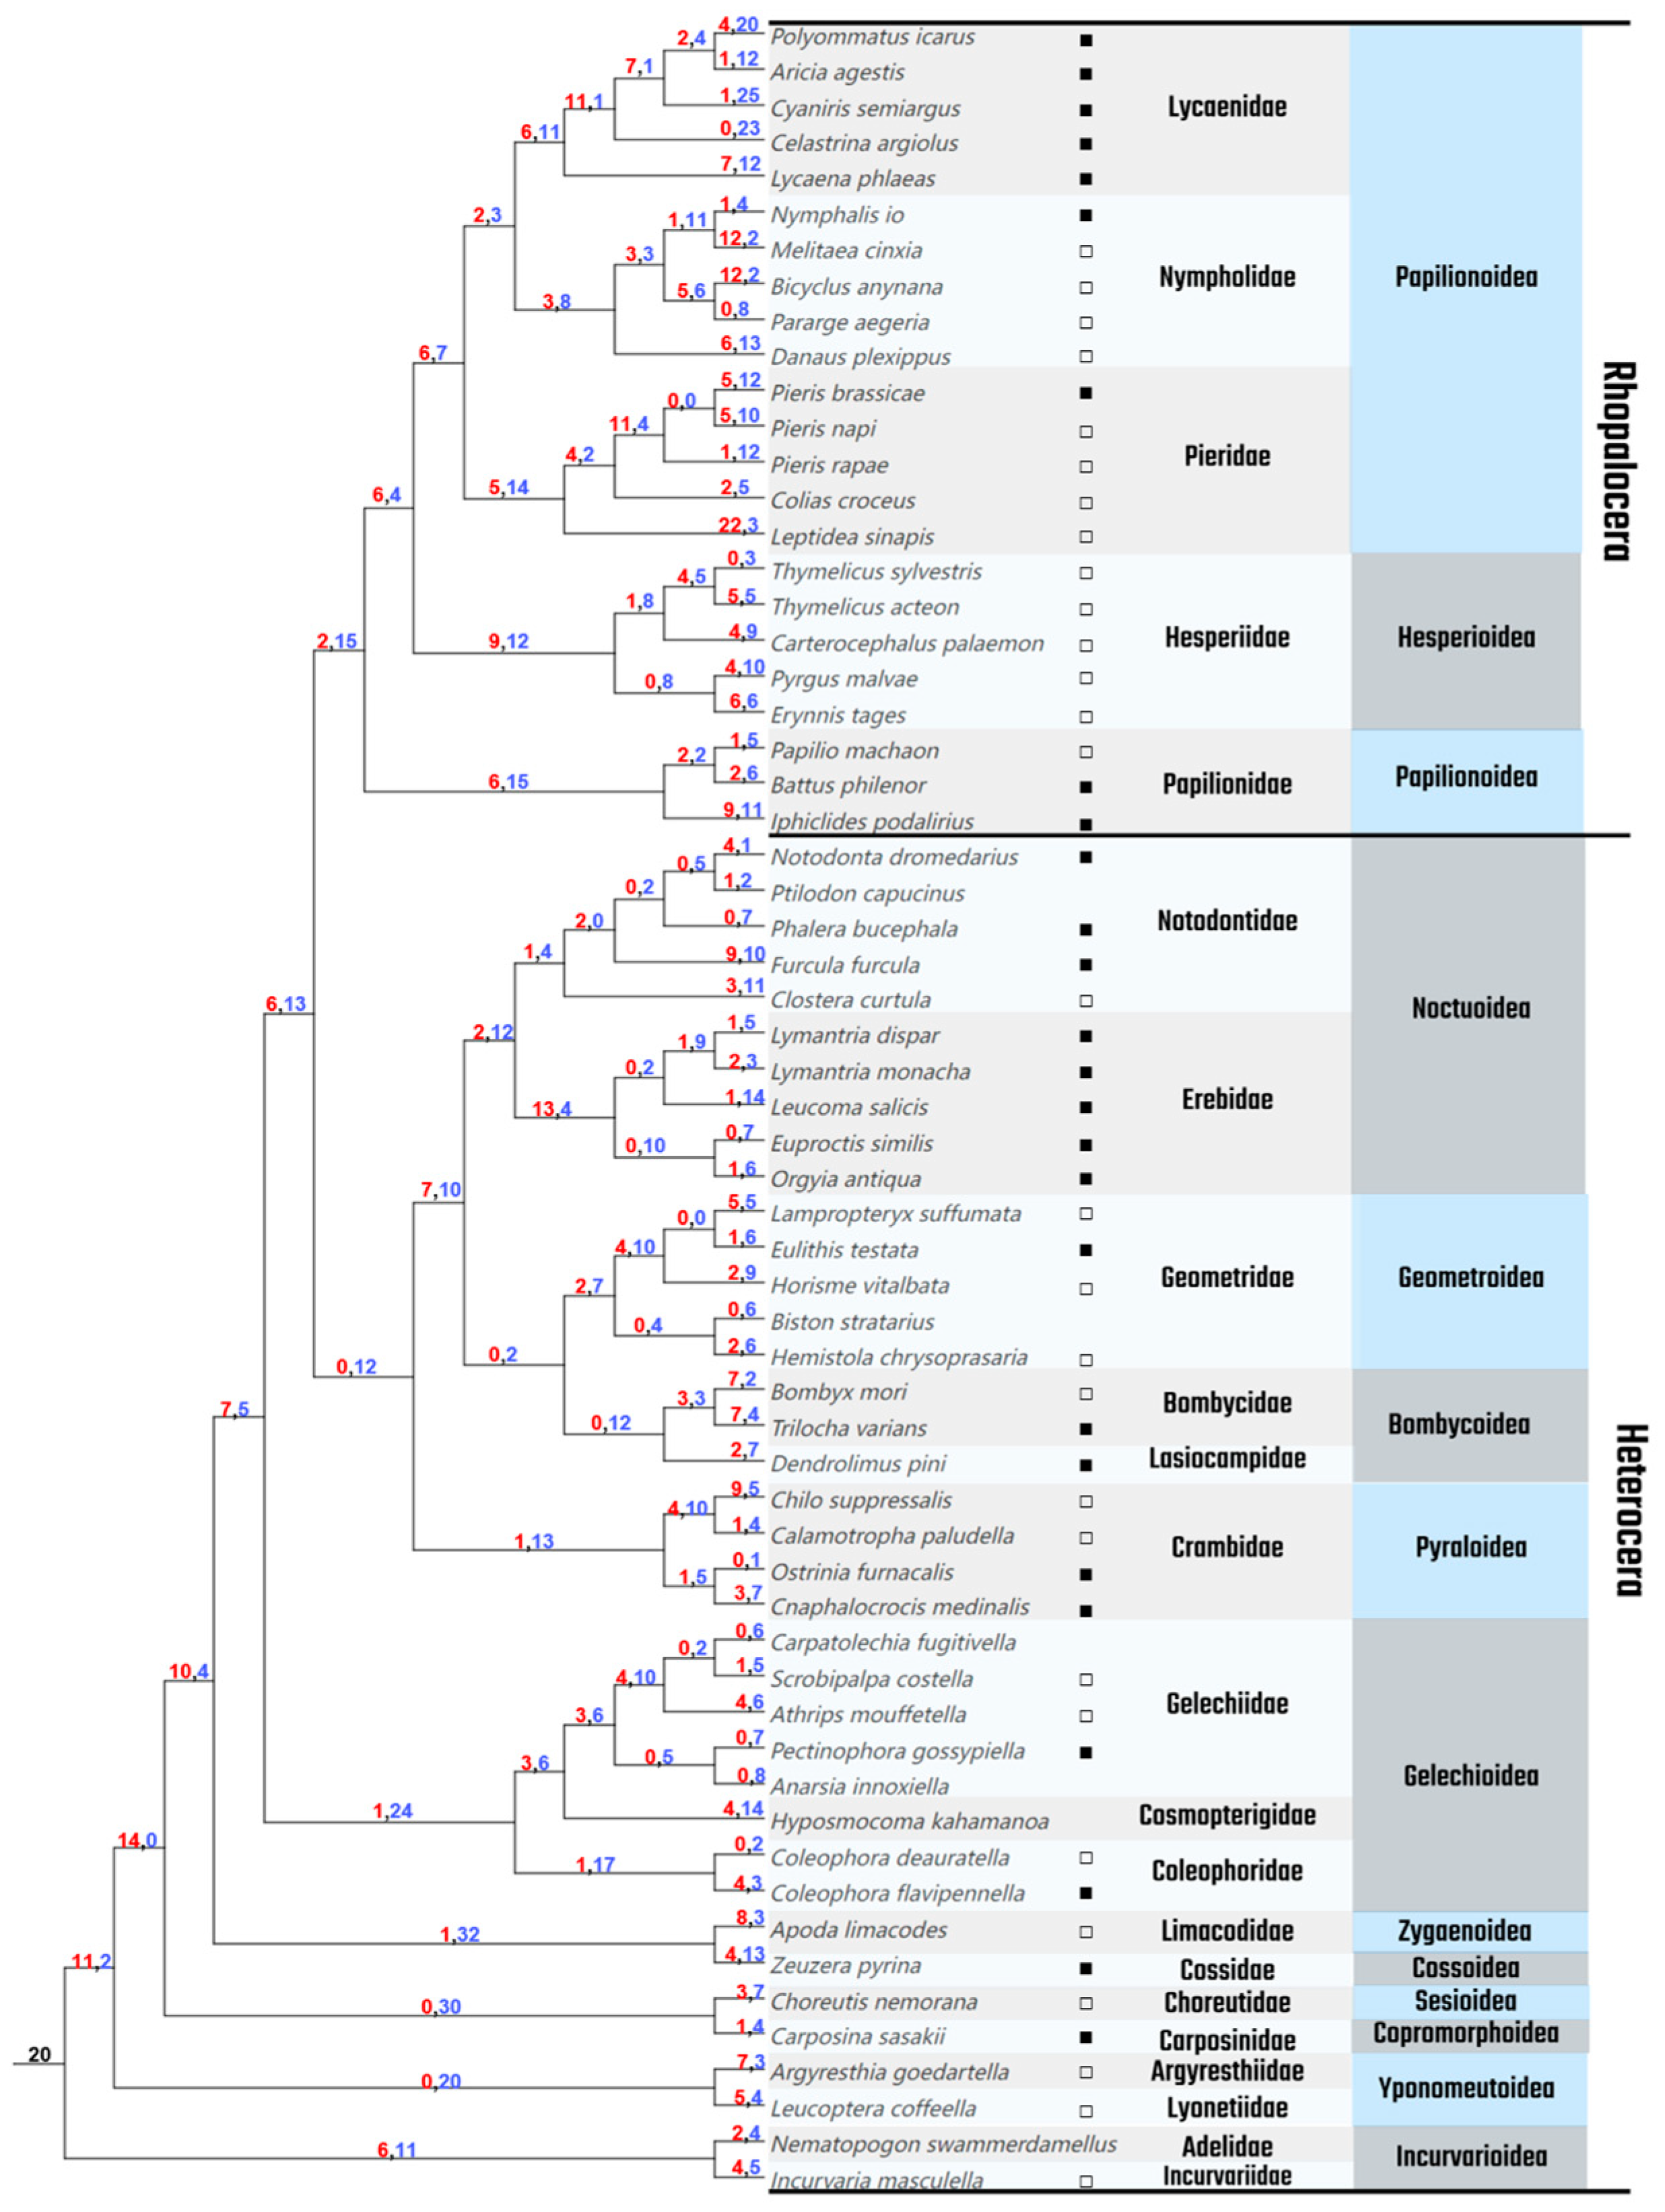
3.1. Phylogenetic Tree of Lepidoptera

We identified a total of 996 GH1 genes across 61 Lepidopteran genomes, with an average of approximately 16 copies per species (Table 1). Among these, Leptidea sinapis exhibited the highest number of GH1 genes (42), while Carpatolechia fugitivella and Clostera curtula had the lowest (8 copies each). The number of GH1 genes varied significantly across superfamilies (Kruskal–Wallis test, p < 0.0001). The superfamilies Papilionoidea, Hesperioidea, and Zygaenoidea showed relatively higher average GH1 gene numbers (~20 copies), with Papilionoidea displaying the highest average gene number (~23 copies; Figure 1) and significantly different from Noctuoidea, Geometroidea, and Gelechioidea (Dunn’s test, adjusted p = 0.0012, 0.0276, and 0.0024, respectively). In contrast, the superfamilies Cossoidea, Sesioidea, and Copromorphoidea had low average gene numbers (9–10 copies; Table 1). Notably, within Papilionoidea, GH1 gene numbers varied substantially among species, ranging from 13 copies in Celastrina argiolus to 42 copies in Leptidea sinapis. By comparison, other superfamilies exhibited more consistent GH1 gene counts. In addition, the GH1 gene numbers between the two suborders, Rhopalocera and Heterocera, were significantly different from each other (Mann–Whitney test, p < 0.0001).
The phylogenetic tree of GH1 genes in Lepidoptera (Figure 2A) reveals a complex architecture within this gene family. Based on species overlap and clustering in the gene tree, we classified GH1 genes into 20 groups (Group A–T) with 11 main groups. The main groups represent the majority of the genes, and the other nine groups only contain 22 GH1 genes. Groups A and I include members from all Lepidopteran superfamilies (Figure 2B). Groups B, F, and T are predominantly composed of GH1 genes from butterfly-associated superfamilies. Groups C, I, O, and S also exhibit high diversity, containing GH1 genes from 10 to 11 superfamilies but lack representatives from certain superfamilies. For instance, Group C lacks Sesioidea and Incurvarioidea, while Group I lacks Sesioidea, Cossoidea, and Copromorphoidea. Groups F, K, and M display low diversity, encompassing GH1 genes from six to eight Lepidopteran superfamilies. Interestingly, over half of Group T is composed of GH1 genes from the Papilionoidea superfamily. In the minority groups, most of the genes are from moths, except for only one gene from Danaus plexippus.
The distribution of GH1 genes across phylogenetic trees exhibited marked differences among Lepidopteran taxa, with notable incongruence between gene trees and species trees. GH1 genes from moths were predominantly clustered in Groups A, B, and T, while those from butterflies were distributed more frequently in Groups A, B, F, and T.
Notably, species of the superfamily Papilionoidea were represented in all the main groups. Additionally, species-specific gene distribution patterns were observed, for instance, genes of Zeuzera pyrina were sparsely represented in Groups A, C, and J, whereas those of Choreutis nemorana occurred in limited numbers across Groups A, B, F, J, and O. These patterns underscore the extensive diversity within the GH1 gene family.

3.2. Gene Duplications and Losses

Through evolutionary inference of duplication and loss events in multi-copy gene families across Lepidoptera, we found that the GH1 gene family has undergone frequent gene duplication and loss during its evolutionary history. The ancestral Lepidopteran lineage likely harbored 20 GH1 gene copies, with significant duplication expansions occurring near early branching nodes (Figure 3). However, as evolution progressed, GH1 genes exhibited extensive loss across most internal evolutionary nodes, particularly those closer to terminal branches. In families such as Lyonetiidae, Argyresthiidae, Carposinidae, Choreutidae, Cossidae, and Limacodidae, nearly 30 GH1 genes were lost within their internal evolutionary nodes. Terminal branches in the Lycaenidae family retained only a limited number of duplications (0–7) but experienced substantial losses (12–25). In contrast, species in the Pieridae family displayed relatively active duplication activity, with internal nodes showing 0–11 duplications and terminal branches reaching up to 22 duplications (Leptidea sinapis). Notably, butterfly clades exhibited significantly higher GH1 duplication rates compared to moth lineages.

3.3. Duplication Modes and Collinearity Analysis

To investigate the evolutionary dynamics of GH1 genes, we analyzed duplication modes and collinearity across seven representative species. The majority of GH1 genes in these species originated from tandem duplications and dispersed duplications, with only a small number of proximal duplications identified in B. mori and Pectinophora gossypiella. Most GH1 genes were located in conserved syntenic regions shared among these taxa (Figure 4), except for minor dispersed duplications in B. mori, P. gossypiella, and Colias croceu, as well as limited dispersed or tandem duplications in Hyposmocoma kahamanoa, Ostrinia furnacalis, and Bicyclus anynana. Furthermore, syntenic GH1 genes within the same genomic block were predominantly tandem duplicates, while dispersed duplicates were largely distributed across non-collinear regions.

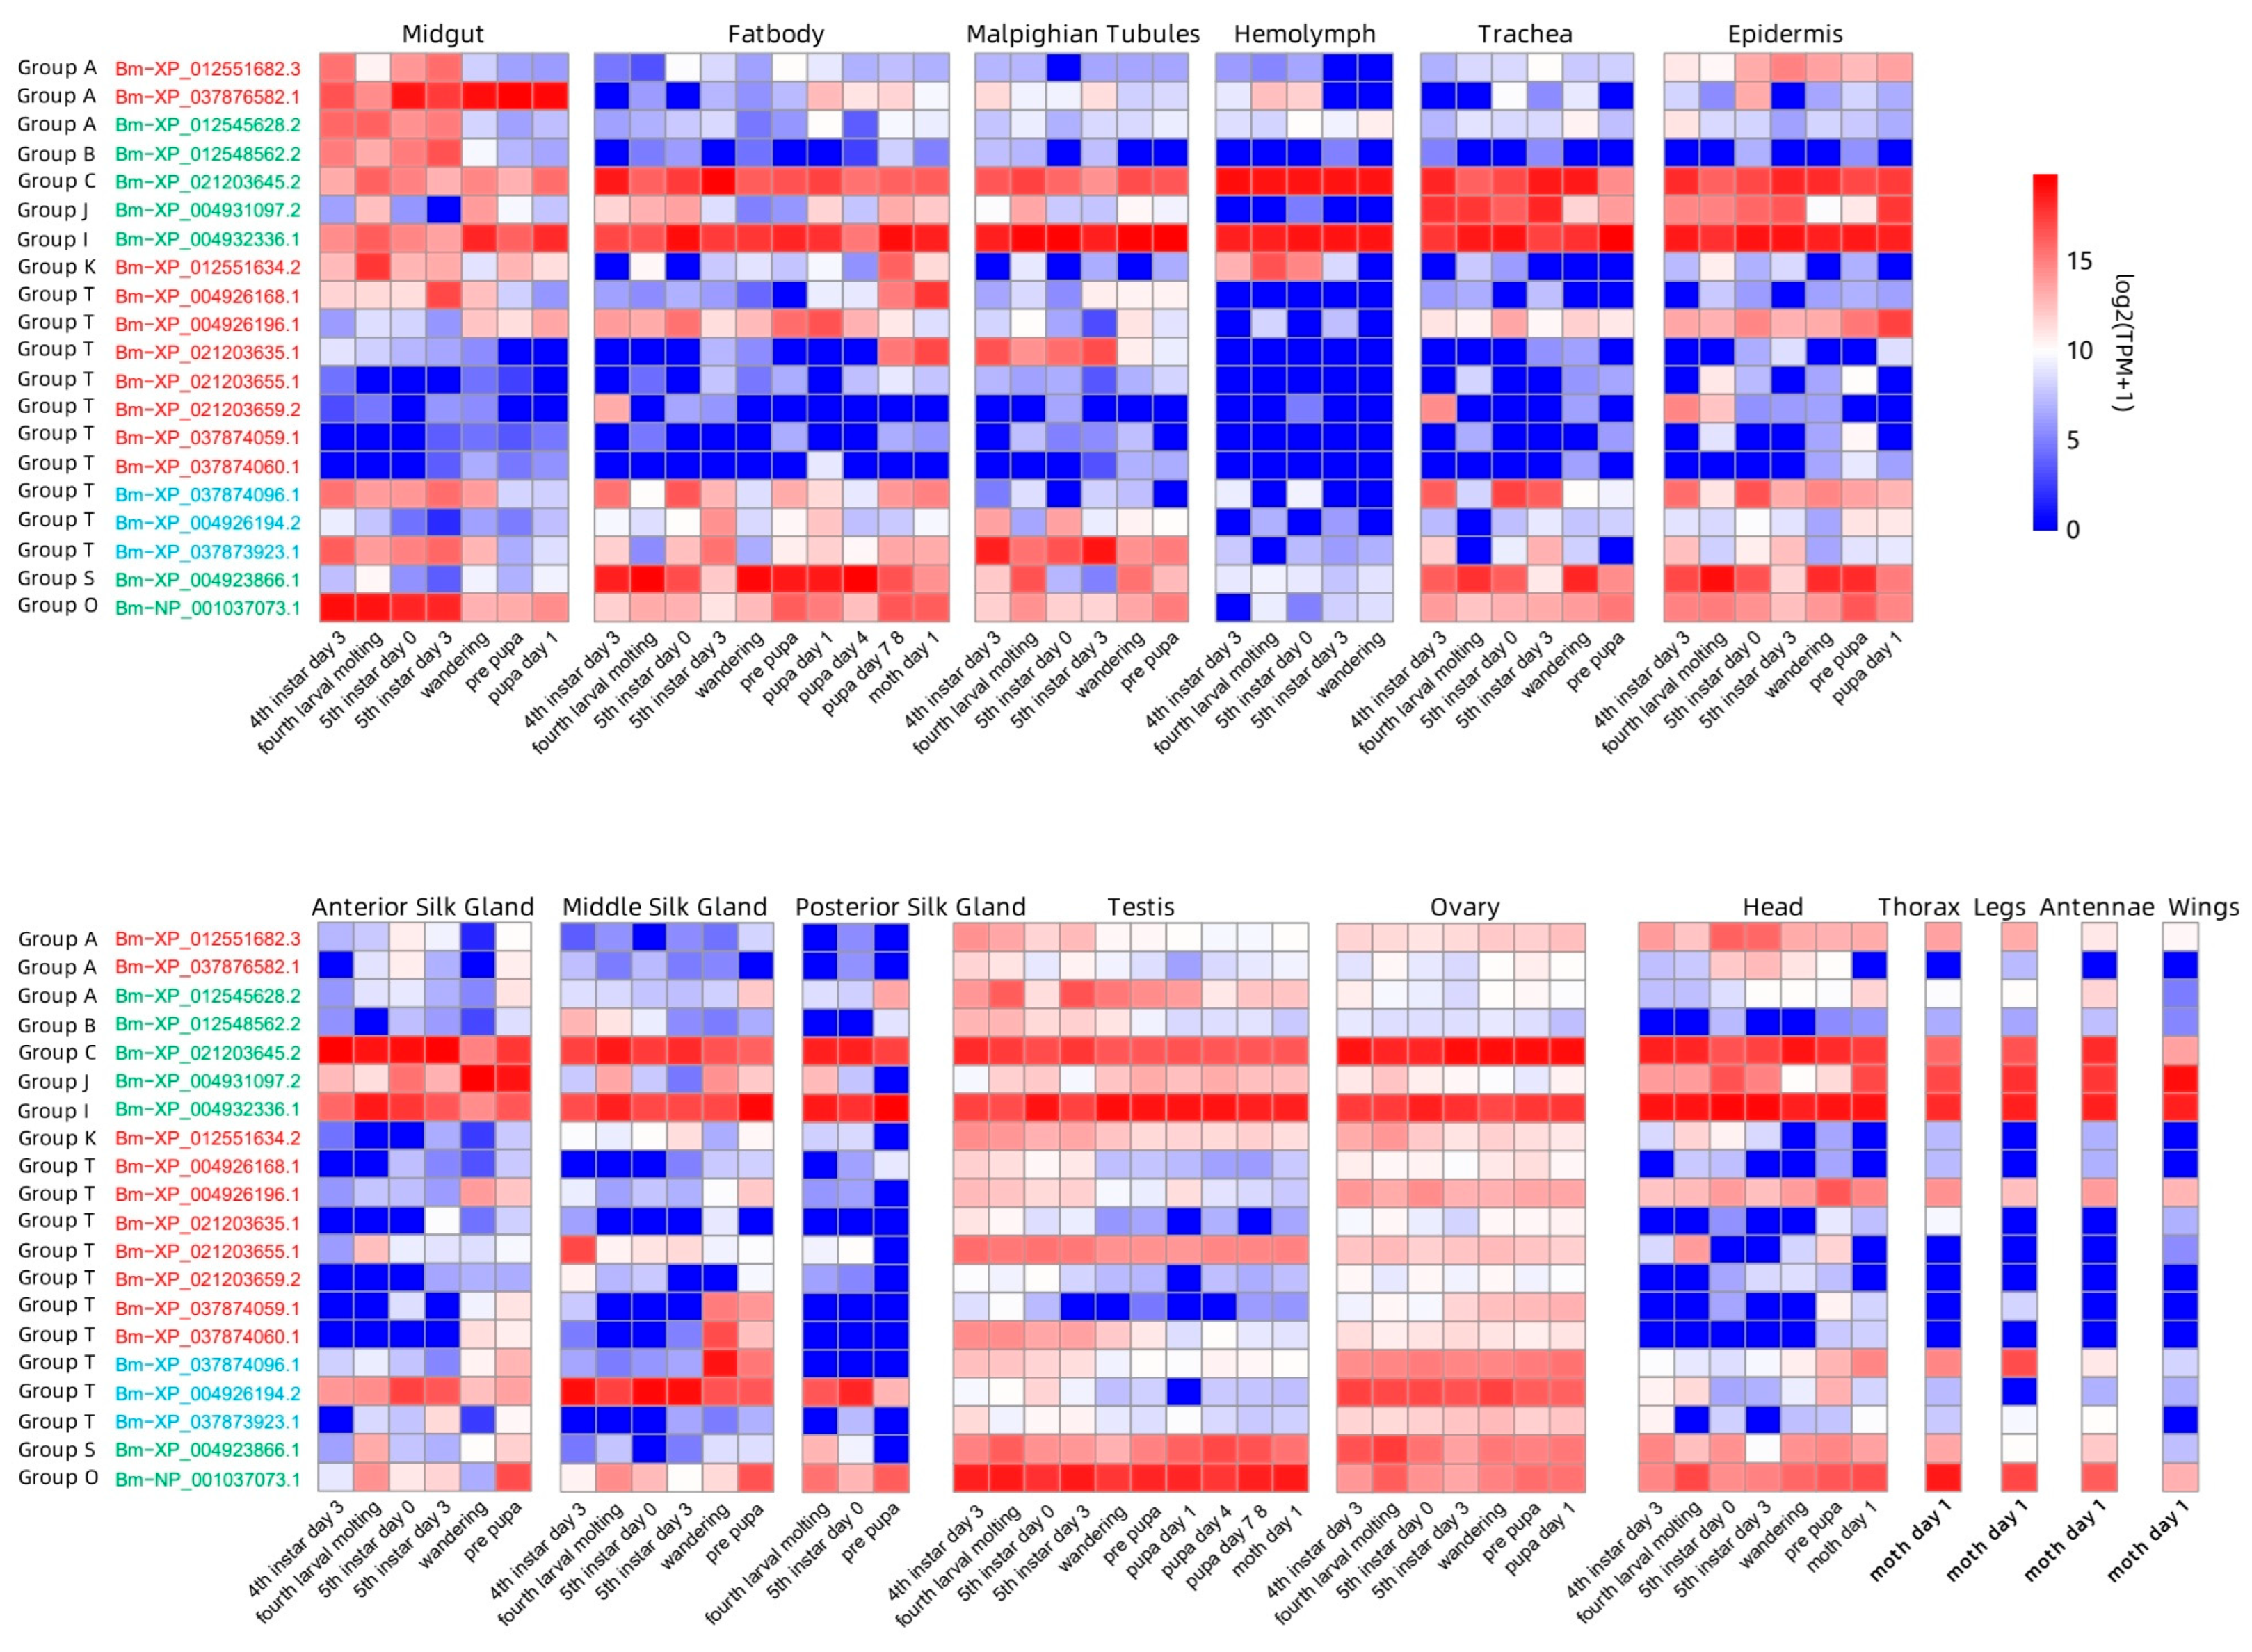
3.4. Expression of GH1 Genes in the Developmental Stages and Tissues of B. mori

From the perspectives of developmental stages and tissue distribution, GH1 genes exhibited the highest expression levels during the larval stage, followed by the pupal stage, with the lowest expression observed in the adult stage. Tissue-specific analysis revealed that GH1 expression ranked highest in the testis, followed by relatively high expression in the midgut and fat body, while the posterior silk gland showed the lowest expression levels.
According to the analysis in the previous section, the GH1 genes in B. mori are distributed among most phylogenetic groups except Groups F and M. Distinct gene duplication patterns are evident across these groups, correlating with divergent expression profiles. The GH1 genes resulting from tandem duplication in Group A exhibit high expression in the midgut. Notably, Bm-XP_037876582.1 is specifically expressed in the midgut across different developmental stages, while Bm-XP_012551682.3 shows relatively high expression in the larval midgut. The other Group A GH1 gene, generated by dispersed duplication, is specifically expressed in the larval midgut and the testes across various developmental stages of B. mori. Bm-XP_021203645.2 from Group C and Bm-XP_004932336.1 from Group I displayed consistently high expression in all the analyzed tissues and developmental stages. In Group J, Bm-XP_004931097.2 shows elevated expression in the trachea, epidermis, anterior silk gland, head, thorax, legs, antennae, and wings of B. mori. In contrast, the genes generated through tandem duplication in Group K are predominantly expressed in the midgut and hemolymph during the larval stage. Furthermore, Group T comprises approximately half of the GH1 genes, primarily arising from tandem duplications and a few from proximal duplications, which demonstrate certain stage- and tissue-specific expression patterns. For instance, Bm-XP_004926168.1 is highly expressed in the larval midgut, while it is lowly expressed in the testes and ovaries. Bm-XP_004926196.1 shows relatively high expression in the fat body, epidermis, ovary, and head across developmental stages, as well as in the thorax, legs, antennae, and wings of adults. Similarly, Bm-XP_0221203635.1 shows high expression in the larval Malpighian tubules, while Bm-XP_037873923.1 displays elevated expression in the larval midgut and Malpighian tubules. Furthermore, Bm-XP_004926194.2 is highly expressed in the silk gland and ovary of B. mori. The GH1 genes from Group S and O derived from dispersed duplication are highly expressed across most of the tissues except the hemolymph and silk gland.

4. Discussion

The present study provides a comprehensive understanding of glycoside hydrolase family 1 (GH1) evolution in Lepidoptera and reveals how dynamic changes in this gene family align with dietary ecology and coevolutionary pressures. In this study, the evolutionary history of the GH1 gene family in Lepidoptera was systematically deciphered by integrating genomic data across 61 species. The number of GH1 genes in Lepidoptera is relatively conserved, and species with closer genetic relationships have similar numbers of GH1 genes. However, significant differences were observed across superfamilies, which may correlate with their feeding strategies and dietary preferences. Superfamilies such as Papilionoidea harbored higher GH1 gene numbers, likely reflecting adaptations to cellulose-rich foliage or chemical defenses in host plants. For instance, Pieridae larvae predominantly feed on Brassicaceae plants that produce glucosinolate-potent defensive compounds, which are hydrolyzed by myrosinase to toxic metabolites like isothiocyanates (ITCs), nitriles, and thiocyanates upon tissue damage. These compounds inhibit larval growth or directly kill insects [34]. On the contrary, several insects such as Pieris rapae developed a particular detoxification mechanism utilizing GH1 enzymes to hydrolyze glucosinolate thioglucosidic bonds, converting toxic precursors into less harmful nitriles [8]. This allows them to circumvent plant myrosinase-based defenses and feed on Brassicaceae plants. In contrast, certain superfamilies, such as Cossoidea, Sesioidea, and Copromorphoidea possess fewer GH1 gene numbers; their larvae typically feed on low-fiber or minimally defended plant tissues. For example, Carposina sasakii preferentially bores into young or early-maturing fruits (e.g., apples, peaches), which are soft, low in cellulose, and deficient in chemical defenses like tannins in mature fruits [35]. These GH1 copy number differences across lineages reflect adaptations to ecological niches, particularly in digesting and detoxifying dietary components, which have driven the GH1 gene family evolution.
This adaption may be linked to the frequent gene duplication and loss events within the GH1 gene family in Lepidoptera. These dynamic changes in the GH1 gene repertoire suggest a significant role for this gene family in mediating the complex interactions between Lepidopteran insects and their host plants [26]. For instance, phylogenetic analysis reveals that butterflies possess significantly higher numbers of GH1 gene copies compared to moths (Figure 3), a divergence that may correlate with differences in dietary specialization.
Lepidoptera–plant interactions are often described as an evolutionary arms race. The ancestral Lepidoptera fed on non-vascular land plants [26], relying on plant tissues with low fiber content and minimal secondary metabolites. The emergence of angiosperms [36] and their diversified chemical defenses (e.g., alkaloids, terpenoids) [37,38] and structural adaptations (e.g., lignified cell walls) [39] drove the differentiation of feeding strategies in Lepidoptera. Most butterfly larvae (e.g., Hesperiidae) evolved highly specialized diets, often restricted to specific plant families or genera [40], whereas many moth larvae (e.g., Erebidae) retained generalist feeding habits, displaying diverse dietary patterns. Building on these observations, we propose that butterflies may leverage GH1 gene duplications to drive functional innovations such as the specialized cleavage of host plant toxins, enabling adaptation to highly defended, narrow ecological niches. In contrast, moths, which often exhibit broader feeding preferences or primarily consume low-cellulose plants, may rely on generalized detoxification systems (e.g., cytochrome P450 enzymes, carboxylesterases) [41] rather than GH1-mediated specificity, reducing their dependence on GH1 for detoxification and facilitating adaptation to diverse, low-defense environments. These findings collectively highlight the pivotal role of the GH1 gene family in the adaptive evolution of Lepidoptera. The colinear block localization of most GH1 members (Figure 4) and their predominant tandem duplication patterns further establish a molecular evolutionary framework underpinning plant–insect interactions.
The GH1 genes in Lepidopteran insects are mainly amplified through tandem duplication (Figure 4). Such duplicated genes usually exhibit high expression activity [42], which enhances the expression efficiency of the gene family. Lepidopterans achieve the spatiotemporal specificity of their physiological functions by regulating the expression of the GH1 gene family. The heatmap of the expression of GH1 genes in the silkworm (B. mori) shows that there is a certain specificity in tissue expression. The relatively high expression in the midgut and fat body (Figure 5) suggests that it may be involved in nutrient absorption in the midgut and energy metabolism in the fat body [43,44], while the high-level expression in the testis may be related to the morphological changes in the testis during the metamorphosis period and may also be related to the development of the testis and the formation of sperm [45]. In terms of the developmental timeline, the expression abundance in the larval stage is significantly higher than that in the pupal and adult stages, which may be directly related to the rapid growth in the larval stage and the demand for active feeding on plant materials [45]. It is worth noting that the specific expression of the genes classified as Groups B, C, and D in the larval midgut suggests that these groups may be mainly involved in digestion. Intriguingly, the silkworm (B. mori) lacks representatives of several clades (Groups A, F, and I). The absence of these GH1 genes in the silkworm suggests gene loss events, potentially due to its specialized diet, lacking the specific substrates or toxins that these enzymes would otherwise act upon. Gene loss can be an adaptive outcome when a function becomes superfluous; maintaining an unnecessary enzyme carries a metabolic cost and risk of deleterious mutations, so redundant GH1 copies may be purged over time in certain hosts [46]. On the other hand, other Lepidoptera lineages retain and even expand particular GH1 clades through gene duplication, implying the formation of new classifications due to the emergence of new functions [47].
This pattern highlights how gene duplication and loss shape lineage-specific adaptation; certain GH1 clades have diversified insect groups to address specific ecological challenges, while other insects have streamlined their GH1 repertoire to align with a more specialized host range. This dynamic interplay suggests that the co-evolution of gene duplication and expression regulation in the GH1 family plays a crucial role in enabling Lepidoptera to adapt to varying physiological demands and environmental conditions. Further research at the gene expression level will help to reveal the role of the GH1 gene family in the adaptation process of Lepidoptera insects.
In conclusion, the GH1 gene family plays a crucial role in the complex and dynamic interactions between insects and plants. It provides an adaptive toolkit in the Lepidopteran herbivory. The extensive distribution, diverse functions, and variation in GH1 gene copy numbers across different Lepidopteran superfamilies reflect the adaptive strategies and evolutionary trajectories these insects have developed during their interactions with plants. The expansion, diversification, and selective loss of the GH1 genes have enabled Lepidopteran insects to enhance both their digestive efficiency and overcome plant defenses. By integrating comparative genomics, phylogenetics, and gene expression data, our study provides a framework for understanding how gene family dynamics contribute to ecological diversification. The evolutionary dynamics of the GH1 family in Lepidoptera exemplify how molecular evolution underpins ecological interactions, offering a deeper understanding of how insects have become one of the most successful herbivorous groups on the planet.

Author Contributions

Conceptualization, S.H. Data curation, Y.Y., X.Z. and J.W. Formal analysis, Y.Y., X.Z. and J.W. Funding acquisition, S.H. Project administration, S.H. Resources, S.H. Supervision, S.H. Visualization, Y.Y. Writing—original draft, Y.Y. and X.Z. Writing—review and editing, J.L., Z.H., W.F., A.C. and S.H. All authors have read and agreed to the published version of the manuscript.

Funding

This research was funded by the Science and Technology Research Program of Chongqing Municipal Education Commission, grant number KJQN202200538; the Natural Science Foundation of Chongqing, grant number CSTB2022NSCQ-MSX0806; and the Funds of Chongqing Normal University, grant number 22XLB028. Financial support to AC was provided by the “Excellent Team Grant (2025–2026)” from Faculty of Forestry and Wood Sciences, CZU.

Data Availability Statement

The original contributions presented in this study are included in the article. Further inquiries can be directed to the corresponding author.

Conflicts of Interest

The authors declare no conflicts of interest. The funders had no role in the design of the study; in the collection, analyses, or interpretation of data; in the writing of the manuscript; or in the decision to publish the results.

References

  1. Zhang, Z.Q. Animal biodiversity: An outline of higher-level classification and survey of taxonomic richness (Addenda 2013). Zootaxa 2013, 3703, 1–82. [Google Scholar] [CrossRef] [PubMed]
  2. Brady, D.; Saviane, A.; Cappellozza, S.; Sandrelli, F. The Circadian Clock in Lepidoptera. Front. Physiol. 2021, 12, 776826. [Google Scholar] [CrossRef] [PubMed]
  3. Howe, G.A.; Jander, G. Plant immunity to insect herbivores. Annu. Rev. Plant Biol. 2008, 59, 41–66. [Google Scholar] [CrossRef] [PubMed]
  4. Blackman, L.M.; Cullerne, D.P.; Hardham, A.R. Bioinformatic characterisation of genes encoding cell wall degrading enzymes in the Phytophthora parasitica genome. BMC Genom. 2014, 15, 785. [Google Scholar] [CrossRef] [PubMed]
  5. Payne, C.M.; Knott, B.C.; Mayes, H.B.; Hansson, H.; Himmel, M.E.; Sandgren, M.; Ståhlberg, J.; Beckham, G.T. Fungal cellulases. Chem. Rev. 2015, 115, 1308–1448. [Google Scholar] [CrossRef] [PubMed]
  6. Luo, C.; Li, Y.; Liao, H.; Yang, Y. De novo transcriptome assembly of the bamboo snout beetle Cyrtotrachelus buqueti reveals ability to degrade lignocellulose of bamboo feedstock. Biotechnol. Biofuels 2018, 11, 292. [Google Scholar] [CrossRef] [PubMed]
  7. Pentzold, S.; Zagrobelny, M.; Rook, F.; Bak, S. How insects overcome two-component plant chemical defence: Plant β-glucosidases as the main target for herbivore adaptation. Biol. Rev. Camb. Philos. Soc. 2014, 89, 531–551. [Google Scholar] [CrossRef] [PubMed]
  8. Pentzold, S.; Zagrobelny, M.; Bjarnholt, N.; Kroymann, J.; Vogel, H.; Olsen, C.E.; Møller, B.L.; Bak, S. Metabolism, excretion and avoidance of cyanogenic glucosides in insects with different feeding specialisations. Insect Biochem. Mol. Biol. 2015, 66, 119–128. [Google Scholar] [CrossRef] [PubMed]
  9. Henrissat, B.; Davies, G. Structural and sequence-based classification of glycoside hydrolases. Curr. Opin. Struct. Biol. 1997, 7, 637–644. [Google Scholar] [CrossRef] [PubMed]
  10. Sanz-Aparicio, J.; Hermoso, J.A.; Martínez-Ripoll, M.; Lequerica, J.L.; Polaina, J. Crystal structure of beta-glucosidase A from Bacillus polymyxa: Insights into the catalytic activity in family 1 glycosyl hydrolases. J. Mol. Biol. 1998, 275, 491–502. [Google Scholar] [CrossRef] [PubMed]
  11. Davies, G.; Henrissat, B. Structures and mechanisms of glycosyl hydrolases. Structure 1995, 3, 853–859. [Google Scholar] [CrossRef] [PubMed]
  12. Cantarel, B.L.; Coutinho, P.M.; Rancurel, C.; Bernard, T.; Lombard, V.; Henrissat, B. The Carbohydrate-Active EnZymes database (CAZy): An expert resource for glycogenomics. Nucleic Acids Res. 2009, 37, D233–D238. [Google Scholar] [CrossRef] [PubMed]
  13. Kotliński, M.; Knizewski, L.; Muszewska, A.; Rutowicz, K.; Lirski, M.; Schmidt, A.; Baroux, C.; Ginalski, K.; Jerzmanowski, A. Phylogeny-Based Systematization of Arabidopsis Proteins with Histone H1 Globular Domain. Plant Physiol. 2017, 174, 27–34. [Google Scholar] [CrossRef] [PubMed]
  14. Waterhouse, R.M.; Seppey, M.; Simão, F.A.; Manni, M.; Ioannidis, P.; Klioutchnikov, G.; Kriventseva, E.V.; Zdobnov, E.M. BUSCO Applications from Quality Assessments to Gene Prediction and Phylogenomics. Mol. Biol. Evol. 2018, 35, 543–548. [Google Scholar] [CrossRef] [PubMed]
  15. Lu, F.; Wei, Z.; Luo, Y.; Guo, H.; Zhang, G.; Xia, Q.; Wang, Y. SilkDB 3.0: Visualizing and exploring multiple levels of data for silkworm. Nucleic Acids Res. 2020, 48, D749–D755. [Google Scholar] [CrossRef] [PubMed]
  16. Drost, H.G.; Gabel, A.; Grosse, I.; Quint, M. Evidence for active maintenance of phylotranscriptomic hourglass patterns in animal and plant embryogenesis. Mol. Biol. Evol. 2015, 32, 1221–1231. [Google Scholar] [CrossRef] [PubMed]
  17. Zheng, J.; Ge, Q.; Yan, Y.; Zhang, X.; Huang, L.; Yin, Y. dbCAN3: Automated carbohydrate-active enzyme and substrate annotation. Nucleic Acids Res. 2023, 51, W115–W121. [Google Scholar] [CrossRef] [PubMed]
  18. Li, W.; Godzik, A. Cd-hit: A fast program for clustering and comparing large sets of protein or nucleotide sequences. Bioinformatics 2006, 22, 1658–1659. [Google Scholar] [CrossRef] [PubMed]
  19. Pertea, G.; Pertea, M. GFF utilities: GffRead and GffCompare. F1000Research 2020, 9, 304. [Google Scholar] [CrossRef]
  20. Katoh, K.; Standley, D.M. MAFFT Multiple Sequence Alignment Software Version 7: Improvements in Performance and Usability. Mol. Biol. Evol. 2013, 30, 772–780. [Google Scholar] [CrossRef] [PubMed]
  21. Edgar, R.C. MUSCLE: Multiple sequence alignment with high accuracy and high throughput. Nucleic Acids Res. 2004, 32, 1792–1797. [Google Scholar] [CrossRef] [PubMed]
  22. Thompson, J.D.; Thierry, J.C.; Poch, O. RASCAL: Rapid scanning and correction of multiple sequence alignments. Bioinformatics 2003, 19, 1155–1161. [Google Scholar] [CrossRef] [PubMed]
  23. Nguyen, L.T.; Schmidt, H.A.; von Haeseler, A.; Minh, B.Q. IQ-TREE: A fast and effective stochastic algorithm for estimating maximum-likelihood phylogenies. Mol. Biol. Evol. 2014, 32, 268–274. [Google Scholar] [CrossRef] [PubMed]
  24. Grau-Bové, X.; Sebé-Pedrós, A. Orthology Clusters from Gene Trees with Possvm. Mol. Biol. Evol. 2021, 38, 5204–5208. [Google Scholar] [CrossRef] [PubMed]
  25. Letunic, I.; Bork, P. Interactive Tree Of Life (iTOL) v6: Recent updates to the phylogenetic tree display and annotation tool. Nucleic Acids Res. 2024, 52, W78–W82. [Google Scholar] [CrossRef] [PubMed]
  26. Kawahara, A.Y.; Plotkin, D.; Espeland, M.; Meusemann, K.; Toussaint, E.F.A.; Donath, A.; Gimnich, F.; Frandsen, P.B.; Zwick, A.; Dos Reis, M.; et al. Phylogenomics reveals the evolutionary timing and pattern of butterflies and moths. Proc. Natl. Acad. Sci. USA 2019, 116, 22657–22663. [Google Scholar] [CrossRef] [PubMed]
  27. Durand, D.; Halldórsson, B.V.; Vernot, B. A hybrid micro-macroevolutionary approach to gene tree reconstruction. J. Comput. Biol. 2006, 13, 320–335. [Google Scholar] [CrossRef] [PubMed]
  28. Wang, Y.; Tang, H.; Debarry, J.D.; Tan, X.; Li, J.; Wang, X.; Lee, T.H.; Jin, H.; Marler, B.; Guo, H.; et al. MCScanX: A toolkit for detection and evolutionary analysis of gene synteny and collinearity. Nucleic Acids Res. 2012, 40, e49. [Google Scholar] [CrossRef] [PubMed]
  29. Chen, C.; Wu, Y.; Li, J.; Wang, X.; Zeng, Z.; Xu, J.; Liu, Y.; Feng, J.; Chen, H.; He, Y.; et al. TBtools-II: A “one for all, all for one” bioinformatics platform for biological big-data mining. Mol. Plant 2023, 16, 1733–1742. [Google Scholar] [CrossRef] [PubMed]
  30. Chen, S. Ultrafast one-pass FASTQ data preprocessing, quality control, and deduplication using fastp. Imeta 2023, 2, e107. [Google Scholar] [CrossRef] [PubMed]
  31. Kim, D.; Paggi, J.M.; Park, C.; Bennett, C.; Salzberg, S.L. Graph-based genome alignment and genotyping with HISAT2 and HISAT-genotype. Nat. Biotechnol. 2019, 37, 907–915. [Google Scholar] [CrossRef] [PubMed]
  32. Liao, Y.; Smyth, G.K.; Shi, W. featureCounts: An efficient general purpose program for assigning sequence reads to genomic features. Bioinformatics 2014, 30, 923–930. [Google Scholar] [CrossRef] [PubMed]
  33. Breeschoten, T.; van der Linden, C.F.; Ros, V.I.; Schranz, M.E.; Simon, S. Expanding the menu: Are polyphagy and gene family expansions linked across Lepidoptera? Genome Biol. Evol. 2022, 14, evab283. [Google Scholar] [CrossRef] [PubMed]
  34. Shields, V.D. Deterrents and Their Effects on the Feeding Behavior and Sensory Physiology of Insects. In Arthropods-New Advances and Perspectives; IntechOpen: London, UK, 2023. [Google Scholar]
  35. Alhassan, I.; Çoklar, H.; Akbulut, M. Determination of some physical, chemical and nutritional properties in the peel and flesh of three crab apple species at five edible maturity stages. Braz. Arch. Biol. Technol. 2023, 66, e23220427. [Google Scholar] [CrossRef]
  36. Labandeira, C.C.; Dilcher, D.L.; Davis, D.R.; Wagner, D.L. Ninety-seven million years of angiosperm-insect association: Paleobiological insights into the meaning of coevolution. Proc. Natl. Acad. Sci. USA 1994, 91, 12278–12282. [Google Scholar] [CrossRef] [PubMed]
  37. Ali, A.H.; Abdelrahman, M.; El-Sayed, M.A. Alkaloid role in plant defense response to growth and stress. In Bioactive Molecules in Plant Defense: Signaling in Growth and Stress; Springer: Cham, Switzerland, 2019; pp. 145–158. [Google Scholar]
  38. Quan, J. The role of terpenoids in plants and its application. Bot. Res. 2013, 2, 106–108. [Google Scholar] [CrossRef]
  39. Barros, J.; Serk, H.; Granlund, I.; Pesquet, E. The cell biology of lignification in higher plants. Ann. Bot. 2015, 115, 1053–1074. [Google Scholar] [CrossRef] [PubMed]
  40. Ehrlich, P.R.; Raven, P.H. Butterflies and plants: A study in coevolution. Evolution 1964, 18, 586–608. [Google Scholar] [CrossRef]
  41. Heidel-Fischer, H.M.; Vogel, H. Molecular mechanisms of insect adaptation to plant secondary compounds. Curr. Opin. Insect Sci. 2015, 8, 8–14. [Google Scholar] [CrossRef] [PubMed]
  42. Loehlin, D.W.; Carroll, S.B. Expression of tandem gene duplicates is often greater than twofold. Proc. Natl. Acad. Sci. USA 2016, 113, 5988–5992. [Google Scholar] [CrossRef] [PubMed]
  43. Scully, E.D.; Hoover, K.; Carlson, J.E.; Tien, M.; Geib, S.M. Midgut transcriptome profiling of Anoplophora glabripennis, a lignocellulose degrading cerambycid beetle. BMC Genom. 2013, 14, 850. [Google Scholar] [CrossRef] [PubMed]
  44. Parra-Peralbo, E.; Talamillo, A.; Barrio, R. Origin and Development of the Adipose Tissue, a Key Organ in Physiology and Disease. Front. Cell Dev. Biol. 2021, 9, 786129. [Google Scholar] [CrossRef] [PubMed]
  45. Yi, Y.; Li, J.; Zong, Z.; Liu, X.; Song, H.; Wang, H.; Zhang, Z.; Zhang, H.; Li, Y. Cloning, expression, and characteristic analysis of the novel β-galactosidase from silkworm, Bombyx mori. Genesis 2021, 59, e23446. [Google Scholar] [CrossRef] [PubMed]
  46. Albalat, R.; Cañestro, C. Evolution by gene loss. Nat. Rev. Genet. 2016, 17, 379–391. [Google Scholar] [CrossRef] [PubMed]
  47. Lynch, M.; Conery, J.S. The evolutionary fate and consequences of duplicate genes. Science 2000, 290, 1151–1155. [Google Scholar] [CrossRef] [PubMed]
Figure 1. The number of GH1 genes in each family of Lepidoptera insects (A); the number of GH1 genes in butterflies and moths (B); comparison of the number of GH1 genes between polyphagous herbivores and monophagous herbivores. ▲ represents butterflies, and ◆ represents moths (C). Blue and green represent the two Lepidopteran suborders, Rhopalocera and Heterocera, respectively. Non-parametric tests were used to analyze differences among Lepidopteran groups: multiple group comparisons (Kruskal–Wallis test) and pairwise comparisons (Dunn’s test) among 7 superfamilies (A), two-group comparison (Mann–Whitney test) between Rhopalocera and Heterocera in (B). Asterisks *, **, and **** represent significant differences in p < 0.05, 0.01, and 0.0001, respectively.
Insects 16 00727 g001
Figure 2. The phylogenetic tree of GH1 genes in Lepidoptera (A); heatmap of the copy number of the GH1 gene in Lepidoptera insects among different groups and superfamilies (B). The phylogenetic tree of GH1 genes in Lepidoptera was constructed from protein sequences using IQTREE and visualized with iTOL v6. The bootstrap values were labeled at each node. Tip labels include gene IDs and genus names, while branches are color-coded by taxonomic group. The predicted GH1 genes were divided into 20 groups by using possvm in the phylogenetic tree and then summarized in a heat map representing 11 main groups in Lepidoptera superfamilies (A). The numbers in each cell represent the total gene number/the species number of each gene group in each Lepidopteran superfamily. The colors indicate the average gene number of each gene group in superfamilies (B).
Insects 16 00727 g002
Figure 3. Duplication and loss of GH1 genes in Lepidoptera. The duplication and loss of GH1 genes in Lepidoptera were inferred by reconciling the GH1 gene tree with the species tree; the species tree was derived from a previously published study [26]. Red numbers indicate duplication events, while blue numbers represent gene losses; ■ represents a polyphagous herbivore, and □ represents a monophagous herbivore.
Insects 16 00727 g003
Figure 4. Genomic locations and duplication patterns of GH1 genes in seven Lepidopteran species. The gene names are composed of a two-letter species abbreviation and the gene ID. Red, blue, and green represent tandem duplication, proximal duplication, and dispersed duplication, respectively. Chromosome karyotypes of different colors represent different species. The lines represent the collinear regions between contigs or scaffolds; the red lines represent the collinear regions containing the GH1 genes. Bm, Bombyx mori; Hk, Hyposmocoma kahamanoa; Of, Ostrinia furnacalis; Pg, Pectinophora gossypiella; Ba, Bicyclus anynana; Pm, Papilio machaon; Cc, Colias croceus. The tandem duplications are arranged one after another on the same chromosome. The proximal duplications are located relatively close to each other on the same chromosome but not immediately adjacent. The dispersed duplication is inserted into a non-adjacent location on the same chromosome or a different chromosome, which is caused by transposition or chromosomal rearrangements.
Insects 16 00727 g004
Figure 5. The heatmap of GH1 gene expression across various tissues in silkworm. The GH1 gene names of the silkworm are composed of the abbreviation of B. mori and the gene IDs. Red, blue, and green represent tandem duplication, proximal duplication, and dispersed duplication, respectively.
Insects 16 00727 g005
Disclaimer/Publisher’s Note: The statements, opinions and data contained in all publications are solely those of the individual author(s) and contributor(s) and not of MDPI and/or the editor(s). MDPI and/or the editor(s) disclaim responsibility for any injury to people or property resulting from any ideas, methods, instructions or products referred to in the content.

