Article

Distribution Pattern and Change Prediction of Luprops orientalis (Coleoptera: Tenebrionidae) Suitable Area in East Asia Under Climate Change

by
Jieqiong Wang
1,
Shuangyi Wang
2,
Yunchun Li
1,
Shuangmei Ding
3,
Zhonghua Wei
1,*,
Aimin Shi
1 and
Ding Yang
4,5,*
1
The Key Laboratory of Southwest China Wildlife Resources Conservation of the Ministry of Education, College of Life Sciences, China West Normal University, Nanchong 637009, China
2
Student Affairs Department, Sichuan University of Arts and Science, Dazhou 635000, China
3
The Institute of Scientific and Technical Research on Archives, National Archives Administration of China, Beijing 100050, China
4
State Key Laboratory of Green Pesticides, Guizhou University, Guiyang 550025, China
5
State Key Laboratory of Agricultural and Forestry Biosecurity, MARA Key Lab of Surveillance and Management for Plant Quarantine Pests, College of Plant Protection, China Agricultural University, Beijing 100193, China
*
Authors to whom correspondence should be addressed.
Insects 2025, 16(6), 626; https://doi.org/10.3390/insects16060626
Submission received: 12 April 2025 / Revised: 6 June 2025 / Accepted: 12 June 2025 / Published: 13 June 2025
(This article belongs to the Section Insect Pest and Vector Management)

Simple Summary

Luprops orientalis (Motschulsky, 1868) is an important pest in traditional Chinese medicines and can cause significant economic losses and degrade its quality. In this study, the maximum entropy (MaxEnt) model was employed to predict the distribution of L. orientalis under both near-current and future environmental scenarios in East Asia. Under near-current environmental conditions, the suitable areas for L. orientalis are primarily distributed in North China, Central China, the Korean Peninsula, and Central and Southern Japan. In China, high-suitability areas are mainly distributed in Hebei, Liaoning, Jiangxi, Shaanxi, and Hunan. Under future environmental scenarios, the centroids of suitable areas are expected to shift towards higher latitudes, with the overall suitable area increasing, while the highly suitable areas decrease. Additionally, as carbon emission concentrations rise, the suitable areas are expected to diminish in the 2090s.

Abstract

Luprops orientalis (Motschulsky, 1868) is an economically important pest in traditional Chinese medicines, widely distributed in East Asia. However, the primary limiting factors affecting its distribution, potential suitable areas, as well as its response to global warming, remain largely unknown. Utilizing 295 filtered distribution points and 10 environmental variables (9 climate variables and 1 land cover type), this study uses the MaxEnt model to predict the potential distribution of L. orientalis under near-current and future environmental change scenarios. The results indicated that precipitation of the warmest quarter (bio18), temperature seasonality (bio04), and precipitation of the wettest month (bio13) were the most significant environmental variables affecting the distribution of suitable habitats for L. orientalis, while the contribution of average variation in daytime temperature (bio2) was the smallest. Under the near-current climate, the areas of low, moderate, and high suitability for L. orientalis are approximately 1.02 × 10⁶ km2, 1.65 × 10⁶ km2, and 8.22 × 10⁵ km2, respectively. The suitable areas are primarily located in North China, Central China, the Korean Peninsula, and Central and Southern Japan. Under future climate conditions, the potential suitable areas are expected to expand significantly, especially in Central China. However, the high-suitability areas in North China are predicted to experience a slight reduction. With the increase in carbon emission concentrations, the suitable area shows an increasing trend in the 2050s, followed by a declining trend in the 2090s. The centroids of suitable areas will shift to the northeast in the future. These findings enhance our understanding of how climate change affects the distribution of L. orientalis and will assist governments in formulating effective pest control strategies, including widespread monitoring and stringent quarantine measures.

1. Introduction

Global warming is an indisputable fact and a major scientific issue of this century. Climate change is expected to alter the geographic distribution patterns of many species, which in turn will affect the structure and function of ecosystems [1]. Studies have shown that global climate change is contributing to the escalating loss of biodiversity [2] and altering the distribution ranges of various species [3]. Therefore, investigating the potential geographic distribution of species under climate change provides a theoretical basis for biodiversity conservation and resource management. Furthermore, it serves as an essential tool for predicting the impact of climate change on species distribution patterns.
Species distribution models (SDMs) primarily utilize known species distribution points and environmental variables to estimate the ecological niche of species based on specific computational methods. Subsequently, these models project this niche onto the landscape to predict the probability of species occurrence in target areas [4,5]. Commonly used SDMs include the maximum entropy (MaxEnt) model, Bioclimate Analysis and Prediction System (BIOCLIM), Ecological Niche Factor Analysis (ENFA), Genetic Algorithm for Rule-set Production (GARP), Generalized Linear Model (GLM), and Generalized Additive Model (GAM) [6,7,8,9,10]. Among these, the MaxEnt model is the most widely used for suitability analysis. It can quantitatively predict geographic distribution by leveraging limited geographic distribution points and climate environmental factors, even when the correlation between these two variables is unclear [11]. The prediction results partially depict the fundamental ecological niche of species, which can then be projected onto a geographic area to identify the potential suitable locations for those species.
The Tenebrionidae is one of the largest families in Coleoptera, comprising approximately 30,000 species across 11 subfamilies worldwide [12,13]. The feeding habits of tenebrionid species encompass herbivory, carnivory, omnivory, and detritivory, among others. Some species directly or indirectly damage stored products, making them closely related to human economic interests. Within this family, 227 species are identified as storage pests [14,15], constituting a significant component of stored-product pests. Among them, Luprops orientalis (Motschulsky, 1868) is considered as an economically important pest in traditional Chinese medicines [14], frequently appearing in pest lists [15,16,17]. It is a flight-capable beetle with a strong dispersal capacity, widely distributed in East Asia. Lyprops sinensis Marseul, 1876 is commonly included in the lists of stored-product pests in China; however, it is a synonym of Luprops orientalis [15,18,19]. Field surveys indicate that both the larvae and adults of this species feed on plant detritus in the natural environment, with many populations occurring near villages. Currently, its potential suitable area and response to climate change are unknown.
Accurate prediction of the potential suitable area for this pest not only aids preventing further spread but also effectively reduces management costs [20,21]. In this study, the MaxEnt model was used to predict the potential suitable areas of L. orientalis under climate change scenarios in East Asia. The aims of this study are to identify the dominant environmental factors affecting the geographical distribution of L. orientalis and to assess the impact of climate change on the suitable habitat areas for this species.

2. Materials and Methods

2.1. Species Occurrence Data

The distribution points were collected from field investigations and species occurrence databases. From May 2016 to June 2020, field investigations were conducted in North China, and 64 distribution points were recorded [19]. An additional 313 and 12 occurrence sites of Luprops orientalis were obtained from the Global Biodiversity Information Facility (GBIF, https://www.gbif.org) and the China National Knowledge Infrastructure (https://www.cnki.net/), respectively. A total of 389 distribution points were obtained. This methodological design specifically targets the mitigation of both autocorrelation effects and the accumulation of sampling bias—two critical factors that contribute to predictive model overfitting [22]. To avoid overfitting caused by sampling deviation, we conducted secondary sampling of points on a 2.5-arc grid to reduce sampling deviation and minimize the possible impact of spatial autocorrelation [22]. Ultimately, 295 occurrence records of L. orientalis were selected to construct the predictive model.

2.2. Environmental Variables

The near-current and future bioclimatic variables were downloaded from WorldClim (Version 2.1, http://www.worldclim.org/) at a spatial resolution of 2.5 arcminutes.
The near-current climate data we used included 19 bioenvironmental variables measured between 1970 and 2000. And a total of 20 environmental variables (19 worldclim bioclimatic variables, and 1 land cover type that can be downloaded from https://globalmaps.github.io/glcnmo.html, accessed on 12 April 2025) were used for current and future model predictions. The date type, resolution, and data source of the land cover version 3 are Byte (8 bits), 15 arcseconds, and MODIS data 2013 (Terra & Aqua), respectively [23]. The collinearity of bioclimatic variables can affect the accuracy of the MaxEnt model, contributing to an inappropriate extent of simulated species distribution [24,25,26]. The jackknife method was used to assess the contribution rates of the environmental variables to the predictive model, and variables with a contribution rate of zero were subsequently removed. Through systematic screening, 10 environmental variables (comprising 9 bioclimatic variables and 1 land cover type) were retained for the MaxEnt modeling analysis (Figure 1).
Future bioclimatic variables were provided by the Coupled Model Intercomparison Project Phase 6 (CMIP6) for the periods of 2041–2060. For the emissions scenarios, SSP1-2.6, SSP2-4.5, and SSP5-8.5 were used, representing low, moderate, and high greenhouse gas emission scenarios, respectively, for future climate projections. The Beijing Climate Center Climate System Model version 2 (BCC-CSM2-MR) was chosen as the future climate model [27], due to its effective simulation of extreme temperature indices and trends in China [28].

2.3. Modeling Methods

The world map used in this study was obtained from the Resource and Environment Science and Data Center (https://www.resdc.cn/, accessed on 18 March 2025). The MaxEnt v3.4.1 was employed to predict suitable areas for Luprops orientalis in East Asia. To reduce multicollinearity among variables, we used ArcGIS version 10.2 software and SPSS version 20.0 software to process and analyze the environmental variables, and used Pearson’s correlation test (Pearson’s r) for factor screening. The Pearson correlation coefficients (Pearson’s r) of the cross-correlations among the 20 variables were calculated using the SPSS version 20.0 software. In choosing one of them, when |r| > 0.85, it indicates that there is a collinear relationship. The prediction results of the Maxent model are significantly correlated with the parameter settings. The results obtained by using the default parameter settings may deviate greatly from the actual situation. Therefore, it is necessary to optimize the parameter settings according to the actual situation of the species [29]. The number of model iterations was set to 500 times, with 10,000 background points. In total, 75% of the species distribution points were randomly selected for model construction, while the remaining 25% were set aside for model testing. The result obtained after running the model is the average of the 10 test results and then the jackknife test was used to assess the importance of the variables [30]. Judging from the operation results, the area under the curve (AUC) values are all at a relatively high level, and the credibility is relatively high.
The ROC curve is used to evaluate the predictive performance of the model. The AUC is not affected by the threshold value and is commonly used to assess the accuracy of predictive models [31]. The AUC value ranges from 0 to 1, where an AUC < 0.5 indicates model failure, 0.5 < AUC < 0.7 indicates poor model accuracy, 0.7 < AUC < 0.8 indicates moderate accuracy, 0.8 < AUC < 0.9 suggests high accuracy, and AUC ≥ 0.9 denotes excellent accuracy [32,33]. In ArcGIS, the Jenks natural breaks classification method was used to classify and visualize the suitable areas for Luprops orientalis. The suitable areas were divided into four categories: p < 0.2 as unsuitable areas, 0.2 ≤ p < 0.4 as low-suitability areas, 0.4 ≤ p < 0.6 as moderate-suitability areas, and 0.6 ≤ p < 1 as high-suitability areas. The suitable areas were quantified using SDM Toolbox version 2.4.

3. Results

3.1. Model Optimization and Accuracy Evaluation

Based on the filtered dataset of 295 occurrence records and 10 environmental factors (Table 1), the results of the MaxEnt model demonstrated that the AUC value for the near-current period (1970–2000) reached 0.98 (Figure S1). The AUC value exceeding 0.9 showed that the MaxEnt model had excellent predictive performance, effectively highlighting the potential distribution range of Luprops orientalis under near-current and future climate conditions, along with its changing trends.

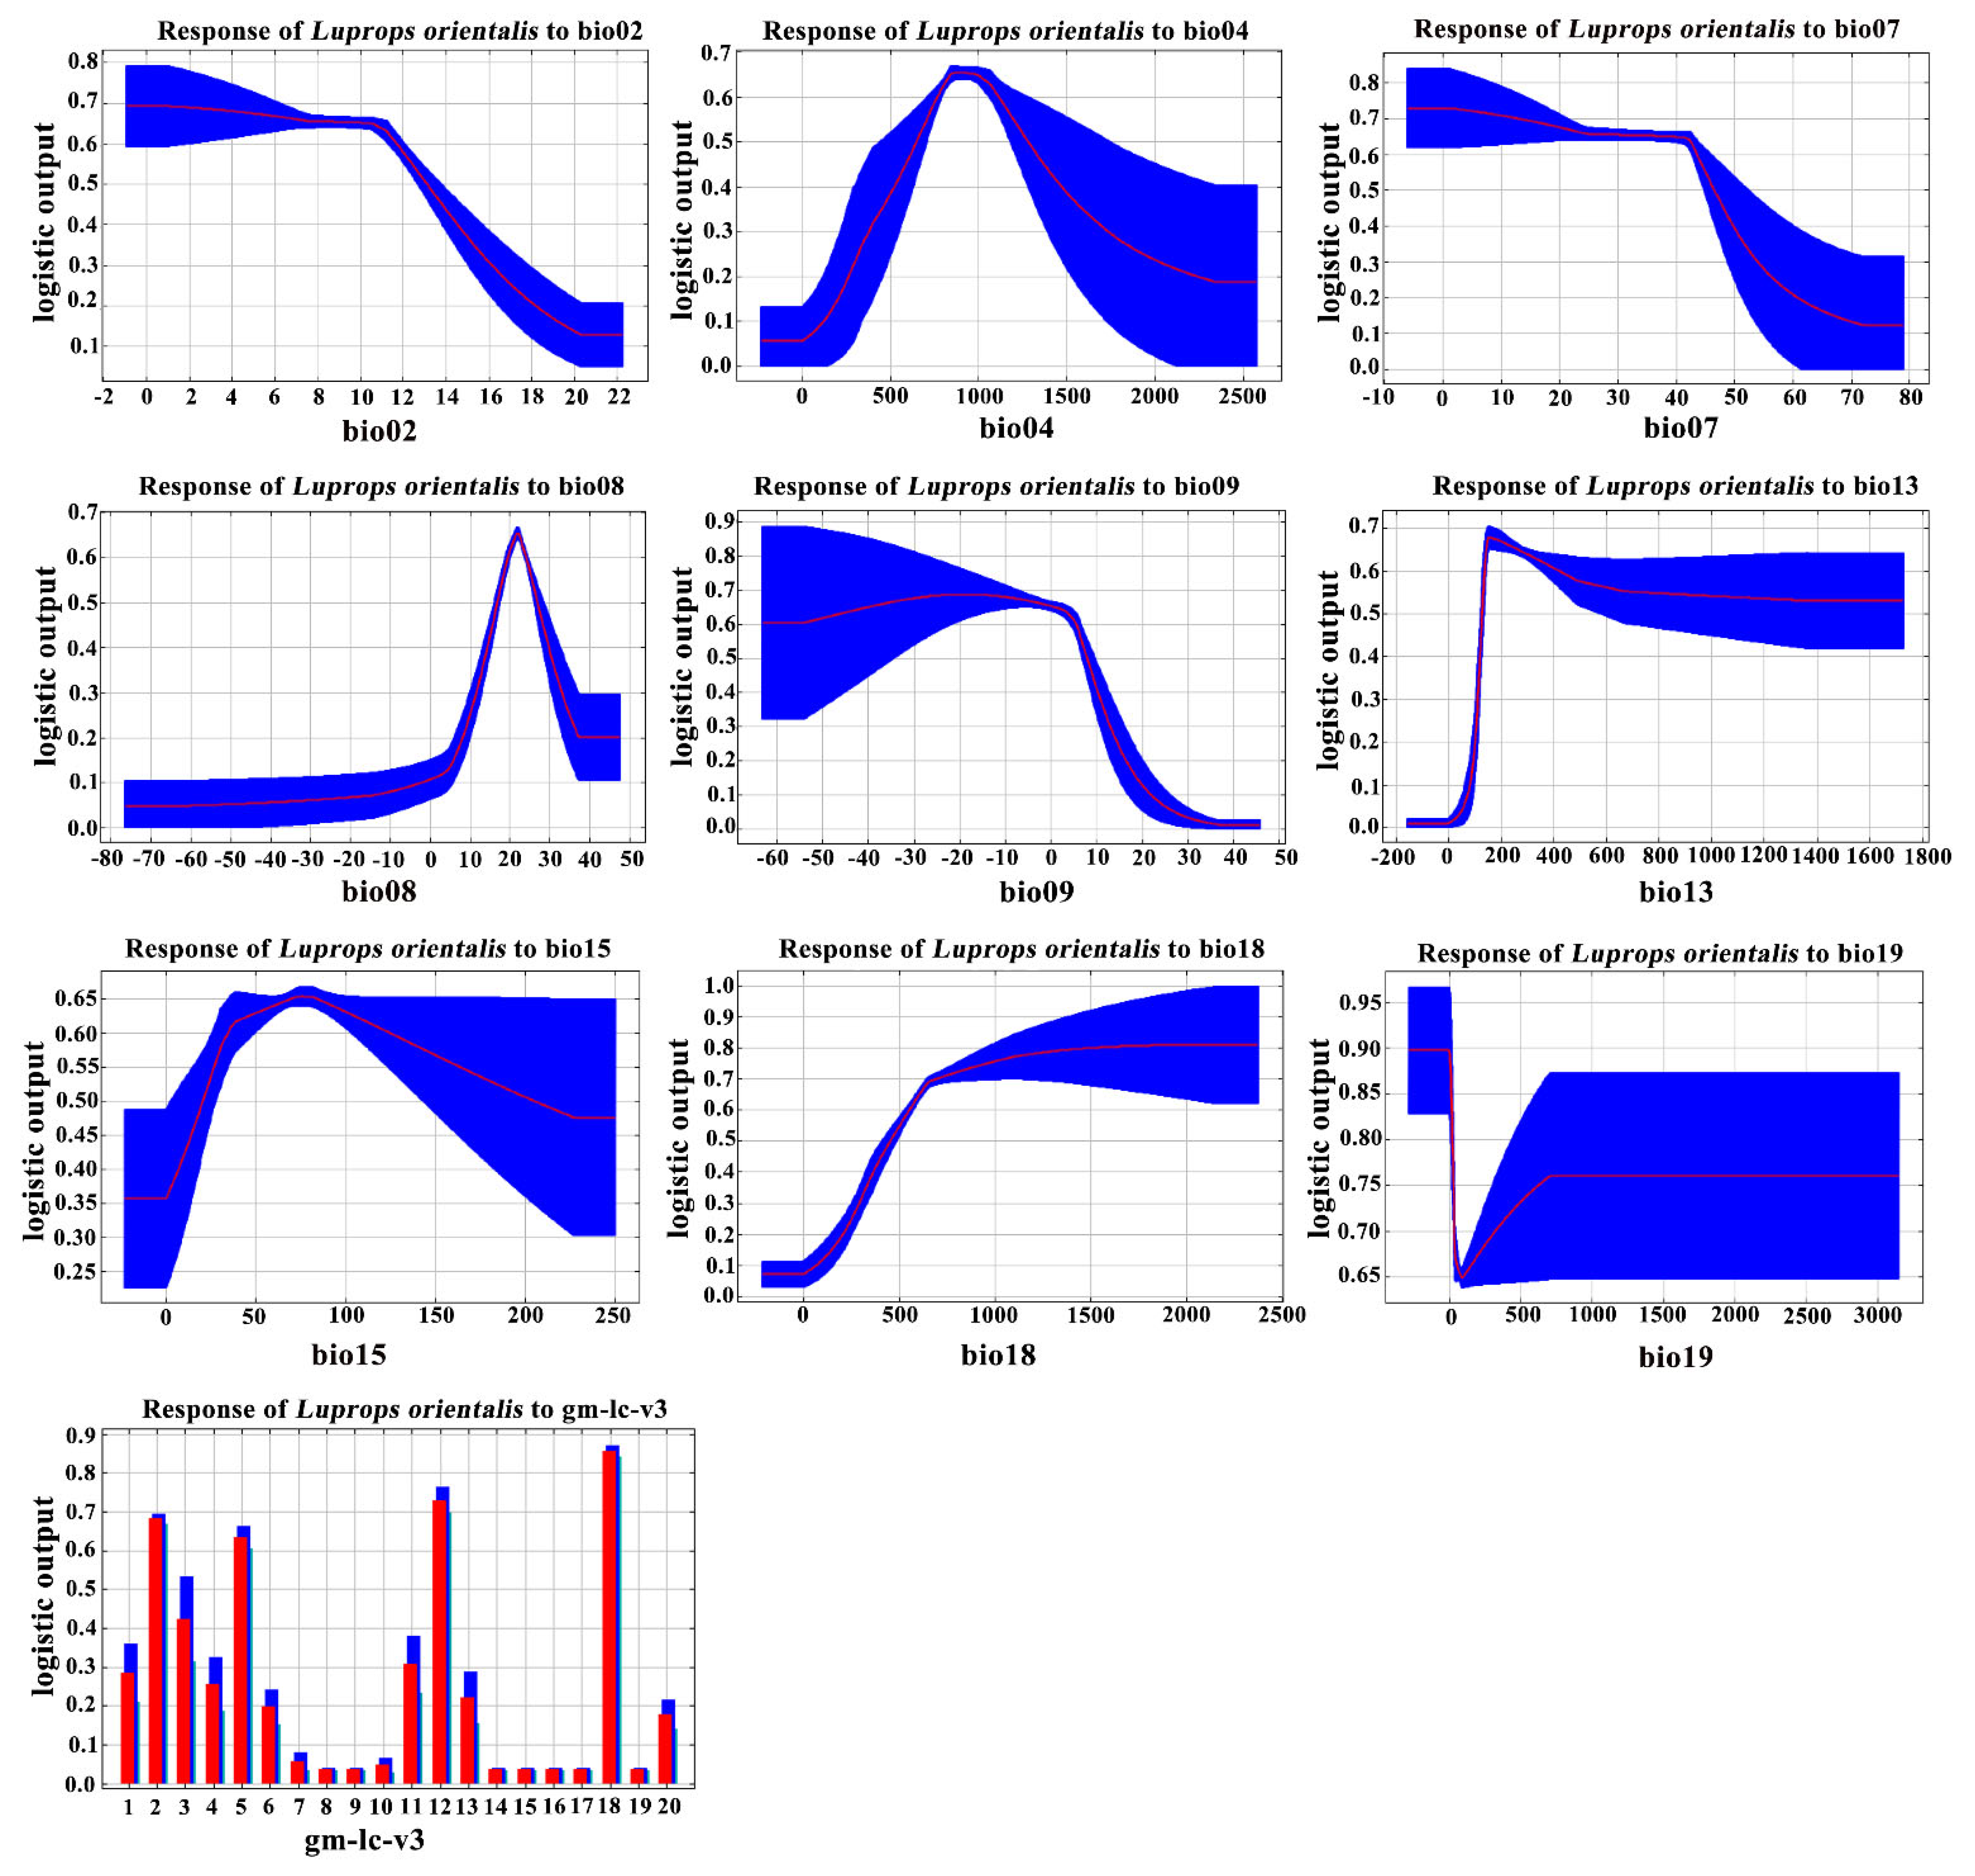
3.2. Dominant Environmental Variables and Their Response Curves

The importance of the environmental variables was evaluated using the jackknife method in Maxent (Figure 1). The results showed that among the 10 environmental variables, the top 3 contributors were bio18, bio04, and bio13, with contribution rates of 61.30%, 22.20%, and 9.00%, respectively (Table 1). Conversely, the contribution rate of bio02 was the lowest, at 0.2%, while the contribution rate of the land cover type was 0.8%. According to the permutation importance rates, bio13, bio09, and bio08 emerged as the dominant environmental variables, with rates of 43.60%, 17.50%, and 14.20%, respectively. Thus, based on the contribution and permutation importance rates, bio18 was identified as the most important environmental variable, whereas bio15 was determined to be the least important environmental variable.
Response curve analyses of the selected bioclimatic variables—bio18, bio04, and bio13—were performed to explore their relationship with the distribution of Luprops orientalis (Figure 2). The presence probability of L. orientalis exceeds 0.5 when bio18 ranges from 565.73 mm to 886.55 mm, with the highest presence probability of 0.72 occurring at a precipitation of 726.14 mm. For bio04, the presence probability exceeds 0.5 within the range of 821.63 to 1068.67, with the peak presence probability of 0.65 observed at 1018.15. For bio13, the presence probability is greater than 0.5 when it ranges from 219.93 mm to 355.67 mm, with the highest presence probability of 0.62 occurring at 310.43 mm.

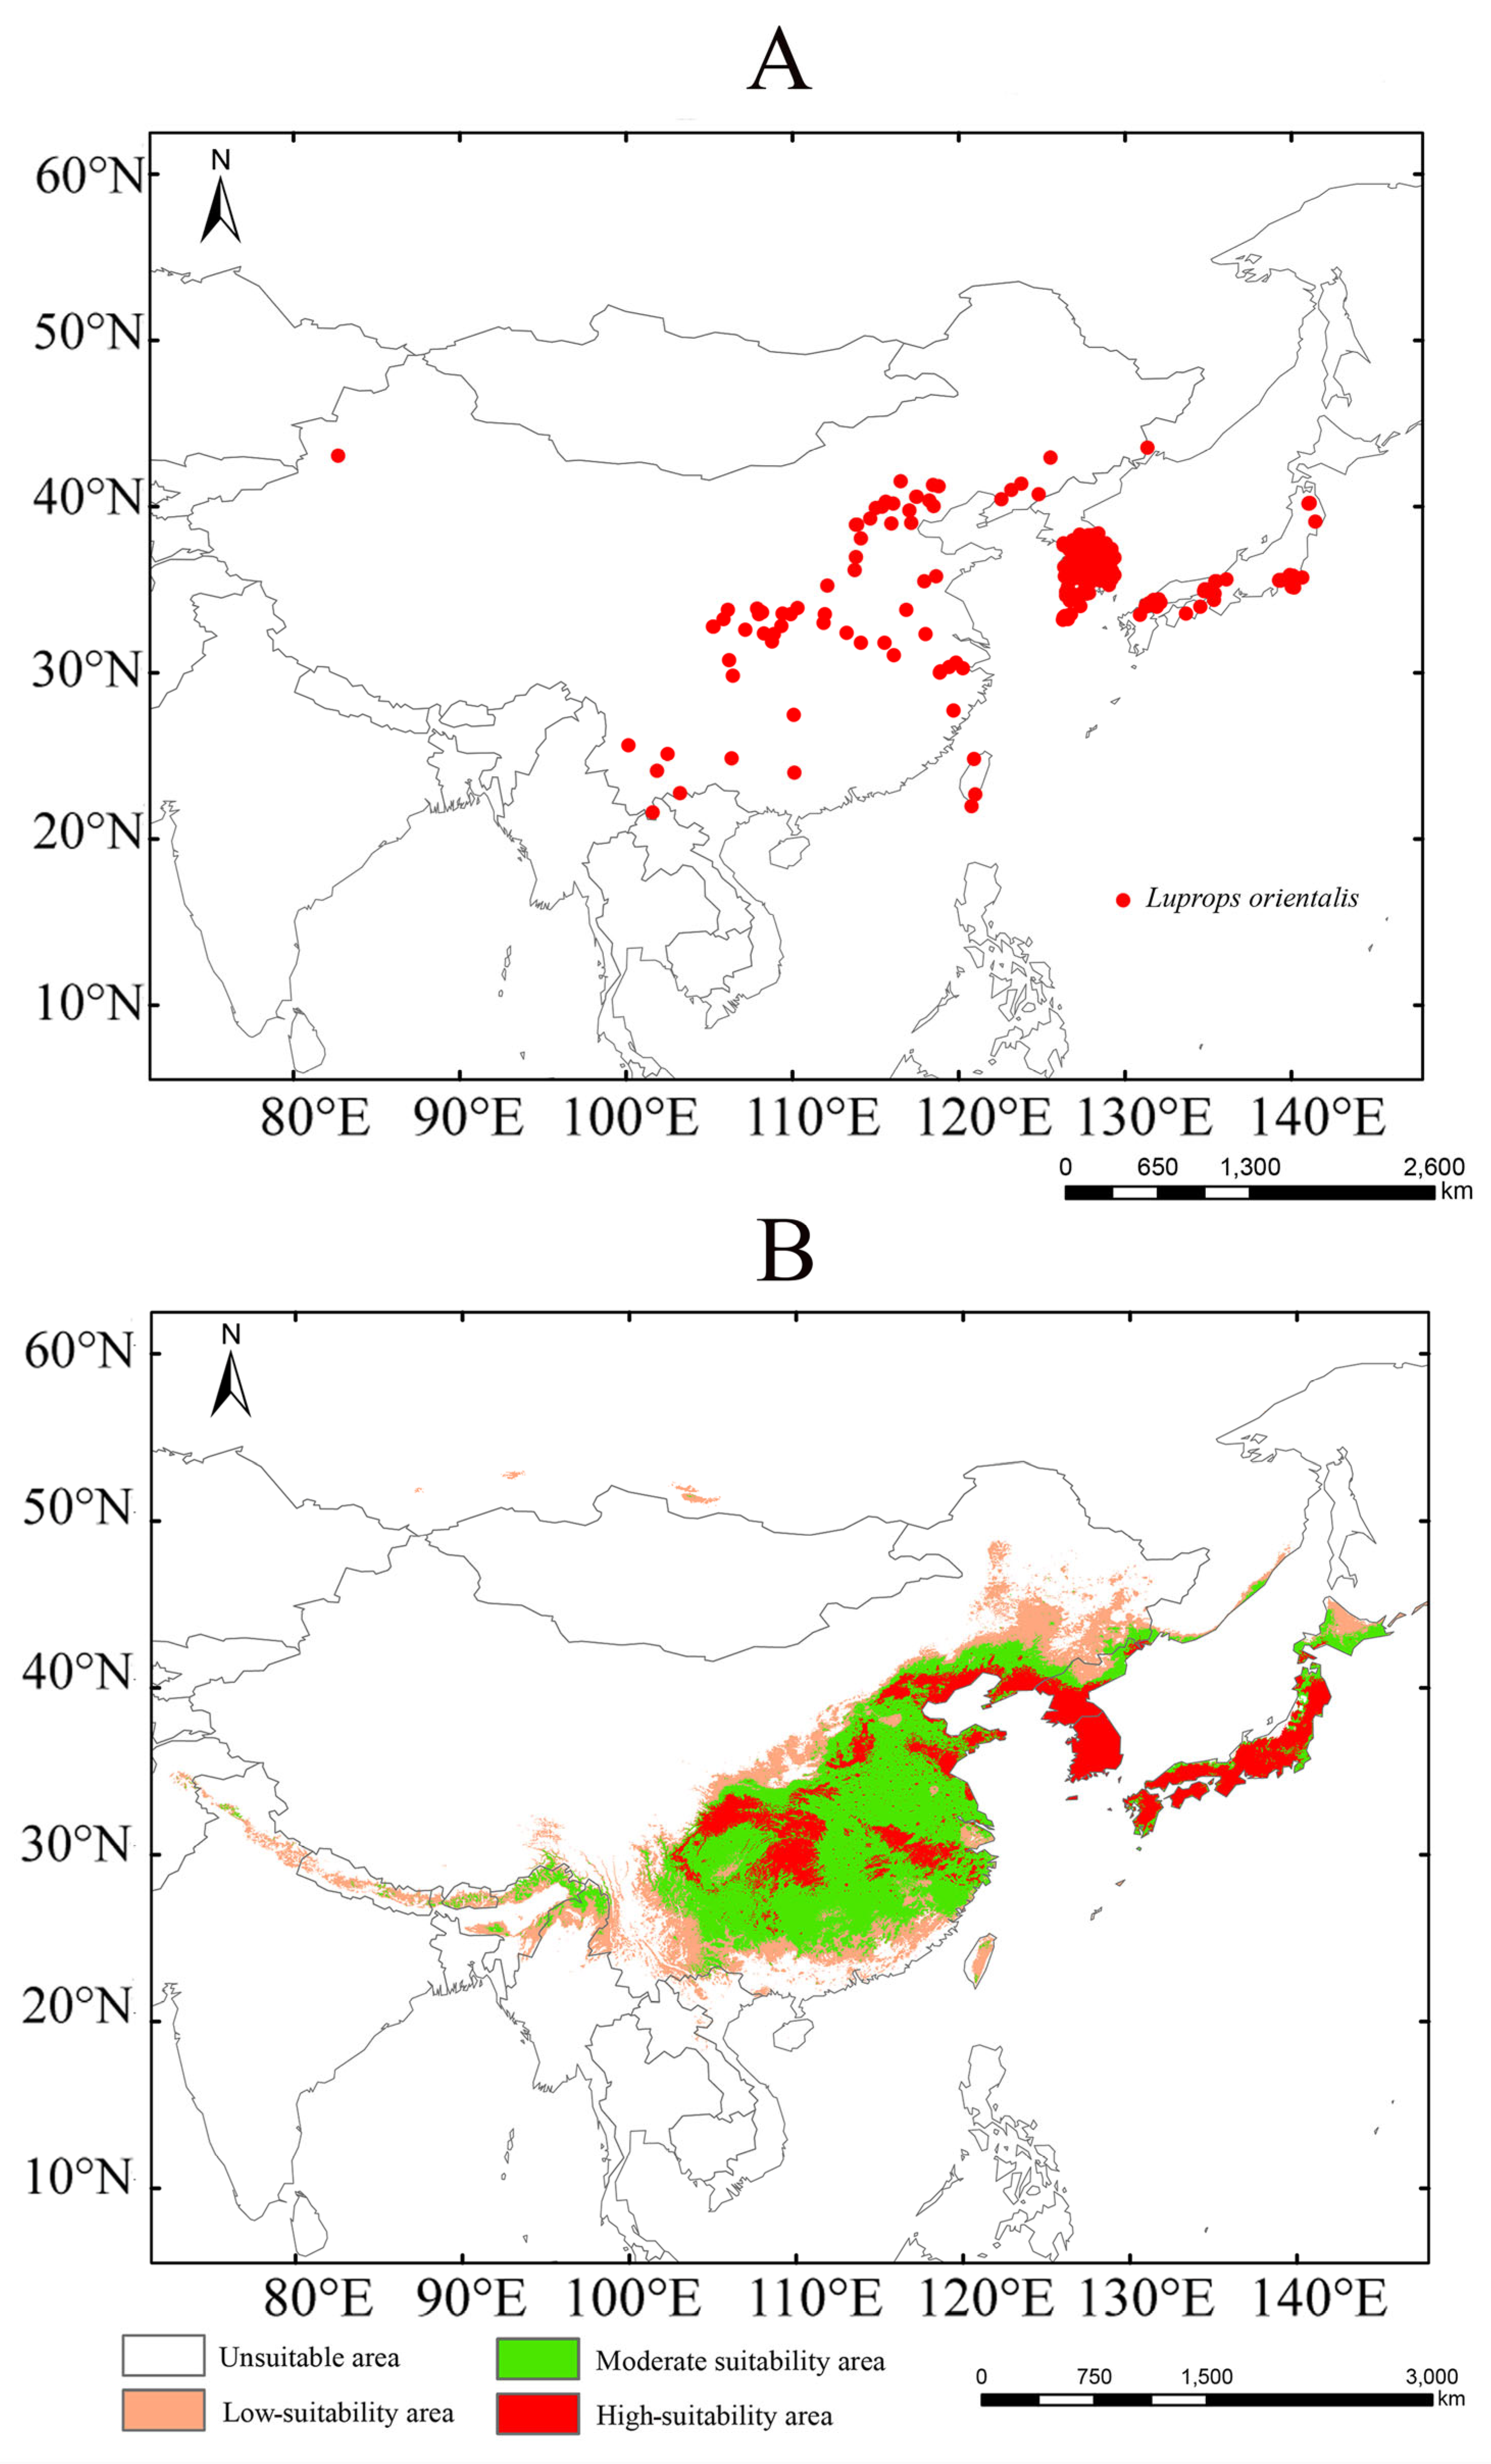
3.3. Near-Current Suitable Areas for Luprops orientalis

Under near-current climatic conditions, the suitable areas for Luprops orientalis are classified into low-, moderate-, and high-suitability categories, encompassing approximately 1.02 × 10⁶ km2, 1.65 × 10⁶ km2, and 8.22 × 10⁵ km2, respectively (Table S2). The high-suitability areas are primarily concentrated in North China, Central China, the Korean Peninsula, and the Central and Southern regions of Japan (Figure 3). Low-suitability areas are mainly found along the southern slopes of the Himalayas, and in the peripheral regions of North China, Central China, the southern part of Northeast China, and Northern Japan. Notably, there are no high-suitability areas in Northwest China, Southwest China, Mongolia, or Russia, indicating a minimal invasion risk in these regions.

3.4. Changes in Suitable Areas for Luprops orientalis Under Future Climate Conditions

Under future climate conditions, suitable areas for Luprops orientalis will predominantly be distributed across Central China, Northern China, Northeastern China, the Korean Peninsula, and the Japanese archipelago (Figure 4). Compared to its near-current distribution, the total suitable areas for L. orientalis will significantly increase (Table S2). In the 2050s, the suitable area will expand by 1.47%, 1.55%, and 2.70%, under the three carbon emission scenarios (SSP1-2.6, SSP2-4.5, and SSP5-8.5, respectively). In the 2090s, these increases are projected to be 2.47%, 1.29%, and 1.93%, respectively. Future climate conditions will result in a significant increase in low-suitability areas with rising carbon emission concentrations, while the moderate- and high-suitability areas will slightly decrease (Figure 4).
The simulation results of the binarized MaxEnt model were applied to analyze spatial pattern changes in suitable habitats. The expansion of suitable areas for Luprops orientalis is mainly observed in Northeast China and Southwest China (Figure 5). A few suitable areas were also found on the southern slope of the Himalayas. The low-suitable area in Northeast China is the primary region where the suitable habitats for L. orientalis are expected to increase. Under the SSP1-2.6 scenario for the 2050s, the suitable area in Northeast China is significantly increased. In the case of SSP2-4.5, expansion will primarily occur in Northeast China and North China during the 2050s, while in the 2090s, it will extend further into Northeast China and the Hengduan Mountains region. Under the SSP5-8.5 scenario, a suitable habitat expansion area is anticipated mainly in North China during the 2050s and in the Hengduan Mountains, Northeast China, and southeastern Russia by the 2090s. The distribution pattern of L. orientalis underscores the substantial influence of carbon emissions on its suitable areas. Specifically, under SSP1-2.6 and SSP2-4.5, the suitable habitats for L. orientalis significantly increase in the 2050s. However, for SSP5-8.5, the total suitable area in the 2050s is markedly smaller than that in the 2090s.

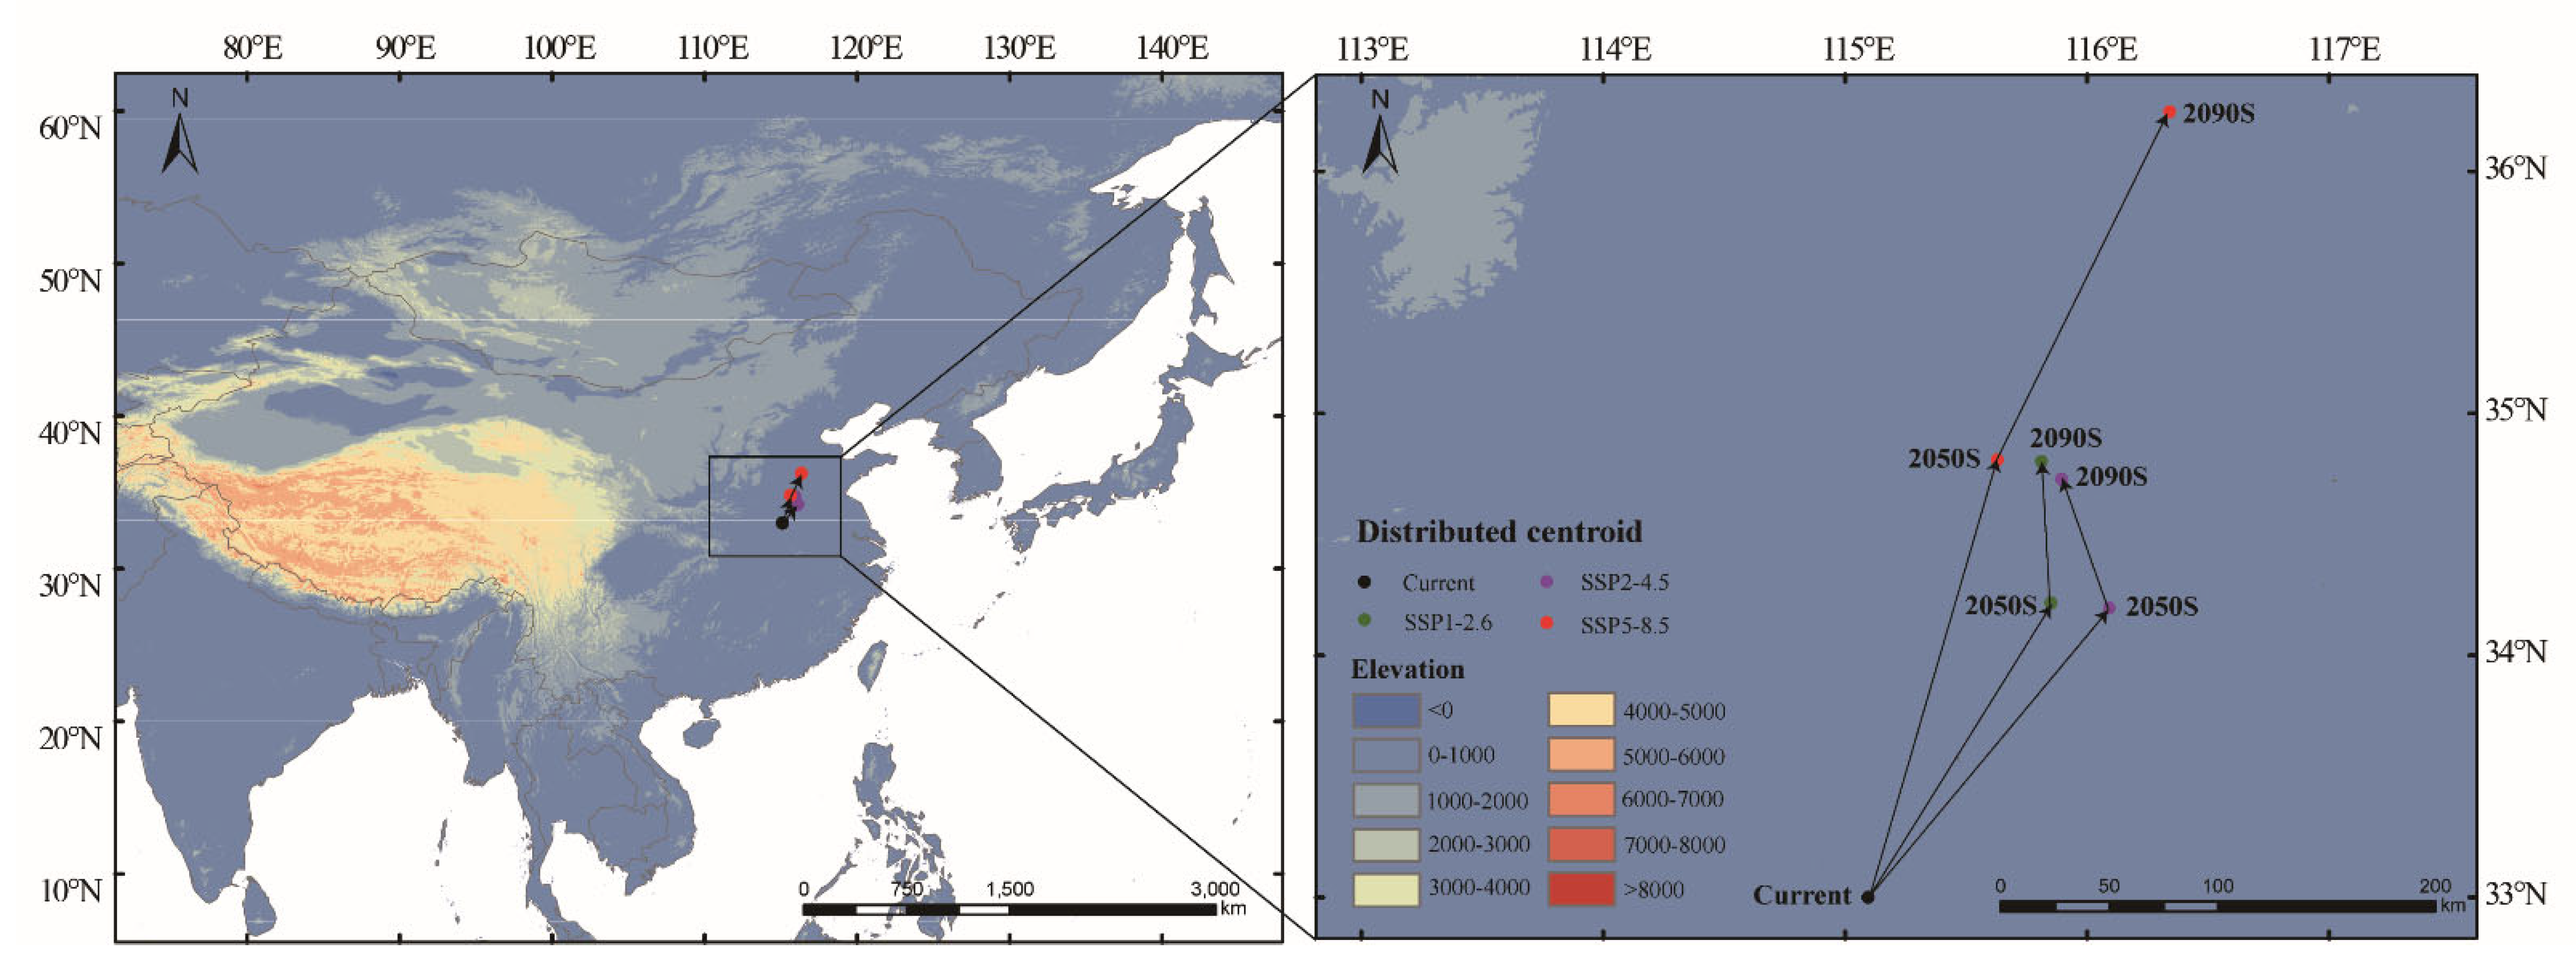
3.5. Shift in the Centroids Within the Suitable Area

Currently, the distribution center of the suitable area for Luprops orientalis is located in Fuyang City, Anhui Province, China (115.09479°E, 32.99922°N). Under the SSP1-2.6 and SSP2-4.5 scenarios, the geometric center first migrates northeast in the 2050s and subsequently shifts northwest in the 2090s (Table S3). In contrast, under the SSP5-8.5 scenario, the geometric center migrates northeast during both the 2050s and 2090s (Table S3). Overall, the centroids shift a relatively short distance, generally maintaining a movement towards the northeast (Figure 6).

4. Discussion

4.1. Restriction of Environmental Variables

In this study, nine climate factors and one soil factor were used to predict the suitable areas for Luprops orientalis based on the MaxEnt model. The results indicated that bio18, bio04, and bio13 are critical environmental variables influencing its distribution. The findings emphasized the combined importance of the precipitation and temperature variables, which is consistent with previous studies on predicting suitable areas [34,35,36,37]. Furthermore, the response curve analysis revealed that L. orientalis exhibited high suitability when the bio18 value ranged from 565.73 mm to 886.55 mm, and the bio13 value ranged from 219.93 mm to 355.67 mm, suggesting a preference for humid environments. The contribution of the land cover type was found to be only 0.8%, suggesting its minimal impact on the distribution pattern of L. orientalis. This is consistent with the observed behavior studies, as the species can live both in food storage areas [14,15] and in the wild [19]. Although these 10 environmental variables reflect the optimal conditions for the survival of L. orientalis, they do not comprehensively represent the species’ environmental requirements, such as the interactions of unobserved biotic factors or potential abiotic confounding variables [37].

4.2. Distribution Pattern of Luprops orientalis Under Near-Current Climate Conditions

Compared with the observed distribution, the predicted suitable areas for L. orientalis encompass a significantly larger range, aligning with the findings from previous research [37,38,39,40]. This discrepancy may be attributed to the scope of the survey and the number of distribution points collected. Generally, an increase in the number of distribution points within the target area enhances the accuracy of model predictions [41,42,43]. Under near-current climate conditions, the total suitable area is approximately 3.49 × 10⁶ km2. The high-suitability areas (8.22 × 10⁵ km2) for L. orientalis are consistent with the distribution regions, which are located in North China, Central China, the Korean Peninsula, and Central and Southern Japan. The moderate-suitability areas (1.65 × 10⁶ km2) are primarily distributed in Central China, North China, north of the Korean Peninsula, and Japan, and are significantly larger than the low-suitability area (1.02 × 10⁶ km2). Based on the near-current suitable habitats, the key regions for managing L. orientalis include grain storge areas in North China, Central China, the Korean Peninsula, and Central and Southern Japan.

4.3. The Impact of Climate Change on Suitable Habitats of Luprops orientalis

Compared to the near-current suitable area, the prediction indicates an increasing trend in the suitable habitat for Luprops orientalis under future climate change, which is consistent with the findings from several previous studies on insects [44,45,46,47]. In the 2050s, as carbon emission concentrations rise, the total suitable habitat area significantly expands, with the increase in low-suitable areas being more pronounced than that in high-suitable areas (Table S2). However, in the 2090s, as carbon emission concentrations continue to escalate, there is a notable decrease in the total suitable habitat area (Table S2). The increase in carbon emissions is expected to diminish the suitable habitat area for various species, aligning with prior studies [48,49,50,51,52].
The suitable habitats for beetles will increase or decrease as the climate warms [53]; however, the suitable habitat area for Luprops orientalis will increase in this study. Under future climate change scenarios, the area of high-suitable habitats for L. orientalis is projected to decline, while the area of low-suitable habitats increases. This contraction of high-suitable habitats may be closely related to the risks associated with the rising temperature and increased drought in the dry–wet transition zone of Northern China [54]. The northwestern region of Asia is predominantly arid, and although humidity levels in Northwestern China are projected to increase [55], this area remains unsuitable for L. orientalis, manifesting only as small pockets of low suitability in the transition area between North China and Northwestern China. The area of moderately suitable habitats remains relatively stable, while high-suitable habitats will continue to decline. The above findings indicate that as climate warming progresses, the suitable habitats for L. orientalis are likely to shift towards higher-altitude regions, which corroborates previous conclusions [28,37,40,52,56]. The distribution center is the centroid of all suitable areas, not the region with the most distribution points (such as the Japanese Archipelago and the Korean Peninsula). The number of distribution points is influenced by factors such as the frequency of surveys and the methods of specimen collection.
Consequently, the monitoring and prevention of L. orientalis should be strengthened in potential high-suitability areas to mitigate the risk of further invasion and spread. Additionally, L. orientalis should be more effectively managed to avoid outbreaks and minimize the economic damage caused to Chinese traditional medicines.

5. Conclusions

Utilizing the MaxEnt model, the suitable areas of Luprops orientalis were predicted under both near-current and future climate scenarios. Among the 20 environmental variables analyzed, bio18, bio13, and bio4 emerged as significant factors influencing its distribution. Under near-current climate conditions, the suitable areas for L. orientalis are mainly distributed in Central China, North China, the Korean Peninsula, and the Japanese archipelago. Under future climate conditions, the total areas of suitable habitats for L. orientalis are anticipated to increase, but the high-suitability areas are expected to diminish in the 2050s and 2090s. In the 2050s, while carbon emission concentrations increase, the area of suitable habitats significantly expands. However, in the 2090s, as carbon emission concentrations continue to rise, the area of suitable habitats is projected to decrease. This decline suggests that increased carbon emission concentrations may negatively impact the population size of L. orientalis. Additionally, the centroids of the suitable habitats are shifting towards higher latitudes.

Supplementary Materials

The following supporting information can be downloaded at: https://www.mdpi.com/article/10.3390/insects16060626/s1, Table S1: Potential suitable area of Luprops orientalis in China under different scenarios; Table S2: Statistical analysis of the changes in suitable area under different scenarios; Table S3: The latitude and longitude coordinates of the centroids under different scenarios; Figure S1: the ROC curve for predicting the potential distribution range of Luprops orientalis based on the MaxEnt model.

Author Contributions

Conceptualization, Z.W. and D.Y.; methodology, J.W. and S.W.; software, J.W. and S.W.; validation, J.W. and S.W.; formal analysis, Z.W.; data curation, J.W. and S.W.; writing—original draft preparation, J.W. and S.W.; writing—review and editing, Y.L., S.D. and Z.W.; visualization, J.W. and S.W.; supervision, D.Y.; funding acquisition, S.W. and A.S. All authors have read and agreed to the published version of the manuscript.

Funding

This work was supported by the Natural Science Foundation of Sichuan Province, China (Grant No. 2024NSFSC0076), the Research on Prediction of Potential Habitat Suitability for Invasive Alien Insects in Dazhou City, Sichuan Province (Grant No. 2024QD19), the Natural Science Special (Special Post) Scientific Research Fund Project of Guizhou University (2023-06), and the Qiankehe Platform Talent (BQW [2024]012).

Data Availability Statement

The raw data supporting the conclusions of this article will be made available by the authors on request.

Acknowledgments

We thank Xinglong Bai for providing distribution points for this study.

Conflicts of Interest

The authors declare no conflicts of interest.

Abbreviations

The following abbreviations are used in this manuscript:
maximum entropy MaxEnt
area under the curveAUC
receiver operating characteristicROC

References

  1. Bellard, C.; Bertelsmeier, C.; Leadley, P.; Thuiller, W.; Courchamp, F. Impacts of climate change on the future of biodiversity. Ecol. Let. 2012, 15, 365–377. [Google Scholar] [CrossRef] [PubMed]
  2. Chen, Y.; Ge, D.; Ericson, P.G.P.; Song, G.; Wen, Z.X.; Yang, Q.S.; Lei, F.M.; Qu, Y.H. Alpine burrow-sharing mammals and birds show similar population-level climate change risks. Nat. Clim. Change 2023, 13, 990–996. [Google Scholar] [CrossRef]
  3. Pecl, G.T.; Araújo, M.B.; Bell, J.D.; Blanchard, J.; Bonebrake, T.C.; Chen, I.C.; Clark, T.D.; Colwell, R.K.; Danielsen, F.; Evengård, B.; et al. Biodiversity redistribution under climate change: Impacts on ecosystems and human well-being. Science 2017, 355, eaai9214. [Google Scholar] [CrossRef]
  4. Kearney, M.; Porter, W. Mechanistic niche modelling: Combining physiological and spatial data to predict species’ ranges. Ecol. Lett. 2009, 12, 334–350. [Google Scholar] [CrossRef]
  5. Anibaba, Q.A.; Dyderski, M.K.; Jagodzinski, A.M. Predicted range shifts of invasive giant hogweed (Heracleum mantegazzianum) in Europe. Sci. Total Environ. 2022, 825, 154053. [Google Scholar] [CrossRef] [PubMed]
  6. Ge, X.Z.; He, S.Y.; Zhu, C.Y.; Wang, T.; Xu, Z.C.; Zong, S.X. Projecting the current and future potential global distribution of Hyphantria cunea (Lepidoptera: Arctiidae) using CLIMEX. Pest Manag. Sci. 2019, 75, 160–169. [Google Scholar] [CrossRef]
  7. Mondanaro, A.; Di Febbraro, M.; Castiglione, S.; Melchionna, M.; Serio, C.; Girardi, G.; Belfiore, A.M.; Raia, P. ENphylo: A new method to model the distribution of extremely rare species. Methods Ecol. Evol. 2023, 14, 911–922. [Google Scholar] [CrossRef]
  8. González-Miguéns, R.; Cano, E.; Guillén-Oterino, A.; Quesada, A.; Lahr, D.J.G.; Tenorio-Rodríguez, D.; de Salvador-Velasco, D.; Velázquez, D.; Carrasco-Braganza, M.I.; Patterson, R.T.; et al. A needle in a haystack: A new metabarcoding approach to survey diversity at the species level of Arcellinida (Amoebozoa: Tubulinea). Mol. Ecol. Resour. 2023, 23, 1034–1049. [Google Scholar] [CrossRef]
  9. Booth, T.H.; Nix, H.A.; Busby, J.R.; Hutchinson, M.F. BIOCLIM: The first species distribution modelling package, its early applications and relevance to most current MaxEnt studies. Divers. Distrib. 2014, 20, 1–9. [Google Scholar] [CrossRef]
  10. Wainwright, B.J.; Leon, J.; Vilela, E.; Hickman, K.J.E.; Caldwell, J.; Aimone, B.; Bischoff, P.; Ohran, M.; Morelli, M.W.; Arlyza, I.S.; et al. Wallace’s line structures seagrass microbiota and is a potential barrier to the dispersal of marine bacteria. Environ. Microbiome 2024, 19, 23. [Google Scholar] [CrossRef]
  11. Zhang, H.; Zhao, H.X.; Wang, H. Potential geographical distribution of Populus euphratica in China under future climate change scenarios based on Maxent model. Acta Ecol. Sin. 2020, 40, 6552–6563. [Google Scholar]
  12. Bouchard, P.; Bousquet, Y.; Aalbu, R.L.; Alonso-Zarazaga, M.A.; Merkl, O.; Davies, A.E. Review of genus-group names in the family Tenebrionidae (Insecta, Coleoptera). ZooKeys 2021, 1050, 1–633. [Google Scholar]
  13. Kamiński, M.J.; Lumen, R.; Kanda, K.; Iwan, D.; Johnston, M.A.; Kergoat, G.J.; Bouchard, P.; Bai, X.L.; Li, X.M.; Ren, G.D.; et al. Reevaluation of Blapimorpha and Opatrinae: Addressing a major phylogeny-classification gap in darkling beetles (Coleoptera: Tenebrionidae: Blaptinae). Syst. Entomol. 2021, 46, 140–156. [Google Scholar] [CrossRef]
  14. Hagstrum, D.W.; Subramanyam, B. Stored-Product Insect Resource; AACC International: Eagan, MN, USA, 2009. [Google Scholar]
  15. Ren, G.D.; Li, X. Advances in classification of the storage tenebrionid beetles in the world. J. Hebei Univ. (Nat. Sci.) 2020, 40, 49–56. [Google Scholar]
  16. Yan, X.; Zhou, H.; Shen, Z.; Li, W.; Guo, D.; Song, Y.; Lan, S.; Zhang, J. National investigations of stored grain arthropods in China. In Proceedings of the 10th International Working Conference on Stored Product Protection, Estoril, Portugal, 27 June–2 July 2010. [Google Scholar]
  17. Wang, D.X.; Wang, X.; Bai, C.Q.; Zhang, H.; Shao, X.L.; Shen, F.; Song, W.; He, Y.P.; Xie, L.D. Survey on community insect species of Tenebroides mauritanicus (Linnaeus) and their habitat character in grain storge environment. J. Henan Univ. Technol. (Nat. Sci.) 2017, 38, 96–100. [Google Scholar]
  18. Kaszab, Z. Synonymie Indoaustralischer und Neotropisher Tenebrioniden (Coleoptera). Acta Zool. Acad. Sci. Hung. 1983, 29, 129–138. [Google Scholar]
  19. Wei, Z.H.; Ren, G.D. Taxonomy of the genus Luprops from China, with the description of larva of Luprops horni (Coleoptera: Tenebrionidae). Entomotaxonomia 2019, 41, 299–312. [Google Scholar]
  20. Leung, B.; Lodge, D.M.; Finnoff, D.; Shogren, J.F.; Lewis, M.A.; Lamberti, G. An ounce of prevention or a pound of cure: Bioeconomic risk analysis of invasive species. Proc. R. Soc. B-Biol. Sci. 2002, 269, 2407–2413. [Google Scholar] [CrossRef]
  21. Fournier, A.; Penone, C.; Pennino, M.G.; Courchamp, F. Predicting future invaders and future invasions. Proc. Natl. Acad. Sci. USA 2019, 116, 7905–7910. [Google Scholar] [CrossRef]
  22. Verbruggen, H.; Tyberghein, L.; Belton, G.S.; Mineur, F.; Jueterbock, A.; Hoarau, G.; Gurgel, C.F.; Clerk, O.D. Improving transferability of introduced species’ distribution models: New tools to forecast the spread of a highly invasive seaweed. PLoS ONE 2013, 8, e63337. [Google Scholar] [CrossRef]
  23. Kobayashi, T.; Tateishi, R.; Alsaaideh, B.; Sharma, R.C.; Wakaizumi, T.; Miyamoto, D.; Bai, X.; Long, B.D.; Gegentana, G.; Maitiniyazi, A. Production of global land cover data–GLCNMO2013. J. Geogr. Geol. 2017, 9, 1–15. [Google Scholar] [CrossRef]
  24. Heikkinen, R.K.; Araújo, M.B.; Virkkala, R.; Thuiller, W.; Sykes, M.T. Methods and uncertainties in bioclimatic envelop modeling under climate change. Prog. Phys. Geogr. 2006, 30, 751–777. [Google Scholar] [CrossRef]
  25. Aguirre-Gutiérrez, J.; Carvalheiro, L.G.; Polce, C.; Emiel, V.E.E.; Raes, N.; Reemer, M.; Biesmeijer, J.C. Fit-for-purpose: Species distribution model performance depends on evaluation criteria–Dutch hoverflies as a case study. PLoS ONE 2013, 8, e63708. [Google Scholar] [CrossRef]
  26. Dormann, C.; Elith, J.; Bacher, S.; Buchmann, C.; Carl, G.; Carré, G.; Leitão, P. Collinearity: A review of methods to deal with it and a simulation study evaluating their performance. Ecography 2013, 36, 27–46. [Google Scholar] [CrossRef]
  27. Liu, L.; Wang, R.L.; Zhang, Y.Y.; Mou, Q.Y.; Gou, Y.S.; Liu, K.; Huang, N.; Ouyang, C.L.; Hu, J.Y.; Du, B.G. Simulation of potential suitable distribution of Alnus cremastogyne Burk. In China under climate change scenarios. Ecol. Indic. 2021, 133, 108396. [Google Scholar] [CrossRef]
  28. Chen, B.G.; Zou, H.; Zhang, B.Y.; Zhang, X.Y.; Jin, X.X.; Wang, C.; Zhang, X.X. Distribution pattern and change prediction of Saposhnikovia divaricata suitable area in China under climate change. Ecol. Indic. 2022, 143, 109311. [Google Scholar] [CrossRef]
  29. Zhu, G.P.; Jiao, H.J. Effect of the MaxEnt model’s complexity on the prediction of species potential distributions. Biodivers. Sci. 2016, 24, 1189–1196. [Google Scholar] [CrossRef]
  30. He, Y.L.; Ma, J.M.; Chen, G.S. Potential geographical distribution and its multi-factor analysis of Pinus massoniana in China based on the MaxEnt model. Ecol. Indic. 2023, 154, 110790. [Google Scholar] [CrossRef]
  31. Wei, B.; Wang, R.L.; Hou, K.; Wang, X.Y.; Wu, W. Predicting the current and future cultivation regions of Carthamus tinctorius L. using MaxEnt model under climate change in China. Glob. Ecol. Conserv. 2018, 16, e00477. [Google Scholar] [CrossRef]
  32. Mamun, M.; Kim, S.; An, K.G. Distribution pattern prediction of an invasive alien species largemouth bass using a maximum entropy model (MaxEnt) in the Korean peninsula. J. Asia-Pac. Biodivers. 2018, 11, 516–524. [Google Scholar] [CrossRef]
  33. Phillips, S.J.; Anderson, R.P.; Schapirer, E. Maximum entropy modeling of species geographic distributions. Ecol. Model. 2006, 190, 231–259. [Google Scholar] [CrossRef]
  34. Kim, M.J.; Baek, S.; Lee, S.B.; Lee, S.K.; Park, B.; Lee, Y.S.; Ahn, K.S.; Choi, Y.S.; Seo, H.Y.; Lee, J.H. Current and future distribution of Metcalfa pruinosa (Say) (Hemiptera: Flatidae) in Korea: Reasoning of fast spreading. J. Asia-Pac. Entomol. 2019, 22, 933–940. [Google Scholar] [CrossRef]
  35. Wei, J.; Gao, G.; Wei, J.F. Potential global distribution of Daktulosphaira vitifoliae under climate change based on MaxEnt. Insects 2021, 12, 347. [Google Scholar] [CrossRef]
  36. Ramasamy, M.; Das, B.; Ramesh, R. Predicting climate change impacts on potential worldwide distribution of fall armyworm based on CMIP6 projections. J. Pest Sci. 2021, 95, 841–854. [Google Scholar] [CrossRef]
  37. Zhao, Z.X.; Yang, L.; Long, J.K.; Chang, Z.M.; Chen, X.S. Predicting suitable areas for Metcalfa pruinose (Hemiptera: Flatidae) under climate change and implications for management. J. Insect Sci. 2024, 24, 7. [Google Scholar] [CrossRef]
  38. Wang, S.Y.; Lu, Y.Y.; Han, M.Y.; Li, L.L.; He, P.; Shi, A.M.; Bai, M. Using MaxEnt model to predict the potential distribution of three potentially invasive scarab beetles in China. Insects 2023, 14, 239. [Google Scholar] [CrossRef]
  39. Yu, Y.L.; Li, Z.Q. Predicting the potential distribution of Cheirotonus jansoni (Coleoptera: Scarabaeidae) under climate change. Insects 2024, 15, 1012. [Google Scholar] [CrossRef]
  40. Zhang, G.L.; Liu, S.; Xu, C.Q.; Wei, H.S.; Guo, K.; Xu, R.; Qiao, H.L.; Liu, P.F. Prediction of potential distribution of Carposina coreana in China under the current and future climate change. Insects 2024, 15, 411. [Google Scholar] [CrossRef]
  41. Wisz, M.S.; Hijmans, R.J.; Li, J.; Peterson, A.T.; Graham, C.H.; Guisan, A. Effects of sample size on the performance of species distribution models. Divers. Distrib. 2008, 14, 763–773. [Google Scholar] [CrossRef]
  42. Chen, X.M.; Lei, Y.C.; Zhang, X.Q.; Jia, H.Y. Effects of sample sizes on accuracy and stability of maximum entropy model in predicting species distribution. Sci. Silv. Sin. 2012, 48, 53–59. [Google Scholar]
  43. Ji, Q.Z.; Wang, R.X.; Huang, Z.P.; Yuan, J.H.; Ren, G.P.; Xiao, W. Effects of sample size and study range on accuracy of MaxEnt in predicting species distribution: A case study of the black-and-white snub-nosed monkey. Acta Theriol. Sin. 2019, 39, 126–133. [Google Scholar]
  44. Mota, J.D.; Barbosa, L.R.; Marchioro, C.A. Suitable areas for invasive insect pests in Brazil and the potential impacts for eucalyptus forestry. Pest Manag. Sci. 2022, 78, 2596–2606. [Google Scholar] [CrossRef]
  45. Zhang, Y.; Hughes, A.C.; Zhao, Z.H.; Li, Z.H.; Qin, Y.J. Including climate change to predict the global suitable area of an invasive pest: Bactrocera correcta (Diptera: Tephritidae). Glob. Ecol. Conserv. 2022, 34, e02021. [Google Scholar] [CrossRef]
  46. Santos, R.C.; Batista, C.V.; Santos, A.A.; da Silva, R.S.; Picanç, M.C. Predicting suitable areas for the invasive species Erthesina fullo (Hemiptera: Pentatomidae). Crop Prot. 2023, 172, 106297. [Google Scholar] [CrossRef]
  47. Yang, F.; Liu, Q.; Yang, J.; Liu, B.; Deng, X.; Gan, T.; Liao, X.; Li, X.; Xu, D.; Zhuo, Z. Evaluating the impact of climate change on the Asia habitat suitability of Troides helena using the MaxEnt model. Insects 2025, 16, 79. [Google Scholar] [CrossRef]
  48. Guo, Y.L.; Wei, H.Y.; Lu, C.Y.; Zhang, H.L.; Gu, W. Predictions of potential geographical distribution of Sinopodophyllum hexandrum under climate change. Chin. J. Plant Ecol. 2014, 38, 249–261. [Google Scholar]
  49. Ji, L.T.; Zheng, T.Y.; Chen, Q.; Zhong, J.J.; Kang, B. Responses of potential suitable area of Paris verticillata to climate change and its dominant climate factors. Chin. J. Appl. Ecol. 2020, 31, 89–96. [Google Scholar]
  50. Tan, Y.H.; Zhang, X.J.; Yuan, S.S.; Yu, J.H. Prediction of the ecological suitability of Gentiana macrophylla Pall. under scenarios of global climate change. Chin. J. Ecol. 2020, 39, 3766–3773. [Google Scholar]
  51. Chen, S.; Holyoak, M.; Liu, H.; Bao, H.; Ma, Y.; Dou, H.; Jiang, G. Effects of spatially heterogeneous warming on gut microbiota, nutrition and gene flow of a heat-sensitive ungulate population. Sci. Total Environ. 2022, 806, 150537. [Google Scholar] [CrossRef]
  52. Miao, G.T.; Zhao, Y.J.; Wang, Y.J.; Yu, C.J.; Xiong, F.; Sun, Y.K.; Cao, Y. Suitable habitat prediction and analysis of Dendrolimus houi and its host Cupressus funebris in the Chinese region. Forests 2024, 15, 162. [Google Scholar] [CrossRef]
  53. Kwon, T.-S.; Lee, C.M.; Kim, S.-S. Prediction of abundance of beetles according to climate warming in South Korea. J. Asia-Pac. Biodivers. 2015, 8, 7–30. [Google Scholar] [CrossRef]
  54. Wang, Y.H.; Ma, D.Y.; Deng, H.Y.; Wu, S.H. Climate change risk assessment of ecosystem productivity in the arid/humid transition zone of northern China. Acta Geogr. Sin. 2021, 76, 1605–1617. [Google Scholar]
  55. Zhang, Q.; Zhu, B.; Yang, J.H.; Ma, P.L.; Liu, X.Y.; Lu, G.Y.; Wang, Y.H.; Yu, H.P.; Liu, W.P.; Wang, D.W. New characteristics about the climate humidification trend in Northwest China. Chin. Sci. Bull. 2021, 66, 3757–3771. [Google Scholar] [CrossRef]
  56. Flower, A.; Murdock, T.Q.; Taylor, S.W.; Zwiers, F.W. Using an ensemble of downscaled climate model projections to assess impacts of climate change on the potential distribution of spruce and Douglas-fir forests in British Columbia. Environ. Sci. Policy 2013, 26, 63–74. [Google Scholar] [CrossRef]
Figure 1. Jackknife test used for evaluating the importance of environmental variables.
Insects 16 00626 g001
Figure 2. Response curves between the existence probability of Luprops orientalis and variables.
Insects 16 00626 g002
Figure 3. The occurrence records of Luprops orientalis (A) and suitable habitats for L. orientalis under the near-current climate (B).
Insects 16 00626 g003
Figure 4. Suitable areas for Luprops orientalis under SSP1-2.6, SSP2-4.5, and SSP5-8.5 in 2041–2060 and 2081–2100, respectively.
Insects 16 00626 g004
Figure 5. Suitable area changes for Luprops orientalis during 2041–2060 and 2081–2100.
Insects 16 00626 g005
Figure 6. Shift in geometric center in suitable area under future climate scenarios.
Insects 16 00626 g006
Table 1. The selected 10 environmental variables used for modeling in this study.
VariableVariable DescriptionContribution (%)
Bio02Mean daily temperature range0.2
Bio04Temperature seasonality22.2
Bio07Average annual temperature range2.3
Bio08Mean temperature of the wettest quarter0.8
Bio09Mean temperature of the driest quarter2.4
Bio13Precipitation of the wettest month9
Bio15Precipitation seasonality0.4
Bio18Precipitation of the warmest quarter61.3
Bio19Precipitation of the coldest quarter0.7
gm-lc-v3Land cover type0.8
Disclaimer/Publisher’s Note: The statements, opinions and data contained in all publications are solely those of the individual author(s) and contributor(s) and not of MDPI and/or the editor(s). MDPI and/or the editor(s) disclaim responsibility for any injury to people or property resulting from any ideas, methods, instructions or products referred to in the content.

