Article

Species Richness and Distribution of Calliphoridae Along an Elevation Gradient in Sicily (Italy) and Ecuador

by
Maria Denise Gemmellaro
1,*,
Gail Scott Anderson
2,
George Craig Hamilton
3,
Mariela Domínguez-Trujillo
4,5 and
Lauren Marie Weidner
6
1
Kean University, 1000 Morris Ave, Union, NJ 07083, USA
2
Simon Fraser University, 8888 University Dr W, Burnaby, BC V5A 1S6, Canada
3
Rutgers, The State University of New Jersey, 57 US Highway 1, New Brunswick, NJ 08901, USA
4
Pontificia Universidad Católica del Ecuador, Ave 12 de Octubre 1076, Quito 170143, Ecuador
5
Universidad San Francisco De Quito, Campus Cumbayá, Diego de Robles s/n, Quito 170901, Ecuador
6
Arizona State University, West Campus, 4701 W Thunderbird Road, Glendale, AZ 85306, USA
*
Author to whom correspondence should be addressed.
Insects 2025, 16(5), 498; https://doi.org/10.3390/insects16050498
Submission received: 6 February 2025 / Revised: 24 April 2025 / Accepted: 28 April 2025 / Published: 6 May 2025
(This article belongs to the Special Issue Diptera Diversity: Systematics, Phylogeny and Evolution)

Simple Summary

This research describes two surveys conducted at different elevations in Sicily and Ecuador to assess the presence and distribution of blow fly species; larvae of these flies are important in forensic investigations because they feed on decomposing corpses. Baited traps were deployed at four different elevations in both regions to attract adult blow flies in order to analyze their species richness and relative abundance. In Sicily, a total of 12 different species were observed, with Lucilia sericata being the most abundant (68.5%); in Ecuador, 17 species were observed, with Compsomyiops verena being the most abundant (51.7%). Significant differences in relative abundance were observed across elevations for some species. The results of this research are valuable for medico-legal forensic entomology; they can help with the assembly of species checklists for these regions, which can then assist in the identification and analysis of blow fly species recovered from a body at death scenes. Moreover, a better understanding of the impact of elevation on species distribution can support environmental investigations as well as the assessment of changes in species ranges.

Abstract

Blow flies (Diptera: Calliphoridae) are among the first insects to arrive on a corpse, and so they are particularly important in forensic entomology. To use blow flies in forensic investigations, there must be information available on their species diversity, abundance, and distribution in the areas where investigations are conducted. Several factors can contribute to species distribution, and elevation is one of those factors. The purpose of this study was to document the distribution of Calliphoridae across four elevational gradients in Sicily and Ecuador, where little information is available. Baited traps were placed at elevations ranging from 20 m to 1552 m in Sicily (a major island and region of Italy and a distinct ecoregion) and 561 m to 3336 m in Ecuador. Species richness, relative abundance, and diversity were calculated, as well as the ratio of female to male blow flies and community assemblage. Twelve species were collected in Sicily, and seventeen species were collected in Ecuador. In Sicily, the most abundant species was Lucilia sericata (Johann Wilhelm Meigen, 1826) (68.50% of the total capture), while in Ecuador, it was Compsomyiops verena (Walker) (51.67% of the total capture). In Sicily, significant differences were only observed in the relative abundance of L. sericata across elevations. In Ecuador, significant differences were observed in the relative abundance of Calliphora nigribasis (Macquart), Chrysomya albiceps (Wiedemann), C. verena, Hemilucilia semidiaphana (Rondani), Lucilia ibis (Shannon), L. purpurascens (Walker), and Paralucilia sp. across elevations. These data can help build a checklist of blow fly species in these two regions and can be instrumental in environmental and forensic investigations.

Graphical Abstract

1. Introduction

Blow flies (Diptera: Calliphoridae) are the main initial arthropod decomposers of carrion [1]. Because of their necrophilous behavior, they are of great use to medico-legal entomology and forensic investigations and have therefore been the object of numerous studies in the literature.
Attracted by the Volatile Organic Compounds (VOCs) released by a decomposing body, adult blow flies are able to detect an exposed corpse shortly after death occurs [2,3]. In Colorado, De Jong [4] observed that a dead greyhound carcass was visited by adults of Phormia regina (Johann Wilhelm Meigen, 1826) 40 s after exposure and that oviposition occurred 13 min after exposure. Blow flies can travel several kilometers to reach carrion [5,6] and use it for their trophic needs as well as an oviposition substrate. Blow fly species, like Lucilia cuprina (Christian Rudolph Wilhelm Wiedemann, 1830), require a protein meal for the maturation of their ovaries [7]; a decaying corpse will provide such a meal and will also represent an efficient site for laying their eggs [8,9]. In South Africa, adults of Chrysomya albiceps (Christian Rudolph Wilhelm Wiedemann, 1819) and Chrysomya marginalis (Christian Rudolph Wilhelm Wiedemann, 1830) were observed traveling several kilometers to find a suitably sized carcass to lay their eggs [10]. For these reasons, blow flies are usually the most numerous insect group observed on decomposing remains. A study of arthropod succession on carrion in Venezuela reported that seven of the fourteen collected species of primary forensic importance were calliphorid flies [11]. A similar study in Vienna, Austria, traced insect presence on a decomposing carcass for 60 days and observed that blow flies were the most abundant in the initial 15 days [1].
The functional roles of blow flies in ecosystems are diverse. Besides recycling carrion, several species use feces as a protein source and can therefore be important vectors of enteric pathogens [12,13]. They can also colonize living hosts (humans or other vertebrates); this phenomenon is known as myiasis and can have a strong impact on the livestock industry [14]. Blow flies are important pollinators; studies have analyzed their role in the pollination of different crops, including carrots [15] and Brussels sprouts [16], both wild-growing and in cages [17,18], hypothesizing a potential use of calliphorids as managed pollinators.
The most well-known role of Calliphoridae remains the one they play in forensic entomology. Since they are the first individuals to arrive and colonize a body shortly after death [19,20], blow flies are also among the main necrophagous insects to be used in forensic investigations and can be used to estimate the minimum post mortem interval (mPMI), defined as the time elapsed from the colonization of the body to its discovery [21,22,23]. In order to use blow flies appropriately in forensic entomology, it is essential to have information on their species diversity, abundance, and distribution for each geographic area where investigations are conducted. Studies have analyzed information about blow fly species composition and community structure in different areas around the world, including North America [24,25,26], Europe [27,28,29,30,31], and Asia [32]. Although some of this work analyzed the spatial and temporal distribution of blow flies [26,29,31], very little work has been done focusing on the elevational distribution of such flies [33,34,35,36]. Hodecek and Jakubec [37] examined 160 criminal investigations from 1993 to 2007 in Switzerland, where entomological evidence was used in the cases. They examined the effect of elevation on the presence or absence of species, eliminating the effect of seasons. They discovered that elevation is significantly associated with the occurrences of blow flies; for example, increases in the number of Calliphora vomitoria (Carl Linnaeus, 1758) were highly correlated with increasing elevation. Calliphora vomitoria and Lucilia caesar (Johann Wilhelm Meigen, 1858) showed a significant change in presence with elevation (higher elevations were preferred by C. vomitoria, while lower elevations were preferred by L. caesar); however, elevation seemed to have an effect on other species as well.
Species distribution across different elevations has been examined for several taxa and has shown that there are two commonly observed relationship patterns between elevation and species richness. The first pattern is known as a monotonic decrease, where species richness decreases as elevation increases [38,39]. The second most common pattern is a hump-shaped pattern, where species richness peaks at intermediate elevations [40,41,42,43,44,45,46,47,48]. These patterns have been shown to exist across various forms of taxa, including fungi [49], vascular plants [50], birds [51], mammals [52], and insects [39,41,44,53,54,55,56,57,58,59]. The distribution of species across elevational gradients can be impacted by several biotic and abiotic factors (e.g., temperature, humidity, and human and non-human animal activity, including deforestation and urbanization). Numerous abiotic factors play a role in the relationship between species distribution and elevation; among them are physical geometric constraints [60,61] and climate [62,63]. If species are constrained by hard boundaries (large bodies of water), the bottom of a valley (lower boundaries), or eco-physiological features such as elevation increase (upper boundaries) [64], they may face an actual barrier to dispersal [61].
On a global level, anthropogenic climate change over the period from 1850–1900 to 2010–2019 has resulted in a temperature increase of 0.8 °C to 1.3 °C, with a best estimate of 1.07 °C. The predicted climate response to greenhouse gas emissions results in a best estimate of warming for 2081–2100 that spans a range from 1.4 °C to 4.4 °C [65]. By 2100, an increase in temperature of 1.4–5.8 °C has been estimated, compared to 1990 [66]. Along with warmer temperatures, seasonal changes in precipitation, radiation, potential evapotranspiration, and other climatic regimes are predicted [67]. Studies performed across different taxa have shown that the duration of life cycle stages was affected in response to climatic changes throughout the year [68,69,70] and that their distributions shifted towards higher latitudes or higher elevations [71,72,73,74]. Furthermore, it was shown that rising temperatures may bring new ecological interactions (e.g., new species introduction, new predator–prey interactions, or new plants that do not provide enough nutrients) [75], as well as alterations of existing interactions due to differences in thermal sensitivities [76]. These potential climatic changes can dramatically impact species distribution, as species are expected to respond to these changes at the species level [77]; moreover, the specific thermal biology of blow fly species may help in understanding their distribution in both micro-environments and on a larger, global scale [78]. The effects of climatic impact on insects of forensic importance have recently been investigated, and it was asked the biodiversity of forensically relevant taxa be surveyed and monitored to establish a baseline for their occurrences [79,80].
Better knowledge of the distribution of blow fly species across elevational gradients in areas rich in biodiversity will improve our understanding of the biology and behavior of this group. This information will provide not only a tool for ecological investigations of climatic changes, but also for forensic investigations. Information on biodiversity and distribution of these taxa will be valuable in medico-legal entomology, particularly when using insects to estimate the minimum post-mortem interval or the time of colonization. Knowing the probable species composition at a specific location and season can indeed improve the forensic significance of those estimations; moreover, the occurrence of indicator species can be an essential step towards better understanding of how the environment influences insect colonization. Therefore, the purpose of this study was to document the distribution of forensically important Calliphoridae across elevational gradients in two different areas, Sicily and Ecuador, for which little information is available.

2. Materials and Methods

2.1. Sampling Procedure

Sampling was performed at all sites using different aerial traps baited with beef liver (Sicily) and a mixture of chicken products (Ecuador); while both types of bait are reported in the literature [81], bait was chosen based on availability in each location. Traps were baited on site, hung from trees at an average height of 1.8 m ± 0.12 m (SE), and left at the site for one week. During the sampling periods, any traps that were lost or stolen were not replaced. Two one-week sampling sessions were conducted in July of 2017 in Sicily and in July of 2016 in Ecuador; the different sampling times were due to practical reasons. At the end of each sampling period, the traps were collected and emptied. Adult Diptera were cleaned with water, left to dry, placed in vials, and frozen until they were sorted by family and pinned. Non-dipteran arthropods were not considered in this survey. Identifications were performed using morphological characteristics with several keys [82,83,84,85]. Sex was determined based on the distance between their eyes; the space between the eyes of a female is broader than what is observed in males [86]. Datasets for the two locations can be viewed at https://doi.org/10.5281/zenodo.7062111 and https://doi.org/10.5281/zenodo.7060325.

2.2. Study Areas

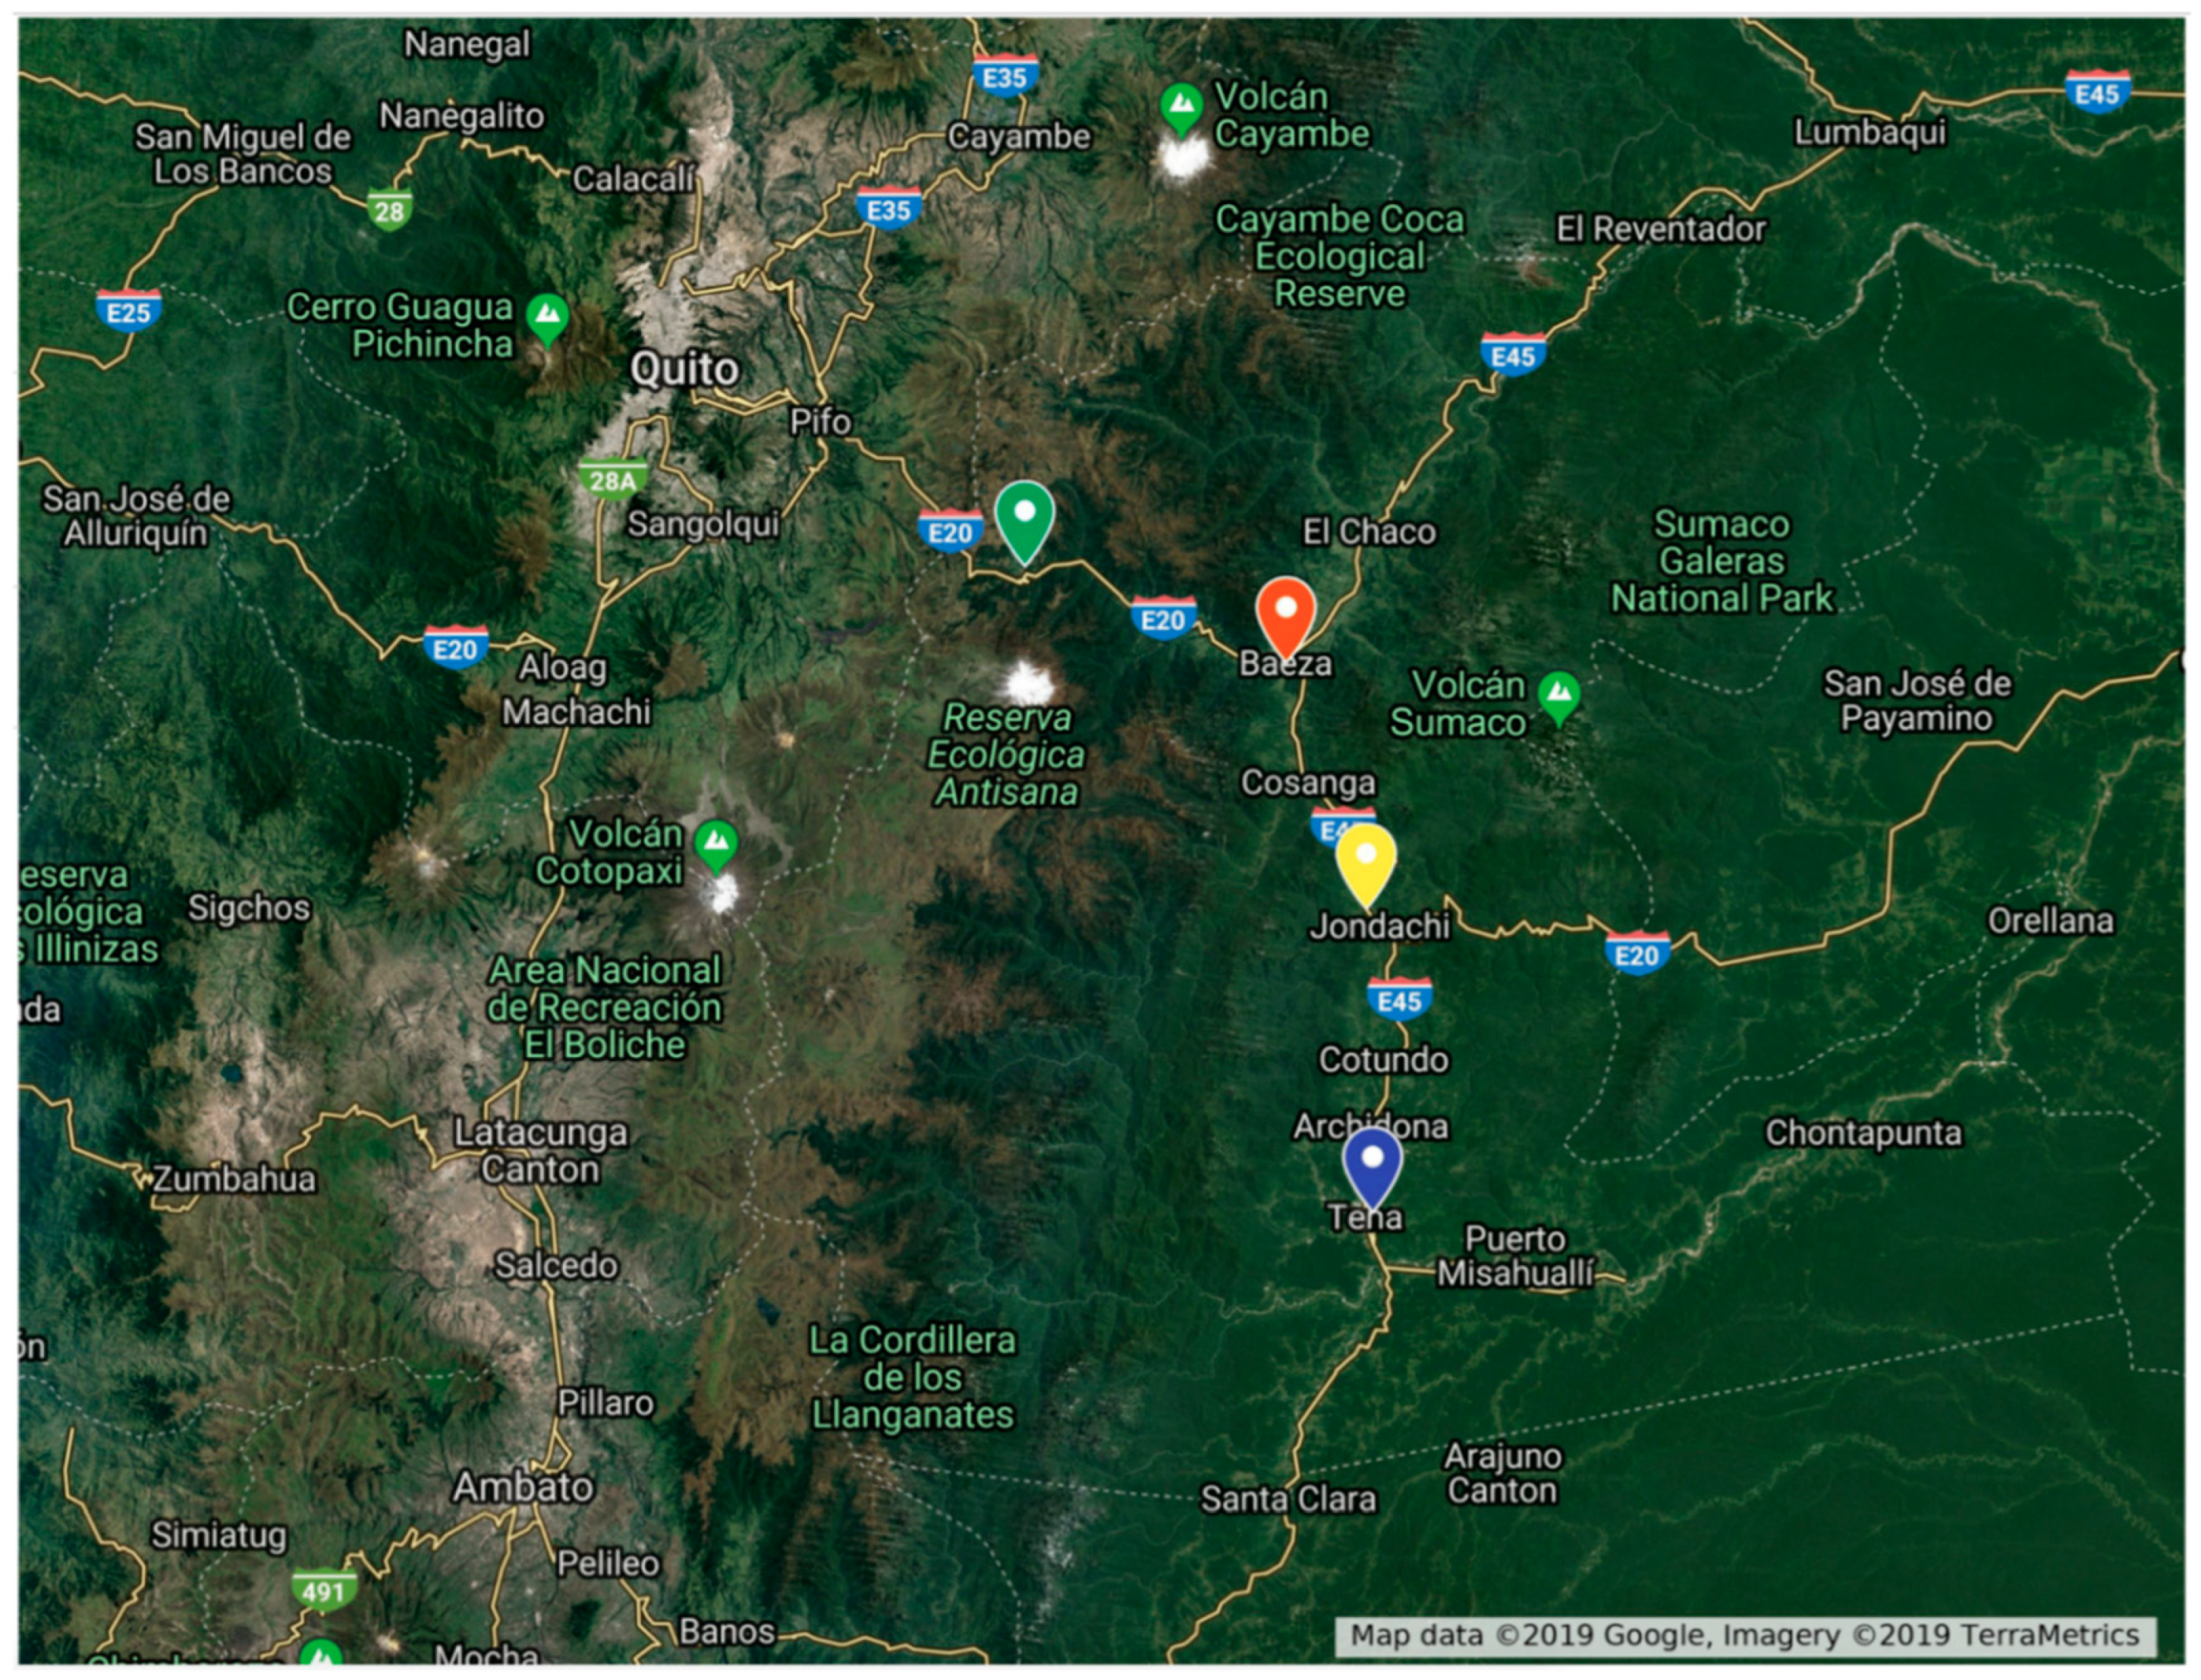
The survey was conducted in the eastern part of Sicily, on the slopes of Mt. Etna (Figure 1), and in the inner part of Ecuador (Figure 2). These areas were chosen because both locations were accessible, had substantial changes in elevation, and lacked information on the biodiversity and distribution of forensically important blow flies. All sites are also listed in Table 1.
Level 1 (37.5427° N, 15.0843° E, Elevation 20 m): This site is located in a green area populated by moderate Mediterranean vegetation (macchie or garrigue), Cistus sp. (Cistaceae), and Senecio sp. (Senecioneae) near the city of Catania, which has some of the highest seismic activity in the country [87]. It is located on the southeastern slope of Mt. Etna and is one of the more populated cities in Sicily, with 314,000 people in 2017 (ISTAT, National Institute of Statistics).
Level 2 (37.8071° N, 14.6994° E, Elevation 700 m): This site is located in the area of San Teodoro, a small village in the Province of Messina, on the western side of Mt. Etna. The area is covered by Mediterranean scrubs, almond trees (Prunus dulcis, Rosaceae), and willows (Salix sp. Salicaceae).
Level 3 (37.8521° N, 14.6919° E, Elevation 1153 m): This area is known as Condrada Casale Nuovo, though it is still part of the San Teodoro municipality. This rural area is covered in Turkey oaks (Quercus laevis (Thomas Walter) Fagaceae) and elders (Sambucus nigra (Carl Linnaeus) Adoxaceae).
Level 4 (37.9258° N, 14.6702° E, Elevation 1552 m): This rural site is on Monte Soro, the highest peak of the Nebrodi Mountains, located northwest of Mt. Etna. The most abundant trees in this area are beech trees (Fagus sp.).
Level 1 (0.5956° S, 77.5011° O, Elevation 561 m): This site is part of a megathermal rainforest and is located in the area around Tena, in the valley of the Misahuallí River, in the Amazon region. Tree crowns, in this area, are not commonly stratified because they belong to a large number of species, whose maturation period and reaction to light is different.
Level 2 (0.4143° S, 77.4837° O, Elevation 1312 m): This site is located in Sarayacu (1312 m), situated in a tropical rainforest in the Amazon region. In this area, trees are typically quite diverse, and gregarious dominants are usually not common. Tropical rainforest is often defined as multilayered, since the tree crowns form distinct strata.
Level 3 (0.282.31° S, 77.533365° O, Elevation 1948 m): This site is located in the area around Baeza in the central northern part of the Ecuadorian Amazon Forest. The climate is equatorial, semi-humid, and mesothermic. This area is incredibly diverse, and in a one-hectare plot of land, it is possible to find 40 to 100 species of trees [88].
Level 4 (0.222324° S, 78.82235° O, Elevation 3336 m): The highest of the Ecuador sites, this location is in Papallacta, a mountainous area of the eastern Cordillera whose ecosystems range from tropical forests to alpine/glaciers as the elevation increases. It is characterized by an equatorial, high-mountain climate, and one of the most well-known species of this area is the paper tree (Polylepis sp.), whose height can reach up to 10 m.

3. Data Analysis

Calliphorid species richness (number of species), relative abundance, and community structure (occurrence and abundance) were analyzed for each region and elevation. All data were subjected to a Shapiro–Wilkes test to determine if the raw data were normally distributed prior to analysis. This test revealed that relative abundance in both Sicily and Ecuador was not normally distributed; richness was not normally distributed in Ecuador but had a normal distribution in Sicily. The relationship between species richness/abundance and elevation was analyzed using a Kruskal–Wallis test. This nonparametric test is an alternative to a one-way (between groups) ANOVA and is commonly used to compare three or more sample ranks instead of means. The null hypothesis tested was that samples used for comparisons were drawn from the same distribution or from distributions having the same median [89]. To analyze species richness in Sicily, which was normally distributed, an ANOVA was performed. When significant results were obtained, a post hoc test was performed; significant results after the Kruskal–Wallis analysis were further analyzed with a Dunn test [90] with the Benjamini–Hochberg adjustment for pairwise comparison [91], while significant results obtained after the ANOVA were further analyzed through a Tukey’s HSD test. For each elevation level within each ecoregion, the Shannon (H) [92] diversity index and the Sørensen’s Similarity Index CC [93] were calculated. Sørensen’s Similarity Index CC is an index that compares the species composition of two sites, taking into account the species present in each of the two sites and the species each have in common, and ranges between 0 and 1, with 0 being completely dissimilar and 1 being completely similar.
Considering the differences in sample size across elevations, we also performed a rarefaction/extrapolation analysis using the iNEXT online software developed by Dr. Anne Chao [94,95]. This software computes and plots rarefaction curves, allowing users to compare diversity estimates across different samples by standardizing data to a common sample size or coverage. Rarefaction curves allow the visualization of the expected number of species (richness) for a given sample size [96,97]. For the analysis, we selected the following parameters: Abundance data type, Diversity order q = 0 (Species Diversity), Bootstraps = 50, Confidence interval = 0.95.
Using the methods developed by Dufrêne and Legendre [98] and used by Weidner et al. [26], a nonmetric multidimensional scaling (NMDS) analysis followed by a multi-response permutation procedure (MRPP) for multiple pairwise comparison [99] and an indicator species analysis (ISA) were performed. A multi-response permutation procedure (MRPP) is a permutation test that assesses differences in two or more groups by comparing the distance between the sample units in each group. It is commonly used when assessing whether the distributions of such groups are similar or different. The null hypothesis is that there is no difference between the groups. An indicator value is used to indicate which taxon or taxa are considered the best predictor of that elevation; a value of 0 shows that they are a poor predictor, and a value of 100 shows a perfect predictor. In order to sort species and examine their degree of association, a cluster analysis based on abundance was performed. Distances between clusters are determined by the greatest distance between any two items in different clusters. Analyses were conducted using R Studio 1.1.463 [100], Microsoft® Excel 2018 version 16.21.1, and Google Colab [101].

4. Results

Average temperatures (±SE), average humidity (±SE), and total precipitation in each location were recorded (Table 2).

4.1. SICILY

A total of 9923 adult Diptera were collected; of these, a total of 4926 belonged to the family Calliphoridae, encompassing 12 species within four genera (Table 3). The most abundant calliphorid species overall was Lucilia sericata (68.50%). The least abundant species was Cynomya mortuorum (Carl Linnaeus, 1761) (0.02%).
The elevation where the highest number of blow flies were collected was 700 m (3108 individuals), followed by 1153 m (1150 individuals), 1552 m (397 individuals), and 20 m (206 individuals). The predominant species at 20 m were L. sericata and Calliphora vicina (Jean-Baptiste Robineau-Desvoidy, 1830). At 700 m, the dominant species was L. sericata. At 1153 m, C. vicina, followed by L. sericata, were the two most abundant species. At the highest elevation (1552 m), Calliphora vomitoria and C. vicina were the most collected species (Table 3). The sex ratio of calliphorids collected showed an overall bias towards females, with an overall m/f ratio of 0.15. The m/f ratio for the two most common species was 0.05 and 0.54 for L. sericata and C. vicina, respectively (Table 4).
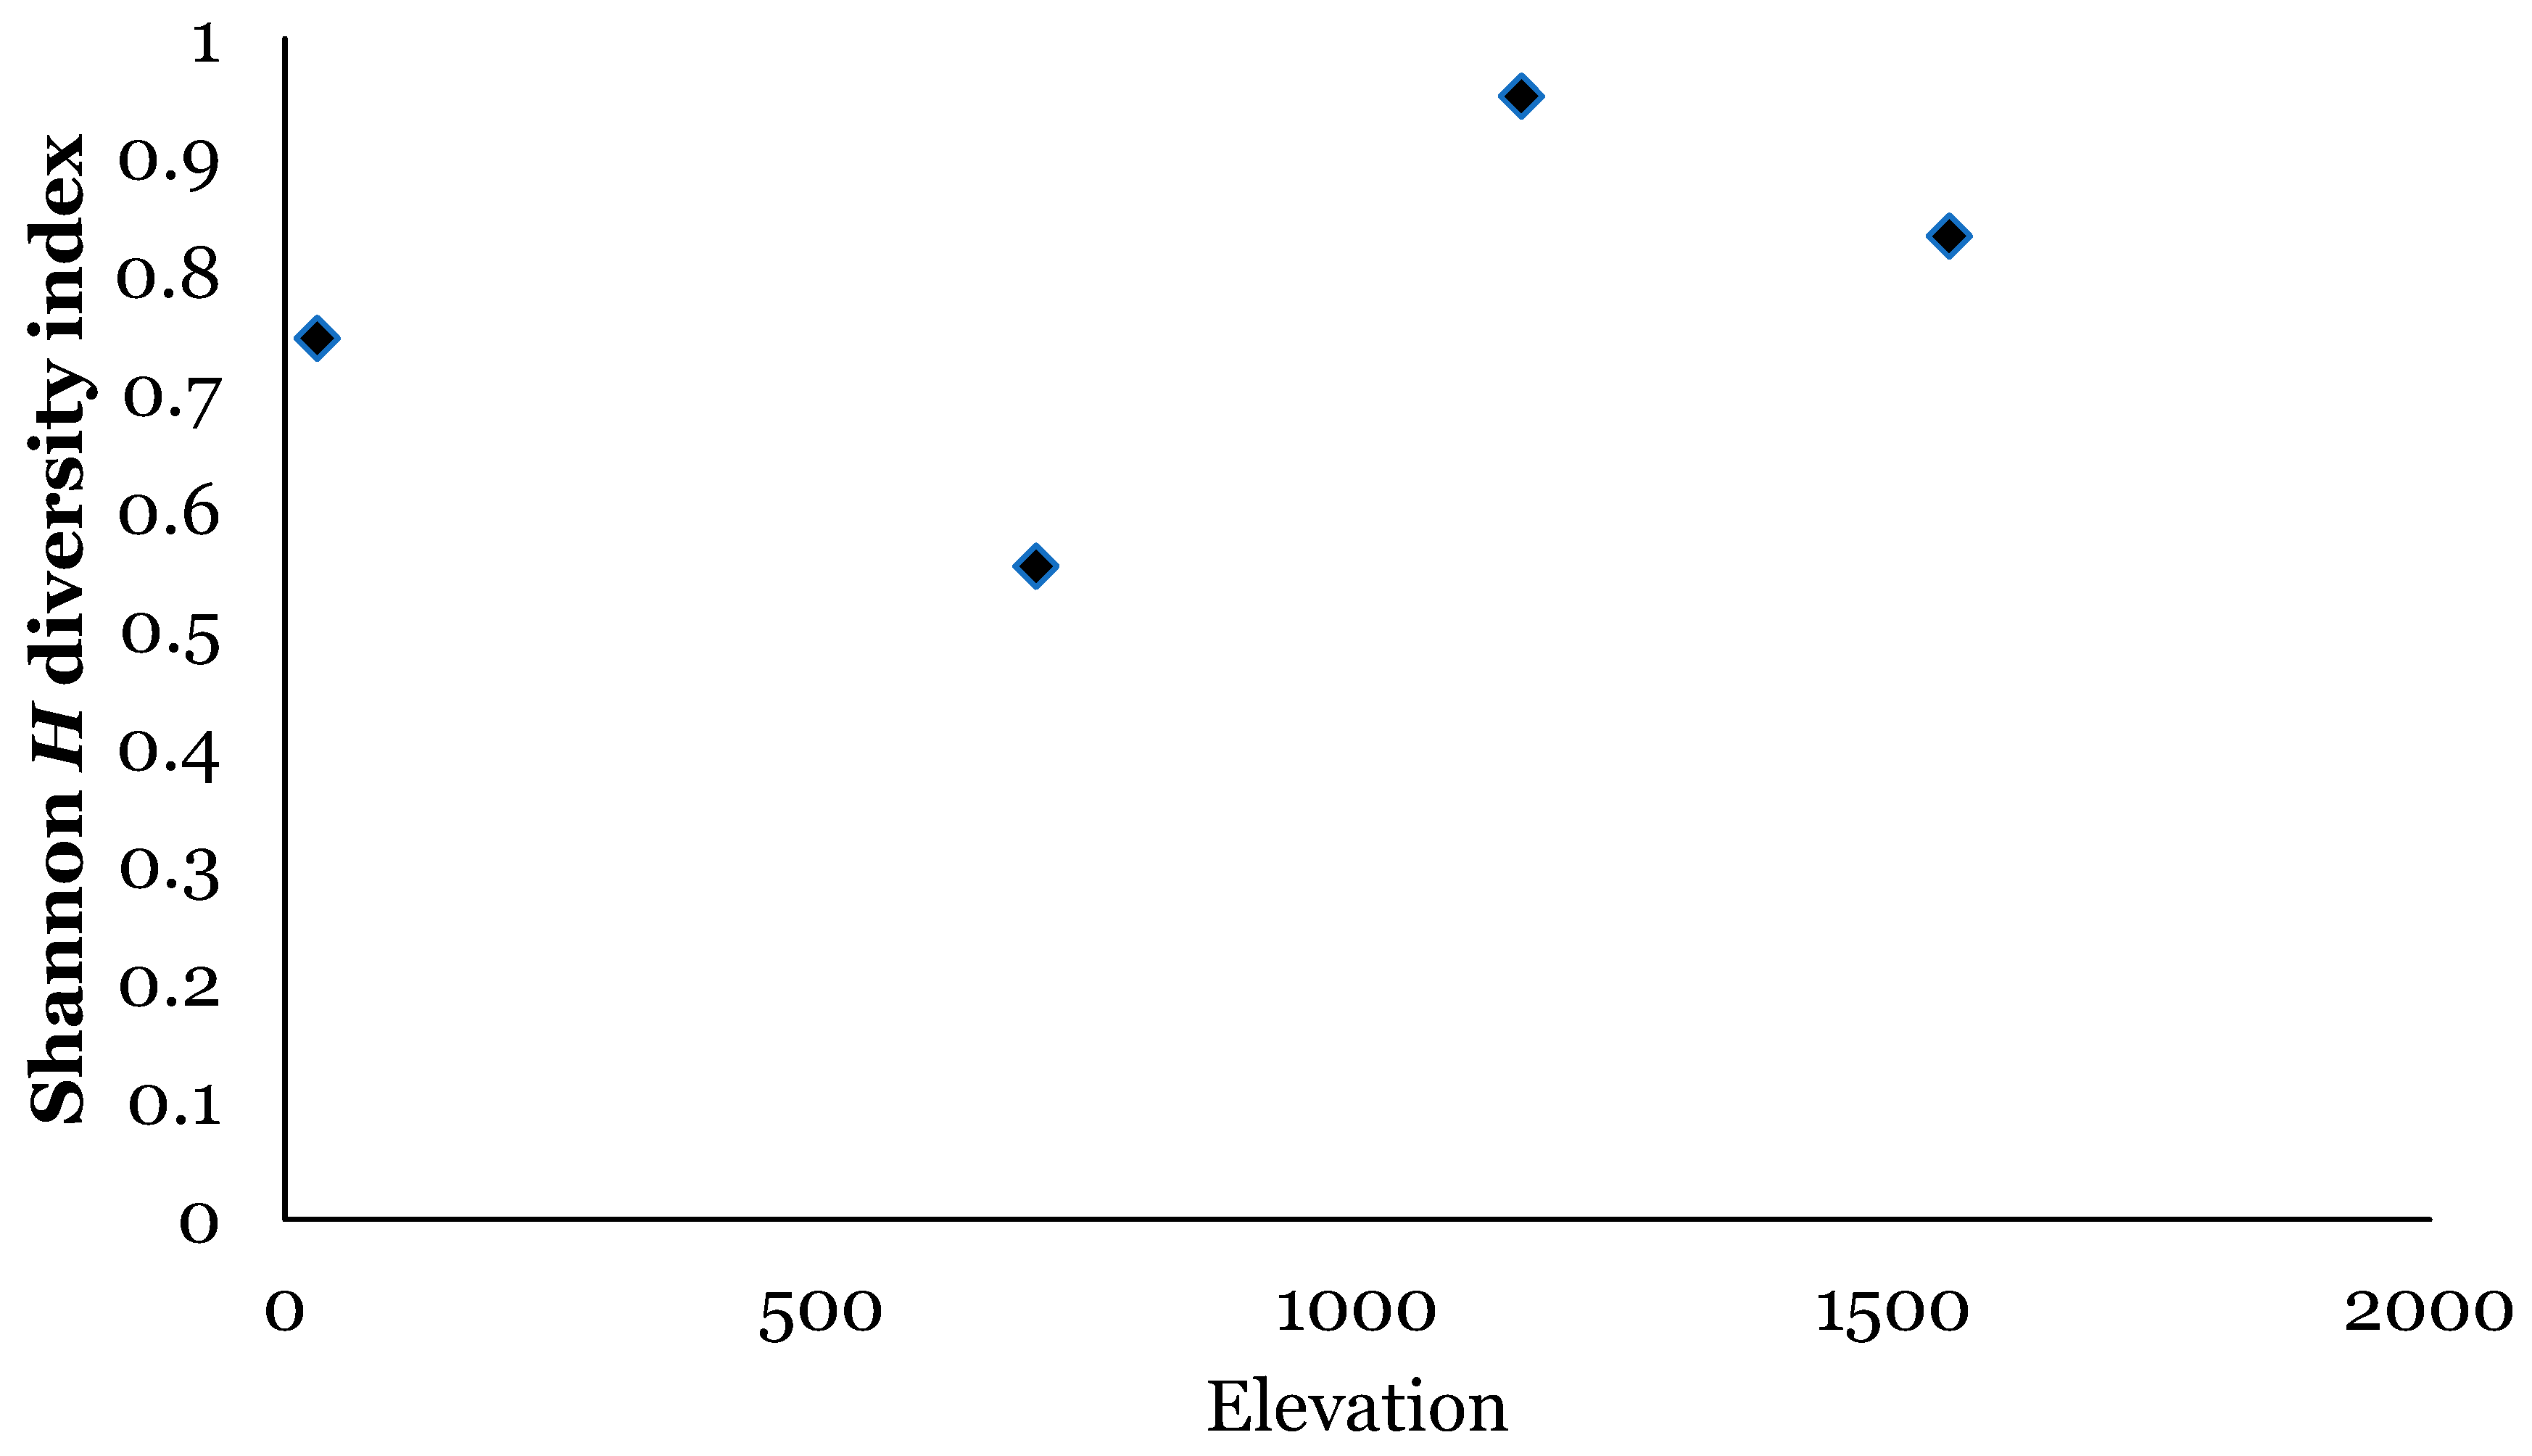
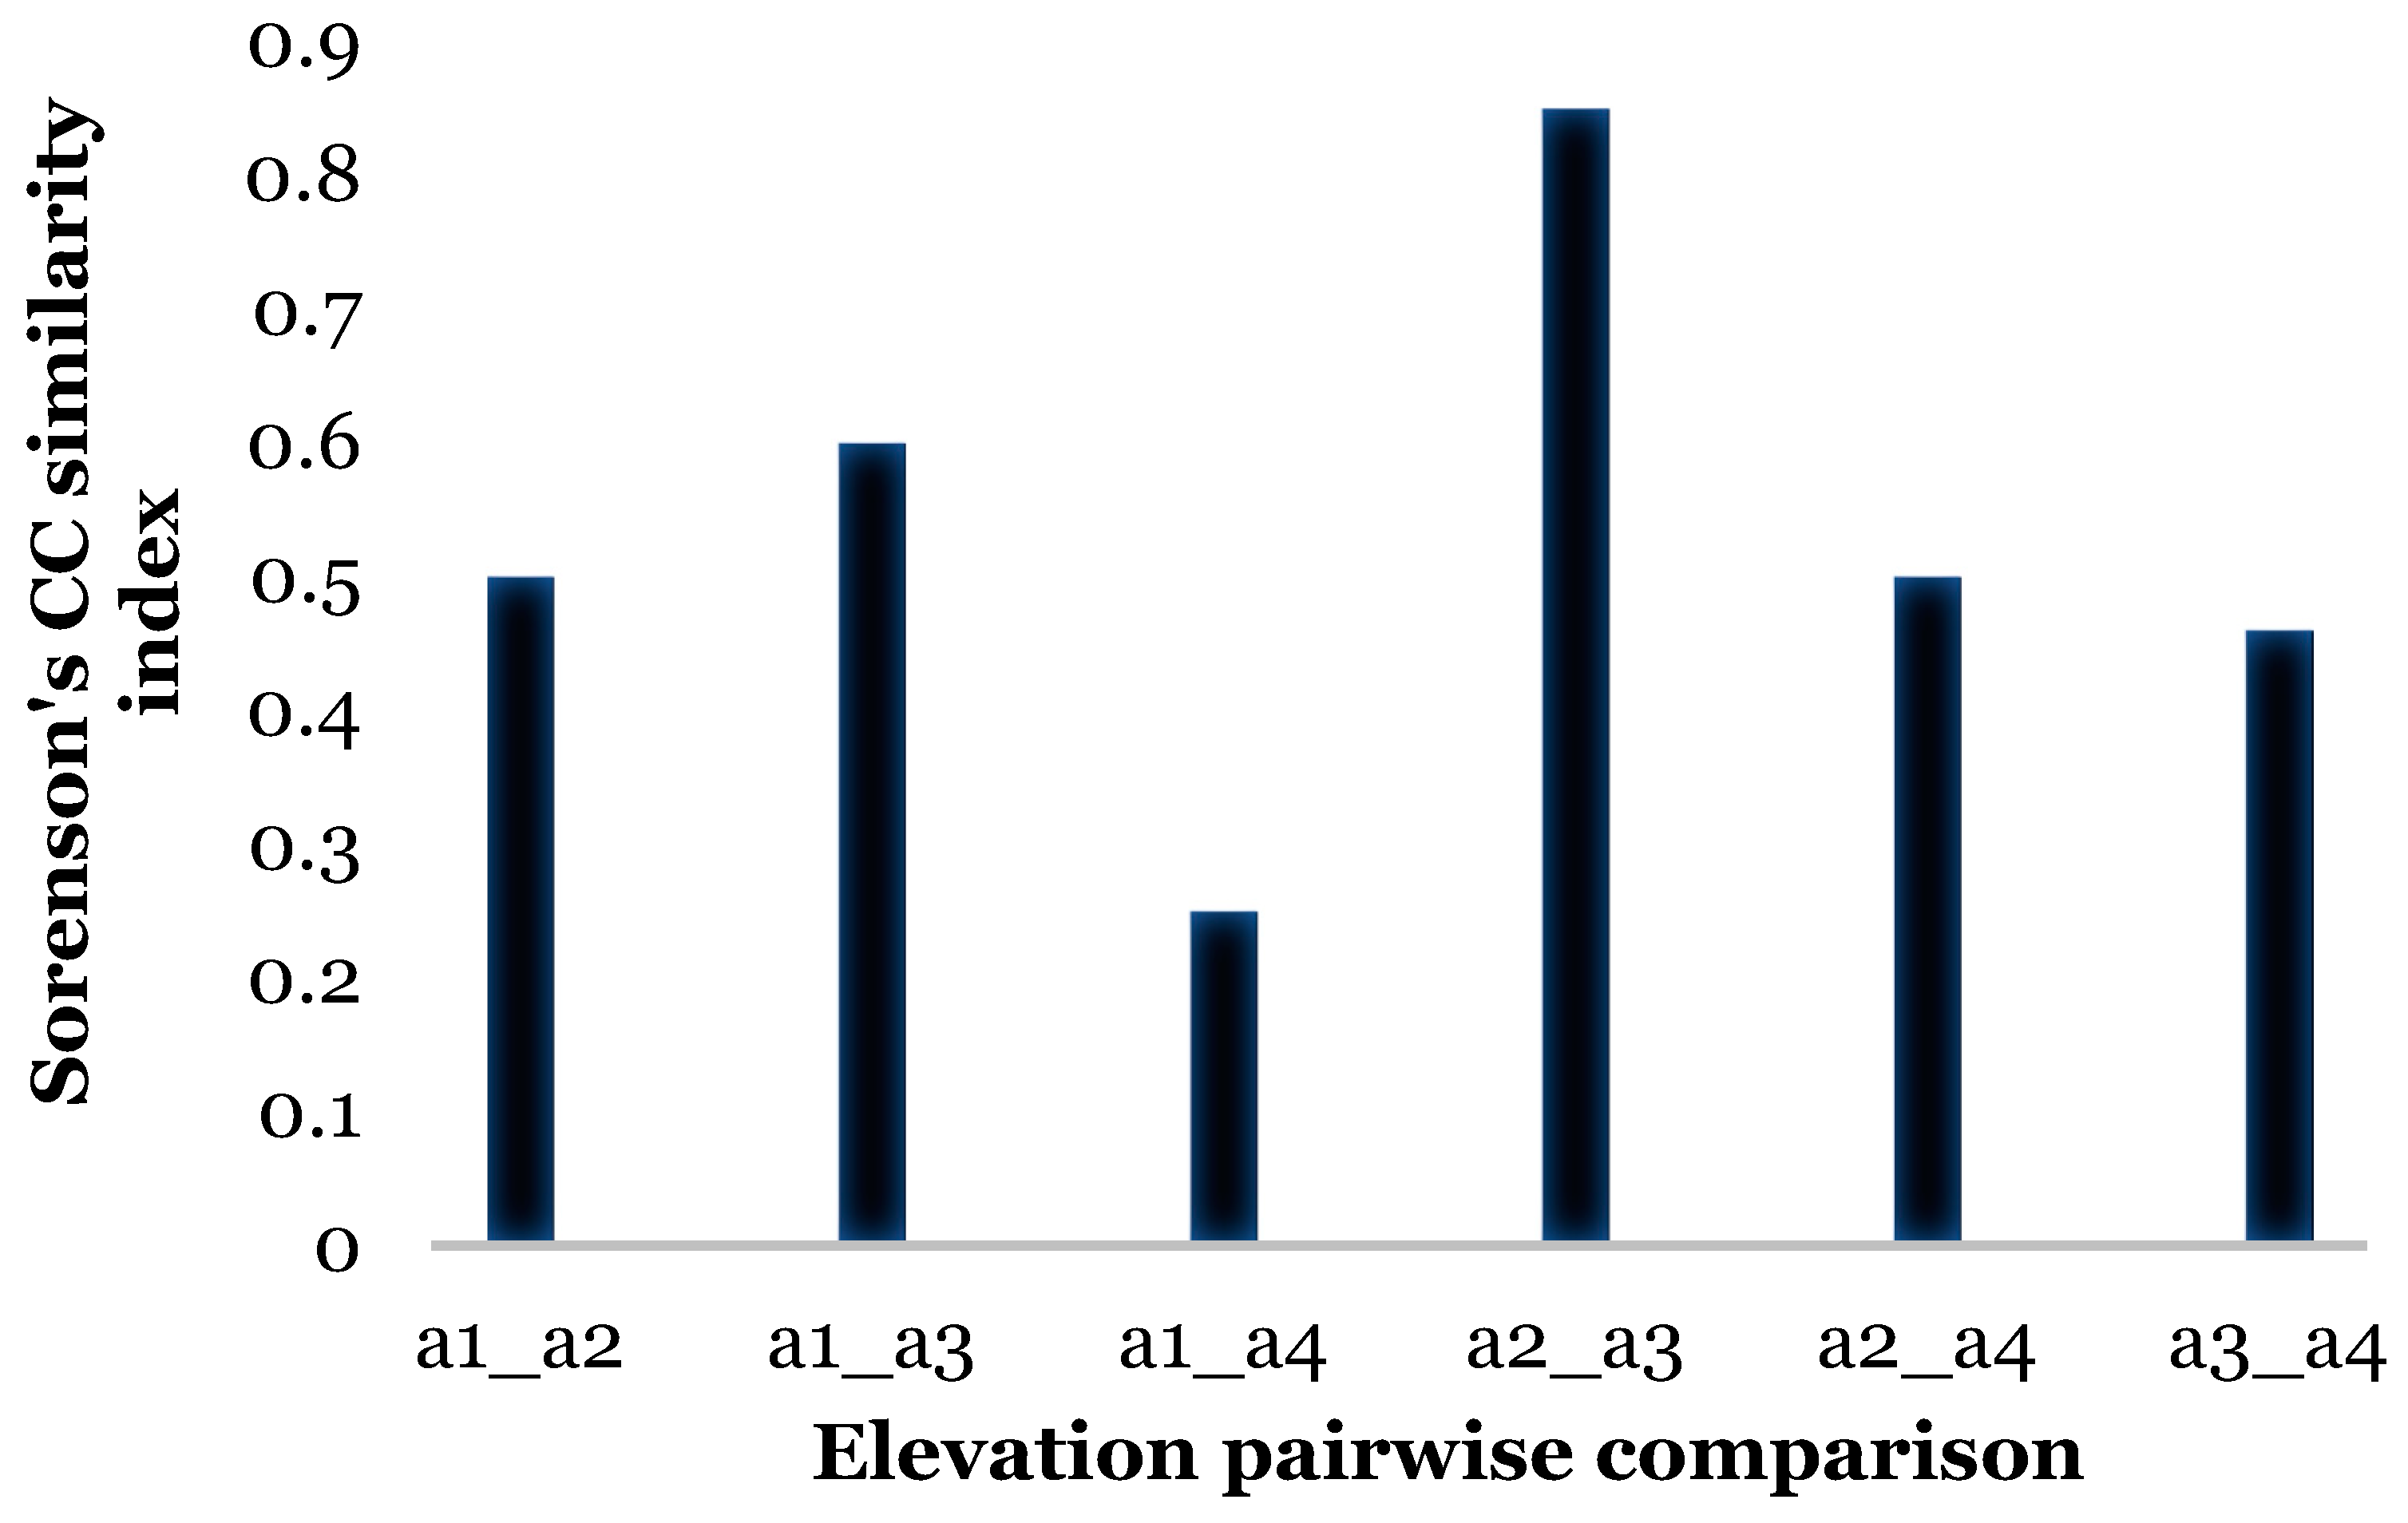
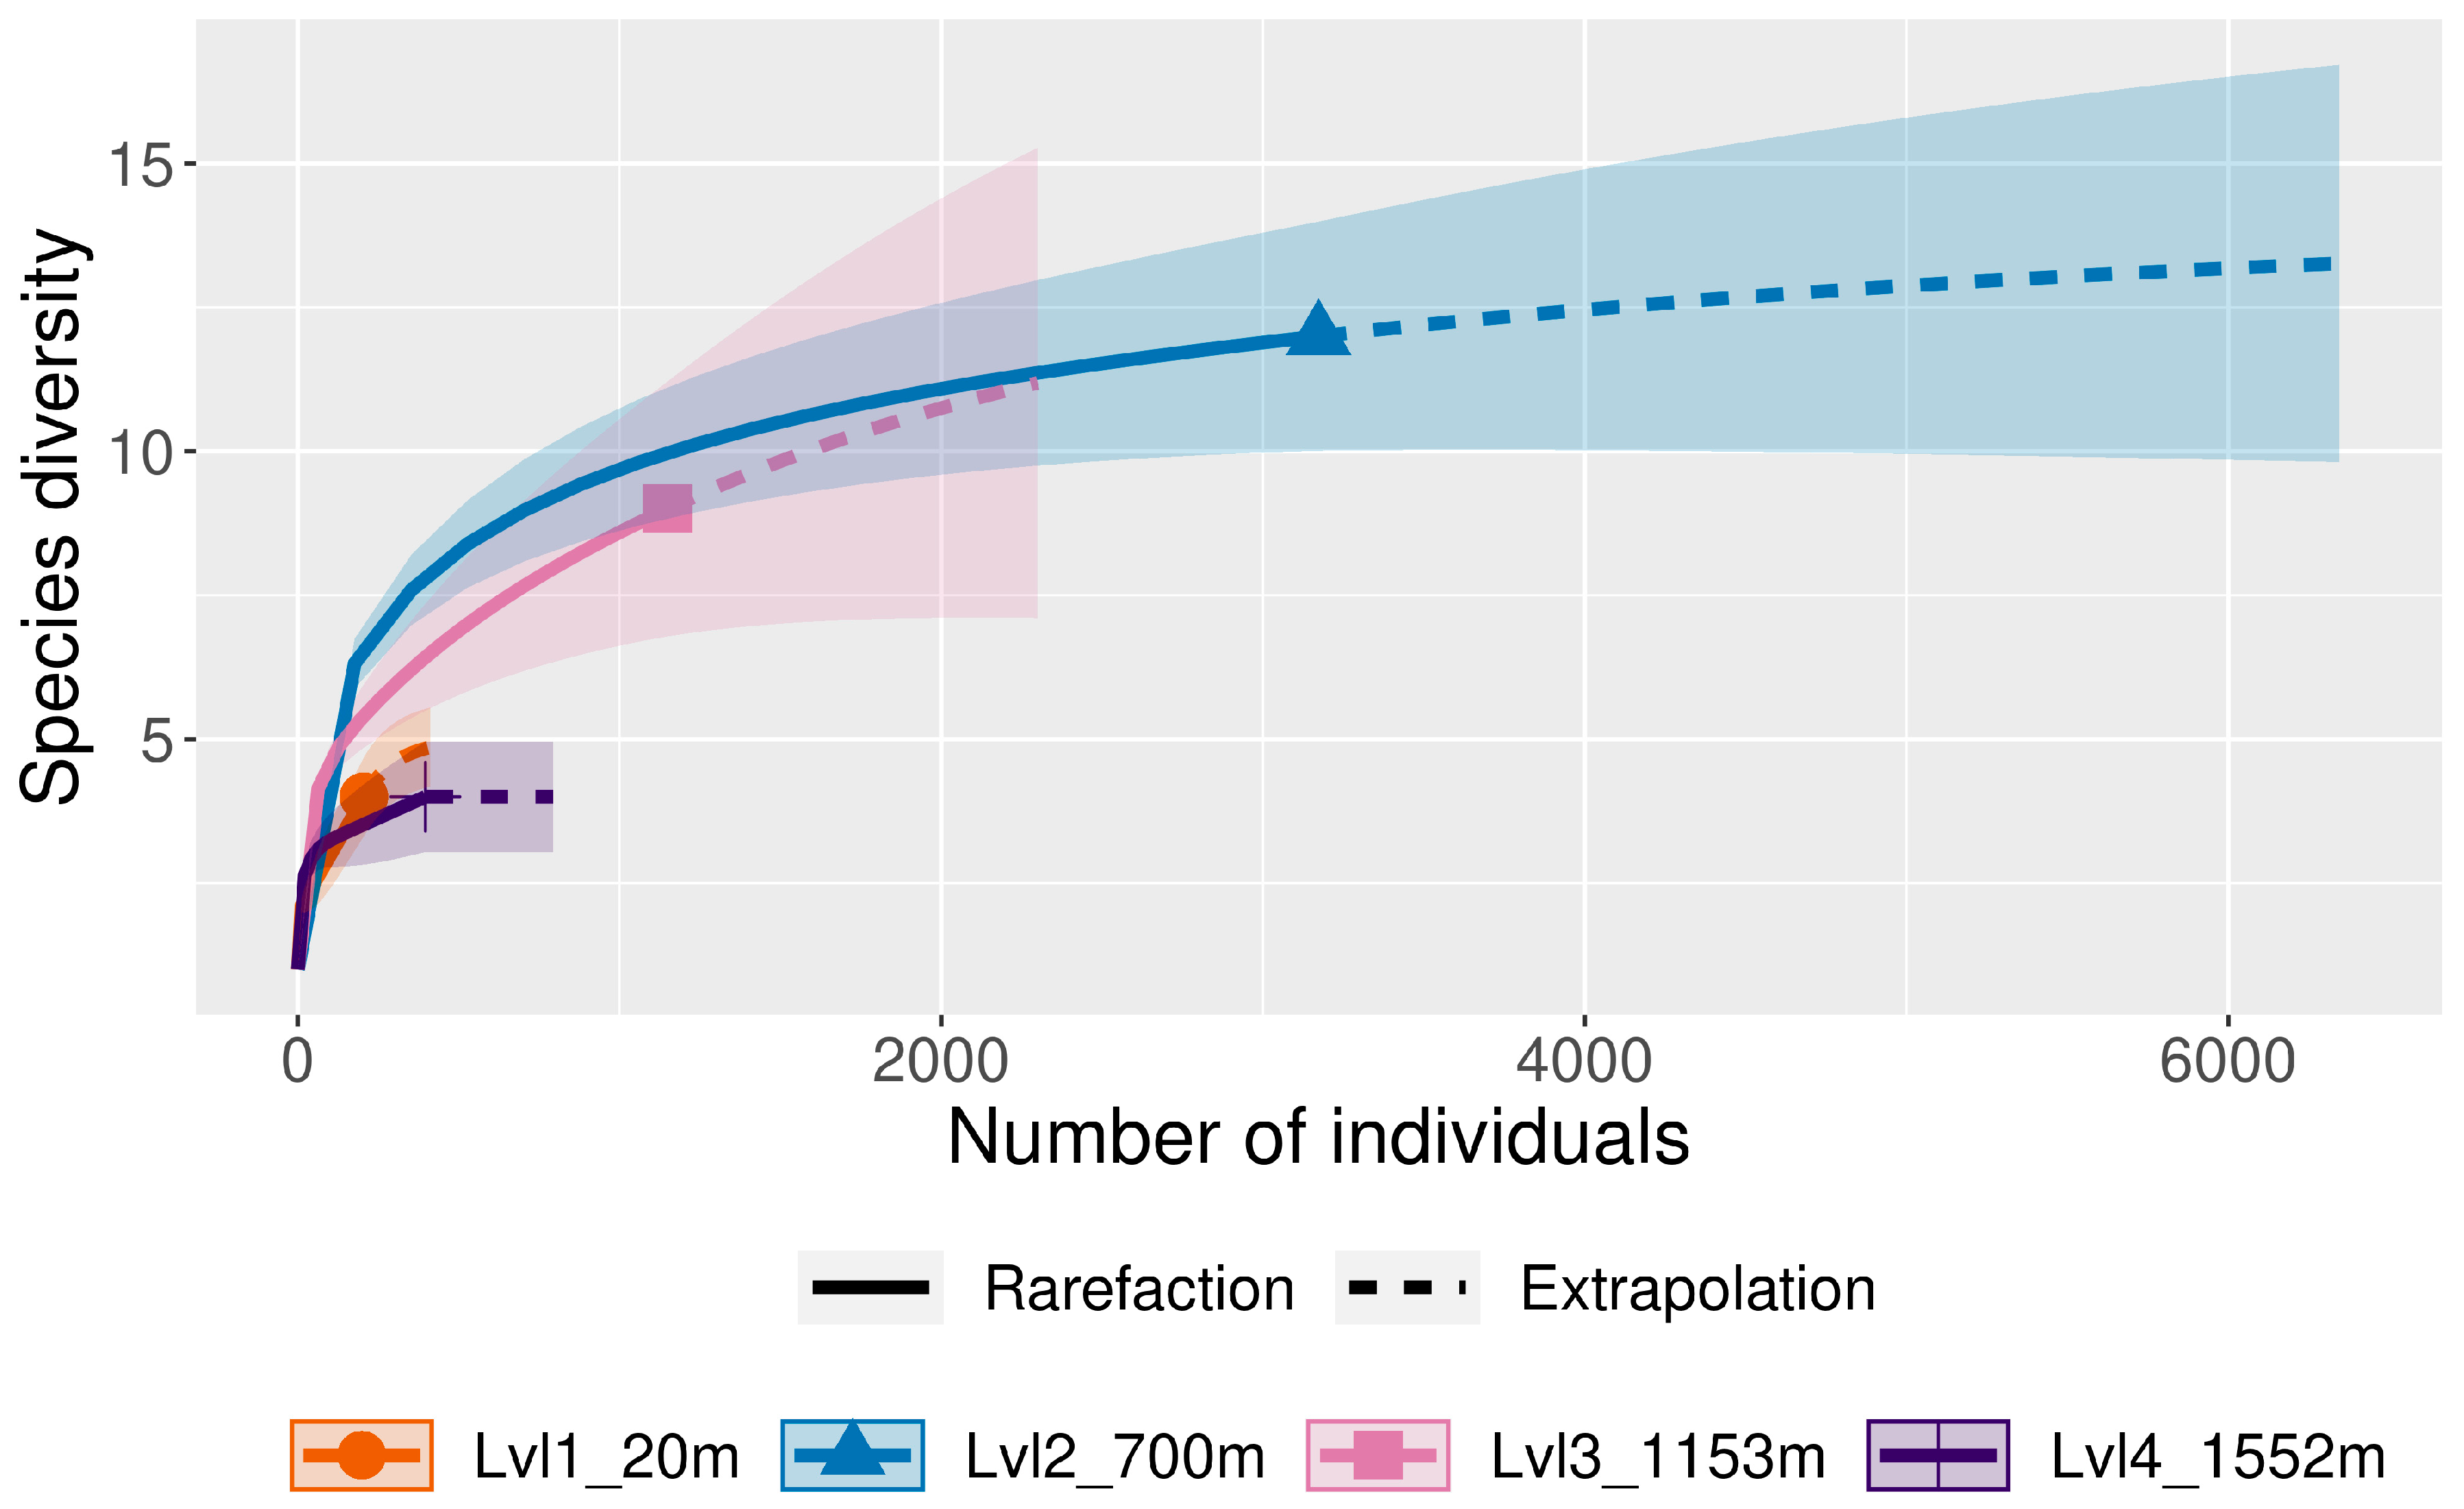
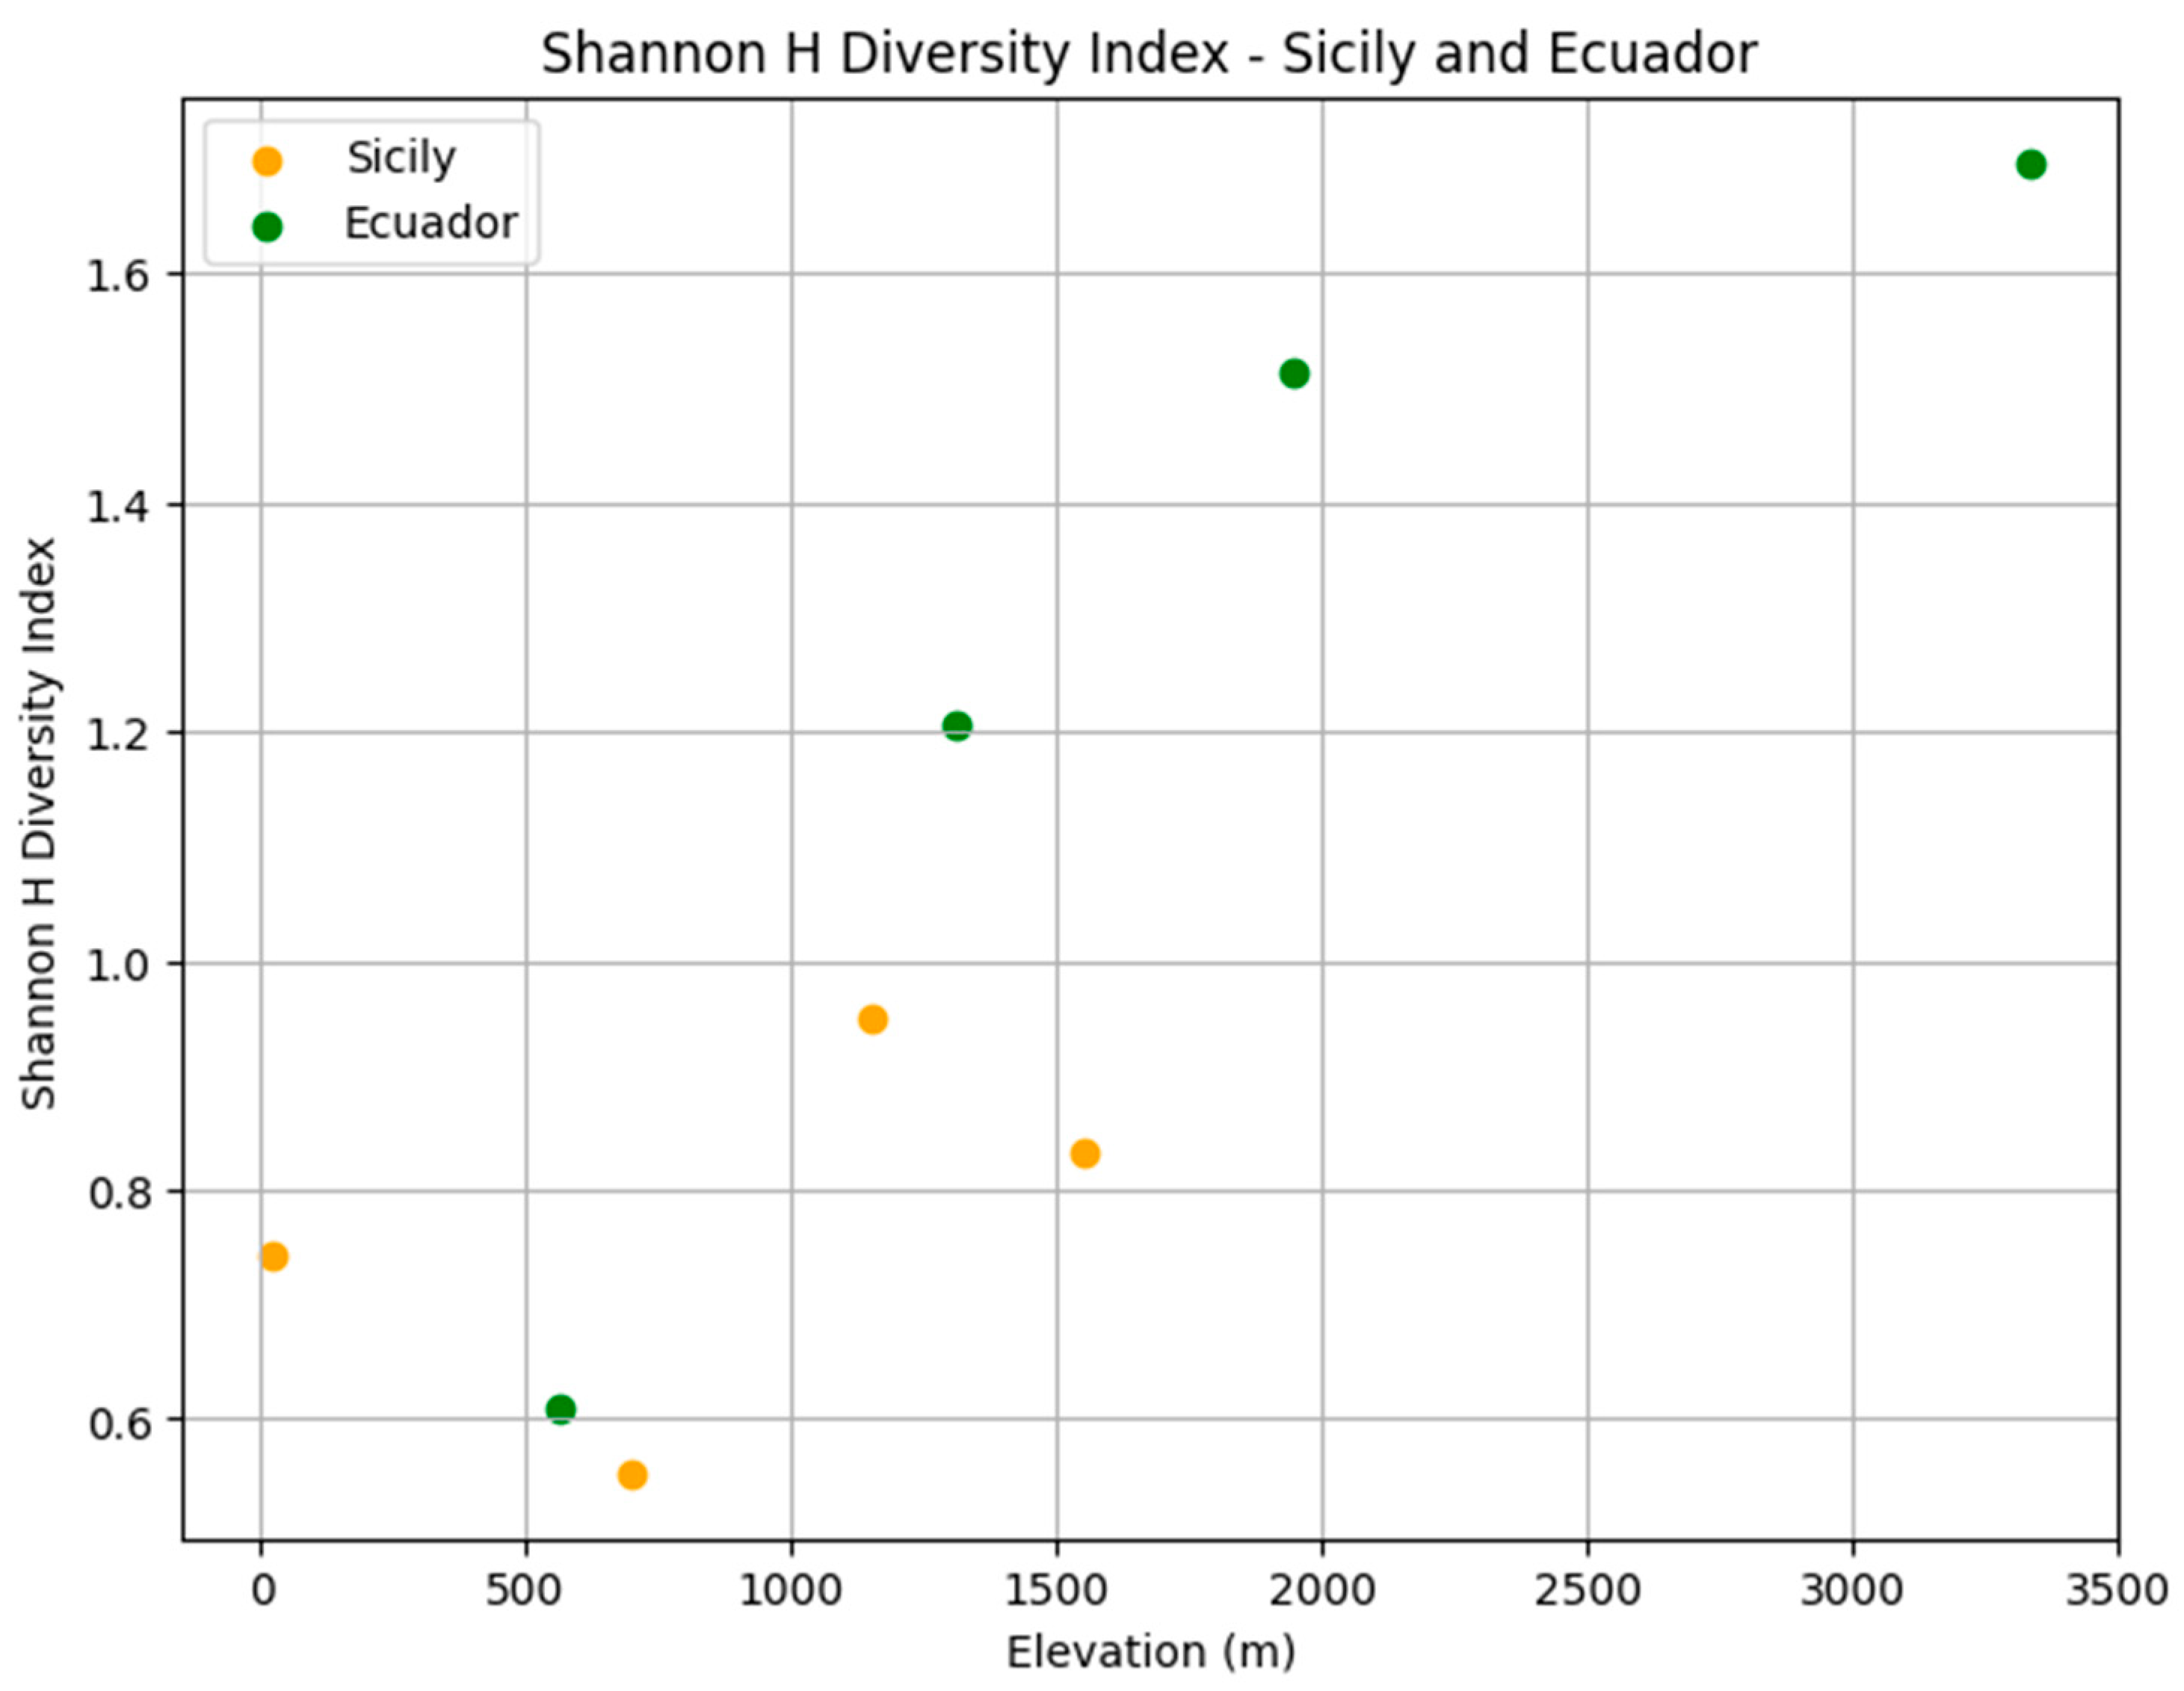
There were significant differences in relative abundance across elevations for only one species, L. sericata. Specifically, significant differences in L. sericata relative abundance were found when comparing 20 m with 700 m and 700 m with 1550 m (Table 5). The Shannon diversity index (H) was calculated for all four elevation levels (Figure 3 and Figure 11). Sørenson Similarity Index (CC) for each pair of elevations is represented in Figure 4. Since species richness was normally distributed across elevations (Shapiro–Wilkes test, p = 0.313) an ANOVA was performed. The test indicated significant differences between elevations, specifically between 20 m and 700 m, 20 m and 1153 m, and 700 m and 1552 m. Rarefaction/extrapolation curves were also generated to assess species diversity in relation to sampling effort across the four elevations (Figure 5). Level 1 exhibited a steep initial increase in diversity with a solid curve and minimal extrapolation, indicating high diversity accumulation at low sampling effort and suggesting that additional sampling may still uncover new species, as the curve had not yet plateaued. Level 2 showed a similarly steep initial rise, followed by a partial plateau during rarefaction and a slight upward trend in the extrapolated segment, implying moderate sampling completeness with potential for discovering additional taxa. Level 3 revealed a continuously increasing curve, steeper than Level 1, with extensive rarefaction and extrapolation but no clear plateau, reflecting a community with high diversity that remains undersampled. In contrast, Level 4 displayed a short but steep curve that reached a plateau after extrapolation, suggesting a smaller but more fully sampled community. Together, these patterns highlight variability in species richness and sampling completeness across the datasets. Coverage-based and size-based rarefaction/extrapolation data as well as the sample completeness curve and the coverage-based rarefaction and extrapolation sampling curves are available in the supplementary materials. Lucilia sericata and Lucilia silvarum (Johann Wilhelm Meigen, 1826) were indicator species for 700 m (Level 2), while C. vicina was an indicator species for 1153 m (Level 3); no indicator species were found for 20 m (Level 1) or 1552 m (level 4) (Table 6). Blow fly communities were shown to be significantly different between elevations, with significant differences between 700 m and 1153 m (MRPP: A = 0.304, p = 0.035) (Table 7, Figure 6). “A” is known as the “effect size” or the “chance-corrected within-group agreement”; A = 1.0 can be read as perfect agreement between the groups, and A = 0 can be read as “no better than expected by chance” ([102], p. 1124); lower values indicate differences between the groups.

4.2. Ecuador

A total of 2890 adult Diptera were collected; of these, 1492 calliphorids belonged to nine genera and seventeen species. The most abundant calliphorid species collected during the survey was Compsomyiops verena (Francis Walker, 1849). The least abundant species collected were Cochliomyia hominivorax (Jean Charles Coquerel, 1858), Chrysomya sp. and Lucilia ochricornis (Christian Rudolph Wilhelm Wiedemann, 1830) (constituting 0.06%, corresponding to one individual captured per species). The largest number of flies was collected at 3336 m (550 flies) and 1948 m (550 flies). In the remaining sites, the flies collected were 215 at 561 m and 130 at 1312 m (Table 8).
The predominant species at 561 m were Paralucilia sp., Lucilia eximia (Christian Rudolph Wilhelm Wiedemann, 1819), and C. albiceps. At 1312 m, predominant species were C. albiceps, L. eximia, and Paralucilia sp. At 1948 m, predominant species were C. verena, followed by Lucilia purpurescens (Francis Walker, 1836). At the highest elevation (3336 m), the two main species were C. verena and Calliphora nigribasis (Pierre-Justin-Marie Macquart, 1851) (Table 8). The sex ratio (m/f) of the blow flies collected has an overall value of 0.25. The m/f ratio of the four most abundant species was 0.27 for C. verena, 0.66 for C. nigribasis, 0.12 for L. eximia, and 0.24 for C. albiceps (Table 9).
Significant differences were observed across elevations for C. nigribasis, C. albiceps, C. verena, H. semidiaphana, Lucilia ibis (Raymond Corbett Shannon, 1926), L. purpurascens, and Paralucilia sp. Calliphora nigribasis numbers differed significantly between level 1 and level 4, and level 2 and level 4. The distribution of C. albiceps was significantly different between level 1 and level 3 as well as level 1 and level 4. Compsomyiops verena was significantly different between level 4 and level 1. The distribution of L. ibis was significantly different between level 1 and level 3. Lucilia purpurescens was significantly different between level 1 and level 3, level 2 and level 3, and level 3 and level 4. For Paralucilia sp., significant differences were observed between level 1 and level 3, and level 1 and level 4 (Table 10).
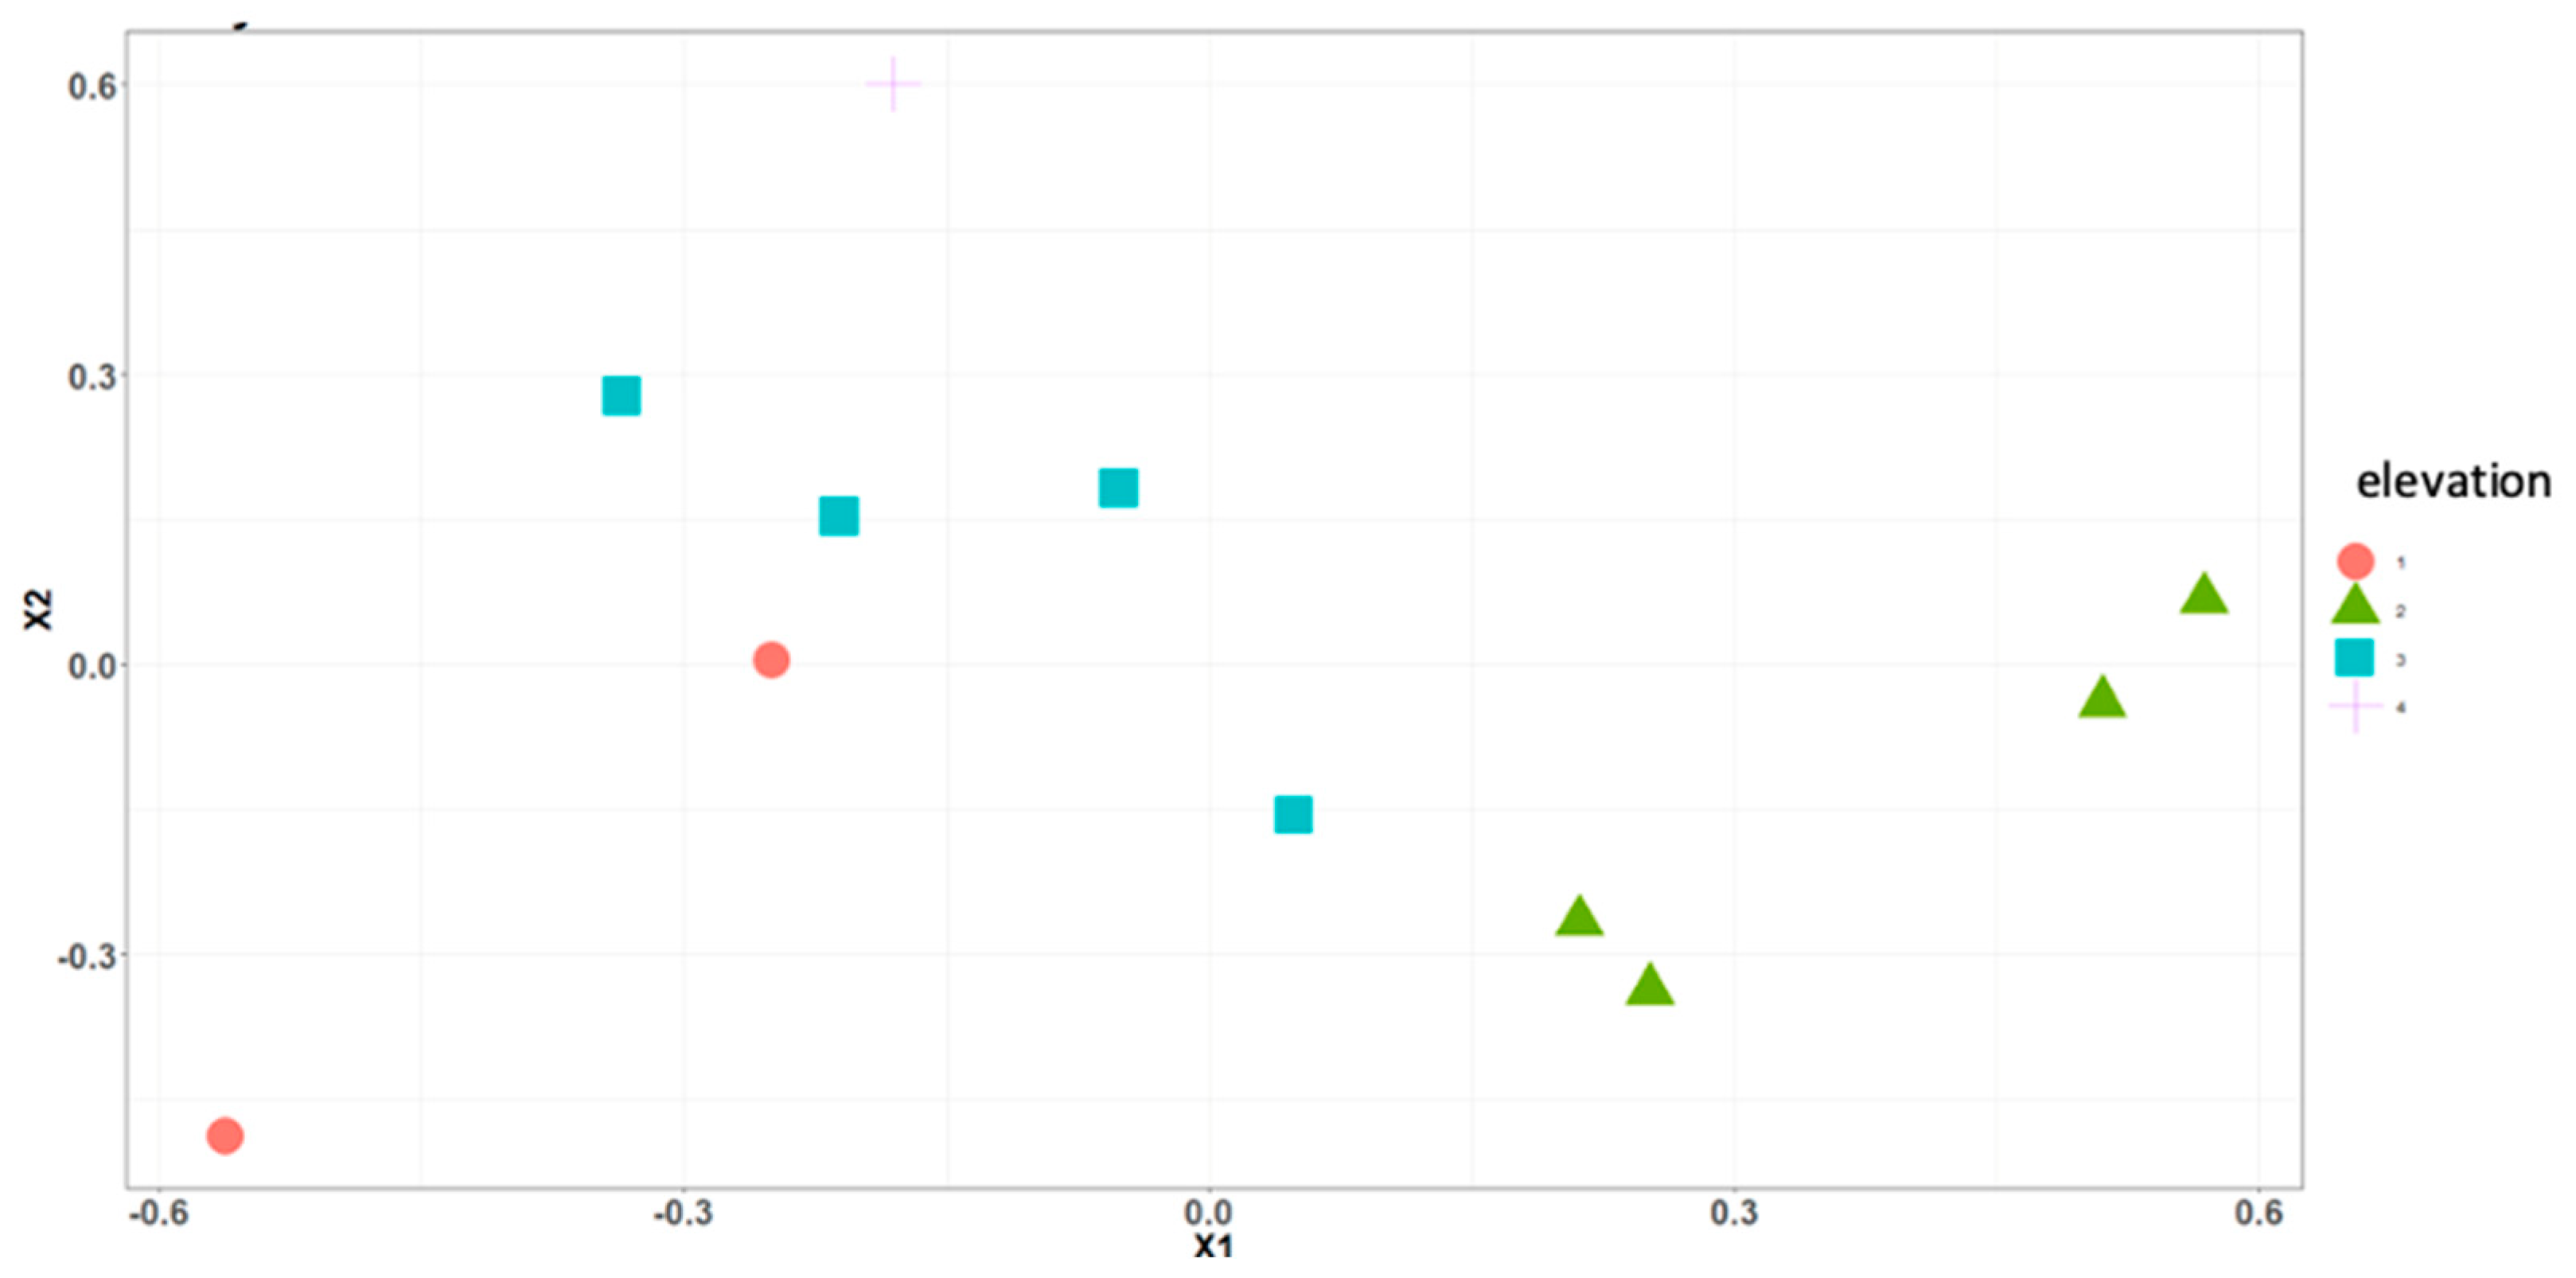
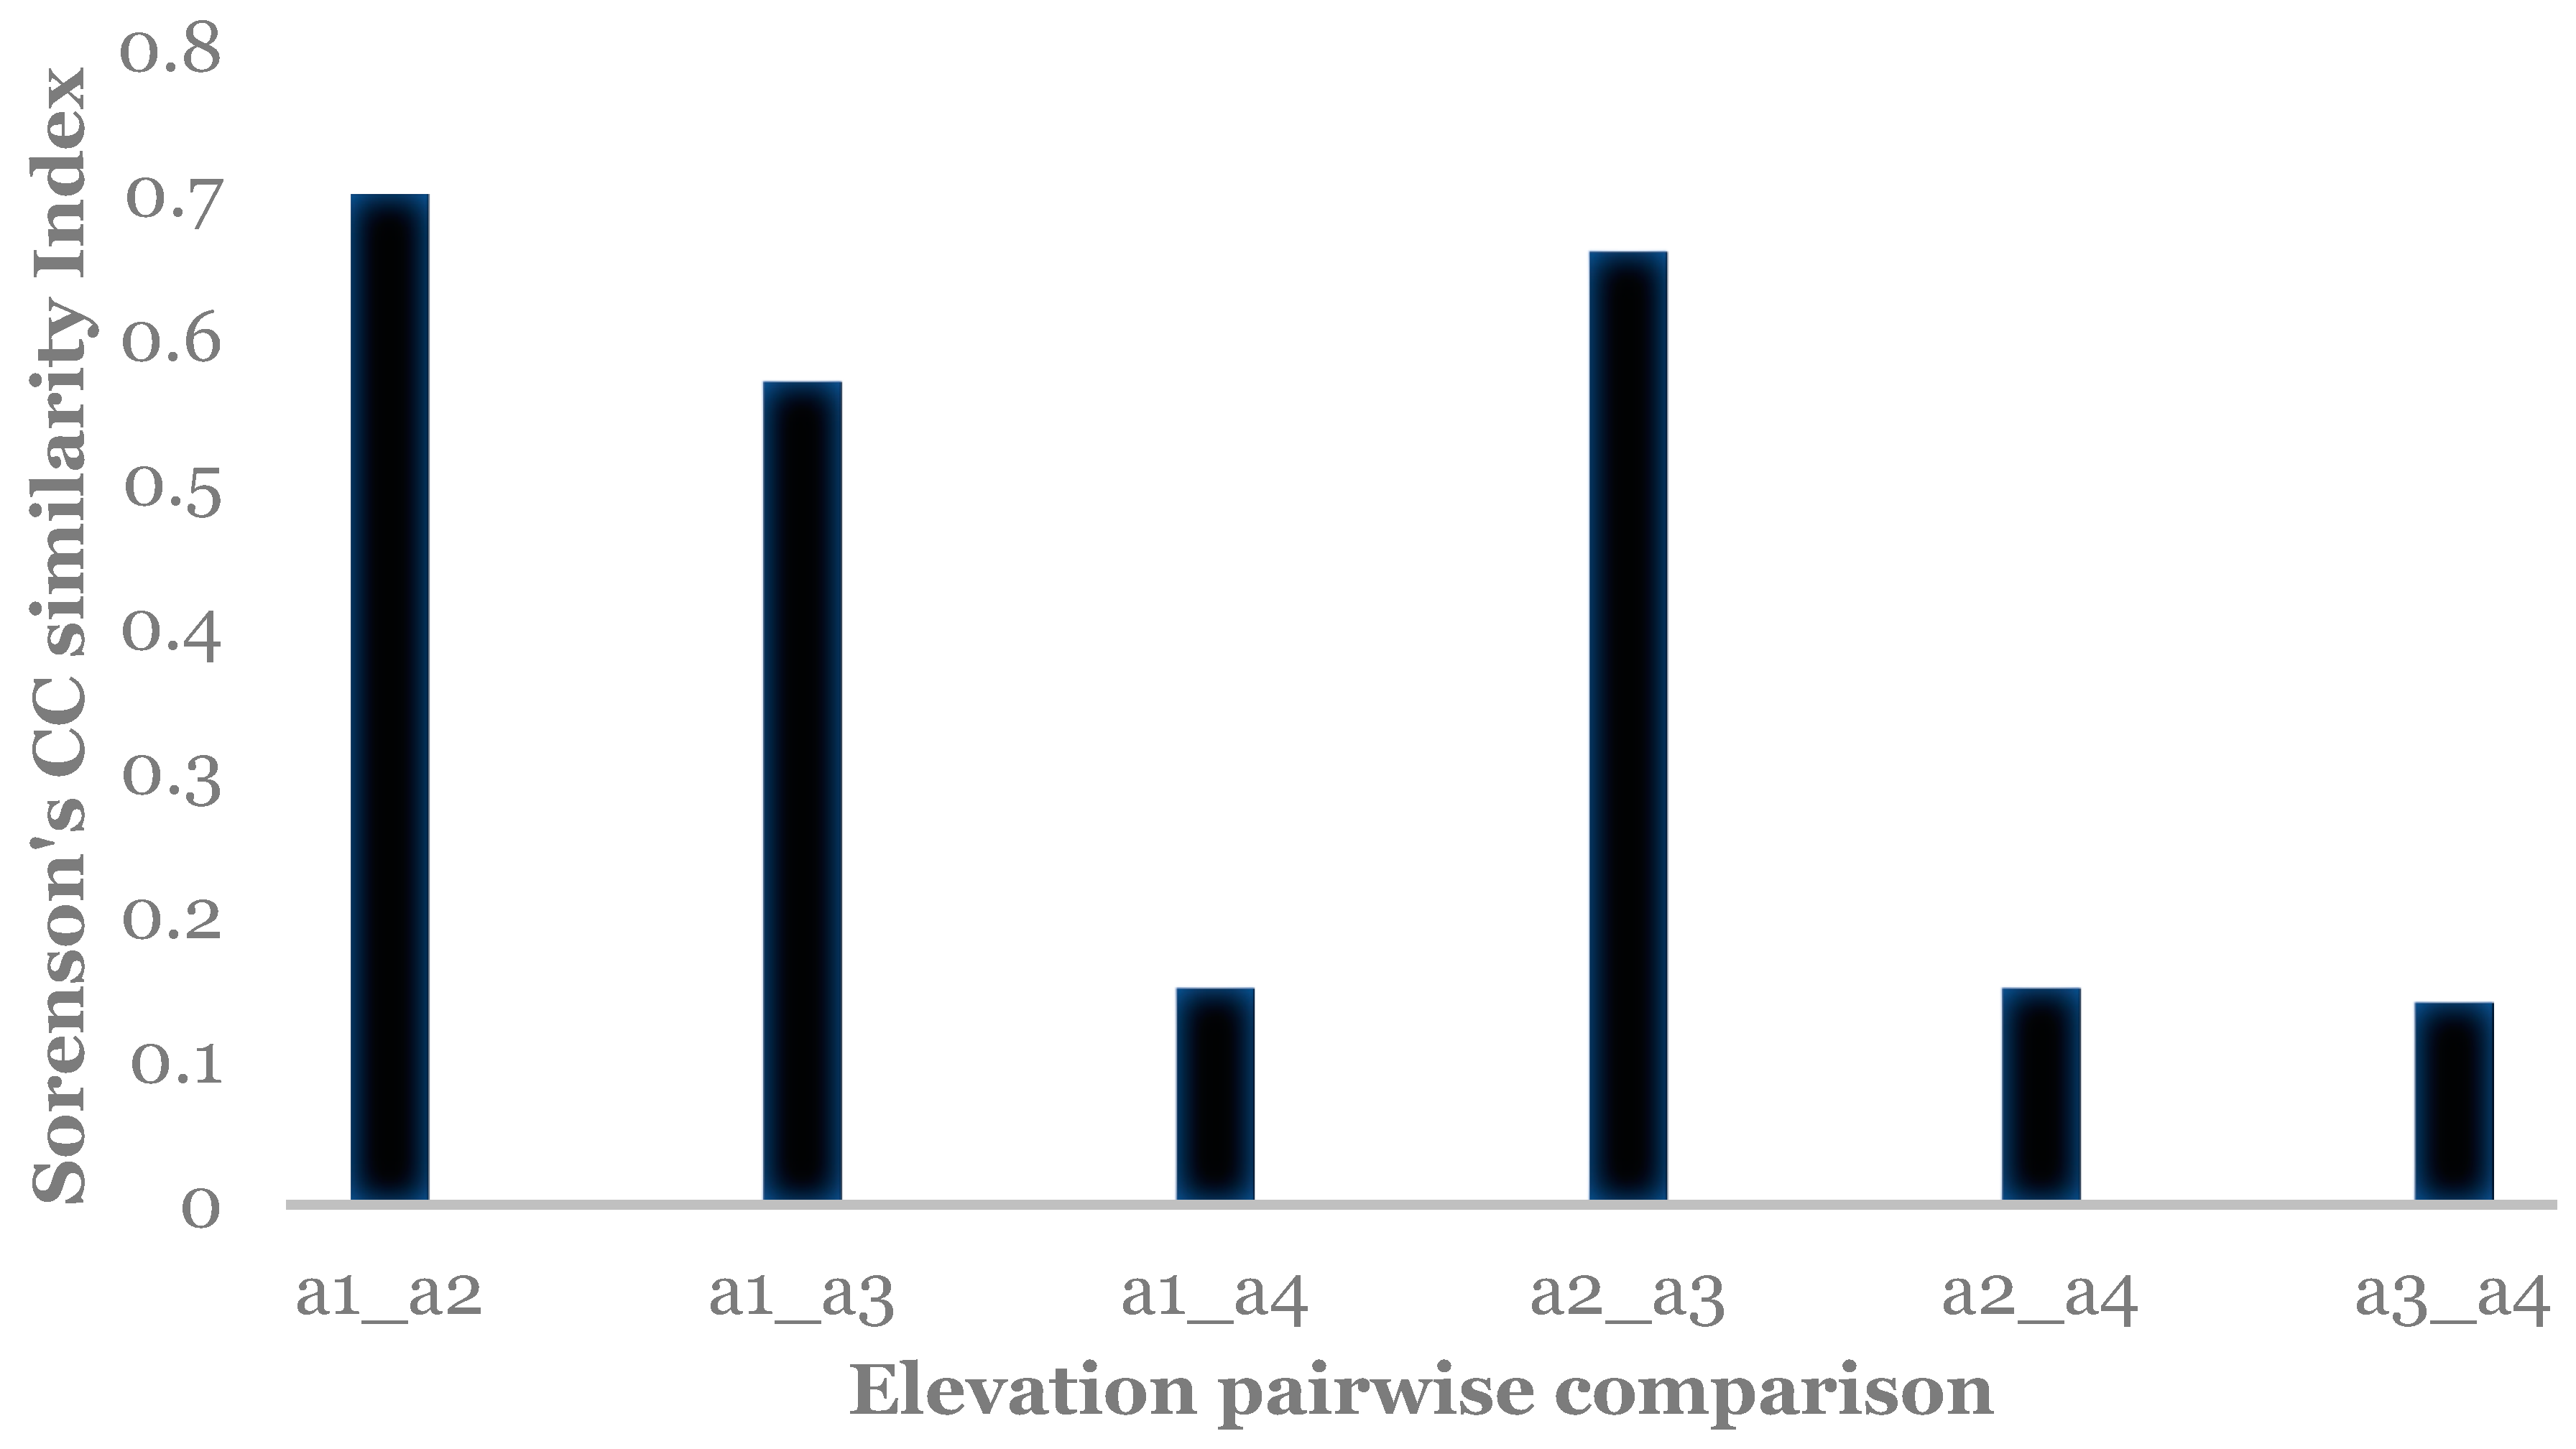
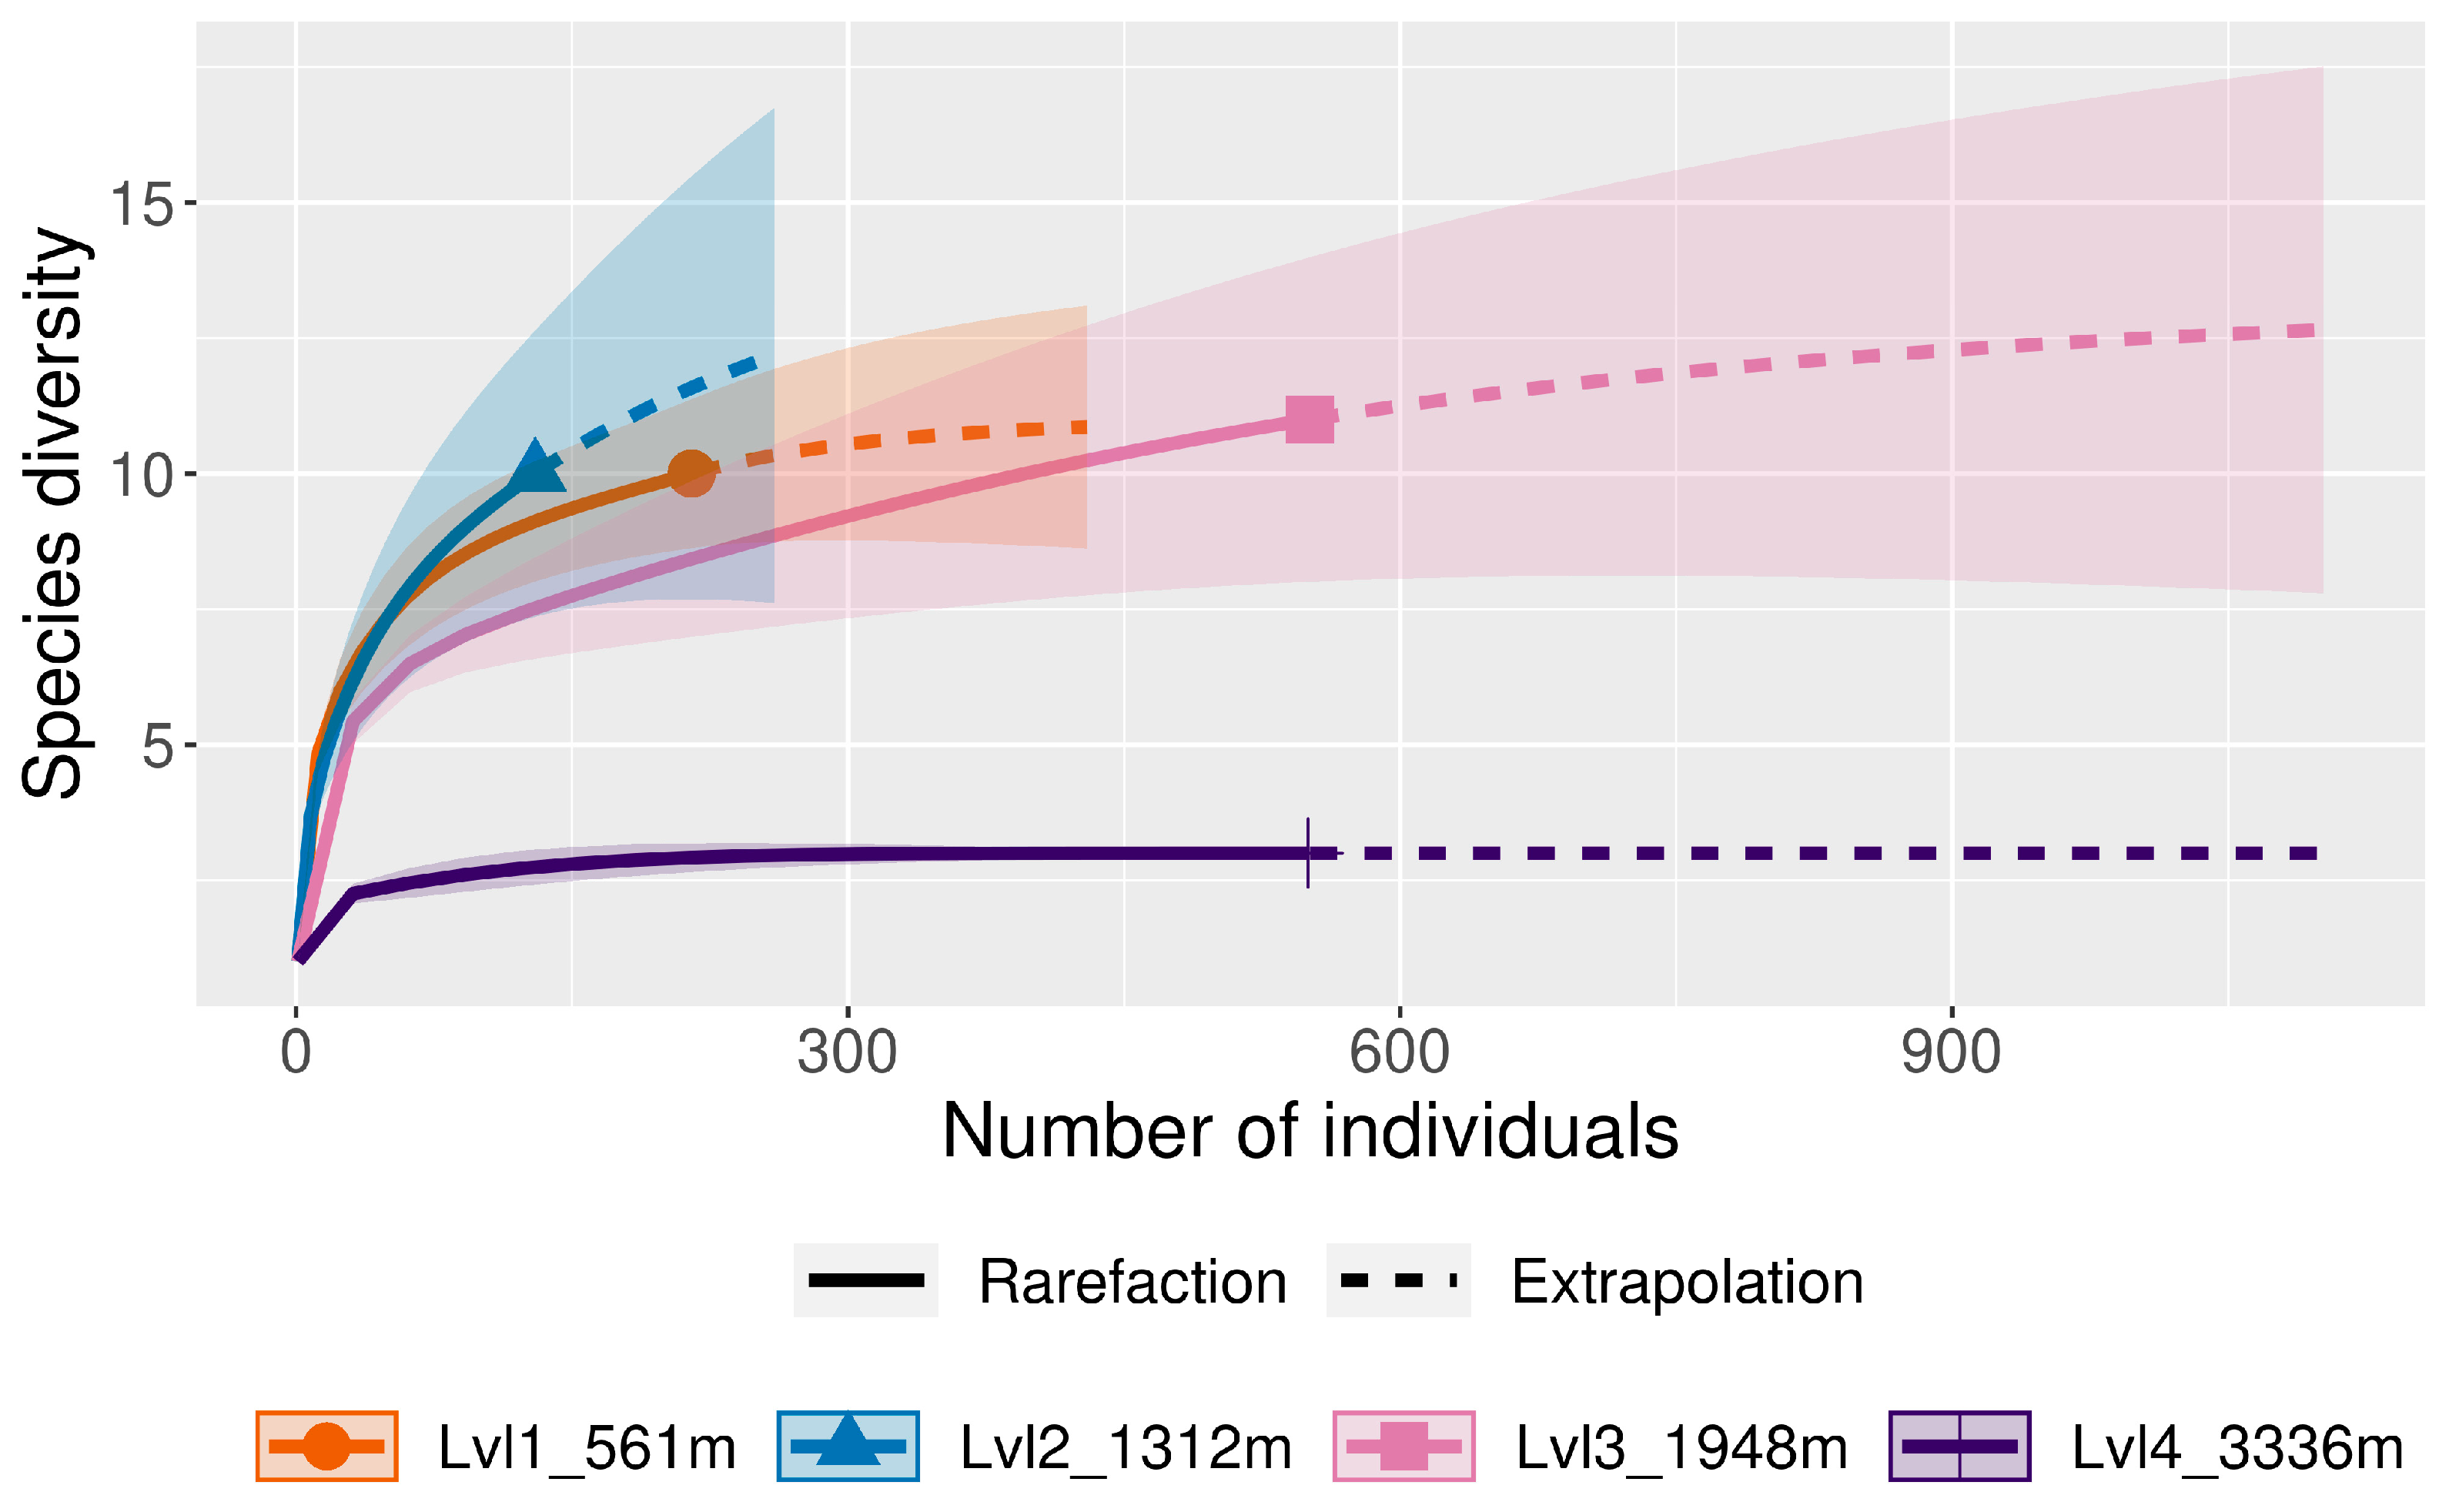
The Shannon diversity index (H) was calculated for all four elevation levels (Figure 7 and Figure 11). The Sorenson Similarity Index (CC) for each pair of elevations is represented in Figure 8. Species richness was not normally distributed across elevations (Shapiro test p = 0.034); therefore, a Kruskal–Wallis analysis was performed, which showed no significant difference across all elevations. The Indicator Species Analysis (ISA) showed that Paralucilia sp. was found to be a strong indicator of the first elevation level, L. purpurascens and L. ibis were strong indicators for the third elevation level, and C. nigribasis was a strong indicator for the highest elevation (Table 11). Blow fly communities were shown to be significantly different across elevational gradients, with significant differences between all levels except between levels 1 and 2, and levels 3 and 4 (Table 12, Figure 9). Rarefaction curves were generated to assess species diversity in relation to sampling effort across four elevations (Figure 10). The x-axis represents the number of individuals sampled, while the y-axis reflects species richness (number of species). Level 1 shows a steep initial increase in diversity, followed by slight tapering, suggesting relatively high richness with some unsampled diversity remaining. Level 2 showed a more gradual slope and began to plateau moderately, indicating a moderate level of species richness with a nearing saturation point. Level 3 displayed the least steep curve, plateauing quickly, which suggests relatively low species richness that was sufficiently captured with the available sampling effort. Level 4 showed a somewhat steep ascent with minor leveling off toward the end, indicating moderate richness and an intermediate level of sampling completeness. Overall, the differences in the shape and extent of rarefaction among datasets suggest variability in community complexity and sampling completeness. Coverage-based and size-based rarefaction/extrapolation data as well as the sample completeness curve and the coverage-based rarefaction and extrapolation sampling curves are available in the supplementary materials.

5. Discussion

Our study shows a correlation between elevation and blow fly distribution, differences in species richness across elevation levels that can be related to vegetation and/or urbanization levels and has produced a reference baseline for Calliphoridae communities in both Sicily and Ecuador.
With few exceptions, the elevational distribution of blow flies in the Mediterranean ecoregion has not been extensively researched. Baz et al. [35] analyzed the elevational distribution patterns of blow flies in Spain at nine different elevations and found eight different species with significant differences between elevation and abundance for most of the species collected. In Sicily, Gemmellaro et al. [103] looked at blow fly colonization inside volcanic caves and surrounding areas during periods of cold temperatures and noticed a delay in hypogenic colonization by C. vicina and C. vomitoria. This study shows that blow fly species distribution can be correlated with changes in elevation. In fact, the data collected during our survey show that the relative abundance of L. sericata, the most abundant species collected in Sicily (68.5% of total capture), changed significantly throughout the elevation gradient, going from being 42.23% of capture at 20 m to being absent at the highest elevation (1552 m). These differences could be due to the fact that, along with elevation, average temperature and habitats changed across sites, going from an urbanized location with a mean temperature of 25 °C to a more rural area with abundant vegetation and a mean temperature of 16 °C. This is in agreement with previous studies that have found L. sericata mainly in urban sites [26]. However, this survey documented this species also at intermediate elevations in rural sites; this corresponds with other studies, which have reported L. sericata in less urbanized rural areas [104].
Calliphora vicina was the second most abundant species collected in Sicily (21.0% of total capture), and its relative abundance, although not significantly different across elevations, still showed variation in the survey, with higher values observed at low and high elevations (56.8% at 20 m, 50.6% at 1153 m, and 40.8% at 1552 m). This pattern is consistent with data found in the literature, which classifies C. vicina as an urban species [105], although it has been observed in non-urban scenarios as well [106]. Moreover, the higher presence of C. vicina at an elevation where the temperature was lower agrees with the definition of C. vicina as a thermophobic species [107] and with studies on the geographical distribution of blow flies, which have shown that this species is more abundant in northern, colder regions [26].
At the highest elevational level (1552 m), C. vomitoria was the main colonizer, representing 55.16% of the total number of flies captured; at lower elevations, however, this species had low representation. Calliphora vomitoria is also considered a species well adapted to cold climates [108], and its higher abundance at the highest elevation, when compared to C. vicina, may be related to the fact that C. vomitoria prefers non-anthropic habitats, while C. vicina prefers urban environments [109]. The highest site of this survey was characterized by low urbanization and colder temperatures, providing a suitable habitat for this species. The comparison of male/female ratios of the two most abundant species showed large differences. Males represented 5% of the total capture for L. sericata and 35.5% for C. vicina. In another survey conducted in Manhattan (NY) with baited traps, high numbers of C. vicina males were also recorded [110]. This observation might be explained by the nutritional needs of C. vicina males, which, when offered multiple food sources, have been shown to prefer protein-rich substrates over carbohydrates [111].
While we know that this study only provides a compartmentalized view of the blow fly populations present in the areas, it is possible that the male/female ratio we observed may mirror the actual ratio of the local population. There are several theories that try to explain sex ratios in various groups; female-biased sex ratios have been observed in several social insects, where collaboration among females is common. According to Hamilton’s local mate competition (LMC) theory [112], a female-biased sex ratio in groups where mating occurs locally can be explained by the resulting reduction in competition among related males and the increase in the availability of females [113].
In Sicily, the most diverse sampling site was located at elevation level 3–1153 m (H = 0.95); this could be related to the habitats provided by the geographical features and vegetation of the site. The lowest diversity was observed at elevation level 2–700 m (H = 0.55); however, this was also the site where the highest number of blow flies was collected. The similarity CC index for the Sicily sites showed that species composition in relation to elevation is most dissimilar between 20 m and 1552 m (CC = 0.025); different urbanization and average temperatures characterize these areas, creating habitats that can be conducive to different blow fly species. The most similar elevations in relation to diversity were 1153 m and 1552 m (CC = 0.85), where similar landscapes and vegetation are present, and the anthropogenic impact is low.
Species richness was significantly different between the first elevation level (20 m) and the second (700 m), and between the second (700 m) and the third (1153 m) levels. This may be explained by the location of the first level being in close proximity to a large city, while none of the others were. Richness was also the same at the lowest and highest elevations (richness = 4), even though there was only one species in common between the two levels (C. vicina). The number of flies captured during the survey was also lower at the two extreme elevations (206 at 20 m and 397 at 1552 m) than it was at the two intermediate ones (3197 at 700 m and 1153 at 1153 m). This is in agreement with numerous authors who have found the correlation between species richness and elevation to have a hump-shaped pattern, with a peak in richness at intermediate elevations [61,114].
In Ecuador, the number of blow flies collected during the survey was lower than what was collected in Sicily. The same was also true when looking at all Diptera captured during the study (9923 for Sicily; 2890 for Ecuador). This could be related to the high relative humidity and precipitation in the sampling sites in Ecuador. High humidity can be inversely related to fly abundance [115]. Research in Malaysia showed that the abundance of Muscidae diminished as humidity increased [116]. However, the number of blow fly species was slightly higher in Ecuador (17 versus 12 species in Sicily). This could also be due to the fact that the former is an island, while the latter is located on the mainland. Similar results have been observed in other studies comparing insect diversity between islands and the mainland, where significant differences were found in both the number of species and in the number of individuals that were collected [41]. Moreover, when compared to Sicily, Ecuador is closer to the Equator, and studies have noticed a higher number of species at lower latitudes, and this has been correlated with warmer climates and to other factors (such as vegetation, human footprint, and physical barriers) [117]. The sites sampled in Ecuador had more diverse vegetation and lower levels of urbanization when compared to the Sicilian sites, which could explain the difference in the number of species sampled in the two locations.
In Ecuador, just over half of the total capture was represented by C. verena (51.7%). No extensive data are available in the literature about the biology and development of this blow fly. It is known to be attracted to garbage and decomposing matter, and occasionally feces [34]. In a survey of the blow fly community of Peru, Greenberg and Szyska [118] collected this fly at an elevation of 1430 m, in an asynanthropic area, and recorded an on-site egg-to-adult development of 17 days. In this survey, C. verena was also the most abundant blow fly collected at the highest site in our survey (Papallacta, 3336 m), which is also the site where the highest number of flies was collected. This is surprising considering that Papallacta was the most elevated site of this survey, but it could be explained by the low anthropogenic impact that characterizes this site and by the different habitats that the great diversity of this area provides.
Significant differences in abundance across all four elevational levels were observed for C. nigribasis, with few collections at the highest elevation (3336 m). Calliphora nigribasis has been observed to be a good flier and can travel up to 3.5 km a day [119]. The fact that it was only captured at the highest elevation in our survey could be interpreted as a preference for this habitat. It could also be that geographical constraints, such as mountains, are a physical impediment to the dispersal of this species. The distribution of C. albiceps and Paralucilia sp. was also significantly different and seemed to prefer lower elevations (561 m and 1948 m) given that they were not collected at the higher sites.
The Shannon diversity index indicated that the most diverse site was the highest site, Papallacta (3336 m) (H = 1.7). Overall, the habitats in this area were quite diverse, ranging from tropical forest to glaciers and, therefore, may provide living conditions for numerous species. Sorenson’s Similarity Index showed that the species composition at the highest elevation is quite dissimilar to all the other levels, and that the two lower elevations and the two intermediate elevations were very similar to each other. However, species richness was not significantly different across the four elevations, indicating that even though species may differ across elevations in relation to habitats and temperature, their numbers do not change significantly.
One of the limitations of this survey was the use of bait as opposed to whole animal carcasses. Bait type and size may have impacted the number and composition of the flies collected. This possibility has been suggested by other studies that compared the use of bait as opposed to a carcass [99,120,121]. Additionally, the rate of decay of the liver bait used for this survey may have been impacted by the different environmental parameters at each elevation. This difference in decomposition could have affected the chemical cues released and, therefore, affected the ‘attractiveness’ of the bait. A study conducted by Vogt and Woodburn [122] reported significant differences in the number of flies collected by seven-day-old bait compared to fresh bait. Another potential limitation may be due to the different types of bait used in the two ecoregions, as this difference may have impacted the flies that were collected; however, Farinha et al. [123] conducted a survey using three different baits and noticed that only one of the forensically important species they collected (L. sericata) was significantly more present in one of the baits (pork liver). Furthermore, in one study where different types of bait were used in the same location, the major taxa of forensic interest appeared to be attracted to all types of bait, although they did show a preference for a specific one [81]. Additionally, conducting two surveys in different years may have also affected the results we observed. Future work should consider analyzing multiple seasons across multiple years along elevational gradients to provide useful information about the seasonality of the species collected.

6. Conclusions

The results of these surveys provide baseline data about the calliphorid communities in Sicily and Ecuador across different elevations and can help in the interpretation of general ecological patterns of calliphorid species distribution across elevations. Moreover, this information could be used as a reference in future studies, as well as assist with increased implementation of the use of insects in forensic investigations. Knowing which species are commonly present in specific geographical areas in specific seasons may help forensic entomologists infer potential post-mortem movements of the remains, as well as estimate the mPMI or TOC. If the environmental impact on colonization is better understood, it will be possible to refine the estimation of time of colonization and provide more robust support to the investigators.

Supplementary Materials

The following supporting information can be downloaded at: https://www.mdpi.com/article/10.3390/insects16050498/s1, Table S1: Sicily_Coverage_Based R/E; Table S2: Sicily_Size_Based_R/E; Table S3: Ecuador_Coverage_Based R/E; Table S4: Ecuador_Size_Based R/E; Figure S1: Sicily_Sample Completeness Curve; Figure S2: Sicily_Coverage_Based R/E_Sampling_Curve; Figure S3: Ecuador_Sample_Completeness_Curve; Figure S4: Ecuador_Coverage_Based_R/E Curve.

Author Contributions

Conceptualization, M.D.G., M.D.-T. and G.C.H.; methodology, M.D.G., M.D.-T. and G.C.H.; software, M.D.G. and M.D.-T.; formal analysis and investigations, M.D.G. and M.D.-T.; resources, M.D.G., M.D.-T. and G.C.H.; data curation, M.D.G., G.S.A., M.D.-T., G.C.H. and L.M.W.; writing—original draft preparation, M.D.G., G.S.A., M.D.-T., G.C.H. and L.M.W.; writing—review and editing, M.D.G., G.S.A., M.D.-T., G.C.H. and L.M.W.; visualization, M.D.G., G.S.A. and M.D.-T.; supervision, M.D.G., G.S.A., M.D.-T. and G.C.H. All authors have read and agreed to the published version of the manuscript.

Funding

This research received no external funding.

Data Availability Statement

The original data presented in the study are openly available in Zenodo at https://doi.org/10.5281/zenodo.7062111 and https://doi.org/10.5281/zenodo.7060325.

Conflicts of Interest

The authors declare no conflicts of interest.

References

  1. Grassberger, M.; Frank, C. Initial study of arthropod succession on pig carrion in a central European urban habitat. J. Med. Entomol. 2004, 41, 511–523. [Google Scholar] [CrossRef]
  2. De Jong, G.D. An annotated checklist of the Calliphoridae (Diptera) of Colorado, with notes on carrion associations and forensic importance. J. Kans. Entomol. Soc. 1994, 67, 378–385. [Google Scholar]
  3. Gruner, S.V.; Slone, D.H.; Capinera, J.L. Forensically important Calliphoridae (Diptera) associated with pig carrion in rural north-central Florida. J. Med. Entomol. 2007, 44, 509–515. [Google Scholar] [CrossRef]
  4. De Jong, G.D. Insect Succession on Dog Carcasses in Horsetooth Mountain Park; Unpublished Report to Larimer County (Colorado) Parks Department: Loveland, CO, USA, 1993; Volume 60. [Google Scholar]
  5. Vogt, W.G.; Morton, R. Estimation of population size and survival of sheep blowfly, Lucilia cuprina, in the field from serial recoveries of marked flies affected by weather dispersal and age-dependent trappability. Popul. Ecol. 1991, 33, 141–163. [Google Scholar] [CrossRef]
  6. Spradbery, J.P.; Mahon, R.J.; Morton, R.; Tozer, R.S. Dispersal of the Old World screw-worm fly Chrysomya bezziana. Med. Vet. Entomol. 1995, 9, 161–168. [Google Scholar] [CrossRef]
  7. Williams, K.L.; Barton Browne, L.; van Gerwen, C.M. Quantitative relationships between the ingestion of protein-rich material and ovarian development in the Australian sheep blowfly, Lucilia cuprina (Wied). Int. J. Invertebr. Reprod. 1979, 1, 75–88. [Google Scholar] [CrossRef]
  8. Norris, K.R. The bionomics of blowflies. Annu. Rev. Entomol. 1965, 10, 47–68. [Google Scholar] [CrossRef]
  9. Byrd, J.H.; Tomberlin, J.K. (Eds.) Insects of Forensic Importance. In Forensic Entomology: The Utility of Arthropods in Legal Investigations; CRC Press: Boca Raton, FL, USA, 2020; pp. 15–62. [Google Scholar]
  10. Braack, L.E.O. Visitation patterns of principal species of the insect complex at carcasses in the Kruger National Park. Koedoe 1981, 24, 33–49. [Google Scholar] [CrossRef]
  11. Velásquez, Y. A checklist of arthropods associated with rat carrion in a montane locality of northern Venezuela. Forensic Sci. Int. 2008, 174, 68–70. [Google Scholar] [CrossRef]
  12. Greenberg, B. Flies and Disease Volume I. Ecology, Classification and Biotic Associations; Princeton University Press: Princeton, NJ, USA, 1971. [Google Scholar]
  13. Greenberg, B. Flies and Disease Volume II. Biology and Disease Transmission; Princeton University Press: Princeton, NJ, USA, 1973. [Google Scholar]
  14. Wall, R.; French, N.; Morgan, K. Blowfly species composition in sheep myiasis in Britain. Med. Vet. Entomol. 1992, 6, 177–178. [Google Scholar] [CrossRef]
  15. Howlett, B.G. Hybrid carrot seed crop pollination by the fly Calliphora vicina (Diptera: Calliphoridae). J. Appl. Entomol. 2012, 136, 421–430. [Google Scholar] [CrossRef]
  16. Faulkner, G.J. Seed production of F1 hybrid Brussels sprouts. Proc. Symp. Seed Probl. Hortic. 1977, 93, 37–42. [Google Scholar] [CrossRef]
  17. Pérez-Bañón, C.; Petanidou, T.; Marcos-Garcia, A. Pollination in small islands by occasional visitors: The case of Daucus carota subsp. commutatus (Apiaceae) in the Columbretes archipelago, Spain. Plant Ecol. 2007, 192, 133–151. [Google Scholar] [CrossRef]
  18. Clement, S.L.; Hellier, B.C.; Elberson, L.R.; Staska, R.T.; Evans, M.A. Flies (Diptera: Muscidae: Calliphoridae) are efficient pollinators of Allium ampeloprasum L. (Alliaceae) in field cages. J. Econ. Entomol. 2007, 100, 131–135. [Google Scholar] [CrossRef]
  19. Carter, D.O.; Yellowlees, D.; Tibbett, M. Cadaver decomposition in terrestrial ecosystems. Die Naturwiss. 2007, 94, 12–24. [Google Scholar] [CrossRef]
  20. Johansen, H.; Solum, M.; Knudsen, G.K.; Hagvar, E.B.; Norli, H.R.; Aak, A. Blow fly responses to semiochemicals produced by decaying carcasses. Med. Vet. Entomol. 2014, 28, 26–34. [Google Scholar] [CrossRef] [PubMed]
  21. Amendt, J.; Krettek, R.; Zehner, R. Forensic entomology. Die Naturwiss. 2004, 91, 51–65. [Google Scholar] [CrossRef]
  22. Catts, E.P.; Goff, M.L. Forensic entomology in criminal investigations. Annu. Rev. Entomol. 1992, 37, 253–272. [Google Scholar] [CrossRef]
  23. Tomberlin, J.K.; Mohr, R.; Benbow, M.E.; Tarone, A.M.; VanLaerhoven, S.L. A roadmap for bridging basic and applied research in forensic entomology. Annu. Rev. Entomol. 2011, 56, 401–421. [Google Scholar] [CrossRef]
  24. Kneidel, K.A. Competition and disturbance in communities of carrion-breeding Diptera. J. Anim. Ecol. 1984, 53, 849–865. [Google Scholar] [CrossRef]
  25. Ives, A.R. Aggregation and coexistence in a carrion fly community. Ecol. Monogr. 1991, 61, 75–94. [Google Scholar] [CrossRef]
  26. Weidner, L.M.; Jennings, D.E.; Tomberlin, J.K.; Hamilton, G.C. Seasonal and geographic variation in biodiversity of forensically important blow flies (Diptera: Calliphoridae) in New Jersey, USA. J. Med. Entomol. 2015, 52, 937–946. [Google Scholar] [CrossRef] [PubMed]
  27. Kuusela, S.; Hanski, I. The structure of carrion fly communities: The size and the type of carrion. Holartic Ecol. 1982, 5, 337–348. [Google Scholar] [CrossRef]
  28. Kuusela, S. Community structure of carrion flies along an island gradient. Holarc. Ecol. 1983, 6, 372–380. [Google Scholar] [CrossRef]
  29. Hanski, I. Carrion fly community dynamics: Patchiness, seasonality and coexistence. Ecol. Entomol. 1987, 12, 257–266. [Google Scholar] [CrossRef]
  30. Davies, L. Species composition and larval habitats of blowfly (Calliphoridae) populations in upland areas in England and Wales. Med. Vet. Entomol. 1990, 4, 61–68. [Google Scholar] [CrossRef]
  31. Feddern, N.; Amendt, J.; Schyma, C.; Jackowski, C.; Tschui, J. A preliminary study about the spatiotemporal distribution of forensically important blow flies (Diptera: Calliphoridae) in the area of Bern, Switzerland. Forensic Sci. Int. 2018, 289, 57–66. [Google Scholar] [CrossRef]
  32. Buncho, N.; Sukontason, K.; Sanit, S.; Chidburee, P.; Kurahashi, H.; Sukontason, K.L. Occurrence of blow fly species (Diptera: Calliphoridae) in Phitsanulok Province, Northern Thailand. Trop. Biomed. 2012, 29, 532–543. [Google Scholar]
  33. Tumrasvin, W.; Sucharit, S.; Kano, R. Studies on medically important flies in Thailand. IV. Altitudinal distribution on flies belonging to Muscidae and Calliphoridae in Doi Indhanondh Mountain, Chiengmai, in early summer season. Bull. Tokyo Med. Dent. Univ. 1978, 25, 77–81. [Google Scholar]
  34. Baumgartner, D.; Greenberg, B. Distribution and medical ecology of the blow flies (Diptera: Calliphordae) of Peru. Ann. Entomol. Soc. Am. 1985, 78, 565–587. [Google Scholar] [CrossRef]
  35. Baz, A.; Cifrián, B.; Díaz-äranda, L.M.; Martín-Vega, D. The distribution of adult blow-flies (Diptera: Calliphoridae) along an altitudinal gradient in Central Spain. Ann. Soc. Entomol. Fr. 2007, 43, 289–296. [Google Scholar] [CrossRef]
  36. Moophayak, K.; Klong-Klaew, T.; Sukontason, K.; Kurahashi, H.; Tomberlin, J.K.; Sukontason, K.L. Species composition of carrion blow flies in northern Thailand: Altitude appraisal. Rev. Inst. Med. Trop. Sao Paulo 2014, 56, 179–182. [Google Scholar] [CrossRef] [PubMed]
  37. Hodecek, J.; Jakubec, P. Spatio-temporal distribution and habitat preference of necrophagous Calliphoridae based on 160 real cases from Switzerland. Int. J. Leg. Med. 2022, 136, 923–934. [Google Scholar] [CrossRef]
  38. MacArthur, R.H. Geographical Ecology: Patterns in the Distribution of Species; Princeton University Press: Princeton, NJ, USA, 1984. [Google Scholar]
  39. Stevens, G.C. The elevational gradient in altitudinal range: An extension of Rapoport’s latitudinal rule to altitude. Am. Nat. 1992, 140, 893–911. [Google Scholar] [CrossRef]
  40. Whittaker, R.H. A vegetation bibliography for the Northeastern State. Ecology 1960, 41, 245–246. [Google Scholar] [CrossRef]
  41. Janzen, D.H. Sweep samples of tropical foliage insects: Effects of seasons, vegetation types, elevation, time of day and insularity. Ecology 1973, 54, 687–708. [Google Scholar] [CrossRef]
  42. Whittaker, R.H.; Niering, W.A. Vegetation of the Santa Catalina Mountains, Arizona. V. Biomass, production, and diversity along the elevation gradient. Ecology 1975, 56, 771–790. [Google Scholar] [CrossRef]
  43. Shmida, A.V.I.; Wilson, M.V. Biological determinants of species diversity. J. Biogeogr. 1985, 12, 1–20. [Google Scholar] [CrossRef]
  44. McCoy, E.D. The distribution of insects along elevational gradients. Oikos 1990, 58, 313–332. [Google Scholar] [CrossRef]
  45. Lieberman, D.; Lieberman, M.; Peralta, R.; Hartshorn, G.S. Tropical forest structure and composition on a large-scale altitudinal gradient in Costa Rica. J. Ecol. 1996, 84, 137–152. [Google Scholar] [CrossRef]
  46. Rahbek, C. The elevational gradient of species richness: A uniform pattern? Ecography 1995, 18, 200–205. [Google Scholar] [CrossRef]
  47. Rahbek, C. The relationship among area, elevation, and regional species richness in neotropical birds. Am. Nat. 1997, 149, 875–902. [Google Scholar] [CrossRef]
  48. Fleishman, E.; Austin, G.T.; Weiss, A. An empirical test of Rapoport’s rule: Elevational gradients in montane butterfly communities. Ecology 1998, 79, 2472–2483. [Google Scholar]
  49. Raviraja, N.S.; Sridhar, K.R.; Barlocher, F. Fungal species richness in Western Ghat streams (southern India): Is it related to pH, temperature or altitude. Fungal Diver. 1998, 1, 179–191. [Google Scholar]
  50. Bruun, H.H.; Moen, J.; Virtanen, R.; Grytnes, J.A.; Oksanen, L.; Angerbjörn, A. Effects of altitude and topography on species richness of vascular plants, bryophytes and lichens in alpine communities. J. Veg. Sci. 2006, 17, 37–46. [Google Scholar] [CrossRef]
  51. Terborgh, J. Bird species diversity on an Andean elevational gradient. Ecology 1977, 58, 1007–1019. [Google Scholar] [CrossRef]
  52. Owen, J.G. Patterns of mammalian species richness in relation to temperature, productivity, and variance in elevation. J. Mammal. 1990, 71, 1–13. [Google Scholar] [CrossRef]
  53. Lawton, J.H.; MacGarvin, M.; Heads, P.A. Effects of altitude on the abundance and species richness of insect herbivores on bracken. J. Animal Ecol. 1987, 56, 147–160. [Google Scholar] [CrossRef]
  54. Wolda, H. Altitude, habitat and tropical insect diversity. Biol. J. Linn. Soc. 1987, 30, 313–323. [Google Scholar] [CrossRef]
  55. Fernandes, G.W.; Price, P.W. Biogeographical gradients in galling species richness. Oecologia 1988, 76, 161–167. [Google Scholar] [CrossRef]
  56. Kearns, C.A. Anthophilous fly distribution across an elevation gradient. Am. Midl. Nat. 1992, 127, 172–182. [Google Scholar] [CrossRef]
  57. Olson, D.M. The distribution of leaf litter invertebrates along a neotropical altitude gradient. J. Trop. Ecol. 1994, 10, 129–150. [Google Scholar] [CrossRef]
  58. Sparrow, H.R.; Sisk, T.D.; Ehrlich, P.R.; Murphy, D.D. Techniques and guidelines for monitoring neotropical butterflies. Conserv. Biol. 1994, 8, 800–809. [Google Scholar] [CrossRef]
  59. Sanchez-Rodriguez, J.F.; Baz, A. The effects of elevation on the butterfly communities of a Mediterranean mountain, Sierra de Javalmbre, central Spain. J. Lepid. Soc. 1995, 49, 192–207. [Google Scholar]
  60. Sanders, N.J. Elevational gradients in ant species richness: Area, geometry, and Rapoport’s rule. Ecography 2002, 25, 25–32. [Google Scholar] [CrossRef]
  61. Colwell, R.K.; Lees, D.C. The mid-domain effect: Geometric constraints on the geography of species richness. Trends Ecol. Evol. 2000, 15, 70–76. [Google Scholar] [CrossRef]
  62. Sanders, N.J.; Moss, J.; Wagner, D. Patterns of ant species richness along elevational gradients in an arid ecosystem. Glob. Ecol. Biogeogr. 2003, 12, 93–102. [Google Scholar] [CrossRef]
  63. Bhattarai, K.R.; Vetaas, O.R.; Grytnes, J.A. Fern species richness along a central Himalayan elevational gradient, Nepal. J. Biogeogr. 2004, 31, 389–400. [Google Scholar] [CrossRef]
  64. Grytnes, J.A.; Vetaas, O.R. Species richness and altitude: A comparison between null models and interpolated plant species richness along the Himalayan altitudinal gradient, Nepal. Am. Nat. 2002, 159, 294–304. [Google Scholar] [CrossRef]
  65. IPCC. Climate Change 2023: Future Climate Change, Risks, and Long-Term Responses; IPCC: Geneva, Switzerland, 2023; p. 12. [Google Scholar]
  66. IPCC. Climate Change 2001: The Scientific Basis; Contribution of Working Group I to the Third Assessment Report of the Intergovernmental Panel on Climate Change; IPCC: Geneva, Switzerland, 2001; p. 881. [Google Scholar]
  67. Hulme, M.; Jenkins, G. Climate Change Scenarios for the United Kingdom Scientific Report; Oxford University Research Archive: Oxford, UK, 1998. [Google Scholar]
  68. Menzel, A.; Sparks, T.H.; Estrella, N.; Koch, E.; Aasa, A.; Ahas, R.; Alm-Kubler, K.; Bissolli, P.; Braslavska, O.G.; Briede, A.; et al. European phenological response to climate change matches the warming pattern. Glob. Change Biol. 2006, 12, 1969–1976. [Google Scholar] [CrossRef]
  69. Root, T.L.; MacMynowski, D.P.; Mastrandrea, M.D.; Schneider, S.H. Human- modified temperatures induce species changes: Joint attribution. Proc. Natl. Acad. Sci. USA 2005, 102, 7465–7469. [Google Scholar] [CrossRef] [PubMed]
  70. Rosenzweig, C.; Karoly, D.; Vicarelli, M.; Neofotis, P.; Wu, Q.; Casassa, G.; Menzel, A.; Root, T.L.; Estrella, N.; Seguin, B.; et al. Attributing physical and biological impacts to anthropogenic climate change. Nature 2008, 453, 353–358. [Google Scholar] [CrossRef]
  71. Parmesan, C.; Ryrholm, N.; Stefanescu, C.; Hillk, J.K.; Thomas, C.D.; Descimon, H.; Huntleyk, B.; Kaila, L.; Kullberg, J.; Tammaru, T.; et al. Poleward shifts in geographical ranges of butterfly species associated with regional warming. Nature 1999, 399, 579–583. [Google Scholar] [CrossRef]
  72. Parmesan, C.; Yohe, G. A globally coherent fingerprint of climate change impacts across natural systems. Nature 2003, 421, 37–42. [Google Scholar] [CrossRef] [PubMed]
  73. Hickling, R.; Roy, D.B.; Hill, J.K.; Fox, R.; Thomas, C.D. The distributions of a wide range of taxonomic groups are expanding polewards. Glob. Change Biol. 2006, 12, 450–455. [Google Scholar] [CrossRef]
  74. Rosenzweig, C.; Casassa, G.; Karoly, D.J.; Imeson, A.; Liu, C.; Menzel, A.; Rawlins, S.; Root, T.L.; Seguin, B.; Tryjanowski, P. Assessment of observed changes and responses in natural and managed systems. In Climate Change 2007: Impacts, Adaptation and Vulnerability. Contribution of Working Group II to the Fourth Assessment Report of the Intergovernmental Panel on Climate Change; Parry, M.L., Canziani, O.F., Palutikof, J.P., van der Linden, P.J., Hansen, C.E., Eds.; Cambridge University Press: Cambridge, UK, 2007; pp. 79–131. [Google Scholar]
  75. Tüzün, N.; Stoks, R. Evolution of geographic variation in thermal performance curves in the face of climate change and implications for biotic interactions. Curr. Opin. Insect Sci. 2018, 29, 78–84. [Google Scholar] [CrossRef]
  76. Shah, A.A.; Dillon, M.E.; Hotaling, S.; Woods, H.A. High elevation insect communities face shifting ecological and evolutionary landscapes. Curr. Opin. Insect Sci. 2020, 41, 1–6. [Google Scholar] [CrossRef]
  77. Huntley, B. Species distribution and environmental change: Considerations from the site to the landscape scale. In Ecosystem Management: Questions for Science and Society; Maltby, E., Holdgate, M., Acreman, M., Weir, A., Eds.; Royal Holloway Institute for Environmental Research; Royal Holloway, University of London: London, UK, 1999; pp. 115–129. [Google Scholar]
  78. Richards, C.S.; Price, B.W.; Villet, M. Thermal ecophysiology of seven carrion-feeding blowflies in Southern Africa. Entomol. Exp. Appl. 2009, 131, 11–19. [Google Scholar] [CrossRef]
  79. Amendt, J. Insect Decline—A Forensic Issue? Insects 2021, 12, 324. [Google Scholar] [CrossRef]
  80. Fremdt, H.; Amendt, J. Species composition of forensically important blow flies (Diptera: Calliphoridae) and flesh flies (Diptera: Sarcophagidae) through space and time. Forensic Sci. Int. 2014, 236, 1–9. [Google Scholar] [CrossRef]
  81. de Carvalho Moretti, T.; Godoy, W.A.C. Spatio-Temporal Dynamics and Preference for Type of Bait in Necrophagous Insects, Particularly Native and Introduced Blow Flies (Diptera: Calliphoridae). J. Med. Entomol. 2013, 50, 415–424. [Google Scholar] [CrossRef]
  82. Szpila, K. Key for Identification of European and Mediterranean Blowflies (Diptera, Calliphoridae) of medical and Veterinary Importance-adult Flies. Int. J. Leg. Med. 2017, 132, 831–842. [Google Scholar]
  83. de Carvalho, C.J.B.; de Mello-Patui, C.A. Key to the adults of the most common forensic species of Diptera in South America. Rev. Bras. Entomol. 2008, 52, 390–406. [Google Scholar] [CrossRef]
  84. Amat, E.; Velex, M.C.; Wolff, M. [Clave ilustrada para la identificación de los géneros y las especies de califóridos (Diptera: Calliphoridae) de Colombia]. Illustrated key for identification to genera and species of blowflies (Diptera: Calliphoridae) of Colombia. Caldasia 2008, 30, 231–244. [Google Scholar]
  85. Whitworth, T.L. Keys to the genera and species of blow flies (Diptera: Calliphoridae) of the West Indies and description of a new species of Lucilia Robineau-Desvoidy. Zootaxa 2010, 2663, 1–35. [Google Scholar] [CrossRef]
  86. Erzinclioglu, Z. Blowflies; Richmond Publishing Co. Ltd.: Slough, UK, 1996; Volume 23, p. 71. [Google Scholar]
  87. Monaco, C.; Catalano, S.; De Guidi, G.; Gresta, S.; Langer, H.; Tortorici, L. The geological map of the urban area of Catania (Eastern Sicily): Morphotectonic and seismotectonic implications. Memor. Soc. Geol. Ital. 2000, 55, 425–438. [Google Scholar]
  88. Morales, K.; Vinicius, T. Amazon rainforest: Biodiversity and biopiracy. Student BMJ 2003, 13, 386–387. [Google Scholar]
  89. Kruskal, W.H.; Wallis, A. Use of ranks in one-criterion variance analysis. J. Am. Stat. Assoc. 1952, 47, 582–621. [Google Scholar] [CrossRef]
  90. Dunn, O.J. Multiple comparisons among means. J. Am. Stat. Assoc. 1961, 56, 52–64. [Google Scholar] [CrossRef]
  91. Benjamini, Y.; Hochberg, Y. Controlling the False Discovery Rate: A Practical and Powerful Approach to Multiple Testing. J. R. Stat. 1995, 57, 289–300. [Google Scholar] [CrossRef]
  92. Shannon, C.E. A mathematical theory of communication. Bell Syst. Tech. J. 1948, 27, 379–423. [Google Scholar] [CrossRef]
  93. Sørensen, T. A method of establishing groups of equal amplitude in plant sociology based on similarity of species and its application to analyses of the vegetation on Danish commons. Biol. Skr. 1948, 5, 1–34. [Google Scholar]
  94. Chao, A.; Gotelli, N.J.; Hsieh, T.C.; Sander, E.L.; Ma, K.H.; Colwell, R.K.; Ellison, A.M. Rarefaction and extrapolation with Hill numbers: A framework for sampling and estimation in species diversity studies. Ecol. Monogr. 2014, 84, 45–67. [Google Scholar] [CrossRef]
  95. Chao, A.; Ma, K.H.; Hsieh, T.C. iNEXT (iNterpolation and EXTrapolation) Online: Software for Interpolation and Extrapolation of Species Diversity. 2016 Program and User’s Guide. Available online: http://chao.stat.nthu.edu.tw/wordpress/software_download/inext-online/ (accessed on 12 March 2025).
  96. Hurlbert, S.H. The Nonconcept of Species Diversity: A Critique and Alternative Parameters. Ecology 1971, 52, 577–586. [Google Scholar] [CrossRef]
  97. Sanders, H.L. Marine Benthic Diversity: A Comparative Study. Am. Nat. 1978, 102, 243–282. [Google Scholar] [CrossRef]
  98. Dufrêne, M.; Legendre, P. Species assemblages and indicator species: The need for a flexible asymmetrical approach. Ecol. Monogr. 1997, 67, 345–366. [Google Scholar] [CrossRef]
  99. McCune, B.; Grace, J.B. Analysis of Ecological Communities; MjM Software Design: Gleneden Beach, OR, USA, 2002; p. 300. [Google Scholar]
  100. R Development Core Team. Data from: R: A Language and Environment for Statistical Computing; R Foundation for Statistical Computing: Vienna, Austria, 2018. [Google Scholar]
  101. Google. Google Colab. Available online: https://colab.research.google.com/ (accessed on 12 March 2025).
  102. Rogers, P.C.; Šebesta, J. Past management spurs differential plant communities within a giant single-clone aspen forest. Forests 2019, 10, 1118–1134. [Google Scholar] [CrossRef]
  103. Gemmellaro, M.D.; Bucolo, C.; Musumeci, E.; Hamilton, G.C.; Weidner, L.M. First observations of initial blow fly (Diptera: Calliphoridae) activity on lava fields and in subterranean environments in Sicily in cool temperatures. J. Med. Entomol. 2018, 55, 1622–1626. [Google Scholar] [CrossRef]
  104. Smith, C.A.; Poirier, L.M.; Anderson, G.S. The effect of season and urbanisation on Calliphoridae (Diptera) diversity in British Columbia, Canada, using baited traps. Can. Entomol. 2023, 155, e24. [Google Scholar] [CrossRef]
  105. Reiter, C. Zum Wachtstumsverhalten der Maden der blauen Schmeissfliege Calliphora vicina. Z. Rechtsmed. 1984, 91, 295–308. [Google Scholar] [CrossRef]
  106. Haskell, N.H.; Hall, R.D.; Cervenka, V.J.; Clark, M.A. On the body: Insects’ life stage presence and their postmortem artifacts. In Forensic Taphonomy. The Postmortem Fate of Human Remains; Haglund, W.D., Sorg, M.H., Eds.; CRC: Boca Raton, FL, USA, 1997; pp. 415–448. [Google Scholar]
  107. Martinez-Sanchez, A.; Rojo, S.; Marcos-Garcia, M.A. Annual and spatial activity of dung flies and carrion in a Mediterranean holm-oak pasture ecosystem. Med. Vet. Entomol. 2000, 14, 56–63. [Google Scholar] [CrossRef] [PubMed]
  108. Davies, L.; Lawrence, B.R. The distribution of Calliphora species in Britain and Ireland (Dipt., Calliphoridae). Entomol. Mon. Mag. 1990, 128, 207–213. [Google Scholar]
  109. Nuorteva, P. Synanthropy of blowflies (Diptera: Calliphoridae) in Finland. Ann. Entomol. Fenn. 1963, 29, 1–49. [Google Scholar]
  110. Chu, H.; Rosati, J.; Paucar, Y. The diversity of forensically important flies in Manhattan. In Proceedings of the Entomological Society of America, Denver, CO, USA, 5–8 November 2017. [Google Scholar]
  111. Gemmellaro, D.M. Food preferences of adult male and female Calliphora vicina (Diptera: Calliphoridae). 2025; Manuscript submitted for publication. [Google Scholar]
  112. Hamilton, W.D. Extraordinary sex ratios. Science 1967, 156, 477–488. [Google Scholar] [CrossRef]
  113. Iritani, R.; West, S.A.; Abe, J. Cooperative interactions among females can lead to even more extraordinary sex ratios. Evol. Lett. 2021, 5, 370–384. [Google Scholar] [CrossRef]
  114. Lees, D.C.; Kremen, C.; Andriamampianina, L. A null model for species richness gradients: Bounded range overlap of butterflies and other rainforest endemics in Madagascar. Biol. J. Linn. Soc. 1999, 67, 529–584. [Google Scholar] [CrossRef]
  115. Ngoen-klan, R.; Moophayak, K.; Klong-klaew, T.; Irvine, K.N.; Sukontason, K.L.; Prangkio, C.; Somboon, P.; Sukontason, K. Do climatic and physical factors affect populations of the blow fly Chrysomya megacephala and house fly Musca domestica? Parasitol. Res. 2011, 109, 1279–1292. [Google Scholar] [CrossRef]
  116. Jin, B.L.; Jaal, Z. Temporal changes in the abundance of Musca domestica Linn (Diptera: Muscidae) in poultry farms in Penang, Malaysia. Trop. Biomed. 2009, 26, 140–148. [Google Scholar]
  117. Hawkins, B.A.; Felizola Diniz-Filho, J.A. ‘Latitude’ and geographic patterns in species richness. Ecography 2004, 27, 268–272. [Google Scholar] [CrossRef]
  118. Greenberg, B.; Szyska, M.L. Immature stages and biology of fifteen species of Peruvian Calliphoridae (Diptera). Ann. Entomol. Soc. Am. 1984, 77, 488–517. [Google Scholar] [CrossRef]
  119. Tsuda, Y.; Hayashi, T.; Higa, Y.; Hoshino, K.; Kasai, S.; Tomita, T.; Kurahashi, H.; Kobayashi, M. Dispersal of a blow fly, Calliphora nigribasis, in relation to the dissemination of highly pathogenic avian influenza virus. Jap. J. Infect. Dis. 2009, 62, 294–297. [Google Scholar] [CrossRef]
  120. Weidner, L.M.; Gemmellaro, M.D.; Tomberlin, J.K.; Hamilton, G.C. Evaluation of bait traps as a means to predict initial blow fly (Diptera: Calliphoridae) communities associated with decomposing swine remains in New Jersey, USA. Forensic Sci. Int. 2017, 278, 95–100. [Google Scholar] [CrossRef] [PubMed]
  121. LeBlanc, K.; Boudreau, D.R.; Moreau, G. Small bait traps may not accurately reflect the composition of necrophagous Diptera associated to remains. Insects 2021, 12, 261. [Google Scholar] [CrossRef] [PubMed]
  122. Vogt, W.G.; Woodburn, T.L. Effects of bait age on the number, sex, and age composition of Lucilia cuprina (Wiedemann)(Diptera: Calliphoridae) in Western Australian blowfly traps. Aust. J. Exp. Agric. 1994, 34, 595–600. [Google Scholar] [CrossRef]
  123. Farinha, A.; Dourado, C.G.; Centeio, N.; Oliveira, A.R.; Dias, D.; Rebelo, M.T. Small bait traps as accurate predictors of dipteran early colonizers in forensic studies. J. Insect Sci. 2014, 14, 77. [Google Scholar] [CrossRef]
Figure 1. Sampling sites at different elevations in Sicily. Orange = 20 m (level 1), blue = 700 m (level 2), yellow = 1153 m (level 3), and red = 1552 m (level 4).
Insects 16 00498 g001
Figure 2. Sampling sites at different elevations in Ecuador. Blue = 561 m (level 1), yellow = 1312 m (level 2), red = 1948 m (level 3), and green = 3336 m (level 4).
Insects 16 00498 g002
Figure 3. Blow fly species diversity across elevations in Sicily using the Shannon (H) diversity index.
Insects 16 00498 g003
Figure 4. Sorenson’s (CC) Similarity Index between elevations in Sicily. a1 = level 1 (20 m), a2 = level 2 (700 m), a3 = level 3 (1153 m), and a4 = level 4 (1552 m).
Insects 16 00498 g004
Figure 5. Rarefaction/Extrapolation curves for the four elevation levels (lvl) in Sicily; the x-axis displays the numbers of specimens and the y-axis the species richness (number of species).
Insects 16 00498 g005
Figure 6. Nonmetric multidimensional scaling ordinations of blow fly communities across elevations in Sicily. This ordination explains 91% of variation (minimum stress = 0.083). MRPP analysis showed significant differences between 700 m and 1153 m (A = 0.3035 p = 0.035). Circles represent elevation 20 m, triangles elevation 700 m, squares elevation 1153 m, and crosses elevation 1552 m.
Insects 16 00498 g006
Figure 7. Blow fly species diversity across elevations in Ecuador using the Shannon (H) diversity index.
Insects 16 00498 g007
Figure 8. Sorenson’s (CC) Similarity Index between elevations in Ecuador. a1 = level 1 (561 m), a2 = level 2 (1312 m), a3 = level 3 (1948 m), and a4 = level 4 (3336 m).
Insects 16 00498 g008
Figure 9. Nonmetric multidimensional scaling ordinations of blow fly communities across elevations in Ecuador. This ordination explains 82% of variation (minimum stress = 0.14). MRPP analysis showed significant differences between all levels (561 m and 1948 m (A = 0.2893 p = 0.027); 561 m and 3336 m (A = 0.2747 p = 0.04); 1312 m and 1948 m (A = 0.31261 p = 0.025); 1312 m and 3336 m (A = 0.2977 p = 0.028)), except between 1948 m and 3336 m (A = 0.1031 p = 0.083). Circles represent elevation 561 m, triangles elevation 1312 m, squares elevation 1948 m, crosses elevation 3336 m.
Insects 16 00498 g009
Figure 10. Rarefaction/Extrapolation curves for the four elevation levels (lvl) in Ecuador; the x-axis displays the numbers of specimens and the y-axis the species richness (number of species).
Insects 16 00498 g010
Figure 11. Blowfly species diversity across elevations in Sicily (orange) and Ecuador (green) using the Shannon (H) diversity index.
Insects 16 00498 g011
Table 1. Location, level designation, elevation, and geographical coordinates of collection sites.
LocationLevelElevation (m)Coordinates
Sicily
Catania12037.5427° N, 15.0843° E
San Teodoro270037.8071° N, 14.6994° E
Contrada Casale Nuovo3115337.8521° N, 14.6919° E
Monte Soro4155237.9258° N, 14.6702° E
Ecuador
Tena15610.5938° S, 77.4818° W
Sarayacu213120.4208° S, 77.4844° W
Baeza319480.2759° S, 77.5321° W
Papallacta433360.2225° S, 78.0825° W
Table 2. Average temperature (±SE), average relative humidity (±SE), and annual precipitation.
LocationElevation LevelElevation(m)Temperature (°C) (±SE)Humidity (%) (±SE)Precipitation
Sicily
Catania12025.23 ± 0.6464.13 ±1.240.3 mm
San Teodoro270022.46 ± 0.8362.06 ± 1.117 mm
Contrada Casale Nuovo3115319.72 ± 0.4261.14 ± 0.878 mm
Monte Soro4155216.32 ± 0.1362.2 ± 1.548.2 mm
Ecuador
Tena156123.28 ± 1.299.52 ± 0.444330 mm
Sarayacu2131219.47 ± 0.6694.57 ± 2.431013 mm
Baeza3194817.07 ± 0.8789.37 ± 1.562220 mm
Papallacta4333611.29 ± 0.1193.41 ± 1.321281 mm
Table 3. Relative abundance (%) of blow fly species collected in Sicily. Relative abundances are shown by species at each elevation as well as overall relative abundance (Rel. Ab.) during the duration of the survey.
SICILY
SpeciesElevation 20 mElevation 700 mElevation 1153 mElevation 1552 mTotalRel. Ab.
Lucilia sericata42.23%89.80%43.22%-337568.50%
Calliphora vicina56.79%5.44%50.60%40.80%103021.00%
Calliphora vomitoria-<1%2.60%55.16%2515.09%
Lucilia ampullacea-2.83%2.78%<1%1212.40%
Lucilia silvarum<1%2.09%<1%-671.36%
Chrysomya albiceps-<1%<1%-270.55%
Calliphora subalpina-<1%-3.78%190.38%
Lucilia caesar-<1%<1%-140.28%
Lucilia illustris-<1%--120.24%
Lucilia cuprina<1%<1%<1%-70.14%
Calliphora loewi-<1%<1%-20.04%
Cynomia mortuorum-<1%--10.02%
Number of Species41294
Number of Specimens206310811503974244100.00%
Table 4. The male-to-female (m/f) ratio of adult blow flies found in Sicily. Ratios are depicted by species for each elevation, as well as an overall m/f ratio.
SpeciesElevation 20 mElevation 700 mElevation 1153 mElevation 1552 mTotal MalesTot FemalesM/F Ratio
Lucilia sericata13M/74F147M/2644F16M/481F 17631990.05
Calliphora vicina44M/73F72M/97F195M/387F49M/113F3606700.54
Calliphora vomitoria 2F13M/17F55M/164F681830.37
Lucilia ampullacea 38M/50F7M/25F1F45750.6
Lucilia silvarum1F14M/51F1F 14530.26
Chrysomya albiceps 26F1F 027
Calliphora subalpina 4F 6M/9F6130.46
Lucilia caesar 3M/7F4M 771
Lucilia illustris 4M/8F 480.5
Lucilia cuprina1M4F2F 160.16
Calliphora loewi 1F1F 02
Cynomia mortuorum 1F 01
Table 5. Differences in species abundance across elevations in Sicily using Kruskal–Wallis one-way ANOVA and Dunn test with Benjamini–Hochberg adjustment.
SpeciesKruskal–WallisDunn
1 v 21 v 31 v 42 v 32 v 43 v 4
L. silvarum6.771 (0.080) - - - - - -
L. sericata13.224 (0.004)0.0140.2110.6700.2100.0070.114
L. ampullacea7.313 (0.063) - - - - - -
L. cuprina1.187 (0.756) - - - - - -
L. illustris6.400 (0.094) - - - - - -
L. caesar3.845 (0.279) - - - - - -
C. vicina7.318 (0.062) - - - - - -
C. vomitoria2.522 (0.471) - - - - - -
C. subalpina6.450 (0.090) - - - - - -
C. loewi2.143 (0.543) - - - - - -
C. albiceps4.393 (0.222) - - - - - -
C. mortuorum4.393 (0.222) - - - - - -
Numbers 1–4 relate to elevation level (1 = 20 m, 2 = 700 m, 3 = 1152 m, 4 = 1553 m). For Kruskal–Wallis, p values are in parentheses; number listed under Dunn = p value. Bold values represent significant values.
Table 6. Indicator species for two of the four elevations in Sicily. A level designation, elevation, indicator value, and p value are provided for each species.
SpeciesLevelElevationValuep Value
Lucilia sericata2700 m82.700.004
Lucilia silvarum2700 m72.760.033
Calliphora vicina31153 m56.500.026
Table 7. Significant differences in blow fly communities in Sicily across elevations using the Multiple Response Permutation Procedure.
Elevation 20 mElevation 700 mElevation 1152 m
Elevation 700 mA: 0.1982;
Obs. Delta: 0.5097;
Exp. Delta: 0.6357
p = 0.13
Elevation 1152 mA: 0.0042;
Obs. Delta: 0.5053;
Exp. Delta: 0.5075
p = 0.6
A: 0.3035;
Obs. Delta: 0.3681;
Exp. Delta: 0.5285
p = 0.035
Elevation 1553 mA: −0.002;
Obs. Delta: 0.7864;
Exp. Delta: 0.7848
p = 0.66
A: 0.3732;
Obs. Delta: 0.2714;
Exp. Delta: 0. 5925
p = 0.2
A: 0.1968;
Obs. Delta: 0.3648;
Exp. Delta: 0. 4541
p = 0.2
Table 8. Relative abundance (%) of blow fly species collected in Ecuador. Relative abundances are shown by species at each elevation, as well as overall relative abundance (Rel. Ab.) throughout the duration of the survey.
SpeciesElevation 561 mElevation 1312 mElevation 1948 mElevation 3336 mTotalRel. Ab.
Consomyiops verena--65.27%74.90%77151.67%
Calliphora nigribasis---24.18%1389.25%
Lucilia eximia25.12%27.69%2.72%-1127.50%
Chrysomia albiceps20.46%43.85%<1%<1%1087.24%
Paralucilia sp.31.63%15.38%--885.90%
Lucilia purpurescens-2.30%13.82%-795.30%
Hemilucilia semidiaphana12.09%3.08%5.09%-583.90%
Chrysomia megacephala3.72%-7.81%-513.42%
Hemilucilia segmentaria2.79%<1%<1%-432.90%
Lucilia ibis-1.54%4.00%-241.60%
Chloroprocta idiodea-4.61%--60.40%
Lucilia sp.1.86%-<1%-50.33%
Cochliomyia macellaria1.4%<1%--40.27%
Lucilia albofusca<1%<1%--20.14%
Cochliomyia hominivorax<1%---10.06%
Chrysomia sp.--<1%-10.06%
Lucilia ochicornis--<1%-10.06%
Number of Species1010113
Number of Specimens2151305505501492100.00%
Table 9. The male-to-female (m/f) ratio of adult blow flies found in Sicily. Ratios are depicted by species for each elevation, as well as an overall m/f ratio.
SpeciesElevation 561 mElevation 1312 mElevation 1948 mElevation 3336 mTot MaleTot FemaleM/F Ratio
Consomyiops verena 72M/287F91M/321F1636080.27
Calliphora nigribasis 53M/80F53800.66
Lucilia eximia8M/46F3M/32F15F 19930.12
Chrysomia albiceps8M/36F13M/44F2F5F21870.24
Paralucilia sp.13M/55F20F 13750.17
Lucilia purpurescens 3F7M/69F 7720.09
Hemilucilia semidiaphana4M/22F4F5M/23F 9490.15
Chrysomia megacephala1M/7F 6M/37F 7440.16
Hemilucilia segmentaria1M/5F1F2F 9340.12
Lucilia Ibis 2F3M/19F 3210.14
Chloroprocta idiodea 6F 06
Lucilia sp.4F 1F 05
Cochliomyia macellaria3F1F 04
Lucilia albofusca1F1F 02
Cochliomyia hominivorax1F 01
Chrysomia sp. 1F 01
Lucilia ochicornis 1F 01
Table 10. Differences in species abundance across elevations using Kruskal–Wallis one-way ANOVA and Dunn test with Benjamini–Hochberg adjustment.
SpeciesKruskal–WallisDunn
1 v 21 v 31 v 42 v 32 v 43 v 4
C. nigribasis10.253(0.020)1.01.00.0171.00.0260.054
C. megacephala5.025 (0.170) - --- - -
C. idiodea3.00 (0.392) - - - - - -
C. albiceps11.061 (0.011)0.8480.0380.0470.0670.0571.0
Chrysomya sp.3.00 (0.392) - - - - - -
C. hominivorax3.00 (0.392) - - - - - -
C. macellaria4.393 (0.222) - - - - - -
C. verena10.923 (0.010)1.00.0740.0260.0990.0530.615
H. segmentaria2.987 (0.394) - - - - - -
H. semidiaphana8.754 (0.030)0.1240.9370.1150.1110.7600.071
L. albofusca2.143 (0.543) - - - - - -
L. eximia5.67 (0.129) - - - - - -
L. ibis8.137 (0.040)0.2880.0441.00.4110.3600.088
L. ochicornis3.00 (0.392) - - - - - -
L. purporsecens12.913 (<0.001)0.7060.0061.00.0230.8820.013
Lucilia sp.7.702 (0.053) - - - - - -
Paralucilia sp.11.331 (0.010)0.4410.0180.0360.0980.1301.0
Numbers 1–4 = elevation levels (1 = 561 m, 2 = 1312 m, 3 = 1948 m, 4 = 3336 m). Significant p values are bolded for each test.
Table 11. Indicator species for three of the four elevations in Ecuador. A level designation, elevation, indicator value, and p value are provided for each species.
SpeciesLevelElevationValuep Value
Paralucilia sp.1560 m77.270.021
Lucilia purpurescens31948 m96.200.003
Lucilia ibis31948 m68.750.028
Calliphora nigribasis43336 m75.000.033
Table 12. Significant differences in blow fly communities in Ecuador across elevations using the Multiple Response Permutation Procedure.
Elevation 561 mElevation 1312 mElevation 1948 m
Elevation 1312 mA: 0.0108;
Obs. Delta: 0.5555;
Exp. Delta: 0.5616
p = 0.39
Elevation 1948 mA: 0.2893;
Obs. Delta: 0.5465;
Exp. Delta: 0.7689
p = 0.027
A: 0.3161;
Obs. Delta: 0.5185;
Exp. Delta: 0.7581
p = 0.025
Elevation 3336 mA: −0.2747;
Obs. Delta: 0.586;
Exp. Delta: 0.808
p = 0.04
A: 0.2977;
Obs. Delta: 0.558;
Exp. Delta: 0. 7945
p = 0.028
A: 0.1031;
Obs. Delta: 0.5489;
Exp. Delta: 0.612
p = 0.083
Disclaimer/Publisher’s Note: The statements, opinions and data contained in all publications are solely those of the individual author(s) and contributor(s) and not of MDPI and/or the editor(s). MDPI and/or the editor(s) disclaim responsibility for any injury to people or property resulting from any ideas, methods, instructions or products referred to in the content.