Article

Complete Mitochondrial Genome of Apis cerana (Hymenoptera: Apidae) from Two Geographical Regions: Insights into Structure and Genetic Differentiation

1
State Key Laboratory of Resource Insects, Institute of Apicultural Research, Chinese Academy of Agricultural Sciences, Beijing 100093, China
2
Key Laboratory for Insect-Pollinator Biology of the Ministry of Agriculture and Rural Affairs, Institute of Apicultural Research, Chinese Academy of Agricultural Sciences, Beijing 100093, China
3
College of Animal Science and Technology, Yunnan Agricultural University, Kunming 650201, China
4
Guizhou Livestock and Poultry Genetic Resources Management Station, Guiyang 550000, China
*
Author to whom correspondence should be addressed.
Insects 2024, 15(12), 960; https://doi.org/10.3390/insects15120960
Submission received: 22 October 2024 / Revised: 16 November 2024 / Accepted: 30 November 2024 / Published: 2 December 2024
(This article belongs to the Section Insect Molecular Biology and Genomics)

Simple Summary

Mitochondrial DNA is inherited maternally in bees, and the mitochondrial DNA characteristics of a single bee can represent those of the entire colony. We determined the complete mitochondrial genomes of the Apis cerana-Diannan and Apis cerana-Yun-Gui Plateau populations by using PacBio HiFi sequencing technology. The A. cerana-Diannan and A. cerana-Yun-Gui Plateau mitochondrial genome lengths were 16,214 and 16,304 bp, respectively. Both A. cerana mitochondrial genomes contained 13 protein-coding genes, 22 transfer RNAs, 2 ribosomal RNAs and an AT-rich region. The length of the AT-rich region of two A. cerana was different. Phylogenetic analyses showed that these two A. cerana populations belong to the same phylogenetic branch, but the genetic distance between DN and YG is further than that between YG and A. cerana-Aba and A. cerana-Central China. Our study shows that different geographical distributions of A. cerana show genetic diversity at the mitochondrial genome level.

Abstract

The honeybee Apis cerana is an important pollinator that is distributed across most regions in China. Mitochondrial DNA (mtDNA) is inherited maternally in bees; therefore, the mtDNA characteristics of a single bee can represent those of the entire colony. Comparing the mitochondrial genomes of A. cerana from different geographic regions via third-generation sequencing technology could provide insights into species differentiation and enable the identification of stable molecular markers to distinguish among geographically distinct populations. Here, we determined the complete mitochondrial genomes of the Apis cerana-Diannan and Apis cerana-Yun-Gui Plateau populations by using PacBio HiFi sequencing technology. The A. cerana-Diannan and A. cerana-Yun-Gui Plateau mitochondrial genome lengths were 16,214 and 16,304 bp, respectively. Both A. cerana mitochondrial genomes contained 13 protein-coding genes (PCGs), 22 transfer RNAs (tRNAs), 2 ribosomal RNAs (rRNAs) and an AT-rich region. The relative synonymous codon usage (RSCU) values for 13 PCGs were greater than 1. The length of the AT-rich region of A. cerana in different regions was different. Phylogenetic analyses revealed that these two geographically distinct A. cerana populations belong to the same phylogenetic branch, but the genetic distance between DN and YG is further than that between YG and A. cerana-Aba and A. cerana-Central China. Overall, A. cerana with different geographic distributions exhibit genetic diversity at the mitochondrial genome level. A large fragment was found to be inserted or deleted in the AT-rich region, shedding light on the genetic differentiation of A. cerana in different ecological environments.

1. Introduction

The honeybee Apis cerana plays a crucial role as a pollinator, contributing significantly to biodiversity and supporting ecological processes. Due to the complex and varied topography in China, A. cerana has evolved in diverse environments and is now widely distributed across most regions of the country [1]. In 2011, the National Animal Genetic Resources Committee summarized previous research and classified A. cerana into nine ecological groups, including the Changbaishan, North China, Central China, South China, Tibet, Aba, the Yun-Gui Plateau, Diannan and Hainan groups [2]. However, the A. cerana populations have declined in some regions due to climate change, human activities and bee diseases [3,4]. Thus, the study of genetic diversity is fundamental to the conservation and utilization of honeybee resources and is particularly crucial for A. cerana populations that are experiencing rapid declines. Furthermore, it is important to elucidate the mechanisms of A. cerana environmental adaptation.
Assessments of honeybee genetic diversity have included morphological comparisons and the identification of molecular markers [5]. Relying solely on morphological characteristics to differentiate A. cerana groups has limitations, whereas molecular markers are recognized as a more reliable and accurate method [6]. Molecular markers are inheritable DNA sequences that can be precisely identified and are used to map genetic variations, including those involving proteins [7]. At present, mitochondrial DNA (mtDNA) markers are among the most frequently used molecular marker techniques [8]. Due to their rapid rate of evolution, simple structural composition and abundant genetic information, mitochondria have become crucial tools for studying the evolutionary origins and genetic diversity of organisms [9]. A. cerana exhibits a consistent matrilineal mitochondrial pattern and is an important pollinating insect; thus, it is considered an ideal organism for studying genetic diversity via the mitochondrial genome. Research has consistently shown that the mitochondrial genome varies significantly across species, subspecies and geographic groups of honeybees, making it an effective tool for studying genetic diversity and evolution in these insects [10,11].
Improvements in sequencing technologies and bioinformatic approaches make it feasible to detect genomic variation and to reveal the genomic properties associated with the process of adapting to local environments [12]. Sequencing technology is widely used for analyzing both gene fragments and whole genomes to assess genetic diversity [13,14]. Next-generation sequencing (NGS) analysis of the evolution of the A. mellifera mitochondrial genome and haplotype analysis of the COX3 gene have revealed genomic differences in A. mellifera at the subspecies level [15]. Sequencing of the complete mitochondrial genome and exons of the gene vitellogenin (VG) nuclear genome revealed genomic differences in the populations of A. cerana of the Far East of Russia, Korea and Japan at the subspecies level [16,17]. Third-generation sequencing (TGS) is currently dominated by the PacBio and Oxford Nanopore technologies. Compared with NGS, TGS provides longer read lengths, which has obvious advantages for specific applications and positions TGS as the predominant sequencing method today [18,19].
In this study, we collected two A. cerana groups from two different geographical locations. These populations correspond to the geographic populations A. cerana-Diannan (DN) and A. cerana-Yun-Gui Plateau (YG). The complete mitochondrial genomes of these two geographically distinct populations of A. cerana were assembled using PacBio HiFi sequencing technology. We identified genetic similarities and differences between the two A. cerana populations by comparing their mitochondrial genomes. This study will contribute to elucidating the genetic differentiation of A. cerana populations in various environments.

2. Materials and Methods

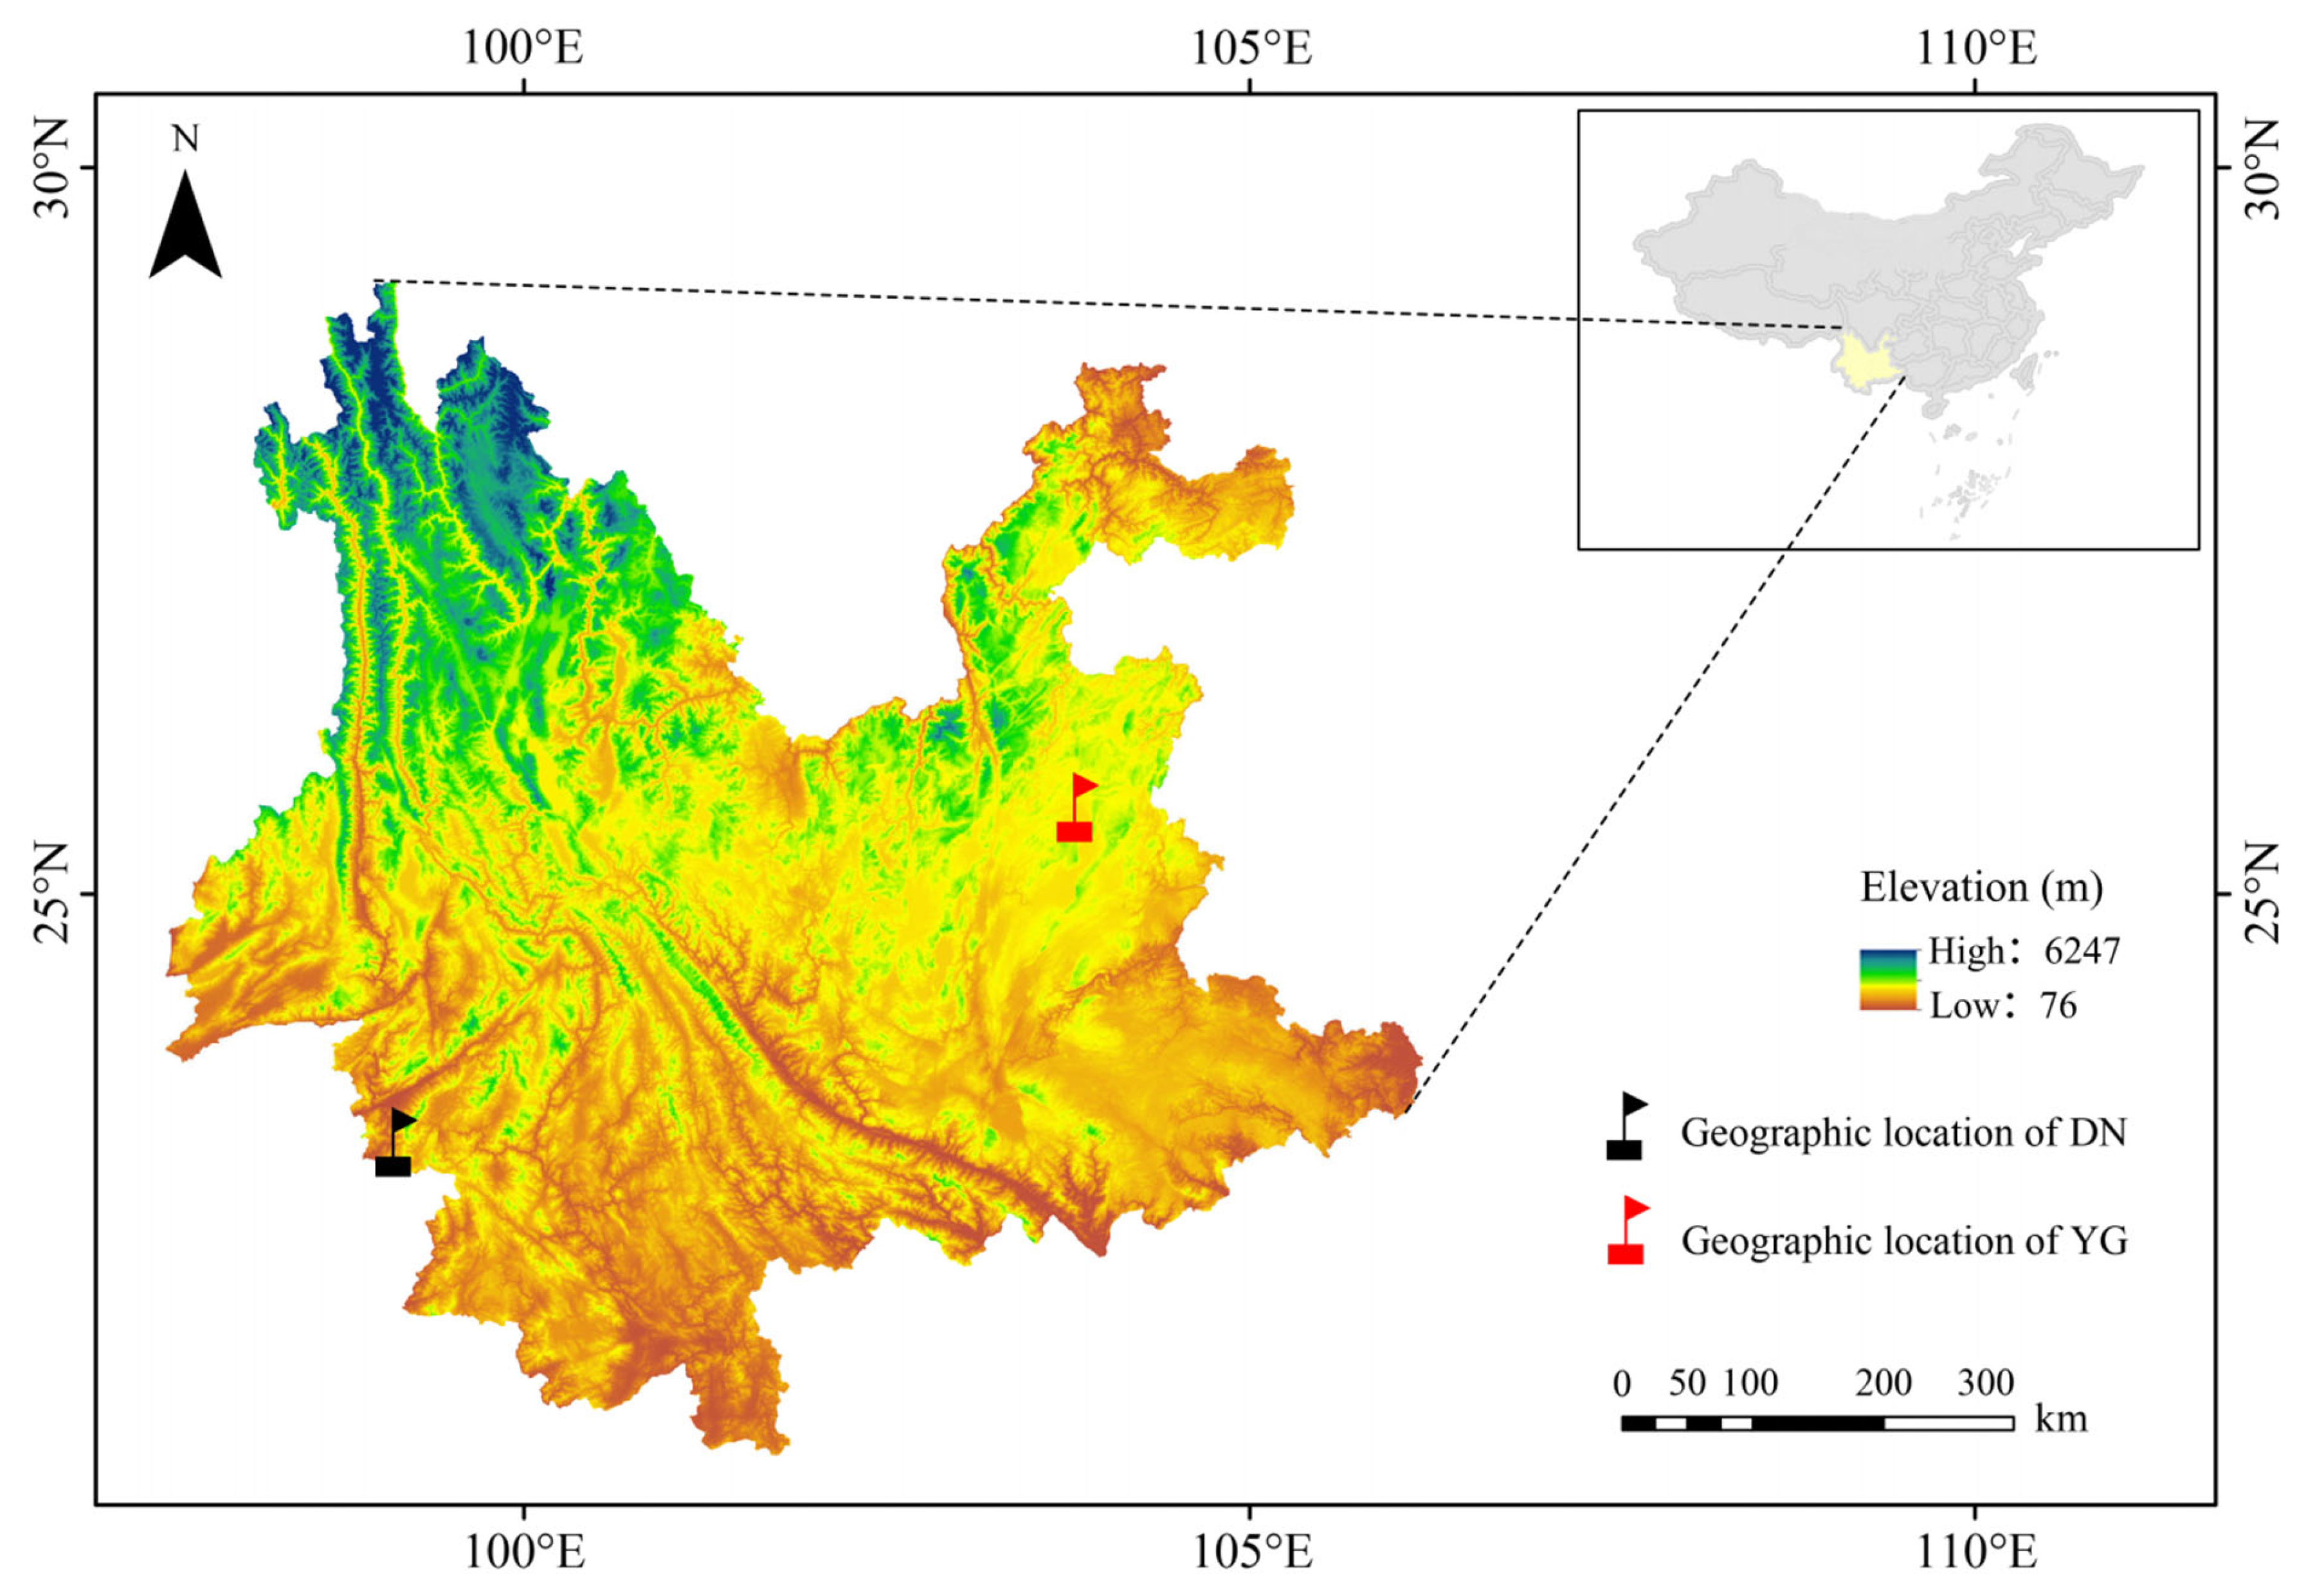
2.1. Sample Collection and DNA Sequencing

The DN samples were obtained from the Yunnan Cangyuan Experimental Station of the Institute of Apicultural Research, Chinese Academy of Agricultural Sciences, Cangyuan County, Yunnan Province (23°18′00″° N, 99°7′12″ E, 1251.4 m elevation), and the YG samples were obtained from an apiary located in Zhanyi District, Yunnan Province (25°36′00″ N, 103°49′12″ E, 1857.8 m elevation) (Figure 1). Fifteen drone pupae of DN and fifteen drone pupae of YG were sampled, placed in absolute ethanol and stored in a −20 °C freezer. Genomic DNA (gDNA) was extracted from one drone thorax per colony, following the Blood & Cell Culture DNA Kit (Qiagen Cat.13323, Hilden, German). DNA quality was assessed through three methods: NanoDrop spectrophotometry, gel electrophoresis and Qubit fluorometry. High-purity gDNA (≥10 μg, ≥100 ng/μL) was then prepared for library construction after purification with AMPure PB beads.
We constructed SMRTbell libraries using the SMRTbell Express Template Prep Kit 2.0 (PN 101-853-100, Pacific Biosciences, Menlo Park, CA, USA) following standard procedures. Briefly, DNA (10 μg) was assessed for fragment length (>40 Kb via pulsed-field electrophoresis), sheared to approximately 15 Kb and further processed for library construction, including end repair, adapter ligation and size selection via SageELF or BluePippin (Sage Science, Inc., Beverly, MA, USA). The final libraries were sequenced for 30 h using the Sequel II/IIe system (Pacific Biosciences, Menlo Park, CA, USA).

2.2. Mitochondrial Genome Assembly and Annotation

PacBio HiFi data for DN and YG were assembled using Hifiasm (0.19.5-r587) software [20,21]. The assembled genome was used to construct a local BLAST database. A reference A. cerana mitochondrial genome (GenBank: NC014295) was downloaded to search the local BLAST database. The MITOS Web Server (http://mitos.bioinf.uni-leipzig.de/result.py?name=DNmito_pilon&hash=S4tfplk8&no=0, accessed on 7 July 2023) [22] was used for preliminary annotation of the mitochondrial genome, and Chlorobox GeSeq (https://chlorobox.mpimp-golm.mpg.de/geseq.html, accessed on 7 July 2023) [23] was subsequently used to compare the annotated preliminary results with previously reported protein and RNA sequences for related species to verify the accuracy of the results and to correct them. A circular map of the mitochondrial genome was drawn based on the annotation results using the online tool Chloroplot v.0.2.4 (https://irscope.shinyapps.io/Chloroplot/, accessed on 12 July 2023) [24].

2.3. Mitochondrial Genome Sequence Analysis

BioEdit v.7.0.9.0 [25] was used to calculate the base composition and codon usage of the complete DN and YG mitochondrial genome sequence and the protein-coding genes (PCGs), tRNA genes, rRNA genes and AT-rich regions. Codon usage bias, represented by relative synonymous codon usage (RSCU), was calculated using codonW v.1.4.2 and was plotted into a bar graph using JSHYCloud (http://cloud.genepioneer.com:9929, accessed on 6 August 2023). An RSCU greater than 1 indicated a preference for certain amino acids. The AT and GC biases were calculated according to the following formulae: AT skew = (A − T)/(A + T) and GC skew = (G − C)/(G + C). MEGA v.11 [26] was used to compare the AT-rich region sequences of the two A. cerana groups with insertions or deletions.
To verify the AT-rich region in the two geographically distinct A. cerana populations, a sequence length analysis method was used. First, the BLASTN + 2.13.0 was used to screen mitochondrial genome sequences from the PacBio HiFi data for DN and YG. When the BLAST similarity to the A. cerana mitochondrial genome was greater than 80%, sequences were collected. Second, the left and right 400 bp lateral sequences of the AT-rich region were extracted, and a local database was constructed. Then, the -cx asm5 command of the Minimap2 [27] was used to align and collect sequences in which the length of the overlay region was more than 50 bp in AT-rich regions. The redundancy of duplicate sequences was addressed, and frequency distribution analysis was performed to determine the frequency distribution for different lengths of the mitochondrial AT-rich region.

2.4. Phylogenetic Analyses

The complete A. cerana mitochondrial genome was retrieved from the NCBI GenBank database. A total of 17 honeybee mitochondrial genomes were used in this study, including those of DN and YG, 13 published sequences and those of A. mellifera sinisxinyuan and A. mellifera capensis as outgroups (Table 1). Due to tRNA genes and rRNAs being highly conserved in base sequences and secondary structures, utilizing tRNAs and rRNAs in phylogenetic analyses was less accurate. Therefore, 13 PCGs were used to analyze the phylogenetic relationships of A. cerana groups from different geographic regions. The 13 PCG sequences were input into PhyloSuite v.1.2.3 [28,29] and aligned using MAFFT v.7.313 [30]. Then, the PCG sequences were concatenated. In the selection of evolutionary models, we used ModelFinder v.2.1.7 [31] based on the Bayesian information criterion (BIC) to determine the best model. The BIC not only considers the goodness of fit of the model but also penalizes the complexity of the model to avoid overfitting. The evolutionary tree was constructed using MrBayes v.3.2.6 [32] with a chain length set to 10 million generations, sampling every 1000 generations and discarding the first 25% as burn-in. Additionally, IQ tree v.1.6.8 [33] was used with bootstrap support values based on 1000 replicates.

3. Results

3.1. Mitogenome Organization and Base Composition

We assembled the complete DN (GenBank: PP175371) and YG (GenBank: PP175370) mitochondrial genomes (Figure 2). The length of the complete mitochondrial genome for DN was 16,214 bp, with an AT content of 84.27%, while that for YG was 16,304 bp, with an AT content of 84.38%. Both mitochondrial genomes were annotated with 37 genes, including 13 protein-coding genes (PCGs), 22 tRNA genes, 2 rRNA genes and an AT-rich region located between srRNA and trnS1 (Table 2). Among the 37 genes, 23 were located on the J chain (majority strand), and the remaining 14 were located on the N chain (minority strand) (Figure 2 and Table 2). There was no difference in the number of initiation or termination codons between the two A. cerana groups. The initiation codons of all the PCGs were standard ATN (T/C/G), and the termination codons were T(AA). The lengths of the DN and YG intergenic regions ranged from 0 to 230 bp and 0 to 231 bp, respectively. The ATP8 and ATP6 genes share 19 nucleotides.

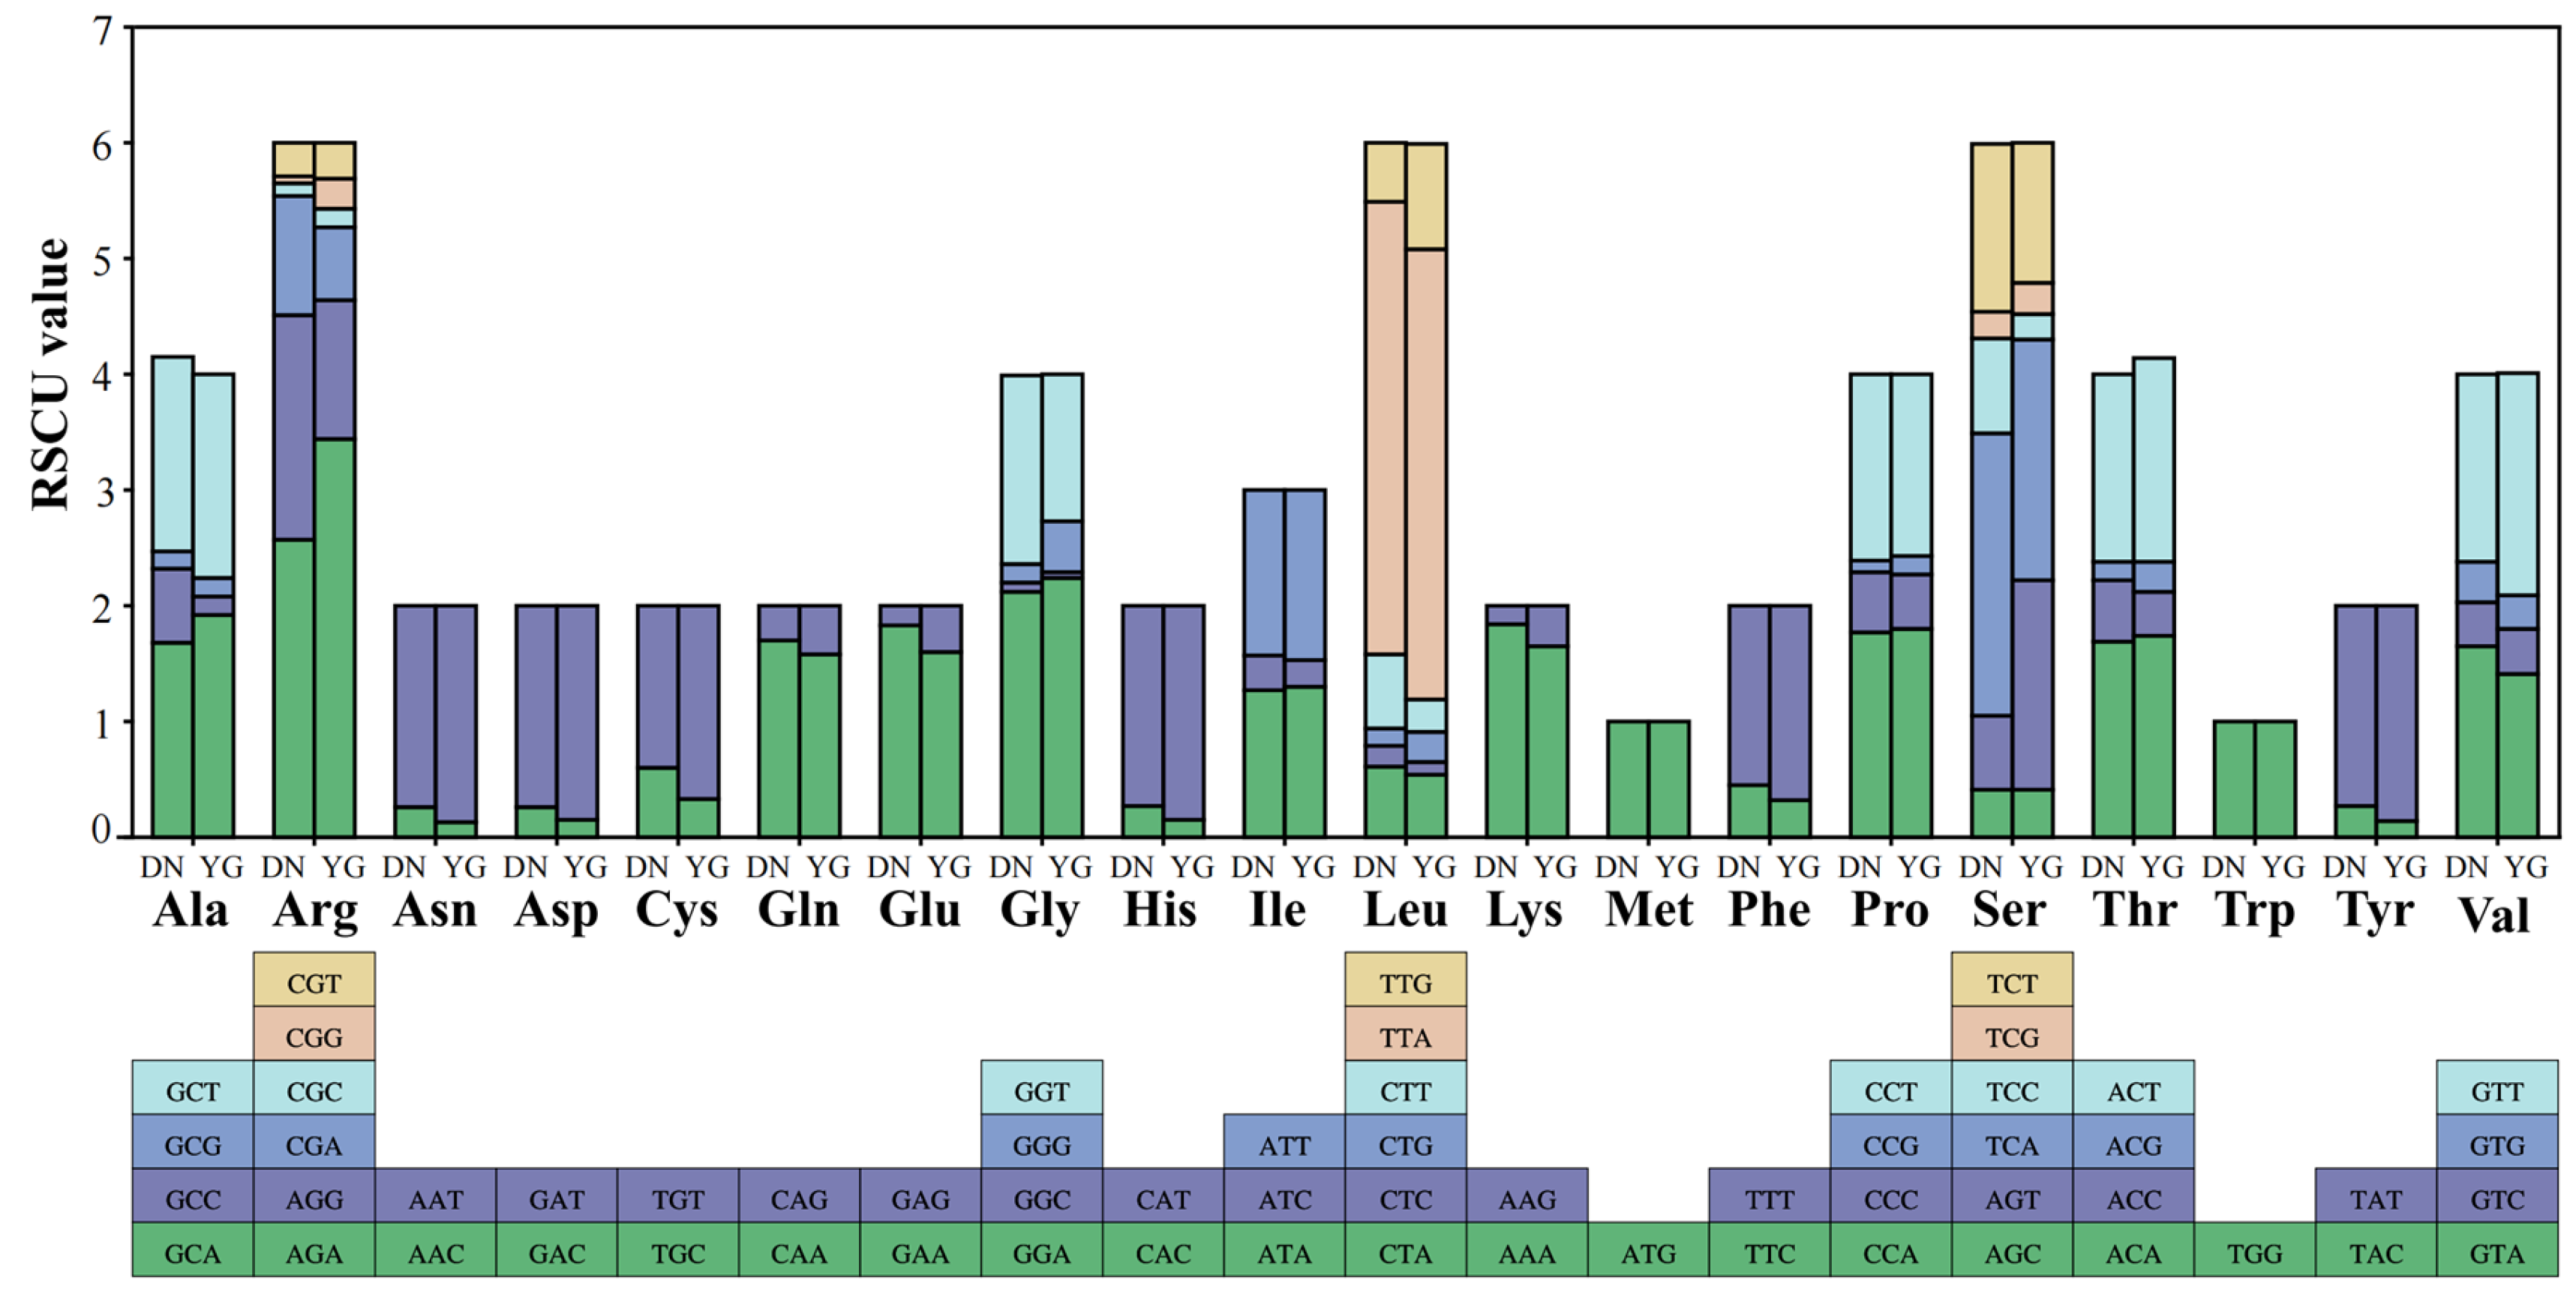
3.2. Protein-Coding Genes

The total length of the 13 PCGs in both DN and YG was 11,048 bp, accounting for 68.14% and 67.76%, respectively, of the entire mitochondrial genome (Table 3). Except for the A + T content of COX1 and COX2 in DN and YG, the A + T content of the other PCGs was greater than 80%, indicating an AT preference. According to the AT-skew and GC-skew results, most of the PCGs were biased toward T, while all PCGs showed a bias toward C.
We analyzed the frequency and RSCU values for 13 PCGs in the DN and YG mitochondrial genomes. The RSCU values for the 13 PCGs were greater than 1, except for those of the two amino acids Met and Trp, which were encoded by only one codon (Figure 3), indicating that all codons were biased. The TTA codon had the highest RSCU value in both A. cerana groups (3.91 in DN and 3.89 in YG), followed by the AGA codon (2.57 in DN and 3.44 in YG). NNA-type codons accounted for 42.82% and 42.33% of the total number of codons, indicating that codons with an A at the third position were the most frequent.

3.3. Transfer RNAs and Ribosomal RNAs
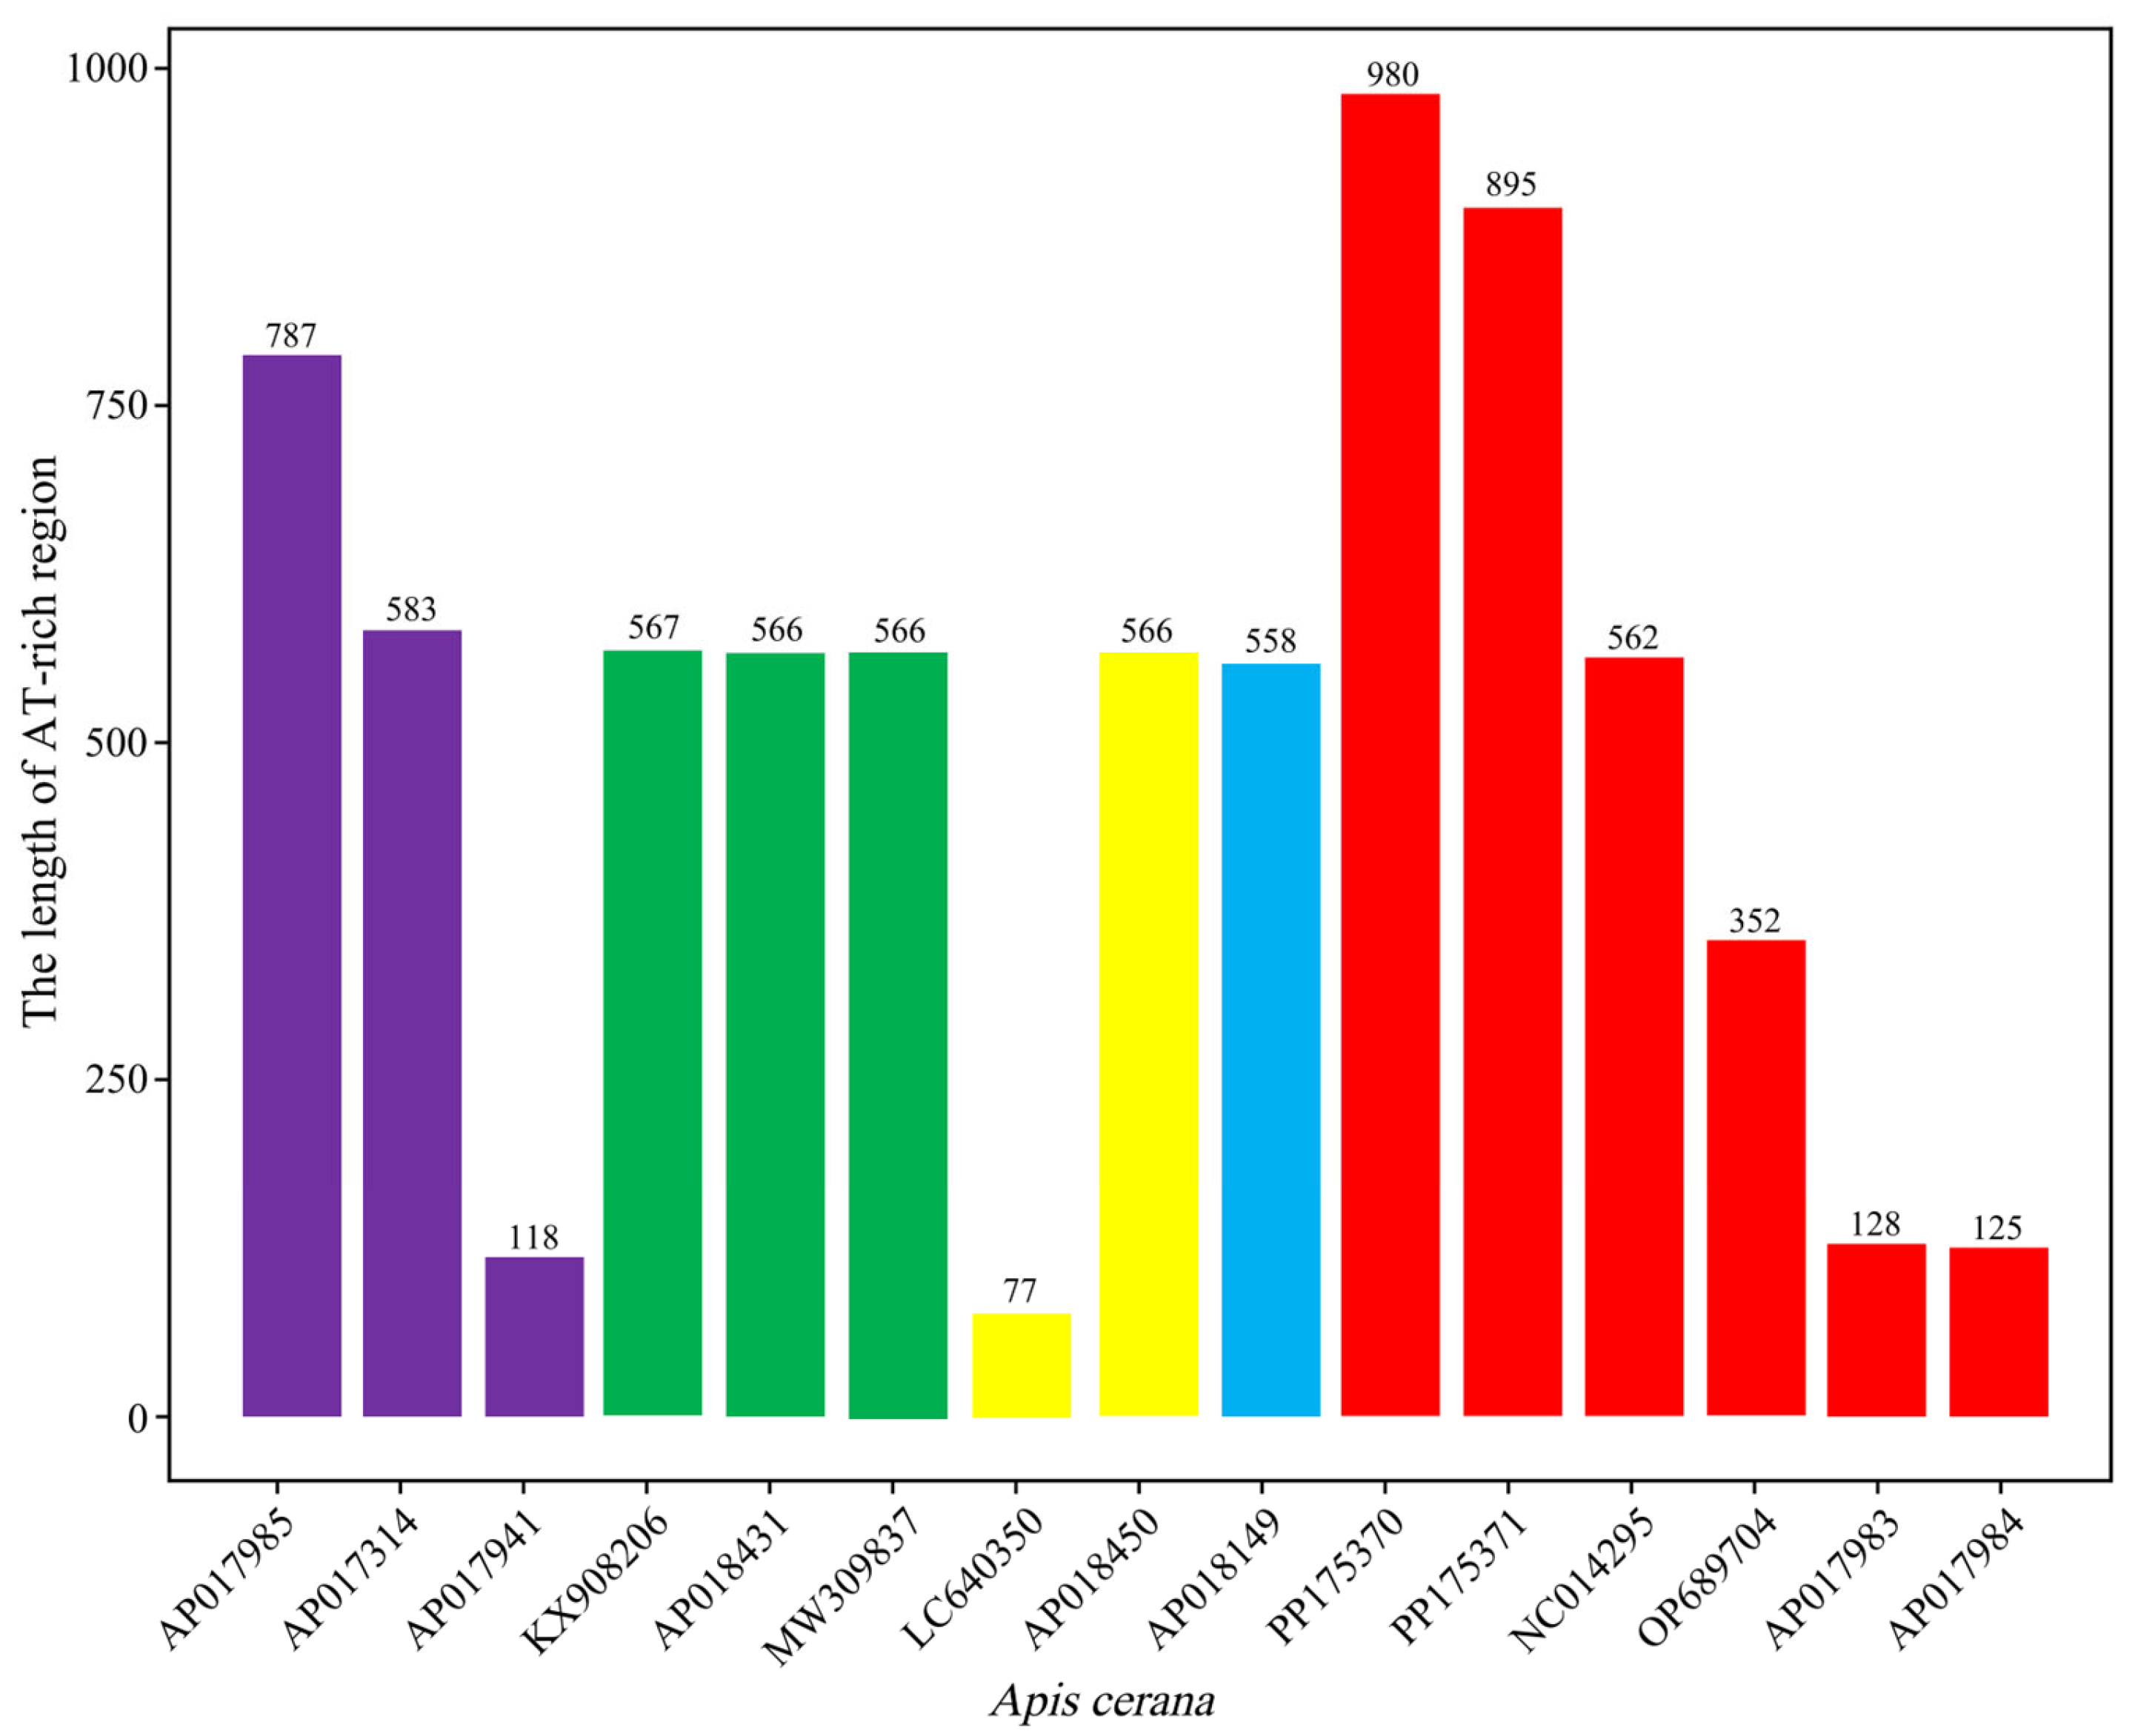
The typical set of 22 tRNAs was scattered throughout each circular, double-stranded DNA molecule, ranging from 60 bp for trnS1 to 78 bp for trnP (Table 2). The total tRNA lengths in DN and YG were 1486 bp and 1487 bp, respectively (Table 4). The tRNA A + T% was 87.28% for DN and 87.35% for YG. Both large ribosomal RNA (lrRNA) and small ribosomal RNA (srRNA) were located on the N chain, and the lengths of the lrRNAs and srRNAs in the two A. cerana groups were 1322 bp and 773 bp, respectively, and the difference in the length of the tRNAs was 1 bp. Therefore, there was no significant difference in the length of tRNAs and rRNAs between DN and YG. According to the AT-skew and GC-skew results, the T and C contents in rRNA and tRNA were greater.

3.4. AT-Rich Region

The AT-rich region in DN and YG was situated on the N strand between the srRNA and trnS1. The A + T% in the two A. cerana groups accounted for 97.43% and 97.45%, respectively, in the AT-rich region. We initially identified 85 bp fragment insertions and deletions in the AT-rich region through sequence comparisons of DN and YG (Table 3). The frequency distribution statistics on the fragment length showed that the length distribution of the AT-rich region in most DN fragments was approximately 900 bp, while the length distribution of most YG fragments was approximately 1000 bp, with a difference of approximately 100 bp. The frequency distribution plot for the length of the AT region confirmed that there was a difference in the length for the two A. cerana groups.
According to the statistics of AT-rich region length of A. cerana from different geographical locations (Figure 4), there were differences in the length of AT-rich region of A. cerana from different regions of Japan, Russia and China, with the largest difference of 710 bp in length in Japan, 489 bp in length in Russia and 855 bp in length in China. The AT-rich region from South Korea was similar in length.

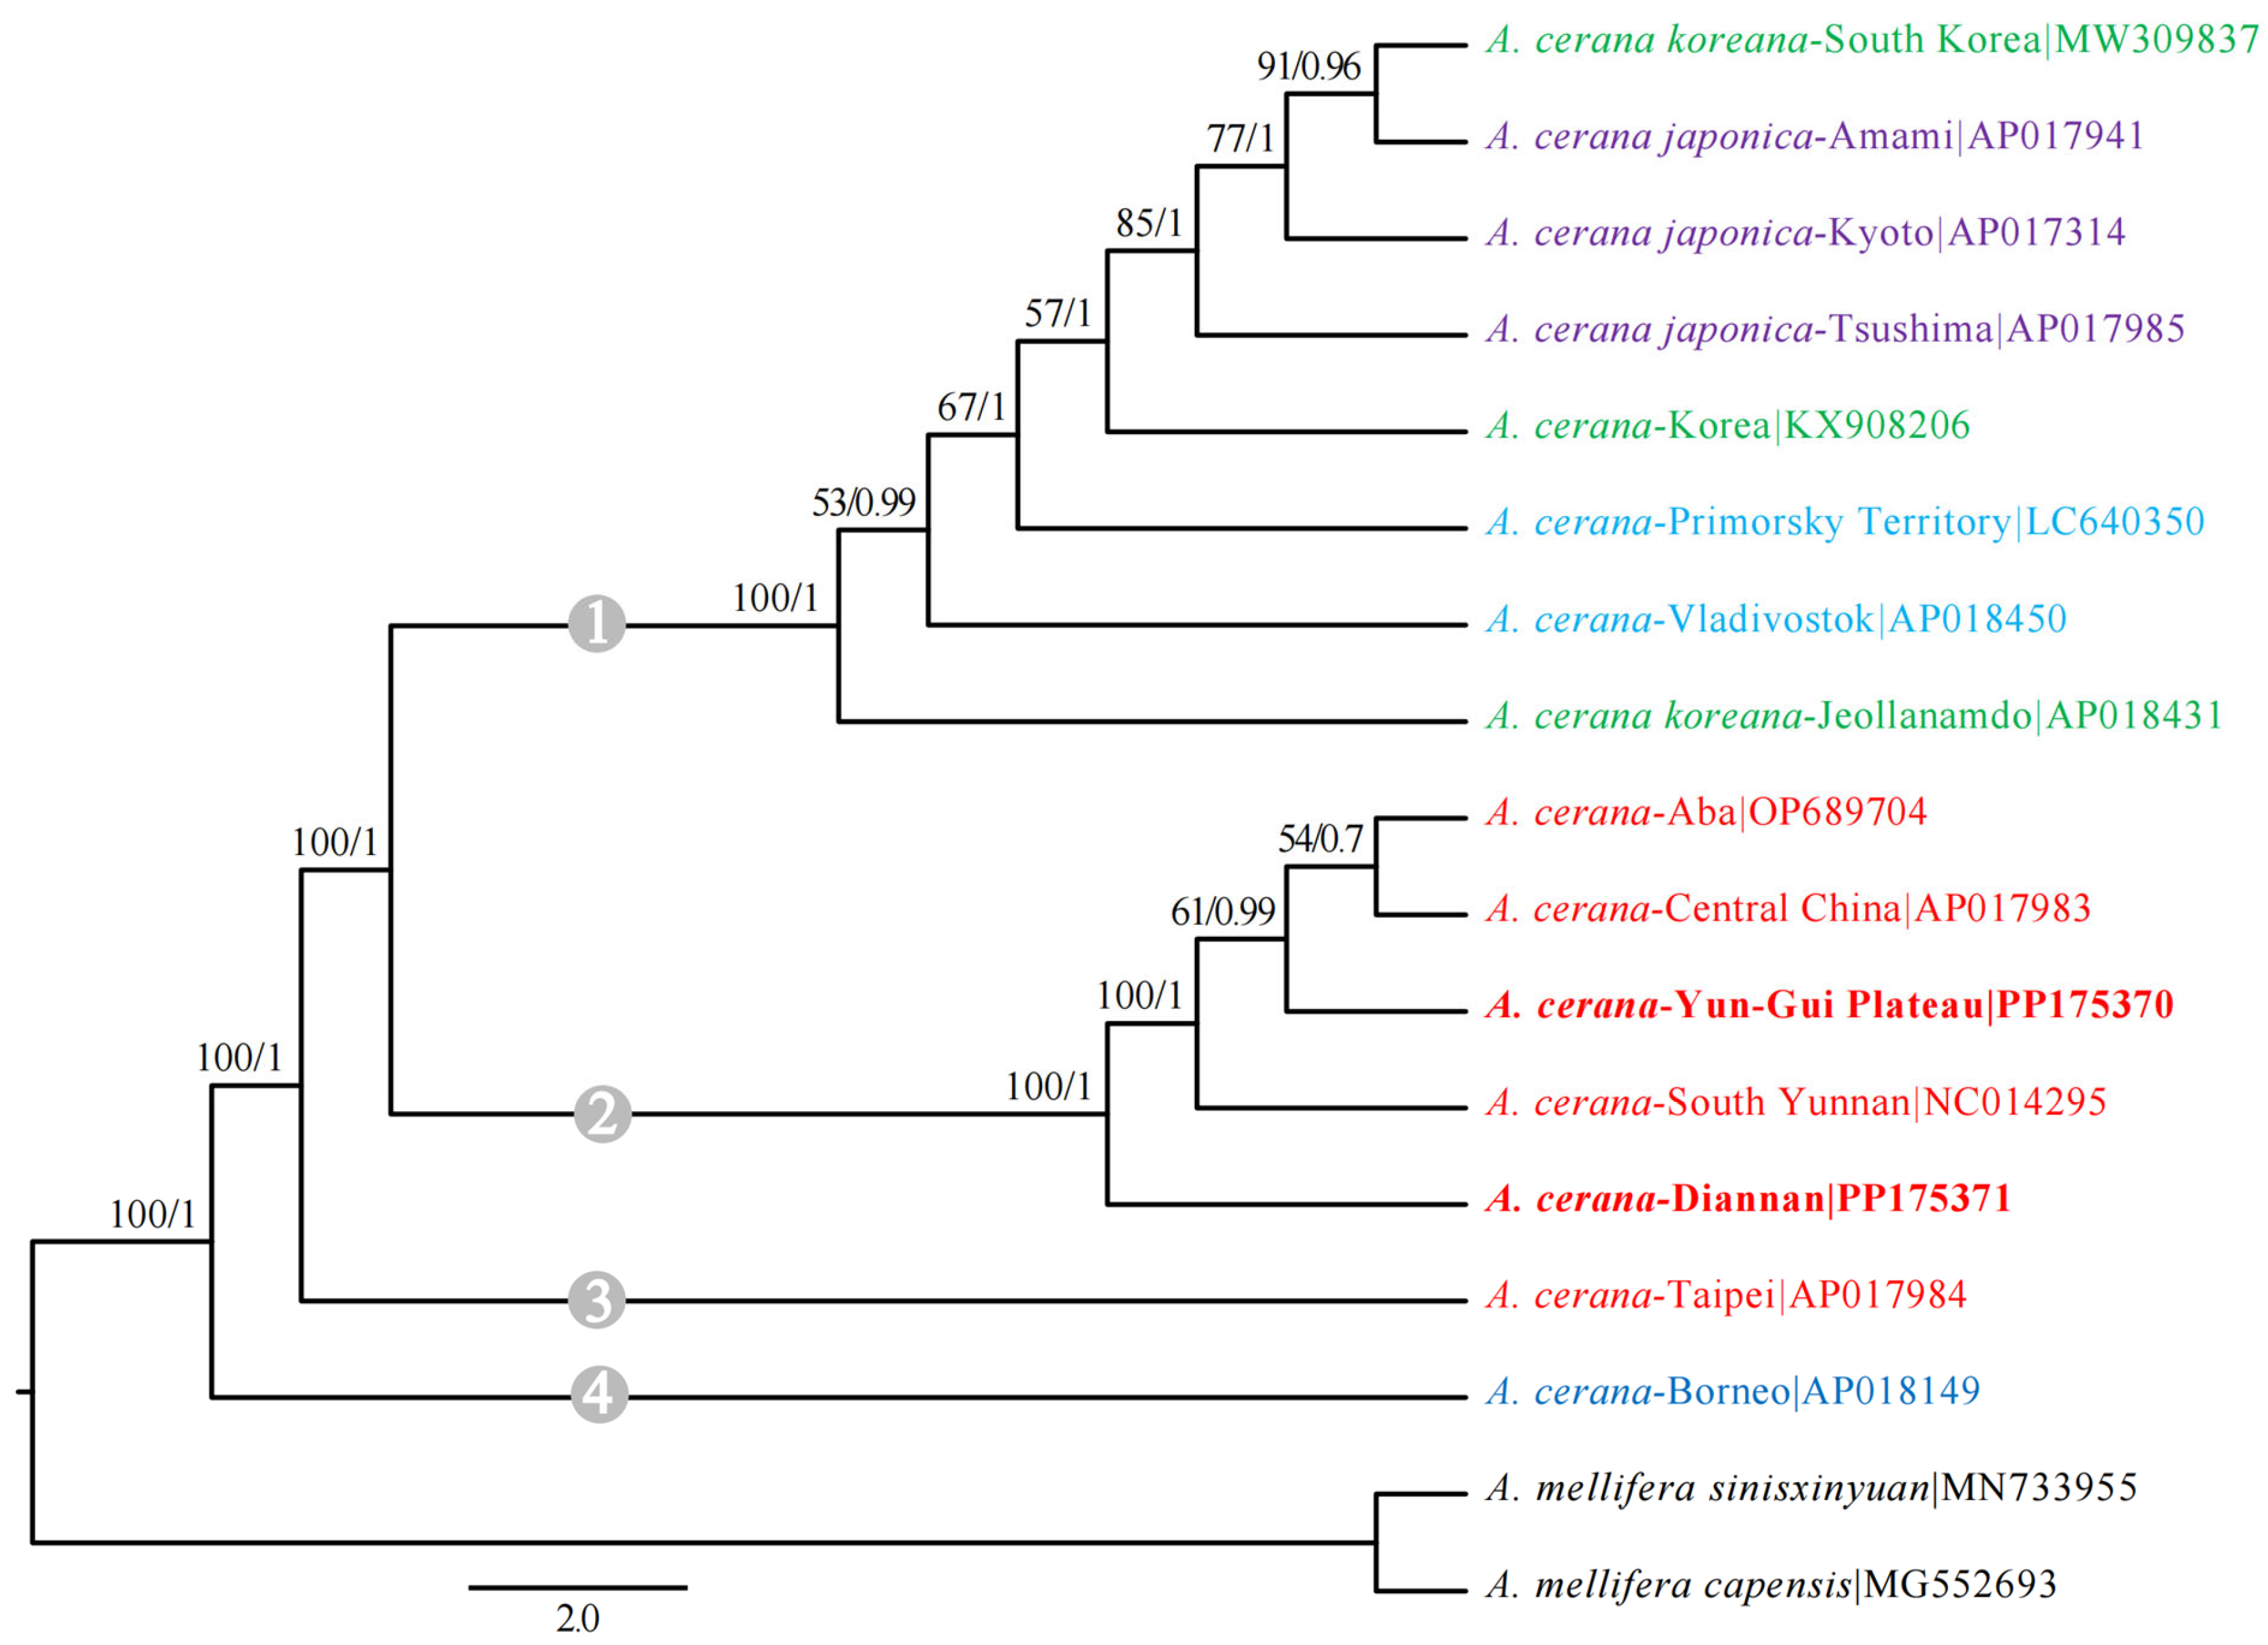
3.5. Phylogenetic Analysis

The results for the evolutionary tree showed that A. cerana was divided into four branches, one from Taiwan and one from Borneo, with high node support. A. cerana from Korea, Japan and Russia formed a single colony, while those from mainland China formed an additional colony (Figure 5). DN and other A. cerana in mainland China represent sister groups. The genetic distance of YG was closer to that of A. cerana-Aba and A. cerana-Central China. The geographical distribution distance between DN and YG was close, but the genetic distance between the two groups of A. cerana was farther than that between YG and A. cerana-Aba and A. cerana-Central China. The results for the evolutionary tree confirmed that there was a difference between DN and YG.

4. Discussion

In light of the destruction of A. cerana populations, it is vital to discover effective genetic markers to distinguish adjacent populations. Mitochondrial DNA is inherited maternally in bees. A single bee can therefore be used to represent an entire colony. Here, we compared the DN and YG mitochondrial genomes to assess the differences among major A. cerana groups. An insertion or deletion was first found in the AT region from different geographic populations.
Advances in sequencing technologies and TGS have enabled researchers to explore the complex structure of these genomes more accurately [38]. In this study, we utilized PacBio HiFi sequencing to assemble the complete mitochondrial genomes of two A. cerana groups, DN and YG. This approach provides an opportunity to explore the genetic diversity of A. cerana in different habitats. The use of HiFi sequencing proved particularly advantageous in addressing challenges associated with the AT-rich region, a non-coding segment characterized by high AT content, low complexity, GC bias, low coverage and issues with homopolymer runs. These challenges have traditionally increased the complexity of genome assembly, especially with short-read sequencing technologies. By generating high-quality long-read data, HiFi sequencing significantly enhanced coverage and assembly accuracy in the AT-rich region, ensuring the reliability of our results and demonstrating the effectiveness of this technology in resolving such regions. According to our results, the full lengths of the DN and YG mitochondrial genomes were 16,214 bp and 16,304 bp, respectively. This finding aligns with previous reports indicating that animal mitochondria typically range between 10 and 20 kb in length [39]. Both mitochondrial genomes in the present study contained 37 common genes (13 PCGs, 22 tRNAs and 2 rRNAs) and exhibited similar AT preferences and codon usage frequencies, consistent with the findings for A. cerana japonica [35]. Mitochondrial genome rearrangement has been previously reported in lepidoptera, but this study of the two A. cerana groups showed no rearrangement, which is considered to indicate the ground pattern of insect mitochondrial genomes [40,41]. Whether sequences tend to be A-encoded or T-encoded depends on the role they play. Strand asymmetry, also known as strand compositional bias, is typically indicated by the AT and the GC skews [42]. The two A. cerana groups in the present study exhibited a reversal of strand asymmetry on the entire majority strand, possibly due to the inversion of the replication origin situated in the control region [43]. rRNAs are commonly used to classify species [44]. A comparison of the tRNA and rRNA sequences from DN and YG revealed that both regions were approximately the same length, with a minor difference in A + T content. Previous studies have shown that in insect mitochondrial genomes, AT-rich regions typically regulate gene replication and transcription. The lengths of these sequences vary significantly among insects and even within genera [45,46]. Our results support this concept.
We conducted codon preference analysis on 13 PCGs to identify variations, with the aim of identifying differences in differentiation between DN and YG at the gene level by examining codon frequencies. The eukaryotic genome contains 64 codons that encode 20 different amino acids and 3 stop codons [47]. All amino acids, except Met and Trp, are encoded by two to six synonymous codons [48]. The preference for the utilization of these synonymous codons is determined by several factors, including the abundance of tRNAs, the mutational bias of the gene chain, the gene expression level, the gene length and the gene expression level [49]. The results for the RSCU analysis (Figure 3) revealed variations in codon usage frequency between the two A. cerana groups, likely attributed to varying levels of differentiation. We found that A. cerana exhibits a preference for synonymous codons ending in A or T across various amino acids. This trend is consistent with findings in other insect species. For example, a study on Bactericera cockerelli reported a similar codon usage pattern, where codons ending in U and A were most frequently used, attributed to the high A + T content in its mitochondrial genome [44]. The potential reasons for RSCU bias have been examined in the genomes of various living organisms, such as A. laboriosa, scuticociliates, sesame and astrovirus [10,50,51,52]. Geographical distance and geographical location were correlated with the genetic differentiation of A. cerana. This is attributed to the distinct living environments of DN and YG. The sampling sites for DN and YG in this study were, respectively, located in Cangyuan County in the southern part and Zhan Yi District in the eastern part of Yunnan Province. These two locations exhibit distinct environmental climates: Cangyuan County features a subtropical monsoon climate, while Zhan Yi District has a subtropical humid monsoon climate [53].
The AT-rich region is well known for its ability to initiate replication in both vertebrates and invertebrates, and a reduced G + C content is one of the most prominent features of this region [39]. The mitochondrial genome insertion and deletion regions were analyzed in DN and YG. Our findings revealed that the AT-rich region had the highest degree of variation in terms of nucleic acid sequence and length. There were not only interspecific differences in copy number but also variations among individuals within the same species. The reliability of copy number variations for species identification has been demonstrated in previous studies [54,55]. The consistency in the phylogenetic topology of most clades indicates that AT-rich regions generally evolve under similar evolutionary pressures as mitochondrial PCGs or mitogenomes [56]. We speculate that the insertion and deletion of sequences in the AT-rich region of A. cerana from the DN and YG provide evidence for subspecies classification. This region is highly variable and lacks pairwise sites that can be used for phylogenetic analysis, making sequence alignment difficult. The statistical comparison of AT-rich region length (Figure 4) showed that the length of AT-rich region in different environments in the same country was also different, which might be related to different living environments. The significant variability observed in the Chinese, Russian and Japanese populations, in particular, suggests that honeybee populations in these regions may have experienced stronger ecological selection pressures, leading to genetic differentiation. Previous studies on the AT-rich region have shown that the method for species classification on the basis of this region is feasible [46]. We identified several elements typically found in the AT-rich regions of most insects, including the TATA motif, which likely plays a role in initiating genome replication. Although the AT-rich region is highly variable, its downstream conserved regions can be partially aligned to reflect phylogenetic positions altered by evolutionary forces. The variations observed in the AT-rich region may have functional significance, potentially influencing mitochondrial DNA replication and transcriptional activity. As this region often contains replication origins, such variations may affect replication efficiency or regulatory function [57]. In our study, we found structural and sequence differences in the AT-rich region between the two populations, which could alter secondary DNA structures and affect the stability of replication and transcription.
The mitochondrial phylogeny suggests that the current population structure of A. cerana on the Chinese mainland is the result of multiple differentiations, potentially shaped by complex historical and environmental factors. The phylogenetic tree we constructed indicates that A. cerana strains from Taiwan and Borneo are distinct, with YG being a sister group to A. cerana-Aba and A. cerana-Central China. Despite these phylogenetic differentiations, we observed no significant correlation between genetic diversification and geographical distance. This pattern suggests that historical events, such as glacial cycles or population isolation during climatic shifts, may have played a role in shaping the current genetic structure. Previous studies on honeybees across various regions, including analyses of morphological differences between DN and YG, indicate that the Tropic of Cancer serves as a geographic boundary [58], further supporting the idea that physical barriers rather than geographic distance alone are a major driver of population divergence in A. cerana [14]. In contrast, environmental factors, particularly altitude, have been shown to influence genetic differentiation in honeybee populations [59,60], potentially through adaptive mechanisms, such as cold resistance and metabolic efficiency at high altitudes [61]. Genomic incompatibilities, such as structural variations and local adaptations, could further reinforce these patterns, highlighting the role of specific environmental pressures. Additionally, we hypothesize that the genetic uniqueness and basal phylogenetic position of the Taiwan island subspecies could be explained by a relatively long divergence time due to marine isolation, which has limited gene flow with mainland populations. Alternatively, accelerated urbanization and the introduction of alien honeybee species [62,63] may have influenced the genetic structure, particularly by promoting hybridization or population bottlenecks. Further comparison with historical samples and additional studies focusing on environmental and ecological variables will be necessary to disentangle the historical and recent anthropogenic impacts on genetic distance patterns in A. cerana.
In contrast to previous studies that provided only limited information about A. cerana and a few studies that reported comparative analyses of A. cerana at the genetic level, the mitochondrial genome-wide analysis of A. cerana in our study offers a more detailed genetic structure of honeybees. Comparative genome-wide analyses of DN and YG revealed intraspecific genetic evolutionary differences among the various A. cerana groups. Moreover, the differences and uniqueness of the DN and YG mitochondrial genomes provide insights into A. cerana species differentiation. This study lays an important foundation for the husbandry and conservation of A. cerana in various regions. In future, various A. cerana taxa can be distinguished based on structural and genetic evolutionary variances. Targeted conservation measures could include protecting the natural habitats of different A. cerana groups to preserve their unique genetic traits, establishing a genetic diversity conservation bank and prioritizing populations with high genetic diversity. Gene flow between populations in neighboring regions could also be promoted where appropriate to enhance adaptability and prevent inbreeding. Such targeted species protection measures can then be implemented according to the distinct groups to increase A. cerana population sizes and preserve its genetic diversity. This study also has several shortcomings. Due to the limited number of A. cerana samples collected, morphological analysis could not be performed in this study. More in-depth studies on species differentiation can be conducted in the future by combining morphological and genomic studies. For systemic evolution, the maximum likelihood analysis and Bayesian inference analysis have certain limitations, such as computational demands and sensitivity to model assumptions. Future studies could consider complementary approaches, such as coalescent-based species tree methods or phylogenetic network analyses, to provide a more comprehensive view of population structure.

5. Conclusions

In conclusion, we utilized PacBio HiFi sequencing technology to assemble and annotate the DN and YG mitochondrial genomes, resulting in the assembly of two high-quality organelle genomes. By comparing the mitochondrial genomes, we found that A. cerana exhibits genetic diversity at the mitochondrial genomic level in various environments. The difference in the insertion or deletion of long fragments in AT-rich regions between the A. cerana groups serves as the basis for species differentiation. The results for the phylogenetic tree indicated differences between the two closely related A. cerana groups, DN and YG. This study expands the classification of A. cerana. It is hoped that more specimens can be collected to conduct a more comprehensive and systematic study of honeybees. The morphological data and gene fragments can be utilized for combined analyses in future.

Author Contributions

Conceptualization, Y.C. and J.H.; Methodology, R.S., Z.G., G.D. and L.D.; Software, Y.C., R.S., R.Z. and L.D.; Experiments, R.Z., Z.G. and L.D.; Data Analysis, Y.C., R.S., R.Z. and J.H.; Writing—Original Draft Preparation, Y.C. and R.S.; Writing—Review and Editing, J.H. and G.D.; Supervision, G.D., L.D. and Z.G. All authors have read and agreed to the published version of the manuscript.

Funding

This study was supported in part by the National Key R&D Program of China (2022YFD1600205), the Science and Technology Plan of Yunnan Province Project (2022–2024), the China Agriculture Research System-Bee (CARS-44-KXJ5) and the Agricultural Science and Technology Innovation Program, Chinese Academy of Agricultural Sciences (CAAS-ASTIP-2024-IAR).

Data Availability Statement

The datasets generated and analyzed in the current study are available in the National Center for Biotechnology Information (NCBI) repository under the accession numbers PP175370.1 and PP175371.1.

Acknowledgments

We would like to thank Yuxian Chen for her help in figure revision.

Conflicts of Interest

The authors declare no conflicts of interest.

References

  1. Lan, L.; Shi, P.; Song, H.L.; Tang, X.Y.; Zhou, J.Y.; Yang, J.D.; Yang, M.X.; Xu, J.S. De Novo genome assembly of Chinese plateau honeybee unravels intraspecies genetic diversity in the eastern honeybee, Apis cerana. Insects 2021, 12, 891. [Google Scholar] [CrossRef] [PubMed]
  2. Ji, C.C.; Shi, W.; Tang, J.; Gao, J.L.; Liu, F.; Shan, J.Q.; Chen, X.; Chen, C. Morphometrical analyses revealed high diversity of the eastern honey bee (Apis cerana) in mountains and islands in China. J. Apic. Res. 2023, 62, 647–655. [Google Scholar] [CrossRef]
  3. Li, G.L.; Zhao, H.; Guo, D.Z.; Liu, Z.G.; Wang, H.F.; Sun, Q.H.; Liu, Q.X.; Xu, B.H.; Guo, X.Q. Distinct molecular impact patterns of abamectin on Apis mellifera ligustica and Apis cerana cerana. Ecotoxicol. Environ. Saf. 2022, 232, 113242. [Google Scholar] [CrossRef] [PubMed]
  4. Matias, D.M.S.; Leventon, J.; Rau, A.; Borgemeister, C.; von Wehrden, H. A review of ecosystem service benefits from wild bees across social contexts. Ambio 2017, 46, 456–467. [Google Scholar] [CrossRef]
  5. Li, Y.C.; Chao, T.L.; Fan, Y.H.; Lou, D.L.; Wang, G.Z. Population genomics and morphological features underlying the adaptive evolution of the eastern honey bee (Apis cerana). BMC Genom. 2019, 20, 869. [Google Scholar]
  6. Qiu, L.F.; Dong, J.X.; Li, X.G.; Parey, S.H.; Tan, K.; Orr, M.; Majeed, A.; Zhang, X.; Luo, S.Q.; Zhou, X.G.; et al. Defining honeybee subspecies in an evolutionary context warrants strategized conservation. Zool. Res. 2023, 44, 483–493. [Google Scholar] [CrossRef]
  7. Wang, Z.; Chen, W.F.; Wang, H.F.; Xv, B.H.; Liu, Z.G. Research progress on molecular markers in honeybee. J. Bee 2022, 42, 33–37. [Google Scholar]
  8. Xu, L.Q.; Yang, J.D.; Lai, K. The Complete Mitochondrial Genome of the Cavity-Nesting Honeybee, Apis cerana abansis (Insecta: Hymenoptera: Apidae). Cytol. Genet. 2024, 58, 136–141. [Google Scholar] [CrossRef]
  9. Dowling, D.K.; Wolff, J.N.; Cooley, L. Evolutionary genetics of the mitochondrial genome: Insights from Drosophila. Genetics 2023, 224, iyad036. [Google Scholar] [CrossRef]
  10. Tang, X.Y.; Yao, Y.X.; Li, Y.H.; Song, H.L.; Luo, R.; Shi, P.; Zhou, Z.Y.; Xu, J.S. Comparison of the mitochondrial genomes of three geographical strains of Apis laboriosa indicates high genetic diversity in the black giant honeybee (Hymenoptera: Apidae). Ecol. Evol. 2023, 13, e9782. [Google Scholar] [CrossRef]
  11. Yu, Y.L.; Zhou, S.J.; Zhu, X.J.; Xu, X.J.; Wang, W.F.; Zha, L.; Wang, P.; Wang, J.W.; Lai, K.; Wang, S.H.; et al. Genetic differentiation of eastern honey bee (Apis cerana) populations across Qinghai-Tibet plateau-valley landforms. Front. Genet. 2019, 10, 483. [Google Scholar] [CrossRef] [PubMed]
  12. Wang, Y.; Zhao, Y.; Bollas, A.; Wang, Y.; Au, K.F. Nanopore sequencing technology, bioinformatics and applications. Nat. Biotechnol. 2021, 39, 1348–1365. [Google Scholar] [CrossRef] [PubMed]
  13. Chen, C.; Liu, Z.G.; Pan, Q.; Chen, X.; Wang, H.H.; Guo, H.K.; Liu, S.D.; Lu, H.F.; Tian, S.L.; Li, R.Q.; et al. Genomic analyses reveal demographic history and temperate adaptation of the newly discovered honey bee subspecies Apis mellifera sinisxinyuan n. ssp. Mol. Biol. Evol. 2016, 33, 1337–1348. [Google Scholar] [CrossRef] [PubMed]
  14. Chen, C.; Wang, H.H.; Liu, Z.G.; Chen, X.; Tang, J.; Meng, F.M.; Shi, W. Population genomics provide insights into the evolution and adaptation of the eastern honey bee (Apis cerana). Mol. Biol. Evol. 2018, 35, 2260–2271. [Google Scholar] [CrossRef]
  15. Eimanifar, A.; Kimball, R.T.; Braun, E.L.; Ellis, J.D. Mitochondrial genome diversity and population structure of two western honey bee subspecies in the Republic of South Africa. Sci. Rep. 2018, 8, 1333. [Google Scholar] [CrossRef]
  16. Ilyasov, R.A.; Park, J.; Takahashi, J.; Kwon, H.W. Phylogenetic Uniqueness of Honeybee Apis cerana from the Korean Peninsula Inferred from The Mitochondrial, Nuclear, and Morphological Data. J. Apic. Sci. 2018, 62, 189–214. [Google Scholar] [CrossRef]
  17. Ilyasov, R.A.; Youn, H.G.; Lee, M.; Kim, K.W.; Proshchalykin, M.Y.; Lelej, A.S.; Takahashi, J.; Kwon, H.W. Phylogenetic relationships of Russian Far-East Apis cerana with other North Asian populations. J. Apic. Sci. 2019, 63, 289–314. [Google Scholar] [CrossRef]
  18. Fan, X.Y.; Tang, D.; Liao, Y.H.; Li, P.D.; Zhang, Y.; Wang, M.X.; Liang, F.; Wang, X.; Gao, Y.; Wen, L.; et al. Single-cell RNA-seq analysis of mouse preimplantation embryos by third-generation sequencing. PLoS Biol. 2020, 18, e3001017. [Google Scholar] [CrossRef]
  19. He, X.J.; Barron, A.B.; Yang, L.; Chen, H.; He, Y.Z.; Zhang, L.Z.; Huang, Q.; Wang, Z.L.; Wu, X.B.; Yan, W.Y.; et al. Extent and complexity of RNA processing in honey bee queen and worker caste development. iScience 2022, 25, 104301. [Google Scholar] [CrossRef]
  20. Cheng, H.Y.; Concepcion, G.T.; Feng, X.W.; Zhang, H.W.; Li, H. Haplotype-resolved de novo assembly using phased assembly graphs with hifiasm. Nat. Methods 2021, 18, 170–175. [Google Scholar] [CrossRef]
  21. Cheng, H.Y.; Jarvis, E.D.; Fedrigo, O.; Koepfli, K.P.; Urban, L.; Gemmell, N.J.; Li, H. Haplotype-resolved assembly of diploid genomes without parental data. Nat. Biotechnol. 2022, 40, 1332–1335. [Google Scholar] [CrossRef] [PubMed]
  22. Bernt, M.; Donath, A.; Jühling, F.; Externbrink, F.; Florentz, C.; Fritzsch, G.; Pütz, J.; Middendorf, M.; Stadler, P.F. MITOS: Improved de novo metazoan mitochondrial genome annotation. Mol. Phylogenetics Evol. 2013, 69, 313–319. [Google Scholar] [CrossRef] [PubMed]
  23. Tillich, M.; Lehwark, P.; Pellizzer, T.; Ulbricht-Jones, E.S.; Fischer, A.; Bock, R.; Greiner, S. GeSeq-versatile and accurate annotation of organelle genomes. Nucleic Acids Res. 2017, 45, W6–W11. [Google Scholar] [CrossRef]
  24. Zheng, S.Y.; Poczai, P.; Hyvönen, J.; Tang, J.; Amiryousefi, A. Chloroplot: An online program for the versatile plotting of organelle genomes. Front. Genet. 2020, 11, 576124. [Google Scholar] [CrossRef]
  25. Hall, T.A. BioEdit: A user-friendly biological sequence alignment editor and analysis program for Windows 95/98/NT. Nucleic Acids Symp. Ser. 1999, 41, 95–98. [Google Scholar]
  26. Tamura, K.; Stecher, G.; Kumar, S. MEGA11: Molecular evolutionary genetics analysis version 11. Mol. Biol. Evol. 2021, 38, 3022–3027. [Google Scholar] [CrossRef]
  27. Li, H. Minimap2: Pairwise alignment for nucleotide sequences. Bioinformatics 2018, 34, 3094–3100. [Google Scholar] [CrossRef]
  28. Xiang, C.Y.; Gao, F.; Jakovlić, I.; Lei, H.P.; Hu, Y.; Zhang, H.; Zou, H.; Wang, G.T.; Zhang, D. Using PhyloSuite for molecular phylogeny and tree-based analyses. iMeta 2023, 2, 2–87. [Google Scholar] [CrossRef]
  29. Zhang, D.; Gao, F.L.; Jakovlic, I.; Zou, H.; Zhang, J.; Li, W.X.; Wang, G.T. PhyloSuite: An integrated and scalable desktop platform for streamlined molecular sequence data management and evolutionary phylogenetics studies. Mol. Ecol. Resour. 2020, 20, 348–355. [Google Scholar] [CrossRef]
  30. Rozewicki, J.; Li, S.; Amada, K.M.; Standley, D.M.; Katoh, K. MAFFT-DASH: Integrated protein sequence and structural alignment. Nucleic. Acids. Res. 2019, 47, W5–W10. [Google Scholar] [CrossRef]
  31. Kalyaanamoorthy, S.; Minh, B.Q.; Wong, T.K.F.; von Haeseler, A.; Jermiin, L.S. ModelFinder: Fast model selection for accurate phylogenetic estimates. Nat. Methods 2017, 14, 587–589. [Google Scholar] [CrossRef]
  32. Ronquist, F.; Teslenko, M.; van der Mark, P.; Ayres, D.L.; Darling, A.; Hohna, S.; Larget, B.; Liu, L.; Suchard, M.A.; Huelsenbeck, J.P. MrBayes 3.2: Efficient Bayesian phylogenetic inference and model choice across a large model space. Syst. Biol. 2012, 61, 539–542. [Google Scholar] [CrossRef] [PubMed]
  33. Nguyen, L.T.; Schmidt, H.A.; von Haeseler, A.; Minh, B.Q. IQ-TREE: A fast and effective stochastic algorithm for estimating maximum-likelihood phylogenies. Mol. Biol. Evol. 2015, 32, 268–274. [Google Scholar] [CrossRef] [PubMed]
  34. Okuyama, H.; Wakamiya, T.; Fujiwara, A.; Washitani, I.; Takahashi, J.I. Complete mitochondrial genome of the honeybee Apis cerana native to two remote islands in Japan. Conserv. Genet. Resour. 2017, 9, 557–560. [Google Scholar] [CrossRef]
  35. Takahashi, J.; Wakamiya, T.; Kiyoshi, T.; Uchiyama, H.; Yajima, S.; Kimura, K.; Nomura, T. The complete mitochondrial genome of the Japanese honeybee, Apis cerana japonica (Insecta: Hymenoptera: Apidae). Mitochondrial DNA Part B Resour. 2016, 1, 156–157. [Google Scholar] [CrossRef] [PubMed]
  36. Okuyama, H.; Tingek, S.; Takahashi, J. The complete mitochondrial genome of the cavity-nesting honeybee, Apis cerana (Insecta: Hymenoptera: Apidae) from Borneo. Mitochondrial DNA Part B Resour. 2017, 2, 475–476. [Google Scholar] [CrossRef] [PubMed]
  37. Tan, H.W.; Liu, G.H.; Dong, X.; Lin, R.Q.; Song, H.Q.; Huang, S.Y.; Yuan, Z.G.; Zhao, G.H.; Zhu, X.Q. The complete mitochondrial genome of the Asiatic cavity-nesting honeybee Apis cerana (Hymenoptera: Apidae). PLoS ONE 2011, 6, e23008. [Google Scholar] [CrossRef] [PubMed]
  38. Dong, S.S.; Zhao, C.X.; Chen, F.; Liu, Y.H.; Zhang, S.Z.; Wu, H.; Zhang, L.S.; Liu, Y. The complete mitochondrial genome of the early flowering plant Nymphaea colorata is highly repetitive with low recombination. BMC Genom. 2018, 19, 614. [Google Scholar] [CrossRef]
  39. Wang, X.Y.; Li, D.F.; Li, H.; Wang, J.J.; Li, Y.J.; Dai, R.H. Comparison of mitogenomes of three Petalocephala species (Hemiptera: Cicadellidae: Ledrinae) and their phylogenetic analysis. Arch. Insect Biochem. Physiol. 2022, 111, e21902. [Google Scholar] [CrossRef]
  40. Wang, Y.Y.; Liu, X.Y.; Yang, D. The first mitochondrial genome for caddisfly (insecta: Trichoptera) with phylogenetic implications. Int. J. Biol. Sci. 2013, 10, 53–63. [Google Scholar] [CrossRef]
  41. Chen, Z.T.; Du, Y.Z. Rearrangement of mitochondrial genome in insects. J. Environ. Entomol. 2016, 38, 843–851. [Google Scholar]
  42. Perna, N.T.; Kocher, T.D. Patterns of nucleotide composition at fourfold degenerate sites of animal mitochondrial genomes. J. Mol. Evol. 1995, 41, 353–358. [Google Scholar] [CrossRef] [PubMed]
  43. Wei, S.J.; Shi, M.; Sharkey, M.J.; van Achterberg, C.; Chen, X.X. Comparative mitogenomics of Braconidae (Insecta: Hymenoptera) and the phylogenetic utility of mitochondrial genomes with special reference to Holometabolous insects. BMC Genom. 2010, 11, 371. [Google Scholar] [CrossRef] [PubMed]
  44. Wu, F.N.; Cen, Y.J.; Wallis, C.M.; Trumble, J.T.; Prager, S.; Yokomi, R.; Zheng, Z.; Deng, X.L.; Chen, J.C.; Liang, G.W.; et al. The complete mitochondrial genome sequence of Bactericera cockerelli and comparison with three other Psylloidea species. PLoS ONE 2016, 11, e0155318. [Google Scholar] [CrossRef] [PubMed]
  45. Cao, M.F.; Tang, L.; Chen, J.; Zhang, X.Y.; Easy, R.H.; You, P. The mitogenome of freshwater loach Homatula laxiclathra (Teleostei: Nemacheilidae) with phylogenetic analysis of Nemacheilidae. Ecol. Evol. 2020, 10, 5990–6000. [Google Scholar] [CrossRef]
  46. Zhang, C.H.; Wang, Y.L.; Chen, H.W.; Huang, J. Comparative mitochondrial genomes between the genera amiota and phortica (Diptera: Drosophilidae) with evolutionary insights into D-Loop sequence variability. Genes 2023, 14, 1240. [Google Scholar] [CrossRef]
  47. Fredens, J.; Wang, K.; de la Torre, D.; Funke, L.F.H.; Robertson, W.E.; Christova, Y.; Chia, T.; Schmied, W.H.; Dunkelmann, D.L.; Beránek, V.; et al. Total synthesis of Escherichia coli with a recoded genome. Nature 2019, 569, 514–518. [Google Scholar] [CrossRef]
  48. Komar, A.A. A code within a code: How codons fine-tune protein folding in the cell. Biochemistry 2021, 86, 976–991. [Google Scholar] [CrossRef]
  49. Peng, G.X.; Mao, X.L.; Cao, Y.; Yao, S.Y.; Li, Q.R.; Chen, X.; Wang, E.D.; Zhou, X.L. RNA granule-clustered mitochondrial aminoacyl-tRNA synthetases form multiple complexes with the potential to fine-tune tRNA aminoacylation. Nucleic Acids Res. 2022, 50, 12951–12968. [Google Scholar] [CrossRef]
  50. Andargie, M.; Congyi, Z. Genome-wide analysis of codon usage in sesame (Sesamum indicum L.). Heliyon 2022, 8, e08687. [Google Scholar] [CrossRef]
  51. Huang, Y.X.; Wang, S.; Gao, Y.Q.; Chen, J.H.; Wang, X.L.; Li, R.J. Comparison of mitochondrial genome and development of specific PCR primers for identifying two scuticociliates, Pseudocohnilembus persalinus and Uronema marinum. Parasites Vectors 2021, 14, 318. [Google Scholar] [CrossRef] [PubMed]
  52. Wu, H.G.; Bao, Z.Y.; Mou, C.X.; Chen, Z.H.; Zhao, J.W. Comprehensive analysis of codon usage on porcine astrovirus. Viruses 2020, 12, 991. [Google Scholar] [CrossRef] [PubMed]
  53. Xiao, Y. Comparative analysis of resistance of forest resources to rain and snow freezing disasters in Yunnan Province. J. Green Sci. Technol. 2019, 223–226, 236. [Google Scholar]
  54. Hu, Q.Q.; Pan, Y.Q.; Xia, H.L.; Yu, K.X.; Yao, Y.; Guan, F. Species identification of caviar based on multiple DNA barcoding. Molecules 2023, 28, 5046. [Google Scholar] [CrossRef]
  55. Suryawanshi, V.; Talke, I.N.; Weber, M.; Eils, R.; Brors, B.; Clemens, S.; Krämer, U. Between-species differences in gene copy number are enriched among functions critical for adaptive evolution in Arabidopsis halleri. BMC Genom. 2016, 17, 1034. [Google Scholar] [CrossRef]
  56. Liu, J.; Bu, C.P.; Wipfler, B.; Liang, A.P. Comparative analysis of the mitochondrial genomes of Callitettixini Spittlebugs (Hemiptera: Cercopidae) confirms the overall high evolutionary speed of the AT-rich region but reveals the presence of short conservative elements at the tribal level. PLoS ONE 2014, 9, e109140. [Google Scholar] [CrossRef]
  57. Rajewska, M.; Kowalczyk, L.; Konopa, G.; Konieczny, I. Specific mutations within the AT-rich region of a plasmid replication origin affect either origin opening or helicase loading. Proc. Natl. Acad. Sci. USA 2008, 105, 11134–11139. [Google Scholar] [CrossRef]
  58. Zhang, Z.Y.; Luo, W.T.; Song, W.F.; Liang, C.; Zhang, X.W. Morphology of Apis cerana in the Yunnan-Guizhou plateau and bees in south of Yunnan. Apic. China 2014, 65, 12–15. [Google Scholar]
  59. Kitnya, N.; Prabhudev, M.V.; Bhatta, C.P.; Pham, T.H.; Nidup, T.; Megu, K.; Chakravorty, J.; Brockmann, A.; Otis, G.W. Geographical distribution of the giant honey bee Apis laboriosa Smith, 1871 (Hymenoptera, Apidae). Zookeys 2020, 951, 67–81. [Google Scholar] [CrossRef]
  60. Tang, X.Y.; Song, H.L.; Shi, P.; Zhang, X.Y.; Tang, Z.H.; Wang, W.F.; Zha, L.; Chen, X.L.; Zhou, Z.Y.; Xv, J.S. Whole-genome resequencing reveals the genetic diversity and adaptive evolution of Apis cerana (Hymenoptera: Apidae) on the eastern and southeastern edges of the Qinghai-Tibet Plateau. Acta Entomol. Sin. 2022, 65, 638–647. [Google Scholar]
  61. Liu, N.N.; Liu, H.M.; Ju, Y.; Li, X.G.; Li, Y.; Wang, T.J.; He, J.M.; Niu, Q.S.; Xing, X.M. Geometric morphology and population genomics provide insights into the adaptive evolution of Apis cerana in Changbai Mountain. BMC Genom. 2022, 23, 64. [Google Scholar]
  62. Fang, F.; Chen, X.S.; Lv, J.; Shi, X.Y.; Feng, X.J.; Wang, Z.; Li, X. Population structure and genetic diversity of Chinese Honeybee (Apis cerana cerana) in central China. Genes 2022, 13, 1007. [Google Scholar] [CrossRef] [PubMed]
  63. Tan, H.W.; Naeem, M.; Ali, H.; Shakeel, M.; Kuang, H.O.; Zhang, Z.; Sun, C. Genome sequence of the Asian honeybee in Pakistan sheds light on its phylogenetic relationship with other honeybees. Insects 2021, 12, 652. [Google Scholar] [CrossRef] [PubMed]
Figure 1. Sampling site information on DN and YG.
Insects 15 00960 g001
Figure 2. Graphical maps of the mitochondrial genomes of DN (A) and YG (B). The inside circles show the G + C content.
Insects 15 00960 g002
Figure 3. Codon bias statistics for 13 protein-coding genes of DN and YG.
Insects 15 00960 g003
Figure 4. The length statistics of the AT-rich region of A. cerana. Purple represents A. cerana from Japan; green represents A. cerana from Korea; yellow represents A. cerana from Russia; blue represents A. cerana from Borneo; and red represents A. cerana from China.
Insects 15 00960 g004
Figure 5. 13 PCGs were used to analyze the phylogenetic relationships of A. cerana, A. mellifera sinisxinyuan and A. mellifera capensis as outgroups. The numbers shown at each branch point represent the support values for the nodes: the first number indicates the bootstrap support value derived from maximum likelihood analysis, while the second number represents the posterior probability obtained from Bayesian inference analysis. The same color A. cerana comes from the same country.
Insects 15 00960 g005
Table 1. Information on the sequences in the phylogenetic tree.
NumberSpeciesGenBank
Accession Number
Sampling LocalityReference
1Apis cerana japonica-TsushimaAP017985.1Japan[34]
2Apis cerana japonica-KyotoAP017314.1Japan[35]
3Apis cerana japonica-AmamiAP017941.1Japan[34]
4Apis cerana-Primorsky TerritoryLC640350.1RussiaDirectly Submitted
5Apis cerana-KoreaKX908206.1KoreaDirectly Submitted
6Apis cerana koreana-JeollanamdoAP018431.1KoreaDirectly Submitted
7Apis cerana koreana-South KoreaMW309837.1KoreaDirectly Submitted
8Apis cerana-VladivostokAP018450.1Russia[17]
9Apis cerana-BorneoAP018149.1Borneo[36]
10Apis cerana-South YunnanNC014295.1China[37]
11Apis cerana-AbaOP689704.1ChinaDirectly Submitted
12Apis cerana-Central ChinaAP017983.2China[34]
13Apis cerana-TaipeiAP017984.2China[34]
14Apis mellifera sinisxinyuan *MN733955.1ChinaDirectly Submitted
15Apis mellifera capensis * MG552693.1South Africa[15]
Note: “Directly Submitted” indicates that the sequence was submitted directly to the GenBank database by the research team and has not been published in a formal journal. The asterisk represents the outgroup.
Table 2. Annotations of the mitogenomes of two complete mitochondrial genomes (A. cerana-Diannan/A. cerana-Yun-Gui Plateau).
GeneStart PositionEnd PositionLength/bpIntergenic
Nucleotides/bp
Initiation CodonsTermination CodonsDirection
trnS1(Ser)1/160/6060/60 J/J
trnE(Glu)64/64129/12966/663/3 J/J
trnM(Met)164/164229/22966/6634/34 J/J
trnQ(Gln)461/461522/52262/62230/231 J/J
trnA(Ala)523/523588/58866/660/0 J/J
trnI(Ile)607/607672/67266/6618/18 J/J
ND2673/6731668/1668996/9960/0ATT/ATTTAA/TAAJ/J
trnC(Cys)1668/16681733/173366/66−1/−1 N/N
trnY(Tyr)1739/17391807/180769/695/5 N/N
trnW(Trp)1824/18241892/189269/6916/16 J/J
COX11893/18933453/34531561/15610/0ATT/ATTT(AA)/T(AA)J/J
trnL2(Leu)3454/34543523/352370/700/0 J/J
COX23613/36134291/4291679/67989/89ATT/ATTT(AA)/T(AA)J/J
trnD(Asp)4292/42924359/435968/680/0 J/J
trnK(Lys)4366/43664437/443772/726/6 J/J
ATP84444/44444605/4605162/1626/6ATC/ATCTAA/TAAJ/J
ATP64587/45875264/5264678/678−19/−19ATG/ATGTAA/TAAJ/J
COX35282/52826061/6061780/78017/17ATG/ATGTAA/TAAJ/J
trnG(Gly)6125/61326191/619867/6763/70 J/J
ND36192/61996545/6552354/3540/0ATT/ATTTAA/TAAJ/J
trnR(Arg)6566/65726631/663766/6620/19 N/N
trnN(Asn)6651/66576718/672468/6819/19 J/J
trnF(Phe)6737/67436807/681371/7118/18 N/N
ND56814/68208481/84871668/16686/6ATT/ATTTAA/TAAN/N
trnH(His)8483/84898548/855466/661/1 N/N
ND48566/85729894/99001329/132917/17ATT/ATTTAA/TAAN/N
ND4L9895/990110,158/10,164264/2640/0ATT/ATTTAA/TAAN/N
trnT(Thr)10,182/10,18810,248/10,25467/6723/23 J/J
trnP(Pro)10,264/10,27010,341/10,34778/7815/15 N/N
ND610,392/10,39810,904/10,910513/51350/50ATT/ATTTAA/TAAJ/J
CYTB10,917/10,92312,065/12,0711149/114912/12ATG/ATGTAA/TAAJ/J
trnS2(Ser)12,089/12,09512,155/12,16167/6723/23 J/J
ND112,168/12,17413,082/13,088915/91512/12ATT/ATTTAA/TAAN/N
trnL1(Leu)13,083/13,08913,151/13,15769/690/0 N/N
large subunitr RNA(lrRNA)13,152/13,15814,451/14,4561322/13220/0 N/N
trnV(Val)14,452/14,45714,546/14,55267/680/0 N/N
small subunit rRNA(srRNA)14,547/14,55315,319/15,324773/7730/0 N/N
AT-rich region15,320/15,32516,214/16,304895/9800/0 J/J
Table 3. Codon usage of 13 protein-coding genes and AT-rich regions.
RegionLength (bp)A%T%C%G%A + T%AT-SkewGC-Skew
DNYGDNYGDNYGDNYGDNYGDNYGDNYGDNYG
ND299699639.2639.3646.8947.198.638.235.225.2286.1586.55−0.09−0.09−0.25−0.22
COX11561156134.6634.6641.3841.1912.8813.0711.0811.0876.0475.85−0.09−0.09−0.05−0.08
COX267967937.8538.4440.6540.3512.3712.679.138.5478.578.79−0.04−0.02−0.15−0.19
ATP816216247.5347.5338.8939.519.268.644.324.3286.4287.040.10.09−0.36−0.33
ATP667867836.7336.5847.4947.4910.1810.335.65.684.2284.07−0.13−0.13−0.29−0.3
COX378078036.4135.944.2344.6110.6410.648.728.8580.6480.51−0.1−0.11−0.1−0.09
ND335435437.5737.5748.0247.749.619.64.85.0985.5985.31−0.12−0.12−0.33−0.31
ND51668166846.9447.0637.9537.899.539.475.585.5884.8984.950.110.11−0.26−0.26
ND41329132949.1349.0635.8935.979.499.415.495.5685.0285.030.160.15−0.27−0.26
ND4L26426452.6552.6534.4734.479.479.473.413.4187.1287.120.210.21−0.47−0.47
ND651351343.0843.0843.0843.278.588.385.265.2786.1686.3500−0.24−0.23
CYTB1149114936.7336.7344.2144.2110.5310.538.538.5380.9480.94−0.09−0.09−0.1−0.1
ND191591547.9847.9835.5235.5210.9310.935.575.5783.583.50.150.15−0.32−0.32
AT-rich region89598047.7147.4549.72501.561.331.011.2297.4397.45−0.02−0.03−0.21−0.04
Table 4. Codon usage of rRNA genes and tRNA genes.
RegionLength (bp)A%T%C%G%A + T%AT-SkewGC-Skew
DNYGDNYGDNYGDNYGDNYGDNYGDNYGDNYG
lrRNA1322132242.4642.5740.4740.4211.1511.165.925.8582.9282.990.020.03−0.31−0.31
srRNA77377337.5237.5643.8543.9112.5512.446.086.0981.3781.47−0.08−0.08−0.35−0.34
rRNA2095209540.6240.70 41.7341.7211.6711.645.985.9482.3582.42−0.01−0.01−0.32−0.32
tRNA1486148742.3342.4344.9544.927.40 7.40 5.325.2587.2887.35−0.03−0.03−0.16−0.17
Disclaimer/Publisher’s Note: The statements, opinions and data contained in all publications are solely those of the individual author(s) and contributor(s) and not of MDPI and/or the editor(s). MDPI and/or the editor(s) disclaim responsibility for any injury to people or property resulting from any ideas, methods, instructions or products referred to in the content.

