Article

The Selection and Validation of Reference Genes for RT-qPCR Analysis of the Predatory Natural Enemy Orius nagaii (Hemiptera: Anthocoridae)

1
Institute of Plant Protection, Shandong Academy of Agricultural Sciences, Jinan 250100, China
2
Shandong Key Laboratory for Green Prevention and Control of Agricultural Pests, Jinan 250100, China
3
Key Laboratory of Natural Enemies Insects, Ministry of Agriculture and Rural Affairs, Jinan 250100, China
4
Shandong Engineering Research Center of Resource Insects, Jinan 250100, China
5
College of Agriculture, Guizhou University, Guiyang 550025, China
*
Author to whom correspondence should be addressed.
Insects 2024, 15(12), 936; https://doi.org/10.3390/insects15120936
Submission received: 12 November 2024 / Revised: 23 November 2024 / Accepted: 25 November 2024 / Published: 28 November 2024
(This article belongs to the Section Insect Molecular Biology and Genomics)

Simple Summary

A predatory natural enemy insect, Orius nagaii, has been discovered in both the northern and southern regions of China and is extensively utilized for greenhouse vegetable pest management. The precise selection of reference genes is essential for RT-qPCR analysis to elucidate the expression patterns of key genes implicated in the interaction between O. nagaii and its host. This study assessed the expression stability of ten candidate reference genes (CRGs) across various biological conditions and environmental stresses. Our findings revealed that the ideal reference genes were RPS10 and RPL32 at multiple stages of development, while RPS10 and RPS15 proved to be the most suitable combination for various tissues and host diets. The optimal reference gene pairing under temperature-induced stress was EF1-α and RPL6. These outcomes will offer dependable reference genes for subsequent investigations into the gene expression patterns of target genes in O. nagaii and closely related species.

Abstract

Orius nagaii is a highly effective natural enemy for controlling thrips, tetranychids, aphids, and various Lepidoptera pests. Nevertheless, the molecular mechanisms underlying its interactions with host pests remain unclear. Screening for optimal reference genes is a prerequisite for using reverse transcription–quantitative polymerase chain reaction (RT-qPCR) to investigate the interrelationship. Here, ten commonly used reference genes (Act, GAPDH, β-Tub, EF1-α, RPS10, RPS15, RPL6, RPL13, RPL32, and HSP90) were selected, and their expression stability across developmental stages, tissues, temperatures, and host conditions were evaluated using RefFinder, which uses multiple analytical approaches (NormFinder, geNorm, the ΔCt method, and BestKeeper). The findings suggested that the most reliable normalization can be achieved by selecting the two reference genes for all conditions, with the optimal pairs being RPS10 and RPL32 for the developmental stage, RPS10 and RPS15 for tissue, RPS10 and RPS15 for the host, and EF1-α and RPL13 for temperature. Also, the best and least stable reference genes were chosen to compare the relative transcript levels of the TBX1 in various tissues, which exhibited considerable variation. Our findings will significantly enhance the reliability of RT-qPCR and provide a foundation for further research on the expression patterns of crucial genes that are implicated in the interaction between O. nagaii and its host pests.

1. Introduction

Orius nagaii, a predatory natural enemy insect, is widely distributed in both the northern and southern regions of China [1,2]. This species is known for the ability of its nymphs and adults to feed on a variety of pests, including thrips, mites, aphids, whiteflies, and other minute pests [3,4,5,6]. Additionally, O. nagaii has shown efficient control over the eggs and neonates of various Lepidoptera pests [7,8,9]. It plays a key role in controlling pests in greenhouse vegetables, flowers, and field cash crops, making it a natural enemy insect with high potential for development [10,11]. Semi-field cage experiments demonstrated that the efficacy of O. nagaii in controlling Megalurothrips usitatus was notably superior to that achieved through conventional chemical control measures [2], which highlighted its important value in pest control. However, the molecular mechanisms underlying the interactions between O. nagaii and its host pests remain unclear. Therefore, conducting gene expression analysis is of great importance in exploring its gene functions and further understanding its interaction mechanisms with host pests.
Reverse transcription–quantitative polymerase chain reaction (RT-qPCR) is a widely employed rapid detection technique of gene quantification for accurately measuring the expression levels of target genes under various biological conditions [12], which is crucial for the subsequent examination of the expression patterns of target genes in O. nagaii. However, when working with different experimental samples, errors may occur in the detection results of target genes due to factors such as the quality of the RNA in the starting material, the concentration of template cDNA, and experimental manipulation errors [13,14]. Hence, it is crucial to meticulously choose and validate suitable reference genes for normalization as the first step in ensuring the success of RT-qPCR analysis. Previous research has shown that many commonly used reference genes may not exhibit consistent expressions under complex experimental conditions [15]. In Drosophila melanogaster, the ribosomal protein L18 (RPL18) was found to be the most stable in methanol-treated flies, while its expression was the least stable in ethyl acetate (ETOAC)-treated flies [16,17]. Meanwhile, the transcriptional level of the glyceraldehyde-3-phosphate dehydrogenase (GAPDH) gene from Spodoptera litura was found to be stable in different developmental periods but unstable in different tissues and geographical populations [18]. Notably, RPL13 and RPS18 of Henosepilachna vigintioctomaculata were stably expressed under various experimental conditions, including different developmental stages, tissues, hosts, and temperatures [19]. Similarly, RPL6 was found to be stably expressed in Mylabris sibirica under a variety of experimental conditions [20]. However, cases of stable expression like these are relatively rare, and the change in experimental conditions may lead to fluctuations in the expression level of reference genes. Hence, it is essential to identify the best optimal reference gene with a stable expression under various research conditions for accurate target gene quantitative analysis.
Due to the lack of stability evaluation studies for reference genes in O. nagaii, ten frequently employed reference genes based on a previous review of 78 insect species [21], namely, β-Actin (Act), glyceraldehyde 3-phosphate dehydrogenase (GAPDH), β-tubulin (β-Tub), elongation factor-1-alpha (EF1-α), ribosomal protein S10 (RPS10), ribosomal protein S15 (RPS15), ribosomal protein L6 (RPL6), ribosomal protein L13 (RPL13), ribosomal protein L32 (RPL32), and heat shock protein 90 (HSP90) of O. nagaii, were chosen as candidate reference genes. RefFinder, which integrates four analysis methods (NormFinder, geNorm, the ΔCt method, and BestKeeper), was used to assess the expression stability of these genes under four experimental conditions (developmental period, tissue, host, and temperature). Meanwhile, the T-box transcription factor (TBX1) gene was used to verify the dependability of the evaluation results. This research will offer reliable reference genes for the quantitative analysis of key gene expression in the interaction between O. nagaii and host pests.

2. Materials and Methods

2.1. Preparation of Insects

Orius nagaii samples were collected from the plantation base of Shandong Academy of Agricultural Sciences (Jinan, China), classified, and identified in the Key Laboratory of Natural Enemies Insects, Ministry of Agriculture and Rural Areas, P.R. China, and were continuously propagated under the following conditions: 26 ± 1 °C, 70 ± 5% RH, and a 16/8 h (L/D) cycle [22]. Phaseolus vulgaris was used as the oviposition substrate for females, while nymphs and adults were fed Sitotroga cerealella eggs [22].

2.2. Sample Handling and Retrieval

Developmental stage: All phases of development were collected, including eggs, nymphs of the 1st to 5th instar, and adults. Samples were collected on the first day of each instar, with three biological replicates per sample. The quantities of individuals gathered for each repetition at various developmental phases were as follows: 90 eggs for the egg stage; 60 individuals in both the 1st and 2nd instar; 30 individuals in both the 3rd and 4th instar; and 15 individuals in both the 5th instar and adult stage.
Tissue: One-day-old female adults were dissected under a compact stereo microscope Stemi 508 (ZEISS, Oberkochen, Germany), and different body tissues were identified and collected (Figure 1), specifically the head (Hd), salivary gland (SG), foregut (FG), midgut (MG), ovary (Ov), Malpighian tubule (MT), and residual body (RB). Three biological replicates were set per sample, with 30 insects dissected per replicate.
Host: Diet-induced stress was utilized to assess the stability of expression of candidate reference genes (CRGs) during feeding on different hosts (S. cerealella egg, Corcyra cephalonica egg, Frankliniella occidentalis nymph, and Megalurothrips usitatus nymph). Newly hatched nymphs were fed on different hosts until adult emergence, and the newly emerged adults were collected. Three biological replicates were set per sample, with 15 adults in each replicate.
Temperature: Three distinct temperatures, 8 °C, 25 °C, and 35 °C, were used for the temperature-induced stress [19]. Newly emerged adults were exposed to these temperatures for 3 h and then collected. Each sample had three biological replicates, with 15 adults per replicate.
All samples were transferred in RNase-free tubes, snap-frozen in liquid nitrogen for 2–3 min, and gathered at −80 °C for future utilization.

2.3. Production of cDNA Template

Sample RNA was isolated under multiple experimental conditions by following the manufacturer’s instructions for Trizol (Invitrogen, Carlsbad, CA, USA). The RNA concentration was assessed with a NanoDrop One spectrophotometer (Thermo Scientific, Waltham, MA, USA), and 1% agarose gel electrophoresis was used to check its integrity. First-strand complementary DNA (cDNA) was initially synthesized from 1 μg of sample RNA in two steps using the PrimeScript™ RT reagent Kit with the gDNA Eraser (Takara, Tokyo, Japan). The gDNA Eraser within the kit exhibits robust DNA degradation capabilities, which can effectively eliminate genomic DNA at 42 °C for 2 min. Additionally, the reverse transcription reagent includes elements that suppress the function of the DNA decomposition enzyme, so that the sample treated with gDNA Eraser can directly synthesize cDNA through the reverse transcription reaction at 37 °C, 15 min, and 85 °C, 5 s.

2.4. Primer Design and Verification

In our research, frequently utilized CRGs from our newly sequenced O. nagaii transcriptomes (unpublished data) were screened for the RT-qPCR analysis (Table 1). Utilizing conserved sequences as a foundation, precise primers were crafted using the NCBI Primer-BLAST web tool (https://www.ncbi.nlm.nih.gov/tools/primer-blast/, accessed on 24 September 2024), and the uniqueness of the primers was confirmed through 1% agarose gel electrophoresis. Amplified fragments of 80 to 200 bp of a single band were used to further assess the stability of the CRGs.

2.5. RT-qPCR

The RT-qPCR experiments were conducted using ChamQ Universal SYBR qPCR Master Mix (Vazyme, Nanjing, China) in a 20 µL reaction mixture. The reaction program was as follows: hold stage at 95 °C for 30 s, PCR stage (40 cycles) at 95 °C for 10 s and 60 °C for 30 s, and melt curve stage using the default system program. The melting and standard curves of the reference genes were derived using the Applied Biosystem™ QuantStudio5™ Real-Time PCR System (Thermo Scientific, Waltham, MA, USA). The amplification efficiency (E) of the RT-qPCR was calculated using the threshold cycle value (Ct value) obtained from the 5-fold dilution of the template, as follows: E = (10[−1/slope] − 1) × 100% [20,23].

2.6. Stability Assessment

The stability of the CRGs was assessed using RefFinder (http://blooge.cn/RefFinder/, accessed on 12 October 2024) [24], which incorporates four algorithms (NormFinder, geNorm, the ΔCt method, and BestKeeper) to offer a thorough evaluation of the genetic stability [25,26,27,28]. The pairwise variation (Vn/n + 1) value, computed with geNorm, was employed to ascertain the ideal number of reference genes needed to normalize the target gene. A value of Vn/n + 1 < 0.15 indicates that there is no need to add another reference gene, meaning that the initial n reference genes are sufficient to achieve the standardization of the target gene.

2.7. Validation of Optimal Reference Genes in Various Tissues

The T-box transcription factor (TBX1) gene was picked as the target gene to confirm the dependability of the CRGs. Prior research has demonstrated that TBX1 participates in the initial phase of heart development during insects’ embryonic development [29,30]. The primer sequence for the target gene is as follows: TBX1, F: (5′-TGGGAAGAATCACAGCATCA-3′) and R: (5′-ATCGGTATCGTTTATCGTCAAG-3′). The two most and two least stable selected reference genes were utilized to standardize the Ct values of TBX1 across various tissues. The average TBX1 transcript level was then calculated using the 2−∆∆Ct method [31]. The obtained data were statistically analyzed using one-way ANOVA in GraphPad Prism 9.0.

3. Results

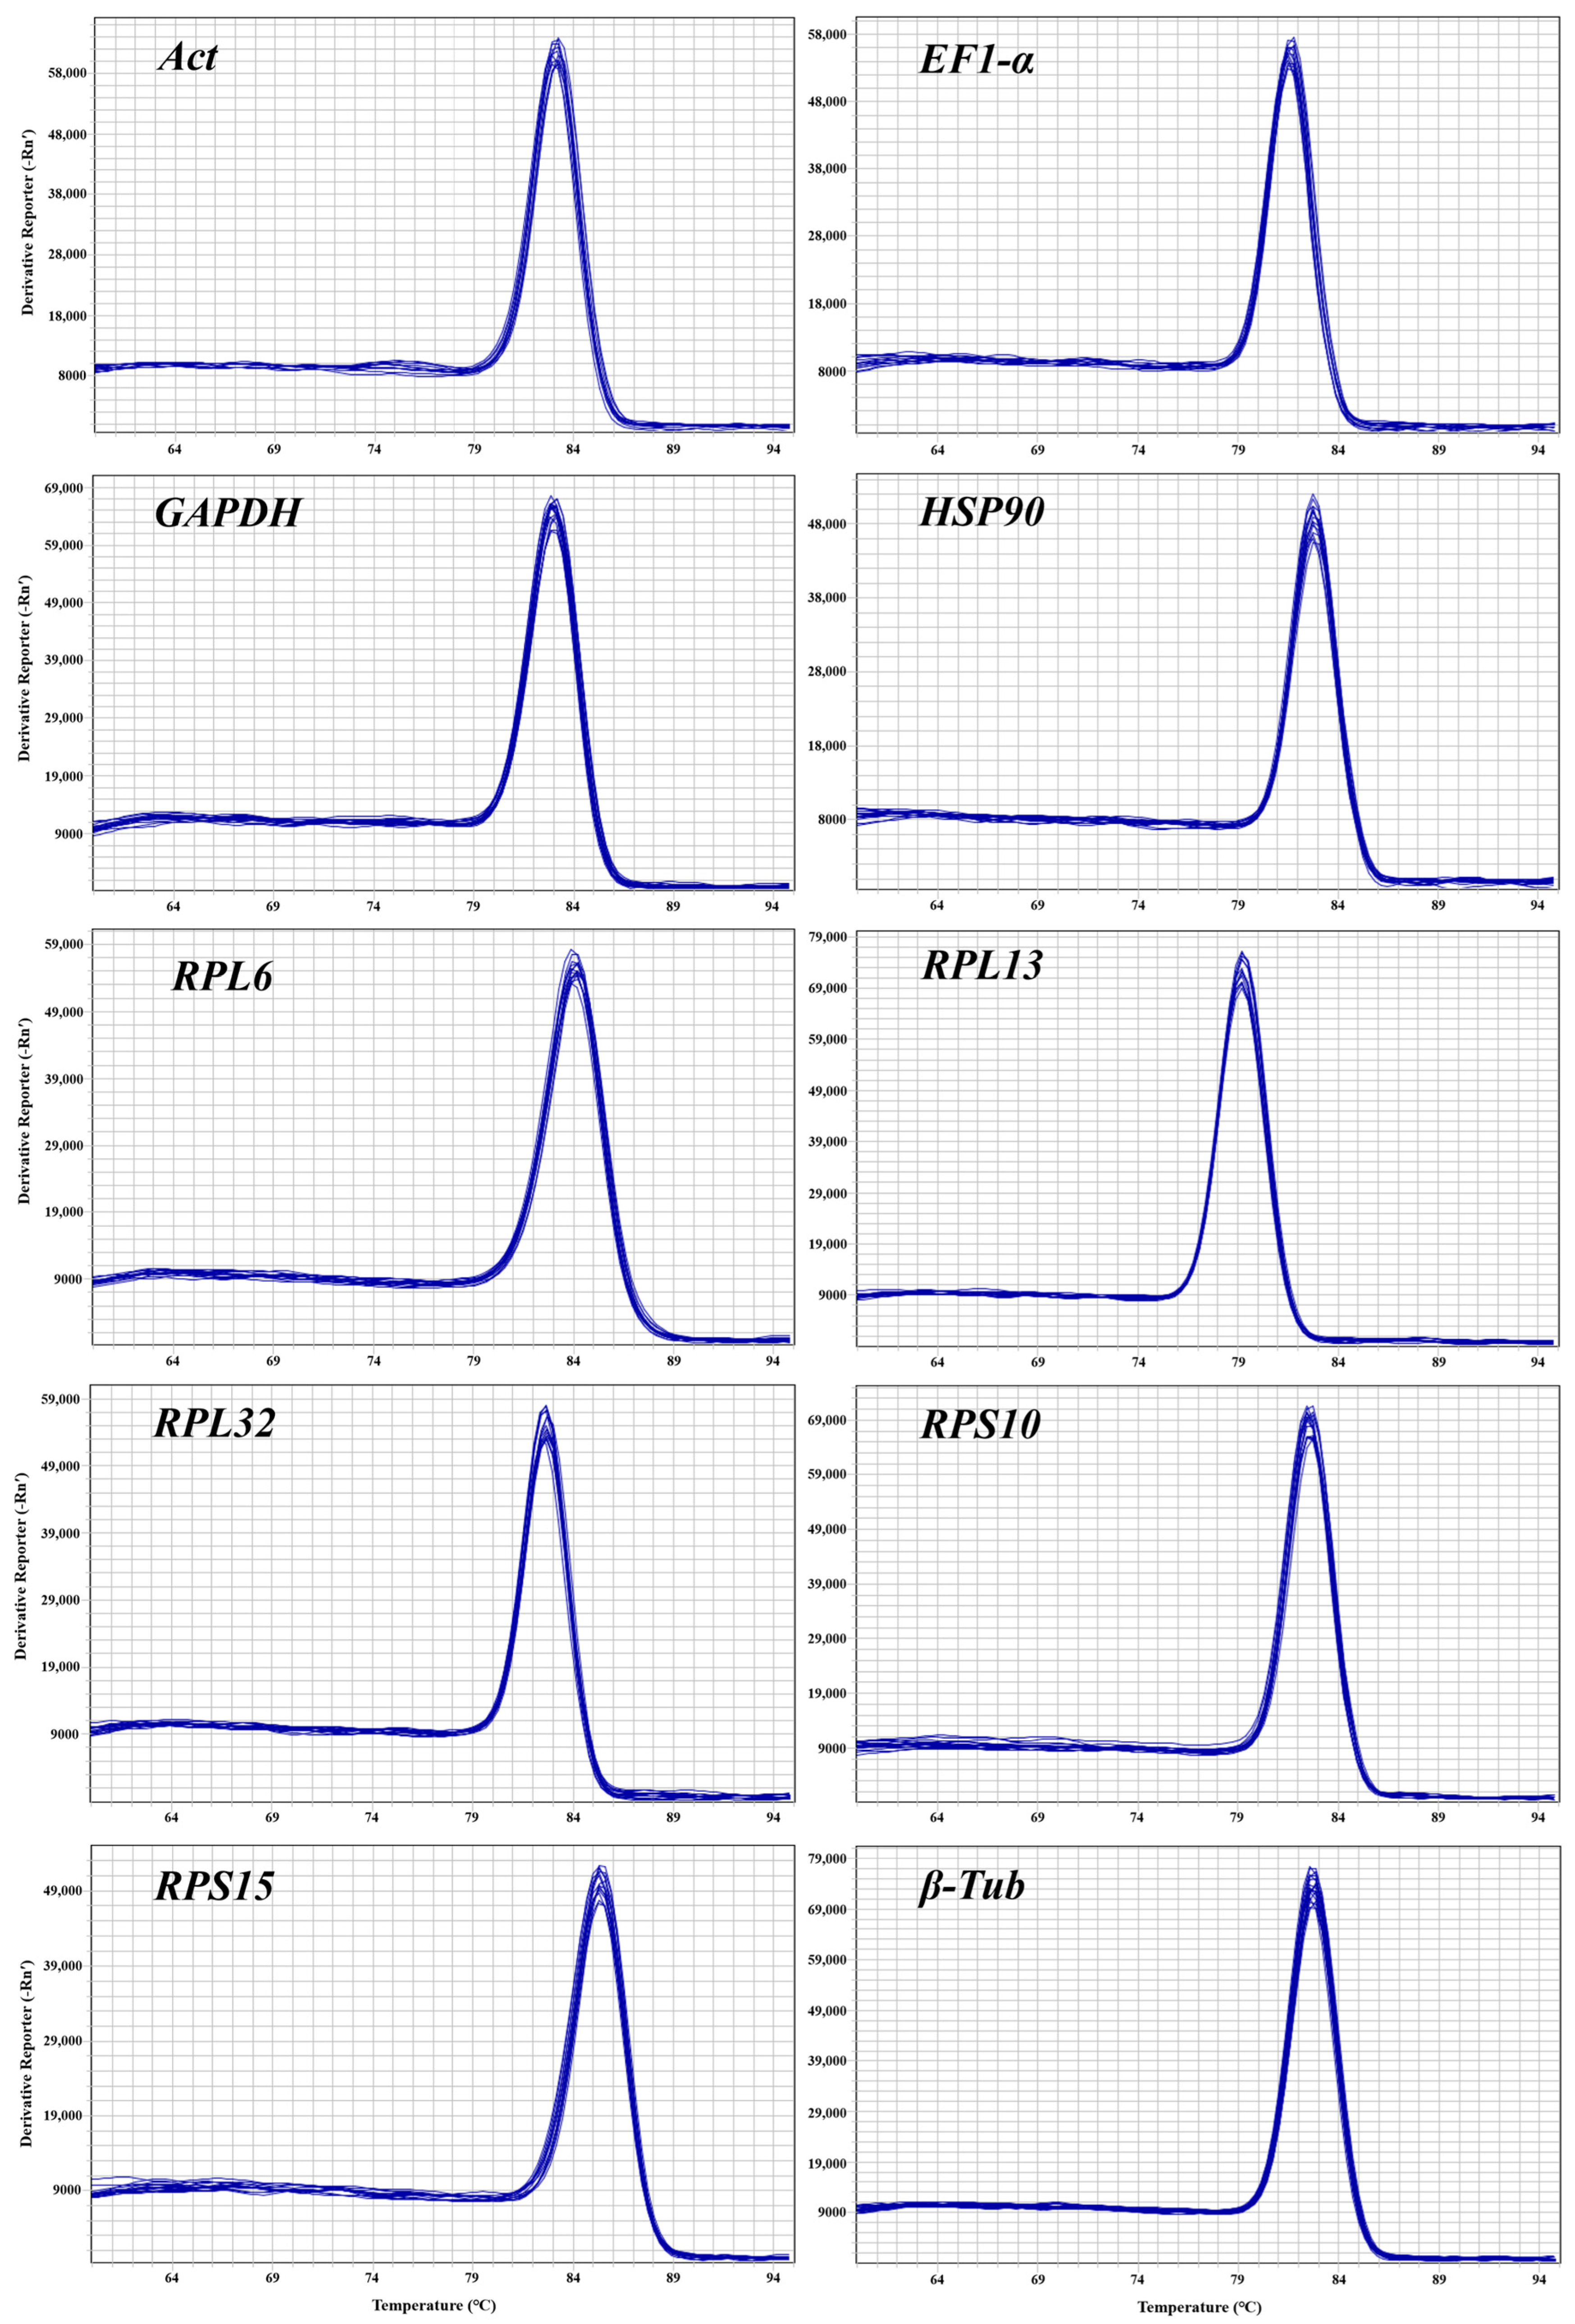
3.1. Dependability of Primers for CRGs

Before assessing the stability of CRGs, it is essential to confirm the dependability of the primers, including the specificity and amplification efficiency. The 1% agarose gel electrophoresis of all the CRGs showed a singular band of amplified fragments (Figure S1), and the melting curves from their RT-qPCR analysis also showed a single peak (Figure 2). These results indicate that the designed primers have excellent specificity. This study provided standard curves (Figure S2) for all CRGs and calculated the primer amplification efficiency via the slope of the curve. The primer amplification efficiency ranged from 102.63 to 109.02% (Table 1), and the correlation coefficient varied between 0.9956 and 0.9999 (Table 1), indicating the high quality of the standard curve and reliable quantitative results.

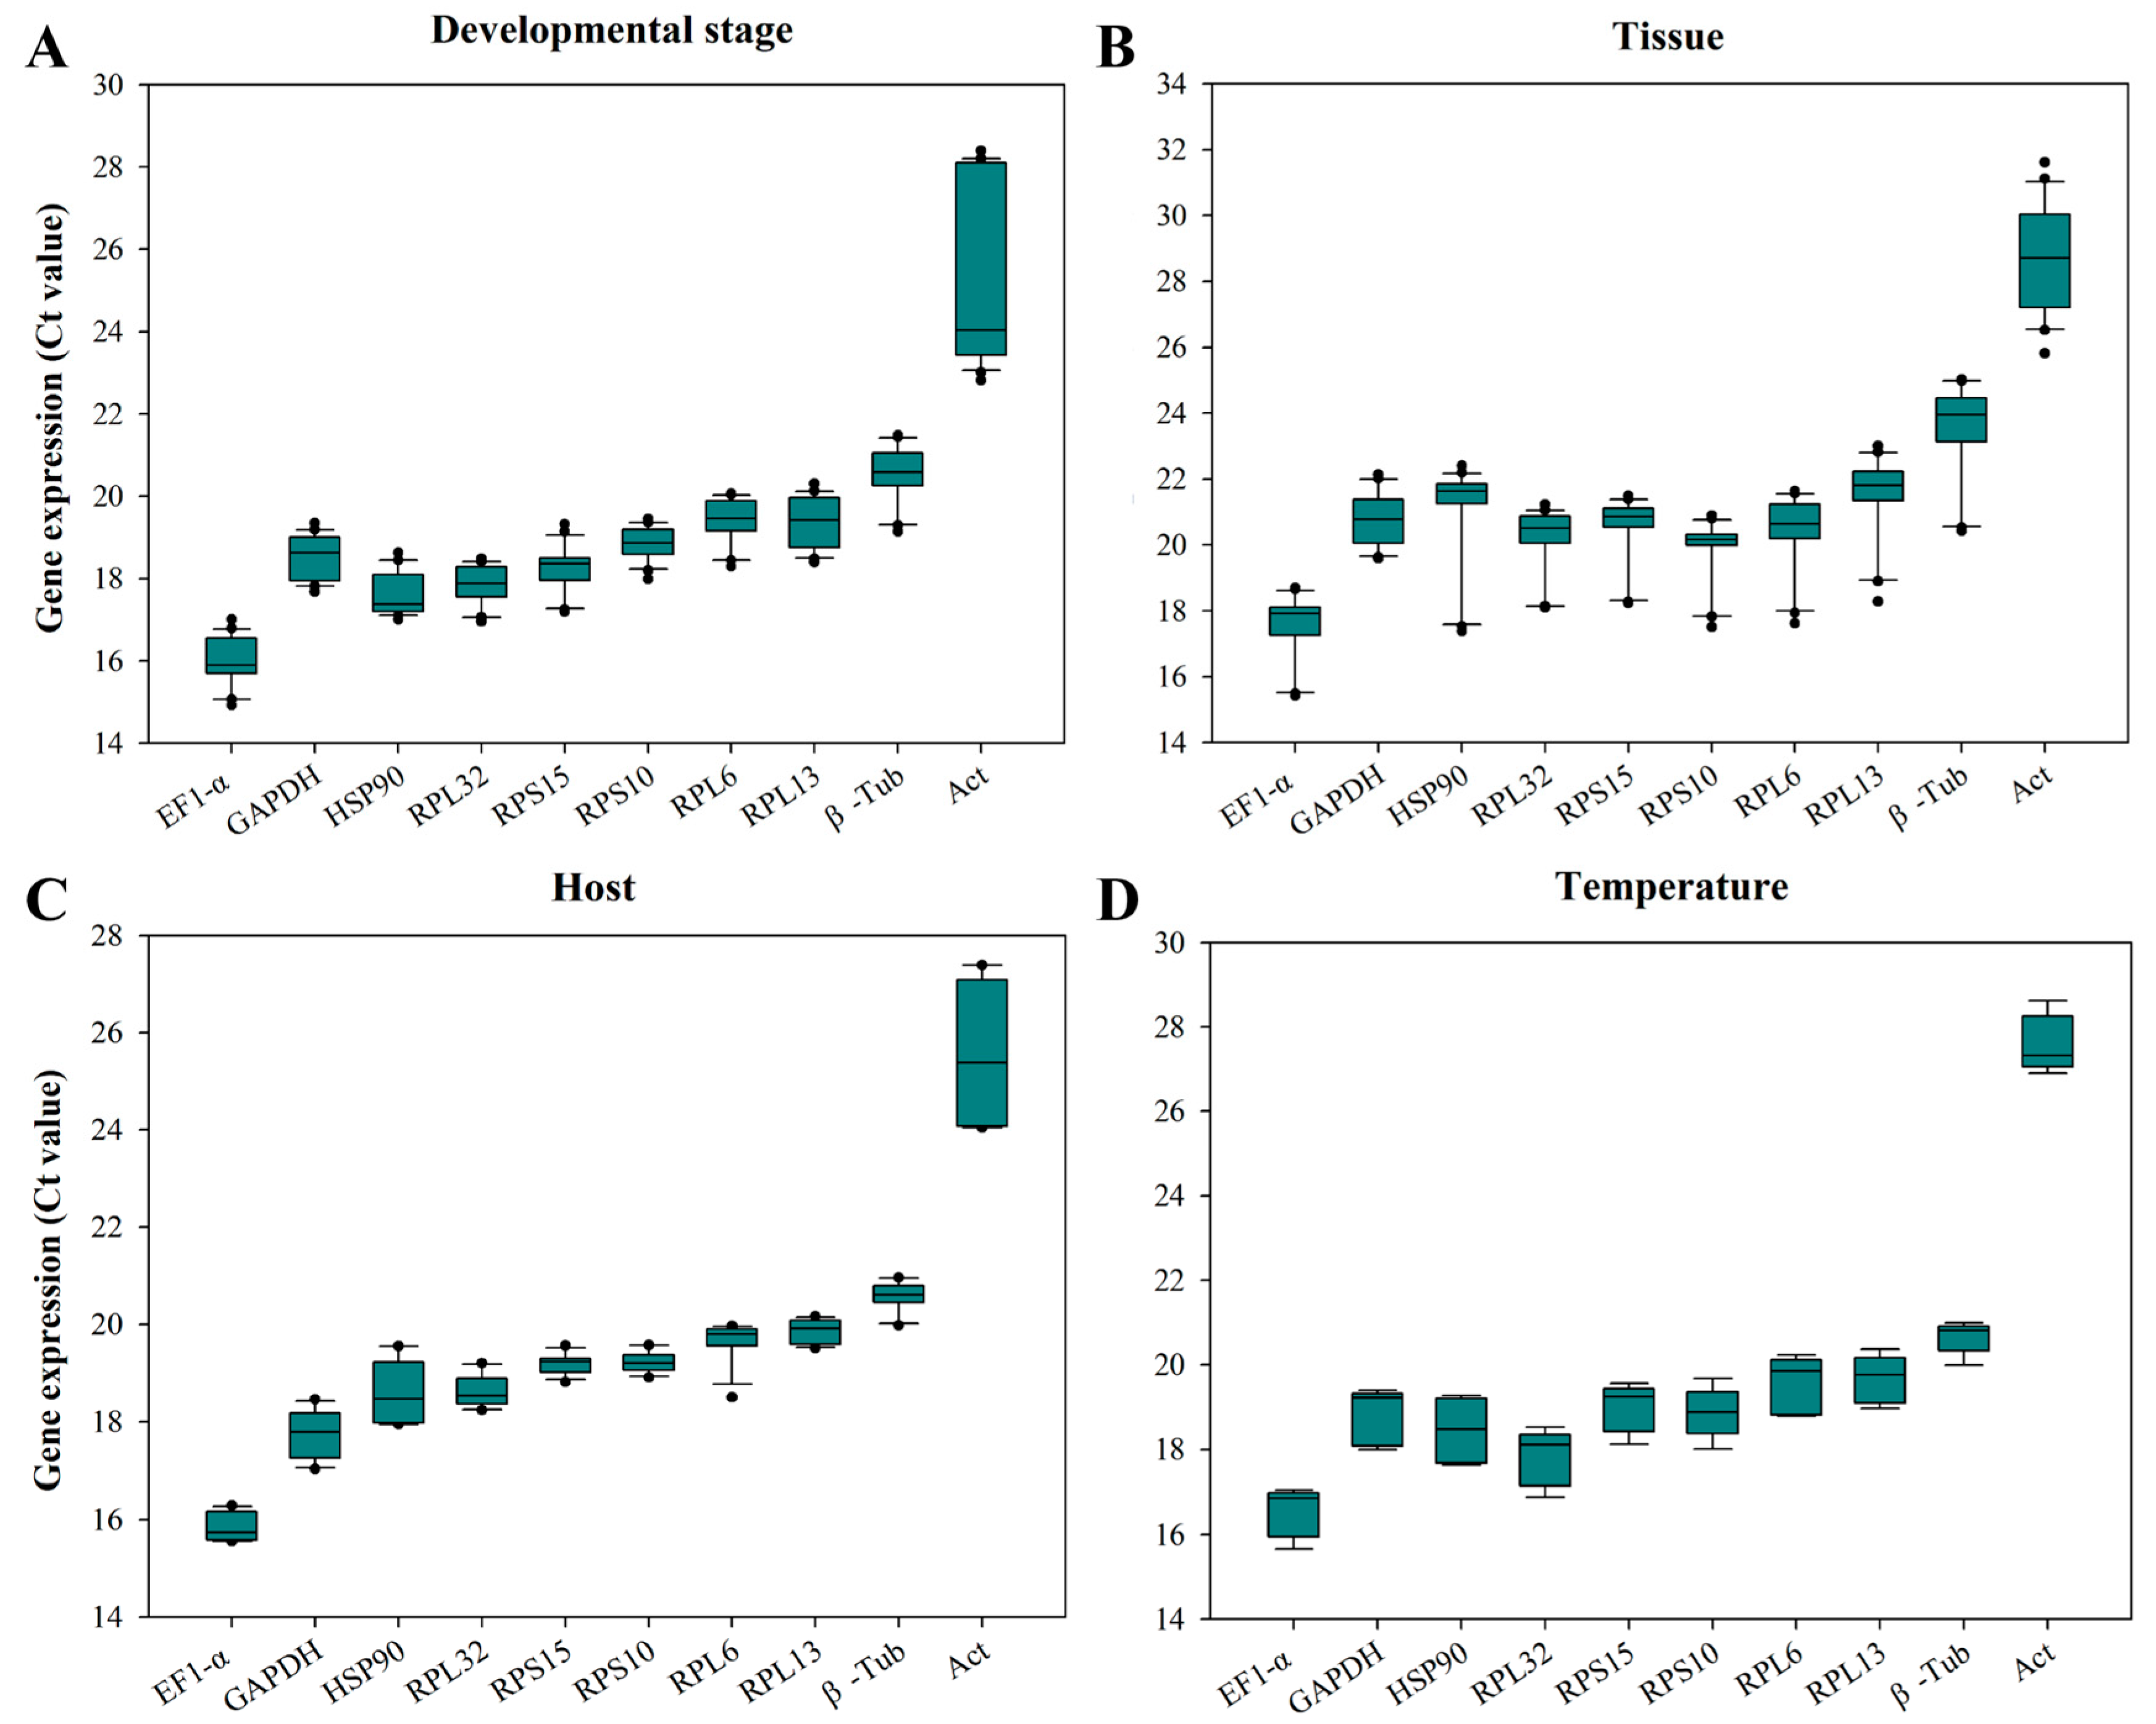
3.2. Expression Profile of CRGs

The Ct values of all reference genes under four experimental conditions ranged from 15.4 to 31.6. EF1-α was the reference gene with the highest level of richness, while β-Tub and Act were the least abundant reference genes (Figure 3). At multiple stages of development, the Ct value of RPS10 fluctuated in the smallest range, with a difference value of 1.45 (Figure 3A). In different tissues, the Ct value of GAPDH had the smallest fluctuation range, with a difference value of 2.55 (Figure 3B). When feeding on different hosts, the Ct value of RPS10 had the smallest fluctuation range, with a difference value of 0.66 (Figure 3C). The Ct value of β-Tub has the smallest fluctuation range under temperature-induced stress, with a difference value of 1.0 (Figure 3D). The Ct value of Act exhibited the largest fluctuations among all experimental conditions (Figure 3).

3.3. Assessment of the Expression Stability of the CRGs

Based on a comprehensive evaluation in RefFinder, the best to the least stable CRGs at multiple stages of development were ranked as follows: RPS10 > RPL32 > RPL6 > EF1-α > RPS15 > HSP90 > RPL13 > β-Tub > GAPDH > Act (Figure 4A). Within different tissues, the ranking was as follows: RPS10 > RPS15 > GAPDH > RPL32 > EF1-α > RPL13 > RPL6 > β-Tub > HSP90 > Act (Figure 4B). The ranking of the expression stability of the CRGs in O. nagaii fed with different hosts was as follows: RPS10 > RPS15 > RPL13 > EF1-α > β-Tub > RPL32 > GAPDH > RPL6 > HSP90 > Act (Figure 4C). Under different temperature stresses, the following ranking was determined: EF1-α > RPL6 > RPL13 > RPL32 > β-Tub > GAPDH > RPS10 > RPS15 > HSP90 > Act (Figure 4D). The expression stability values and rankings of all the CRGs under various experimental conditions were obtained using Normfinder, geNorm, the ΔCt method, and BestKeeper (Table 2).

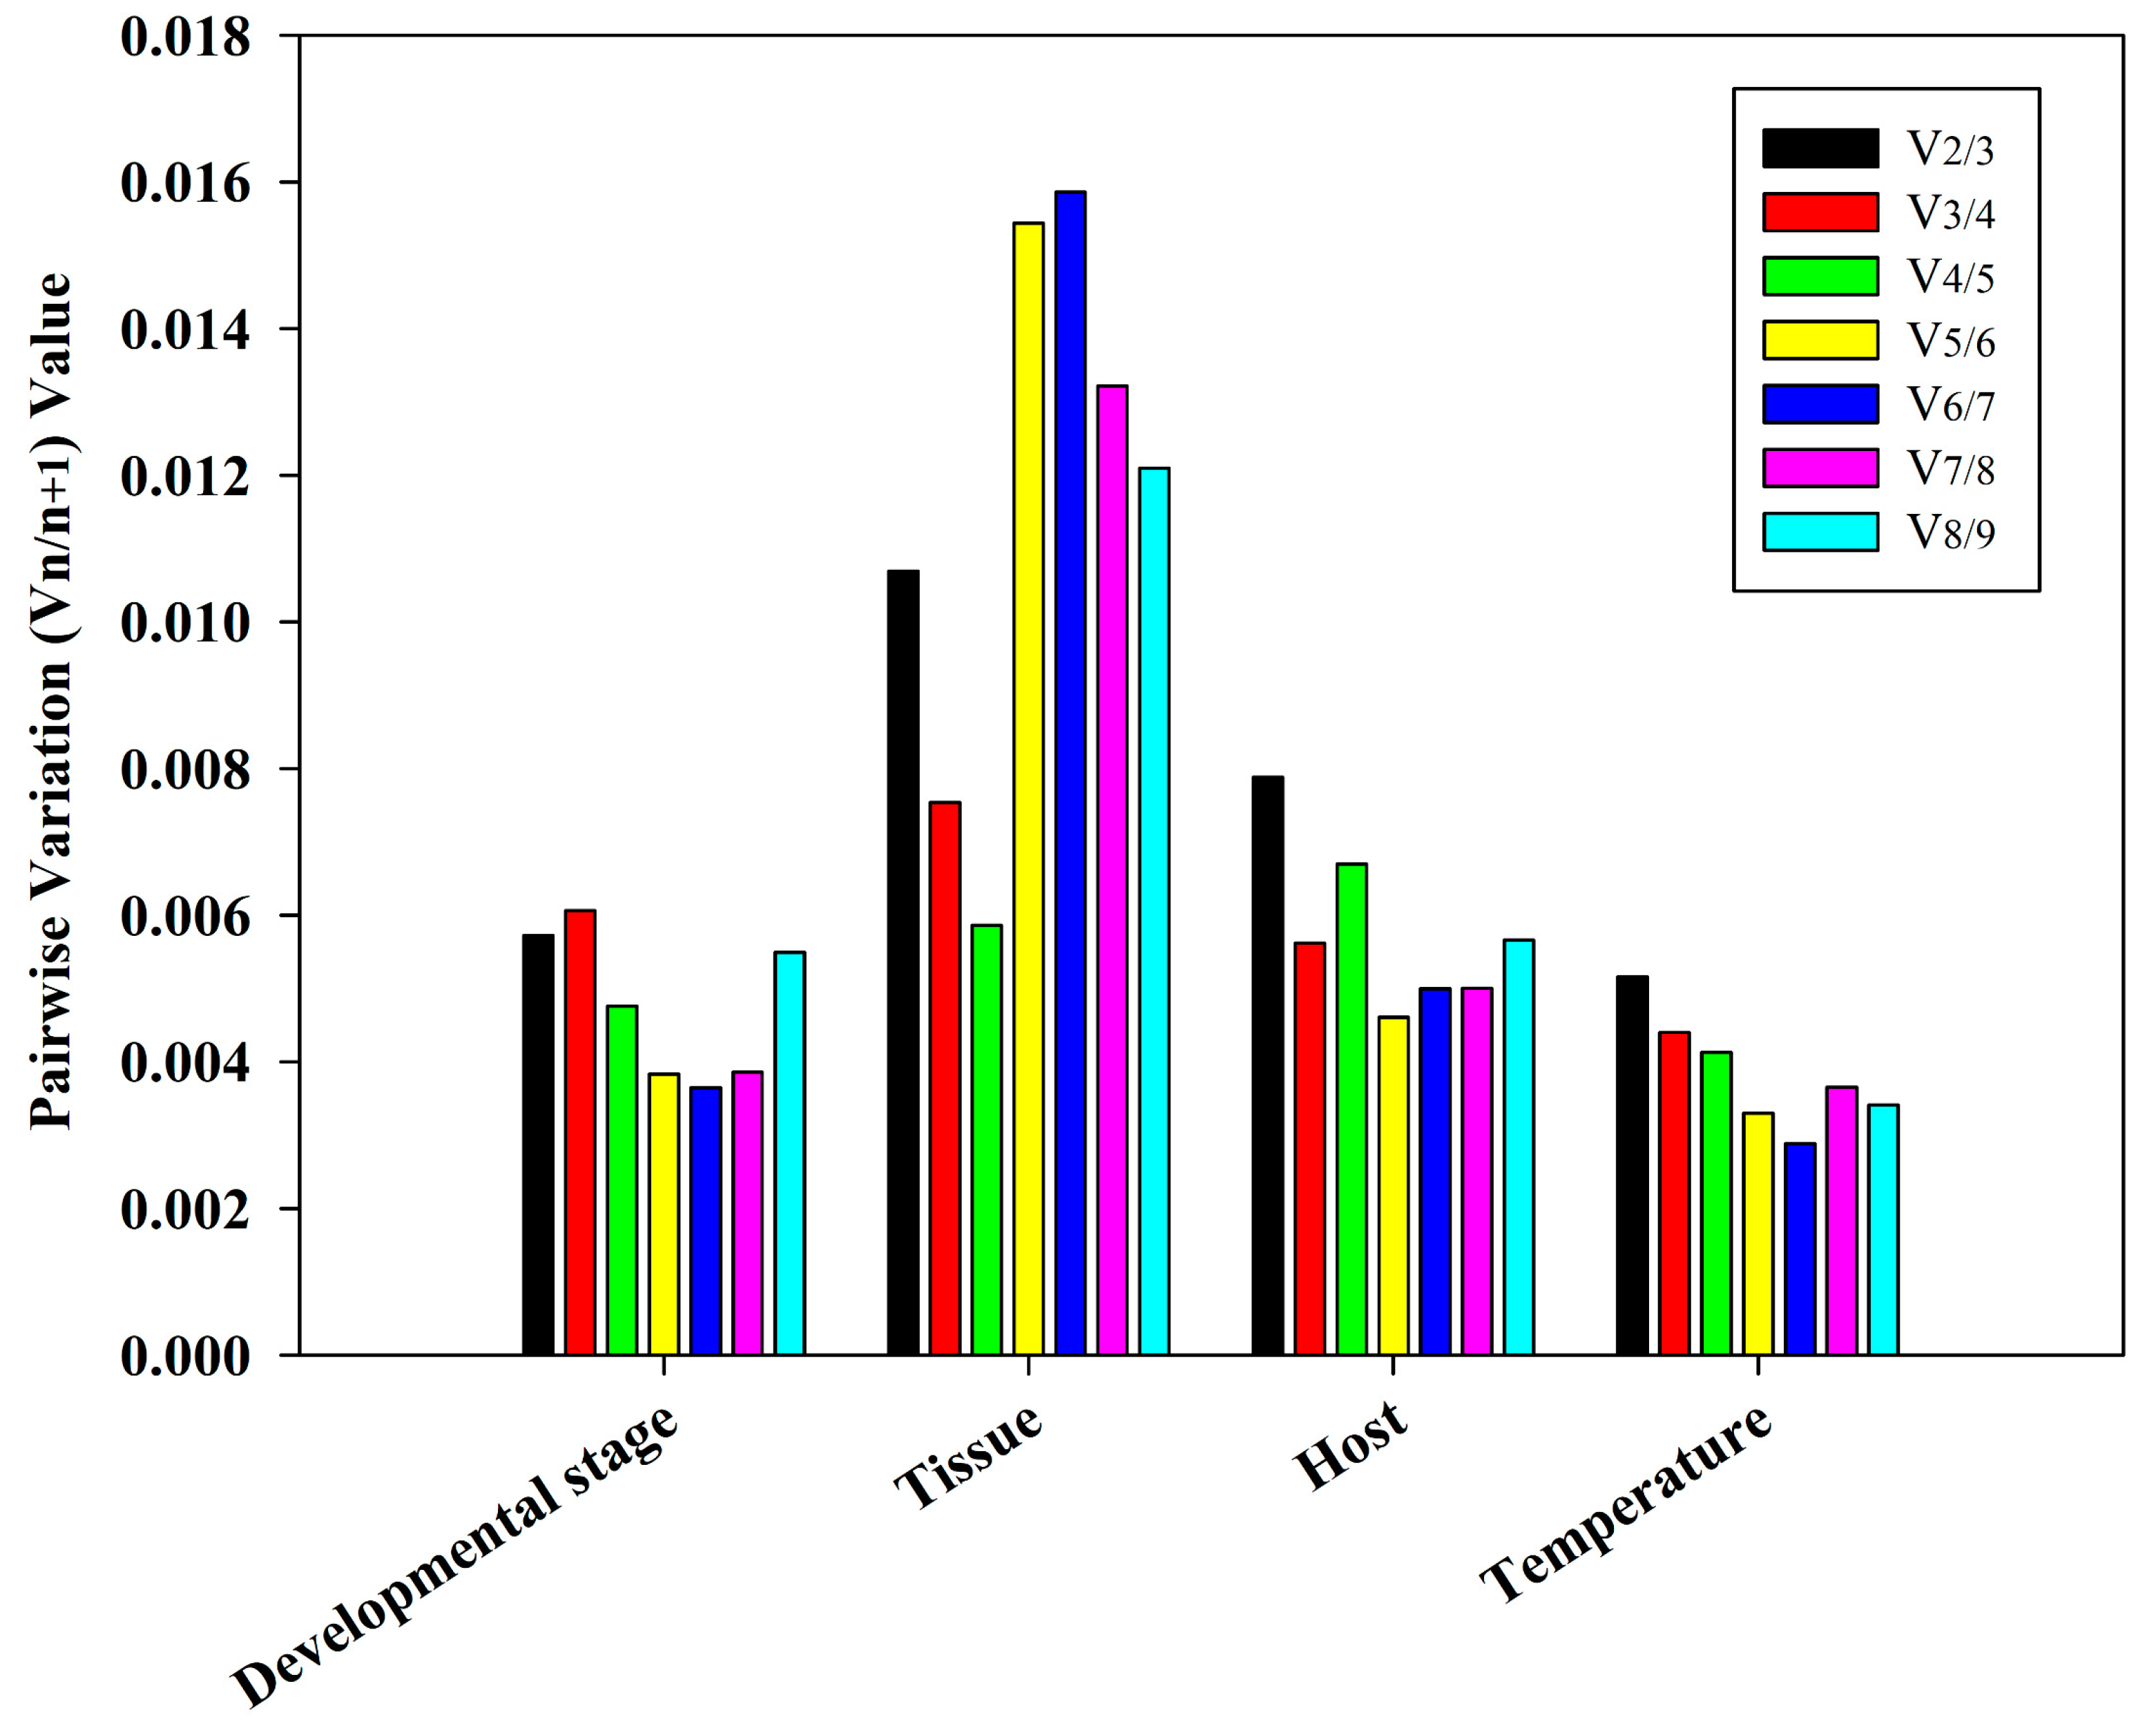
3.4. Ideal Number of Reference Genes Across Various Experimental Conditions

The geNorm tool is designed to provide guidance for determining the ideal number of reference genes. A Vn/n + 1 value less than 0.15, as determined by geNorm, was used as our criterion for determining the ideal number of reference genes [32]. In multiple experimental conditions, the values of V2/3 were found to be less than 0.15, suggesting that only the two most stable reference genes are needed for normalization of the target genes (Figure 5). A correlation analysis focusing on stability (Table 2) showed that the ideal reference genes for different developmental periods were RPS10 and RPL32. In different tissues, RPS10 and RPS15 were revealed to be the ideal reference genes. Additionally, RPS10 and RPS15 were the ideal housekeeping genes when feeding on different hosts. Under temperature-induced stress, EF1-α and RPL6 were identified as the most suitable reference genes.

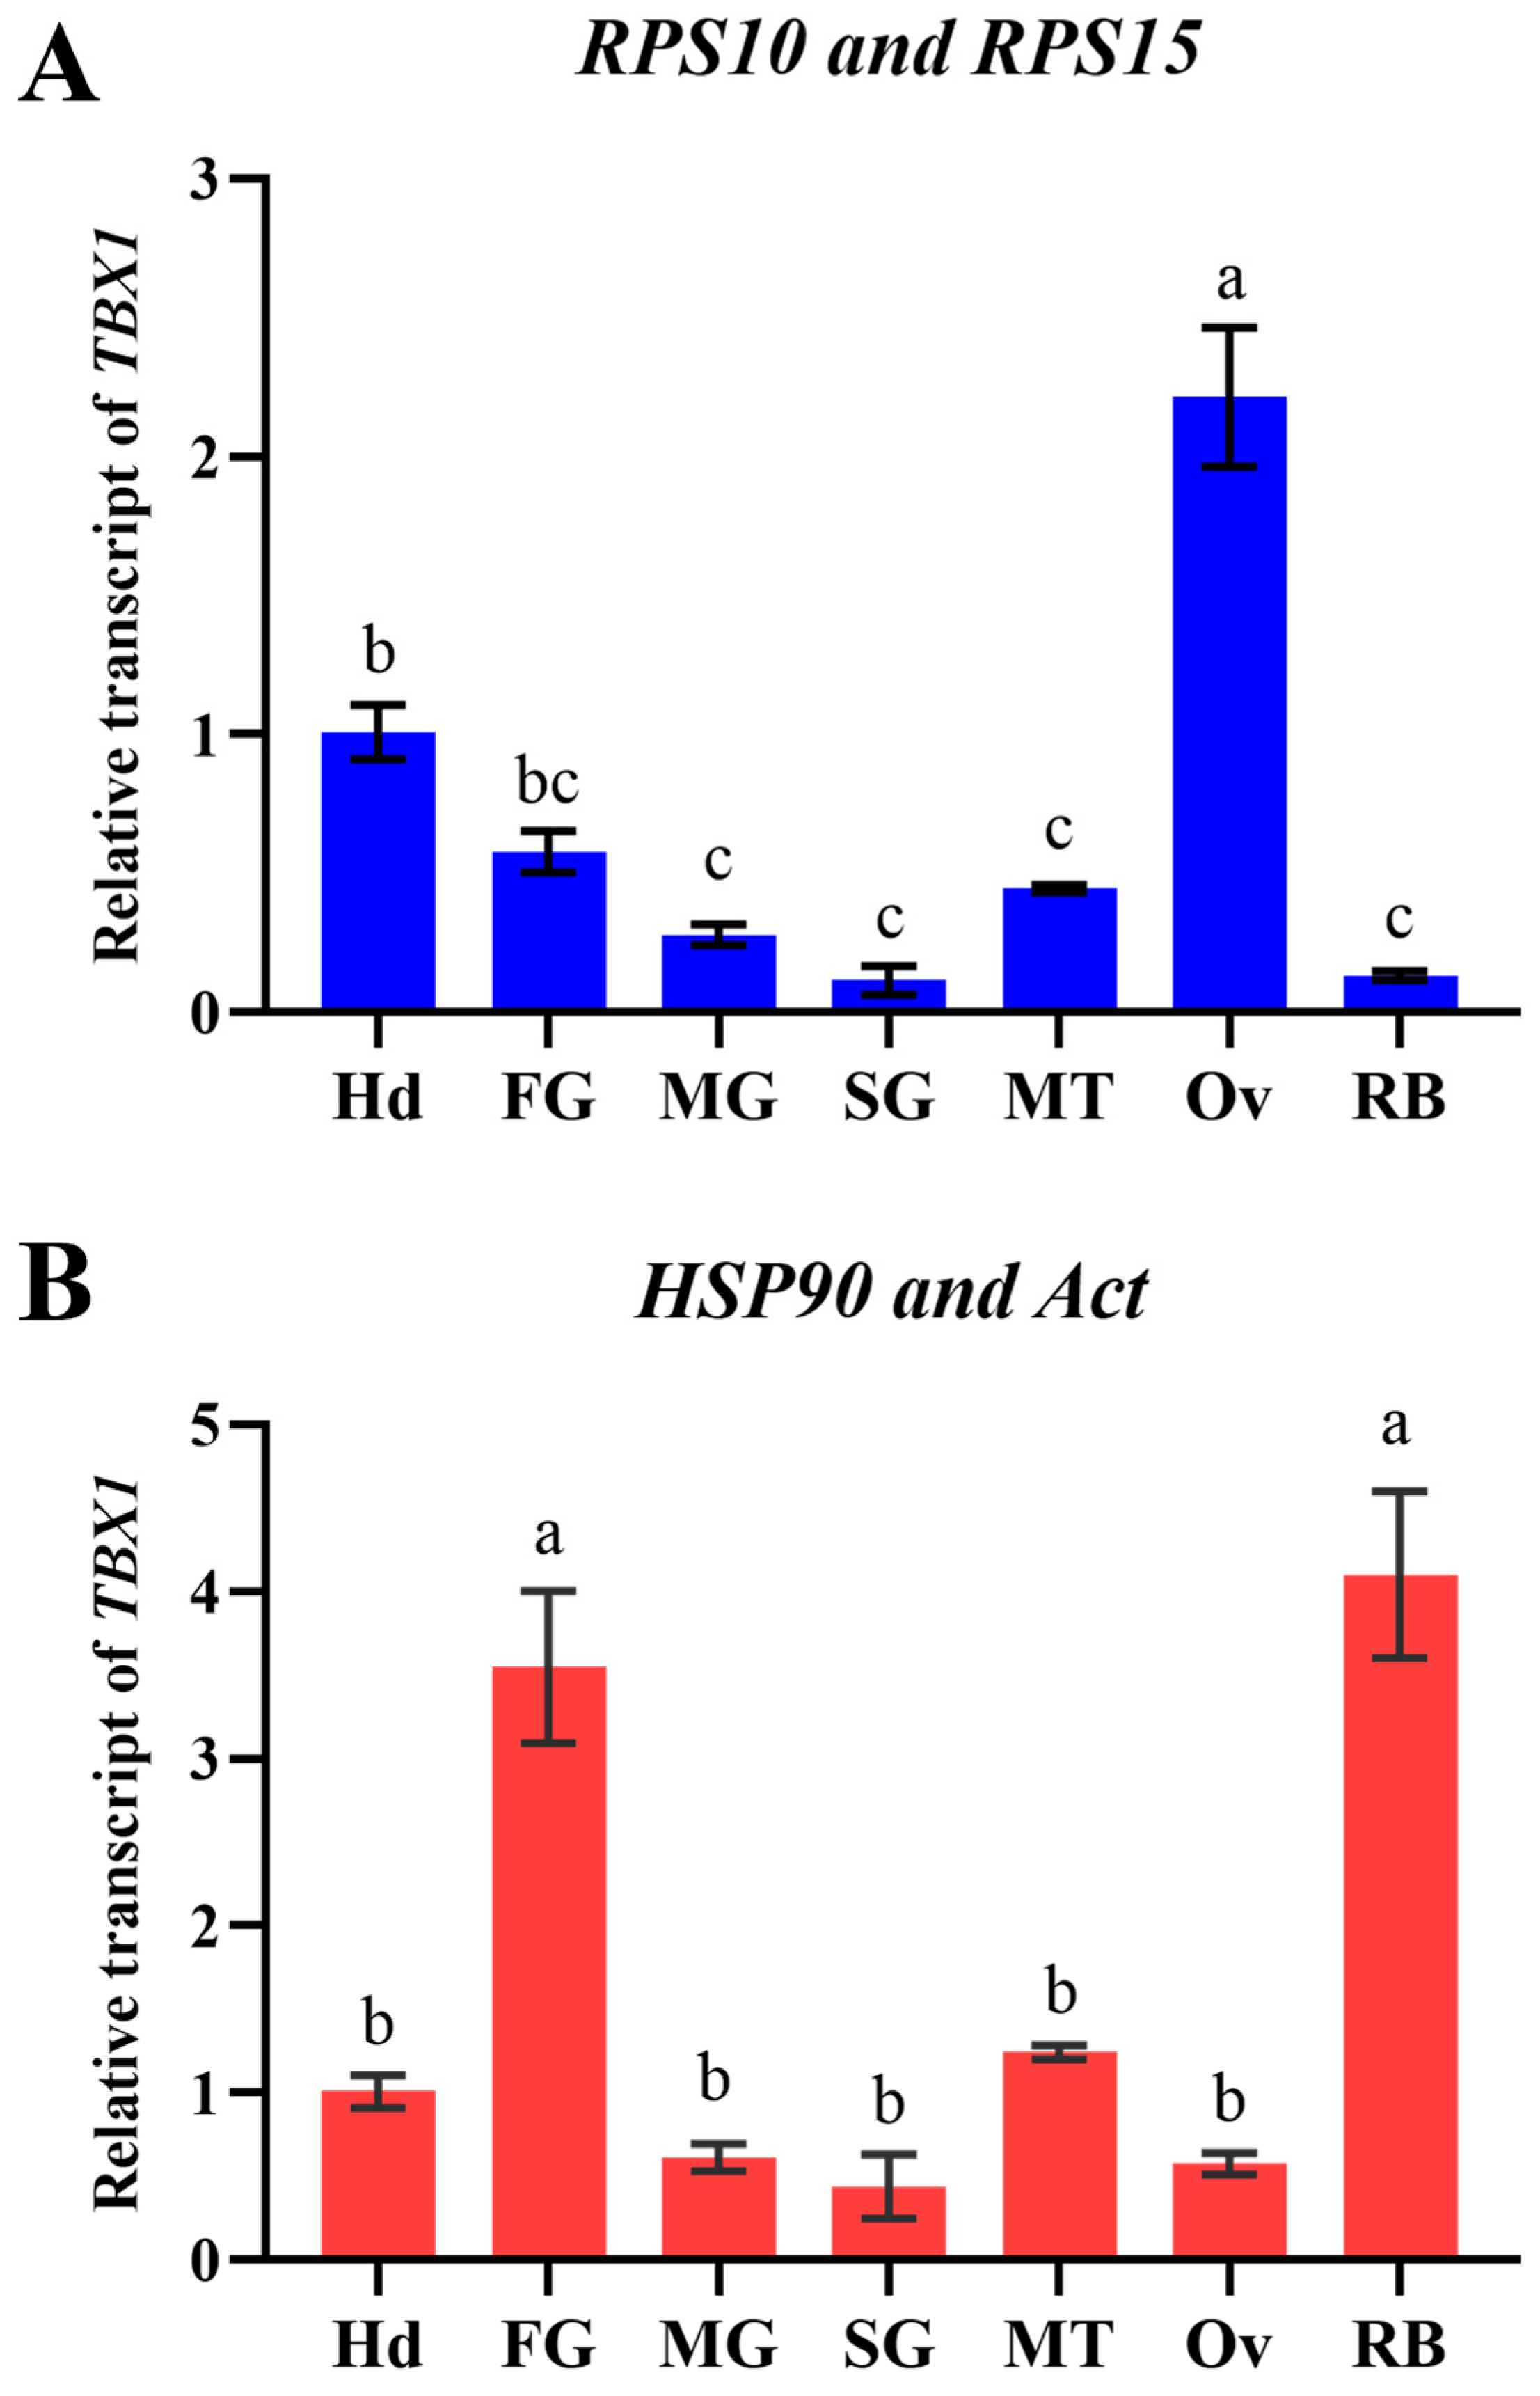
3.5. Confirmation of Optimal Reference Genes

To verify the dependability of the selected reference genes in different tissues, the relative expression of the TBX1 gene was examined. It was discovered that the Ct values of TBX1 were normalized using the two most stable reference genes (RPS10 and RPS15) and the two least stable reference genes (HSP90 and Act), and their expression patterns in different tissues varied significantly (Figure 6). Using RPS10 and RPS15 as reference genes (F = 46.87; p < 0.0001), TBX1 was found to be expressed at the highest level in the ovary (Ov), significantly higher than in other tissues. However, using HSP90 and Act as reference genes (F = 31.50; p < 0.0001), the TBX1 expression levels were higher in the foregut (FG) and residual body (RB), and significantly higher than in the Ov and other tissues.

4. Discussion

RT-qPCR is a widely used quantitative technique for exploring the expression patterns and relative expression levels of target genes under different biological processes and abiotic conditions [12,33]. In the future, we plan to employ RNA interference (RNAi) to investigate the roles of pivotal genes that are involved in the interaction between O. nagaii and host pests, and RT-qPCR will be widely used to assess the expression fluctuation of genes. The selection and verification of appropriate reference genes is crucial for ensuring reliable analysis results. However, there has been no report on the reference genes of O. nagaii. Prior research has found that no single gene is consistently expressed under complex experimental conditions [15]. Blindly selecting reference genes may result in difficulty detecting expression differences in target genes and could even lead to incorrect conclusions [34,35].
Here, we chose ten frequently employed reference genes and investigated their stability using various methods across four distinct experimental conditions. The results indicate that accurate normalization of target genes can be achieved by using only two of the most stable internal reference genes under various experimental conditions. RPS10 and RPL32 were recognized as the most stable reference genes at multiple stages of development. These genes are ribosomal protein-coding genes, involved in protein synthesis within the cell [36,37]. Our findings were consistent with previous research, where RPL32 was found to have a stable expression at multiple developmental periods of Bactrocera minax [38]. However, in contrast, RPL32 was identified to be stably expressed in Holotrichia parallela under different sex and photoperiodic conditions but was unstable at different developmental stages [39]. Currently, there is limited research on the stability evaluation of RPS10. Additionally, RPS10 and RPS15 were determined to be the most appropriate reference genes across various tissues and while feeding on different hosts. Previous research has also demonstrated that RPS15 is a suitable reference gene for tissue studies of Nilaparvata lugens [15] and Helicoverpa armigera [40], as well as for studying temperature stress in H. armigera [41]. We found that EF1-α and RPL6 were stably expressed in O. nagaii under temperature-induced stress, which differed from EF1-α being stably expressed in different tissues of Rhodnius prolixu [42] and Agrilus planipennis [43]. Similarly, RPL6 is the most appropriate reference gene for M.sibirica under temperature-induced stress [20]. In summary, there is no “universal” reference gene that can be applied to various experimental conditions.
To further confirm the internal reference genes of O. nagaii that were screened in this study, we assessed the relative expression levels of the TBX1 gene in various tissues. TBX1 belongs to the T-box transcription factor gene family, which is involved in embryogenesis and organogenesis [44]. In Andrias davidianus and Oncorhynchus mykiss, TBX1 plays a crucial role in gonadal differentiation [44,45]. Additionally, TBX1 is involved in the initial stages of Drosophila embryonic development, with the strongest expression during early development [30]. Therefore, it is speculated that the TBX1 gene may play a significant role in the reproductive process of O. nagaii. The findings indicated that the best appropriate reference genes (RPS10 and RPS15) were used to normalize the TBX1 gene, which had the highest expression in the ovary. This finding is consistent with our expectation based on TBX1’s function and is in accordance with a previous report which stated that the TBX1 gene is highly expressed in the ovaries of A. davidianus larvae [45]. However, the least stable internal reference genes (HSP90 and Act) were used for normalization, and the expression level of TBX1 was found to be significantly higher in the residual body and foregut compared to other tissues, while the average expression level of TBX1 in the ovary was only one-fourth of that achieved when using the best reference gene, which was not consistent with our expectation. Additionally, the expression pattern of TBX1 was also found to be significantly altered in different tissues. These results highlight the importance of using appropriate reference genes to obtain reliable quantitative results for target genes. Therefore, it is necessary to screen and verify the optimal reference genes, and our study provides reliable reference genes for the quantitative analysis of functional genes that are involved in the interaction between O. nagaii and its host pests under strict screening conditions.

Supplementary Materials

The following supporting information can be downloaded at: https://www.mdpi.com/article/10.3390/insects15120936/s1, Figure S1: Primer specificity of candidate reference genes were determined by 1% agarose gel electrophoresis. The figure shows DNA bands of amplified fragments. M, marker; Figure S2: Standard curves for ten candidate reference genes.

Author Contributions

Conceptualization, C.W., Y.Z., Z.Y. and L.Z.; methodology, C.W., Y.L., S.Z., X.D. and R.W.; software, Y.L., S.Z., L.S. and H.C.; validation, C.W., Y.W., Z.Y., X.D. and R.W.; formal analysis, C.W., L.S. and H.C.; investigation, Z.Y., Y.W. and C.W.; resources, Z.Y., Y.W., L.Z. and C.W.; data curation, Z.Y. and C.W.; writing—original draft preparation, C.W., Z.Y. and Y.Z.; writing—review and editing, C.W., L.Z. and Y.Z.; visualization, Y.L., S.Z., X.D. and R.W.; supervision, L.S., H.C. and Y.Z.; project administration, Y.L., X.D., L.S. and H.C.; funding acquisition, X.D., Y.Z. and L.Z. All authors have read and agreed to the published version of the manuscript.

Funding

This work was supported by the National Key R&D Program of China (2023YFE0123000), Taishan Scholars program of Shandong Province (tsqn202312293), Jinan Agricultural Science and Technology Key Project (GG202405) and Agricultural Science and Technology Innovation Project of Shandong Academy of Agricultural Sciences (CXGC2024G01).

Data Availability Statement

The data presented in this study are available on request from the corresponding author.

Conflicts of Interest

The authors declare no competing interests.

References

  1. Hu, C.; Li, Y.; Chen, G.; Duan, P.; Wu, D.; Liu, Q.; Yin, H.; Xu, T.; Zhang, X. Population dynamics of Frankliniella occidentalis Pergrande and its predator Orius similis Zheng on common crops and surrounding plants. J. Asia-Pac. Entomol. 2021, 24, 555–563. [Google Scholar] [CrossRef]
  2. Dai, X.; Wang, R.; Liu, Y.; Su, L.; Yin, Z.; Wu, M.; Chen, H.; Zheng, L.; Zhai, Y. Control effect and field application of four predatory Orius species on Megalurothrips usitatus (Thysanoptera: Thripidae). J. Econ. Entomol. 2024, 117, 448–456. [Google Scholar] [CrossRef] [PubMed]
  3. Fathi, S.A.A.; Nouri-Ganbalani, G. Assessing the potential for biological control of potato field pests in Ardabil, Iran: Functional responses of Orius niger (Wolf.) and O. minutus (L.) (Hemiptera: Anthocoridae). J. Pest Sci. 2010, 83, 47–52. [Google Scholar] [CrossRef]
  4. Ge, Y.; Camara, I.; Wang, Y.; Liu, P.; Zhang, L.; Xing, Y.; Li, A.; Shi, W. Predation of Aphis craccivora (Hemiptera: Aphididae) by Orius sauteri (Hemiptera: Anthocoridae) under different temperatures. J. Econ. Entomol. 2018, 111, 2599–2604. [Google Scholar] [CrossRef]
  5. Sharifi, M.; Malkeshi, S.H.; Madahi, K.; Mobasheri, M.T.; Malek Shahkoei, S.; Ghaderi, K.; Rajaei, A.; Khamar, E. Evaluation of predator and prey preference of Orius niger (Wolff) (Hemiptera: Anthocoridae) in the control of important sucking pests of oilseeds. J. Plant Protect. Res. 2021, 8, 107–118. [Google Scholar]
  6. Silva, L.P.; Souza, I.L.; Marucci, R.C.; Guzman-Martinez, M. Doru luteipes (Dermaptera: Forficulidae) and Orius insidiosus (Hemiptera: Anthocoridae) as nocturnal and diurnal predators of thrips. Neotrop. Entomol. 2023, 52, 263–272. [Google Scholar] [CrossRef]
  7. Lins Jr, J.; Bueno, V.; Silva, D.; van Lenteren, J.; Calixto, A.; Sidney, L. Tuta absoluta egg predation by Orius insidiosus. IOBC/WPRS Bull. 2011, 68, 101–104. [Google Scholar]
  8. Salehi, Z.; Yarahmadi, F.; Rasekh, A.; Sohani, N. Functional responses of Orius albidipennis Reuter (Hemiptera, Anthocoridae) to Tuta absoluta Meyrick (Lepidoptera, Gelechiidae) on two tomato cultivars with different leaf morphological characteristics. Entomol. Gen. 2016, 36, 127–136. [Google Scholar] [CrossRef]
  9. Desneux, N.; Wajnberg, E.; Wyckhuys, K.A.G.; Burgio, G.; Arpaia, S.; Narváez-Vasquez, C.A.; González-Cabrera, J.; Catalán Ruescas, D.; Tabone, E.; Frandon, J.; et al. Biological invasion of European tomato crops by Tuta absoluta: Ecology, geographic expansion and prospects for biological control. J. Pest Sci. 2010, 83, 197–215. [Google Scholar] [CrossRef]
  10. Yue-Li, J.; Yu-Qing, W.U.; Yun, D.; Xin-Guo, G. Control efficiencies of releasing Orius sauteri (Heteroptera: Anthocoridae) on some pests in greenhouse pepper. Chin. J. Biol. Control 2011, 27, 414–417. [Google Scholar]
  11. Jian, Y.; Xinguo, G.; Yuqing, W.U.; Yuli, J.; Shuntong, L.; Aiju, D.; Ziqi, Z.; Changying, L. Thrips control on the greenhouse eggplant by releasing Orius sauteri (Heteroptera: Anthocoridae). Chin. J. Biol. Control 2013, 29, 459–462. [Google Scholar]
  12. Gomez, R.; Sendín, L. Relative expression analysis of target genes by using reverse transcription-quantitative PCR. Methods Mol. Biol. 2020, 2072, 51–63. [Google Scholar]
  13. Bustin, S.A.; Benes, V.; Nolan, T.; Pfaffl, M.W. Quantitative real-time RT-PCR—A perspective. J. Mol. Endocrinol. 2005, 34, 597–601. [Google Scholar] [CrossRef]
  14. Suzuki, T.; Higgins, P.J.; Crawford, D.R. Control selection for RNA quantitation. Biotechniques 2000, 29, 332–337. [Google Scholar] [CrossRef] [PubMed]
  15. Yuan, M.; Lu, Y.; Zhu, X.; Wan, H.; Shakeel, M.; Zhan, S.; Jin, B.; Li, J. Selection and evaluation of potential reference genes for gene expression analysis in the brown planthopper, Nilaparvata lugens (Hemiptera: Delphacidae) using reverse-transcription quantitative PCR. PLoS ONE 2014, 9, e86503. [Google Scholar] [CrossRef]
  16. Dong, R.; Cao, F.; Yu, J.; Yuan, Y.; Wang, J.; Li, Z.; Zhu, C.; Li, S.; Li, N. Selection and validation of reference genes for quantitative real-time PCR analysis in cockroach parasitoid Tetrastichus hagenowii (Ratzeburg). Insects 2024, 15, 668. [Google Scholar] [CrossRef]
  17. Sagri, E.; Koskinioti, P.; Gregoriou, M.; Tsoumani, K.T.; Bassiakos, Y.C.; Mathiopoulos, K.D. Housekeeping in Tephritid insects: The best gene choice for expression analyses in the medfly and the olive fly. Sci. Rep. 2017, 7, 45634. [Google Scholar] [CrossRef] [PubMed]
  18. Lu, Y.; Yuan, M.; Gao, X.; Kang, T.; Zhan, S.; Wan, H.; Li, J. Identification and validation of reference genes for gene expression analysis using quantitative PCR in Spodoptera litura (Lepidoptera: Noctuidae). PLoS ONE 2013, 8, e68059. [Google Scholar] [CrossRef]
  19. Lü, J.; Chen, S.; Guo, M.; Ye, C.; Qiu, B.; Wu, J.; Yang, C.; Pan, H. Selection and validation of reference genes for RT-qPCR analysis of the Ladybird Beetle Henosepilachna vigintioctomaculata. Front. Physiol. 2018, 9, 1614. [Google Scholar] [CrossRef]
  20. Shen, C.; Tang, M.; Li, X.; Zhu, L.; Li, W.; Deng, P.; Zhai, Q.; Wu, G.; Yan, X. Evaluation of reference genes for quantitative expression analysis in Mylabris sibirica (Coleoptera, Meloidae). Front. Physiol. 2024, 15, 1345836. [Google Scholar] [CrossRef]
  21. Lü, J.; Yang, C.; Zhang, Y.; Pan, H. Selection of reference genes for the normalization of RT-qPCR data in gene expression studies in insects: A systematic review. Front. Physiol. 2018, 9, 1560. [Google Scholar] [CrossRef] [PubMed]
  22. Du, H.; Wang, R.; Dai, X.; Yin, Z.; Liu, Y.; Su, L.; Chen, H.; Zhao, S.; Zheng, L.; Dong, X.; et al. Effect of guanylate cyclase-22-like on ovarian development of Orius nagaii (Hemiptera: Anthocoridae). Insects 2024, 15, 110. [Google Scholar] [CrossRef] [PubMed]
  23. Shen, X.; Zhang, G.; Zhao, Y.; Zhu, X.; Yu, X.; Yang, M.; Zhang, F. Selection and validation of optimal reference genes for RT-qPCR analyses in Aphidoletes aphidimyza Rondani (Diptera: Cecidomyiidae). Front. Physiol. 2023, 14, 1277942. [Google Scholar] [CrossRef] [PubMed]
  24. Xie, F.; Wang, J.; Zhang, B. RefFinder: A web-based tool for comprehensively analyzing and identifying reference genes. Funct. Integr. Genom. 2023, 23, 125. [Google Scholar] [CrossRef] [PubMed]
  25. Vandesompele, J.; De Preter, K.; Pattyn, F.; Poppe, B.; Van Roy, N.; De Paepe, A.; Speleman, F. Accurate normalization of real-time quantitative RT-PCR data by geometric averaging of multiple internal control genes. Genome Biol. 2002, 3, h31–h34. [Google Scholar] [CrossRef]
  26. Andersen, C.L.; Jensen, J.L.; Ørntoft, T.F. Normalization of real-time quantitative reverse transcription-PCR data: A model-based variance estimation approach to identify genes suited for normalization, applied to bladder and colon cancer data sets. Cancer Res. 2004, 64, 5245–5250. [Google Scholar] [CrossRef] [PubMed]
  27. Pfaffl, M.W.; Tichopad, A.; Prgomet, C.; Neuvians, T.P. Determination of stable housekeeping genes, differentially regulated target genes and sample integrity: BestKeeper-Excel-based tool using pair-wise correlations. Biotechnol. Lett. 2004, 26, 509–515. [Google Scholar] [CrossRef] [PubMed]
  28. Silver, N.; Best, S.; Jiang, J.; Thein, S.L. Selection of housekeeping genes for gene expression studies in human reticulocytes using real-time PCR. BMC Mol. Biol. 2006, 7, 33. [Google Scholar] [CrossRef]
  29. Plageman, T.F., Jr.; Yutzey, K.E. T-box genes and heart development: Putting the “T” in heart. Dev. Dyn. 2005, 232, 11–20. [Google Scholar] [CrossRef]
  30. Porsch, M.; Hofmeyer, K.; Bausenwein, B.S.; Grimm, S.; Weber, B.H.F.; Miassod, R.; Pflugfelder, G.O. Isolation of a Drosophila T-box gene closely related to human TBX1. Gene 1998, 212, 237–248. [Google Scholar] [CrossRef] [PubMed]
  31. Livak, K.J.; Schmittgen, T.D. Analysis of relative gene expression data using real-time quantitative PCR and the 2−ΔΔCT Method. Methods 2001, 25, 402–408. [Google Scholar] [CrossRef] [PubMed]
  32. Yang, G.; Yu, X.; Zhang, Y.; Luo, J.; Li, X.; Zhu, L.; Zhang, H.; Jin, L.; Wu, G.; Yan, X.; et al. Screening and validation of stable reference genes for qRT-PCR analysis in Epicauta gorhami (Coleoptera: Meloidae). Preprints 2024. [Google Scholar] [CrossRef]
  33. Zhou, L.; Meng, J.; Ruan, H.; Yang, C.; Zhang, C. Expression stability of candidate RT-qPCR housekeeping genes in Spodoptera frugiperda (Lepidoptera: Noctuidae). Arch. Insect Biochem. Physiol. 2021, 108, e21831. [Google Scholar] [CrossRef]
  34. Huggett, J.; Dheda, K.; Bustin, S.; Zumla, A. Real-time RT-PCR normalisation; strategies and considerations. Genes Immun. 2005, 6, 279–284. [Google Scholar] [CrossRef] [PubMed]
  35. Liang, P.; Guo, Y.; Zhou, X.; Gao, X. Expression profiling in Bemisia tabaci under insecticide treatment: Indicating the necessity for custom reference gene selection. PLoS ONE 2014, 9, e87514. [Google Scholar] [CrossRef] [PubMed]
  36. Anger, A.M.; Armache, J.; Berninghausen, O.; Habeck, M.; Subklewe, M.; Wilson, D.N.; Beckmann, R. Structures of the human and Drosophila 80S ribosome. Nature 2013, 497, 80–85. [Google Scholar] [CrossRef] [PubMed]
  37. Liang, X.; Zuo, M.; Zhang, Y.; Li, N.; Ma, C.; Dong, M.; Gao, N. Structural snapshots of human pre-60S ribosomal particles before and after nuclear export. Nat. Commun. 2020, 11, 3542. [Google Scholar] [CrossRef] [PubMed]
  38. Zhi-Chuang, L.; Liu-Hao, W.; Rui-Lin, D.; Gui-Fen, Z.; Jian-Ying, G.; Fang-Hao, W. Evaluation of endogenous reference genes of Bactrocera (Tetradacus) minax by gene expression profiling under various experimental conditions. Fla. Entomol. 2014, 97, 597–604. [Google Scholar]
  39. Gong, Z.; Zhang, J.; Chen, Q.; Li, H.; Zhang, Z.; Duan, Y.; Jiang, Y.; Li, T.; Miao, J.; Wu, Y. Comprehensive screening and validation of stable internal reference genes for accurate qRT-PCR analysis in Holotrichia parallela under diverse biological conditions and environmental stresses. Insects 2024, 15, 661. [Google Scholar] [CrossRef]
  40. Zhang, S.; An, S.; Li, Z.; Wu, F.; Yang, Q.; Liu, Y.; Cao, J.; Zhang, H.; Zhang, Q.; Liu, X. Identification and validation of reference genes for normalization of gene expression analysis using qRT-PCR in Helicoverpa armigera (Lepidoptera: Noctuidae). Gene 2015, 555, 393–402. [Google Scholar] [CrossRef] [PubMed]
  41. Shakeel, M.; Zhu, X.; Kang, T.; Wan, H.; Li, J. Selection and evaluation of reference genes for quantitative gene expression studies in cotton bollworm, Helicoverpa armigera (Lepidoptera: Noctuidae). J. Asia-Pac. Entomol. 2015, 18, 123–130. [Google Scholar] [CrossRef]
  42. Majerowicz, D.; Alves-Bezerra, M.; Logullo, R.; Fonseca-de-Souza, A.L.; Meyer-Fernandes, J.R.; Braz, G.R.C.; Gondim, K.C. Looking for reference genes for real-time quantitative PCR experiments in Rhodnius prolixus (Hemiptera: Reduviidae). Insect Mol. Biol. 2011, 20, 713–722. [Google Scholar] [CrossRef] [PubMed]
  43. Rajarapu, S.P.; Mamidala, P.; Mittapalli, O. Validation of reference genes for gene expression studies in the emerald ash borer (Agrilus planipennis). Insect Sci. 2012, 19, 41–46. [Google Scholar] [CrossRef]
  44. Yano, A.; Nicol, B.; Guerin, A.; Guiguen, Y. The duplicated rainbow trout (Oncorhynchus mykiss) T-box transcription factors 1, tbx1a and tbx1b, are up-regulated during testicular development. Mol. Reprod. Dev. 2011, 78, 172–180. [Google Scholar] [CrossRef]
  45. Hu, Q.; Meng, Y.; Wang, D.; Tian, H.; Xiao, H. Characterization and function of the T-box 1 gene in Chinese giant salamander Andrias davidianus. Genomics 2019, 111, 1351–1359. [Google Scholar] [CrossRef] [PubMed]
Figure 1. Observation and identification of various body tissues of newly emerged female adults of O. nagaii. (A) Alimentary canal. The red arrow indicates the boundary between the foregut (FG) and midgut (MG). MT, Malpighian tubule. (B) The salivary gland (SG) of a female adult. Hd, head. (C) The ovary (Ov) of a female. There are seven ovarioles in each ovary.
Insects 15 00936 g001
Figure 2. Melting profiles of the ten candidate reference genes in O. nagaii. A single peak indicates the absence of nonspecific amplification and primer dimerization. The x-axis represents the temperature, and the y-axis represents the fluorescence signal intensity.
Insects 15 00936 g002
Figure 3. The expression profiles of candidate reference genes in O. nagaii under multiple experimental conditions. (A) Developmental stage. n = 21 for each gene. (B) Tissue. n = 21 for each gene. (C) Host. n = 12 for each gene. (D) Temperature. n = 9 for each gene. The Ct value represents the expression level of the reference gene. The upper and lower whiskers indicate the maximum and minimum Ct value, respectively. The horizontal lines inside the box represent the median. The distance between the top and bottom whisker caps of the box represents the degree of dispersion of the gene expression levels. Dots represent outliers.
Insects 15 00936 g003
Figure 4. Stability of expression of ten candidate reference genes under various experimental conditions, evaluated using RefFinder. (A) Developmental stage. (B) Tissue. (C) Host. (D) Temperature.
Insects 15 00936 g004
Figure 5. The optimal number of reference genes for accurate normalization, determined by geNorm analysis. A pairwise variation (Vn/n + 1) value less than 0.15 is the standard to measure the number of optimal reference genes.
Insects 15 00936 g005
Figure 6. The relative transcript levels of TBX1 in various tissues of O. nagaii. The transcript levels of TBX1 were normalized using the most (A) and least (B) stable reference genes. To assess differences between tissues, a one-way ANOVA was conducted. The data are presented as mean ± SE. Different letters above the bars indicate notable variances between tissues.
Insects 15 00936 g006
Table 1. Reference genes used in this study.
GenePrimer Sequences (5′–3′)Length (bp)Efficiency (%)R2Linear Regression
ActF: GACTGCTGAGCGTGAAATAG107106.730.9956y = −3.1705x + 33.694
R: GACCGTCTGGAAGTTCGTAG
GAPDHF: ATTTGTTGTTGAGCGGGATT100106.590.999y = −3.1734x + 27.497
R: TTGGGTTACACCGAAGACG
β-TubF: GCGGGAAACAACTGGGCTAA104108.950.9987y = −3.1246x + 30.147
R: CCCTGAAGGCAATCGCAACC
EF1-αF: TGACAAAGGCTGCCGAGAA132103.070.9999y = −3.2506x + 25.485
R: TGGAAACACGGCTGGAGAA
RPS10F: AGAAATGCCTCCAAGCGAACT119107.240.9995y = −3.1598x + 28.862
R: CTACAACGAGCCCAAACACCC
RPS15F: CACTGCCGTGCTAGGAGGA107105.480.9994y = −3.1973x + 28.448
R: CGTTGGGCGGAGTTTCTT
RPL6F: ATGGTTGCTACGGCTGTGAA145109.020.9992y = −3.1231x + 29.159
R: GGAACATCTGGCTTCTGCTAT
RPL13F: ACCTTTGCCAATCCTTGTG109105.610.9982y = −3.1944x + 28.732
R: GGAAACCGATCCGACTTTT
RPL32F: TCTGCGAAAGGATCACCATG148106.000.9986y = −3.186x + 27.886
R: CCTTCGGTTTACGCCAGTTT
HSP90F: ATTCGCCGTGCTGTATCGTAA93102.630.9999y = −3.2604x + 27.998
R: TTCTTGGCAGCCATGTATCCC
Table 2. Evaluation of expression stability of candidate reference genes under different experimental conditions.
ConditionsCRGs *geNormNormFinderBestKeeper∆CtRecommendation
StabilityRankStabilityRankStabilityRankStabilityRank
Developmental stageAct0.792102.205101.827102.22510RPS10, RPL32
GAPDH0.43390.44390.47460.8119
β-Tub0.34170.4480.51580.6748
EF1-α0.25440.2940.45150.594
RPS100.15410.11510.29710.552
RPS150.28550.38870.42140.6355
RPL60.21630.31150.41330.593
RPL130.31760.36260.51890.6497
RPL320.15410.19720.34820.5481
HSP900.36680.20530.49370.6466
TissueAct1.42101.836101.36102.05610RPS10, RPS15
GAPDH0.79260.54810.64421.2364
β-Tub0.51551.29481.0291.4768
EF1-α0.98270.76330.70351.2795
RPS100.23510.75820.62111.1971
RPS150.23510.79650.65431.2053
RPL61.11781.09760.82561.447
RPL130.4641.16570.86271.3736
RPL320.40630.77340.70141.2032
HSP901.26191.51591.00781.7379
HostAct0.721101.534101.411101.56410RPS10, RPS15
GAPDH0.45580.39770.38580.6847
β-Tub0.21110.38860.22440.616
EF1-α0.36450.11810.24550.5553
RPS100.32240.12320.16510.541
RPS150.29830.14330.16620.5482
RPL60.42170.50780.26970.6877
RPL130.21110.3550.22330.5784
RPL320.38560.24840.26260.5975
HSP900.51190.74890.48990.8499
TemperatureAct0.374100.443100.53170.49910EF1-α, RPL6
GAPDH0.22440.24950.51860.3595
β-Tub0.31280.3280.29810.4178
EF1-α0.16610.03210.47740.2791
RPS100.2870.25560.45830.3656
RPS150.26760.29570.4950.3827
RPL60.16610.16420.545100.3162
RPL130.2550.23340.43720.3524
RPL320.19730.22330.53280.3423
HSP900.34390.34790.53790.4299
* Candidate reference genes.
Disclaimer/Publisher’s Note: The statements, opinions and data contained in all publications are solely those of the individual author(s) and contributor(s) and not of MDPI and/or the editor(s). MDPI and/or the editor(s) disclaim responsibility for any injury to people or property resulting from any ideas, methods, instructions or products referred to in the content.

