
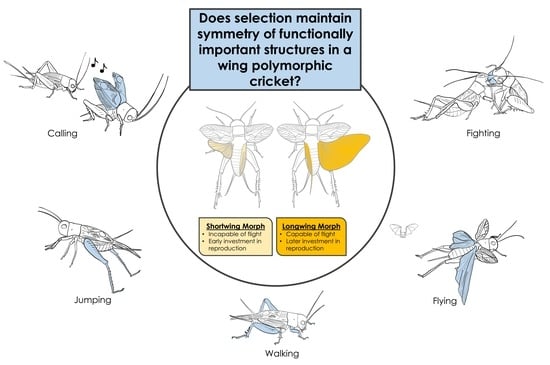
Fluctuating Asymmetry in the Polymorphic Sand Cricket (Gryllus firmus): Are More Functionally Important Structures Always More Symmetric?


Abstract
:Simple Summary
Abstract
1. Introduction
2. Methods
2.1. Animal Rearing
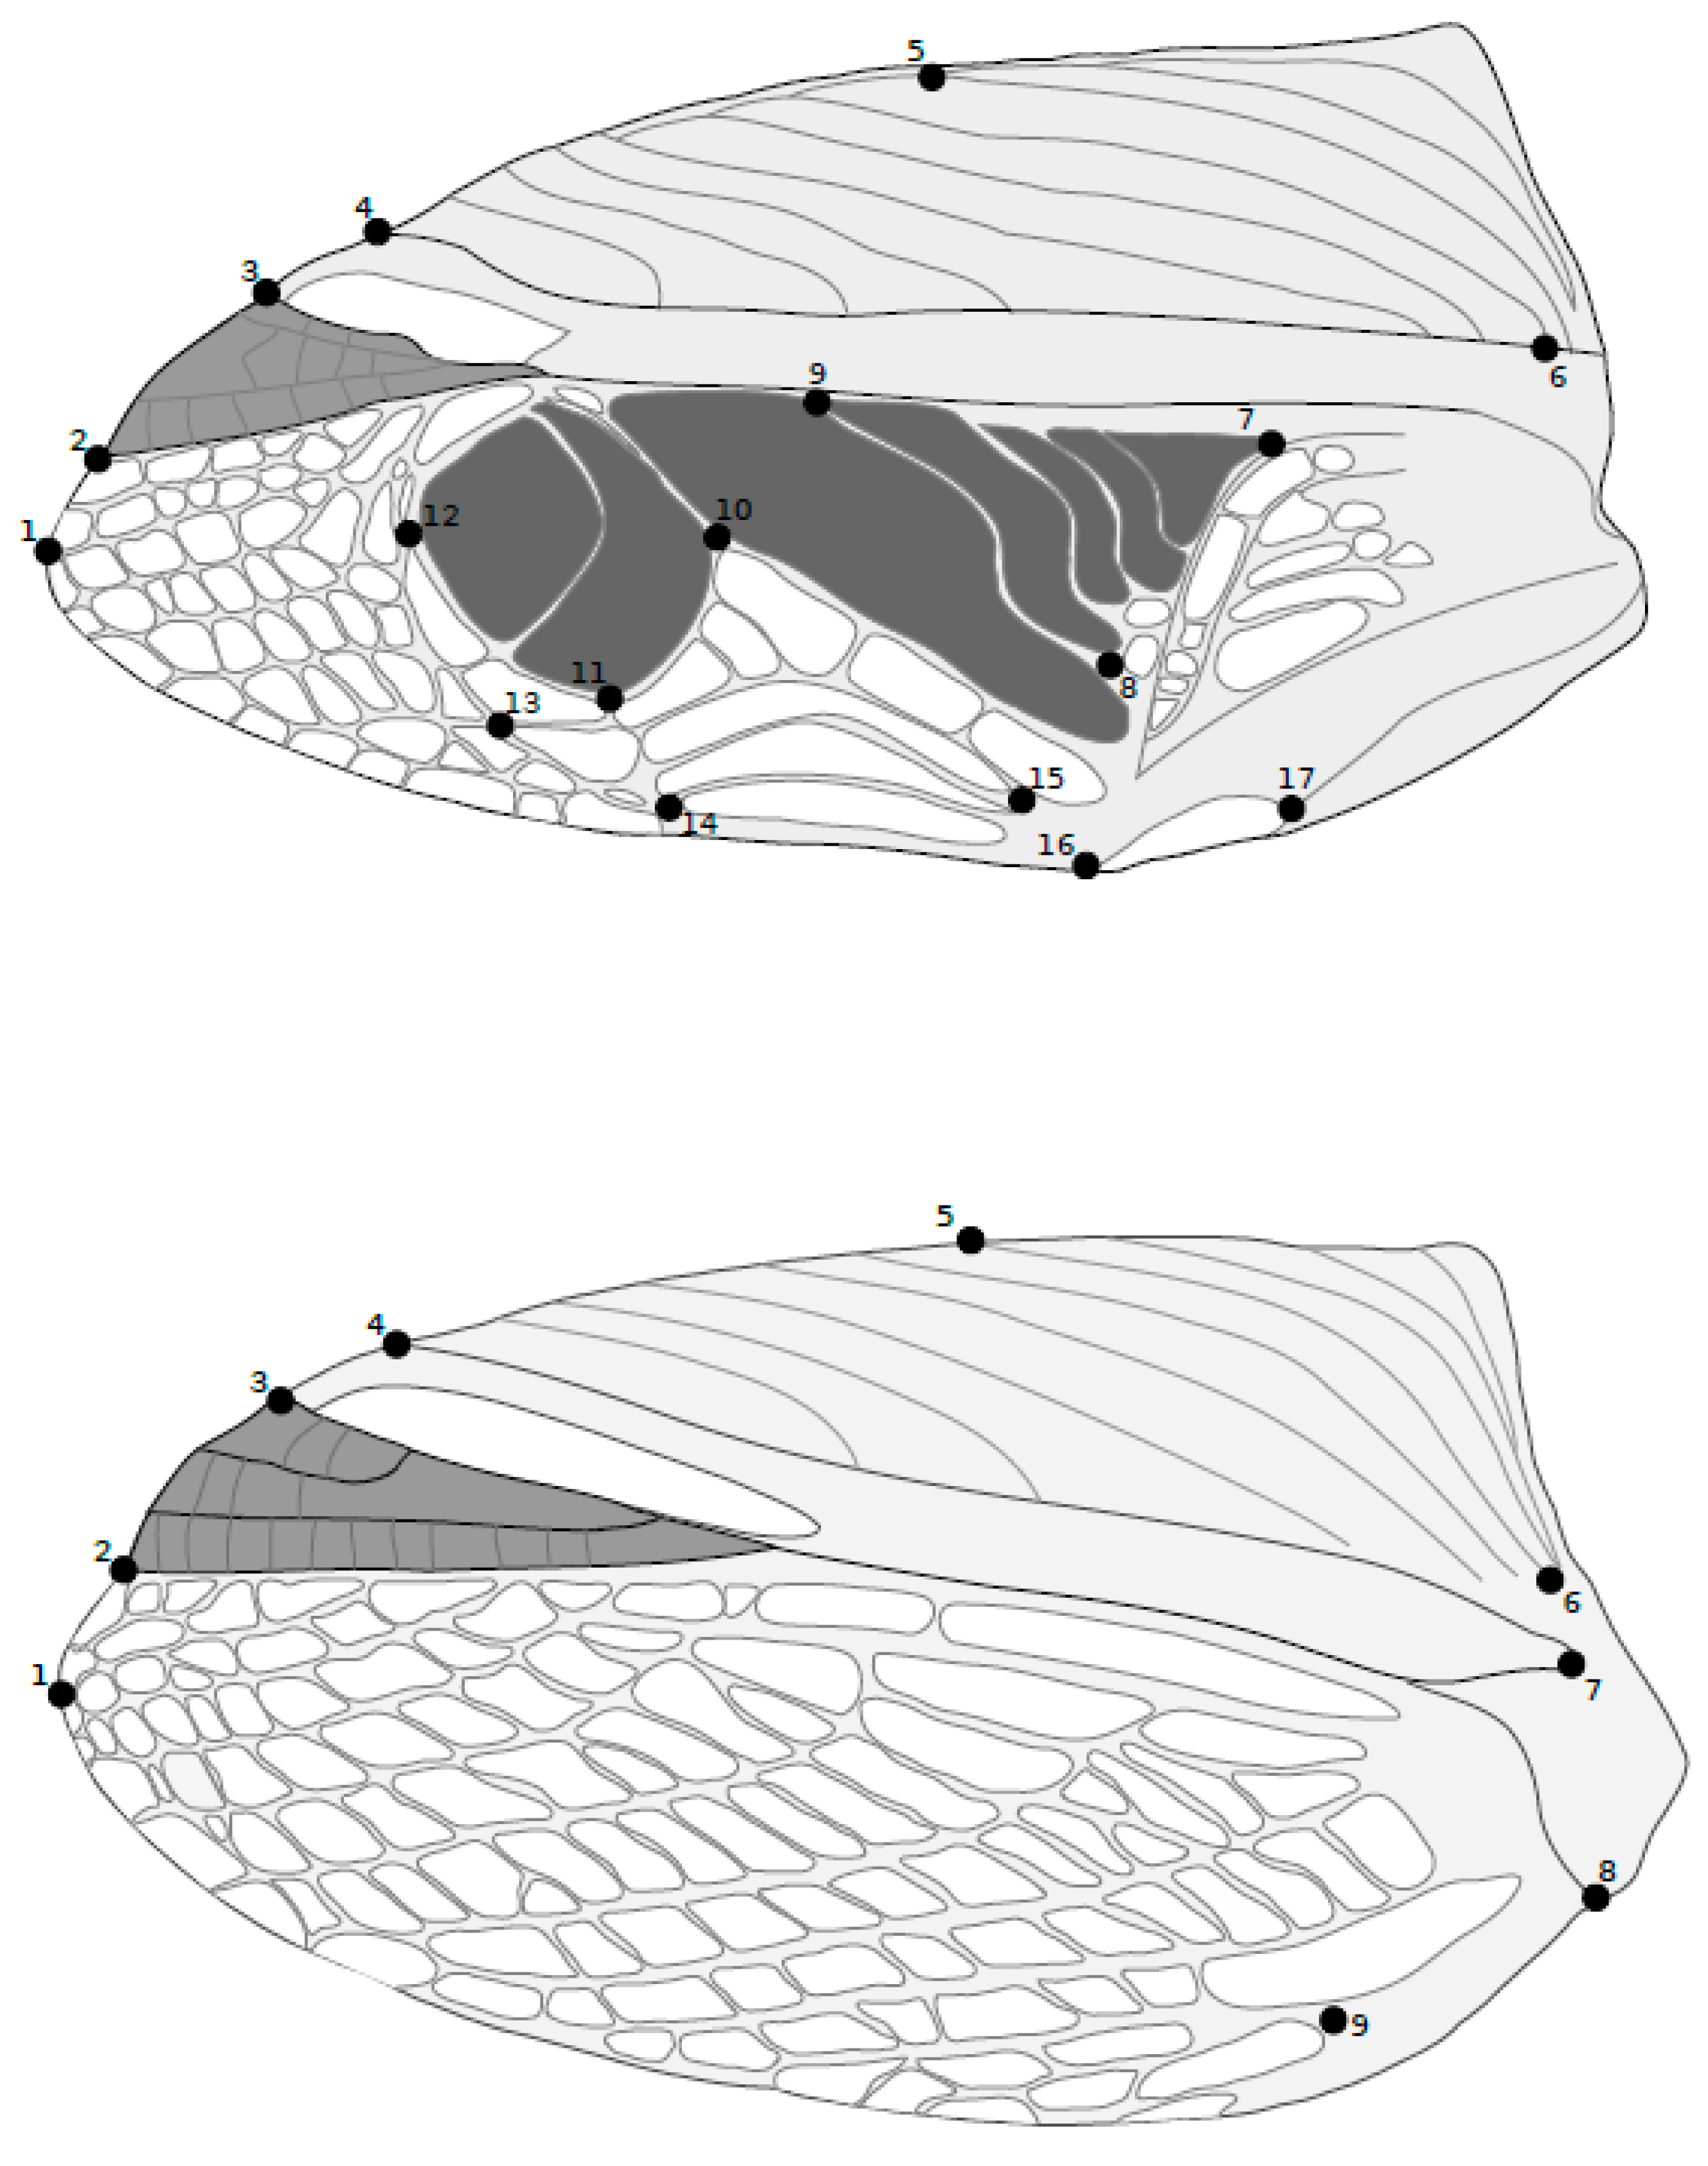
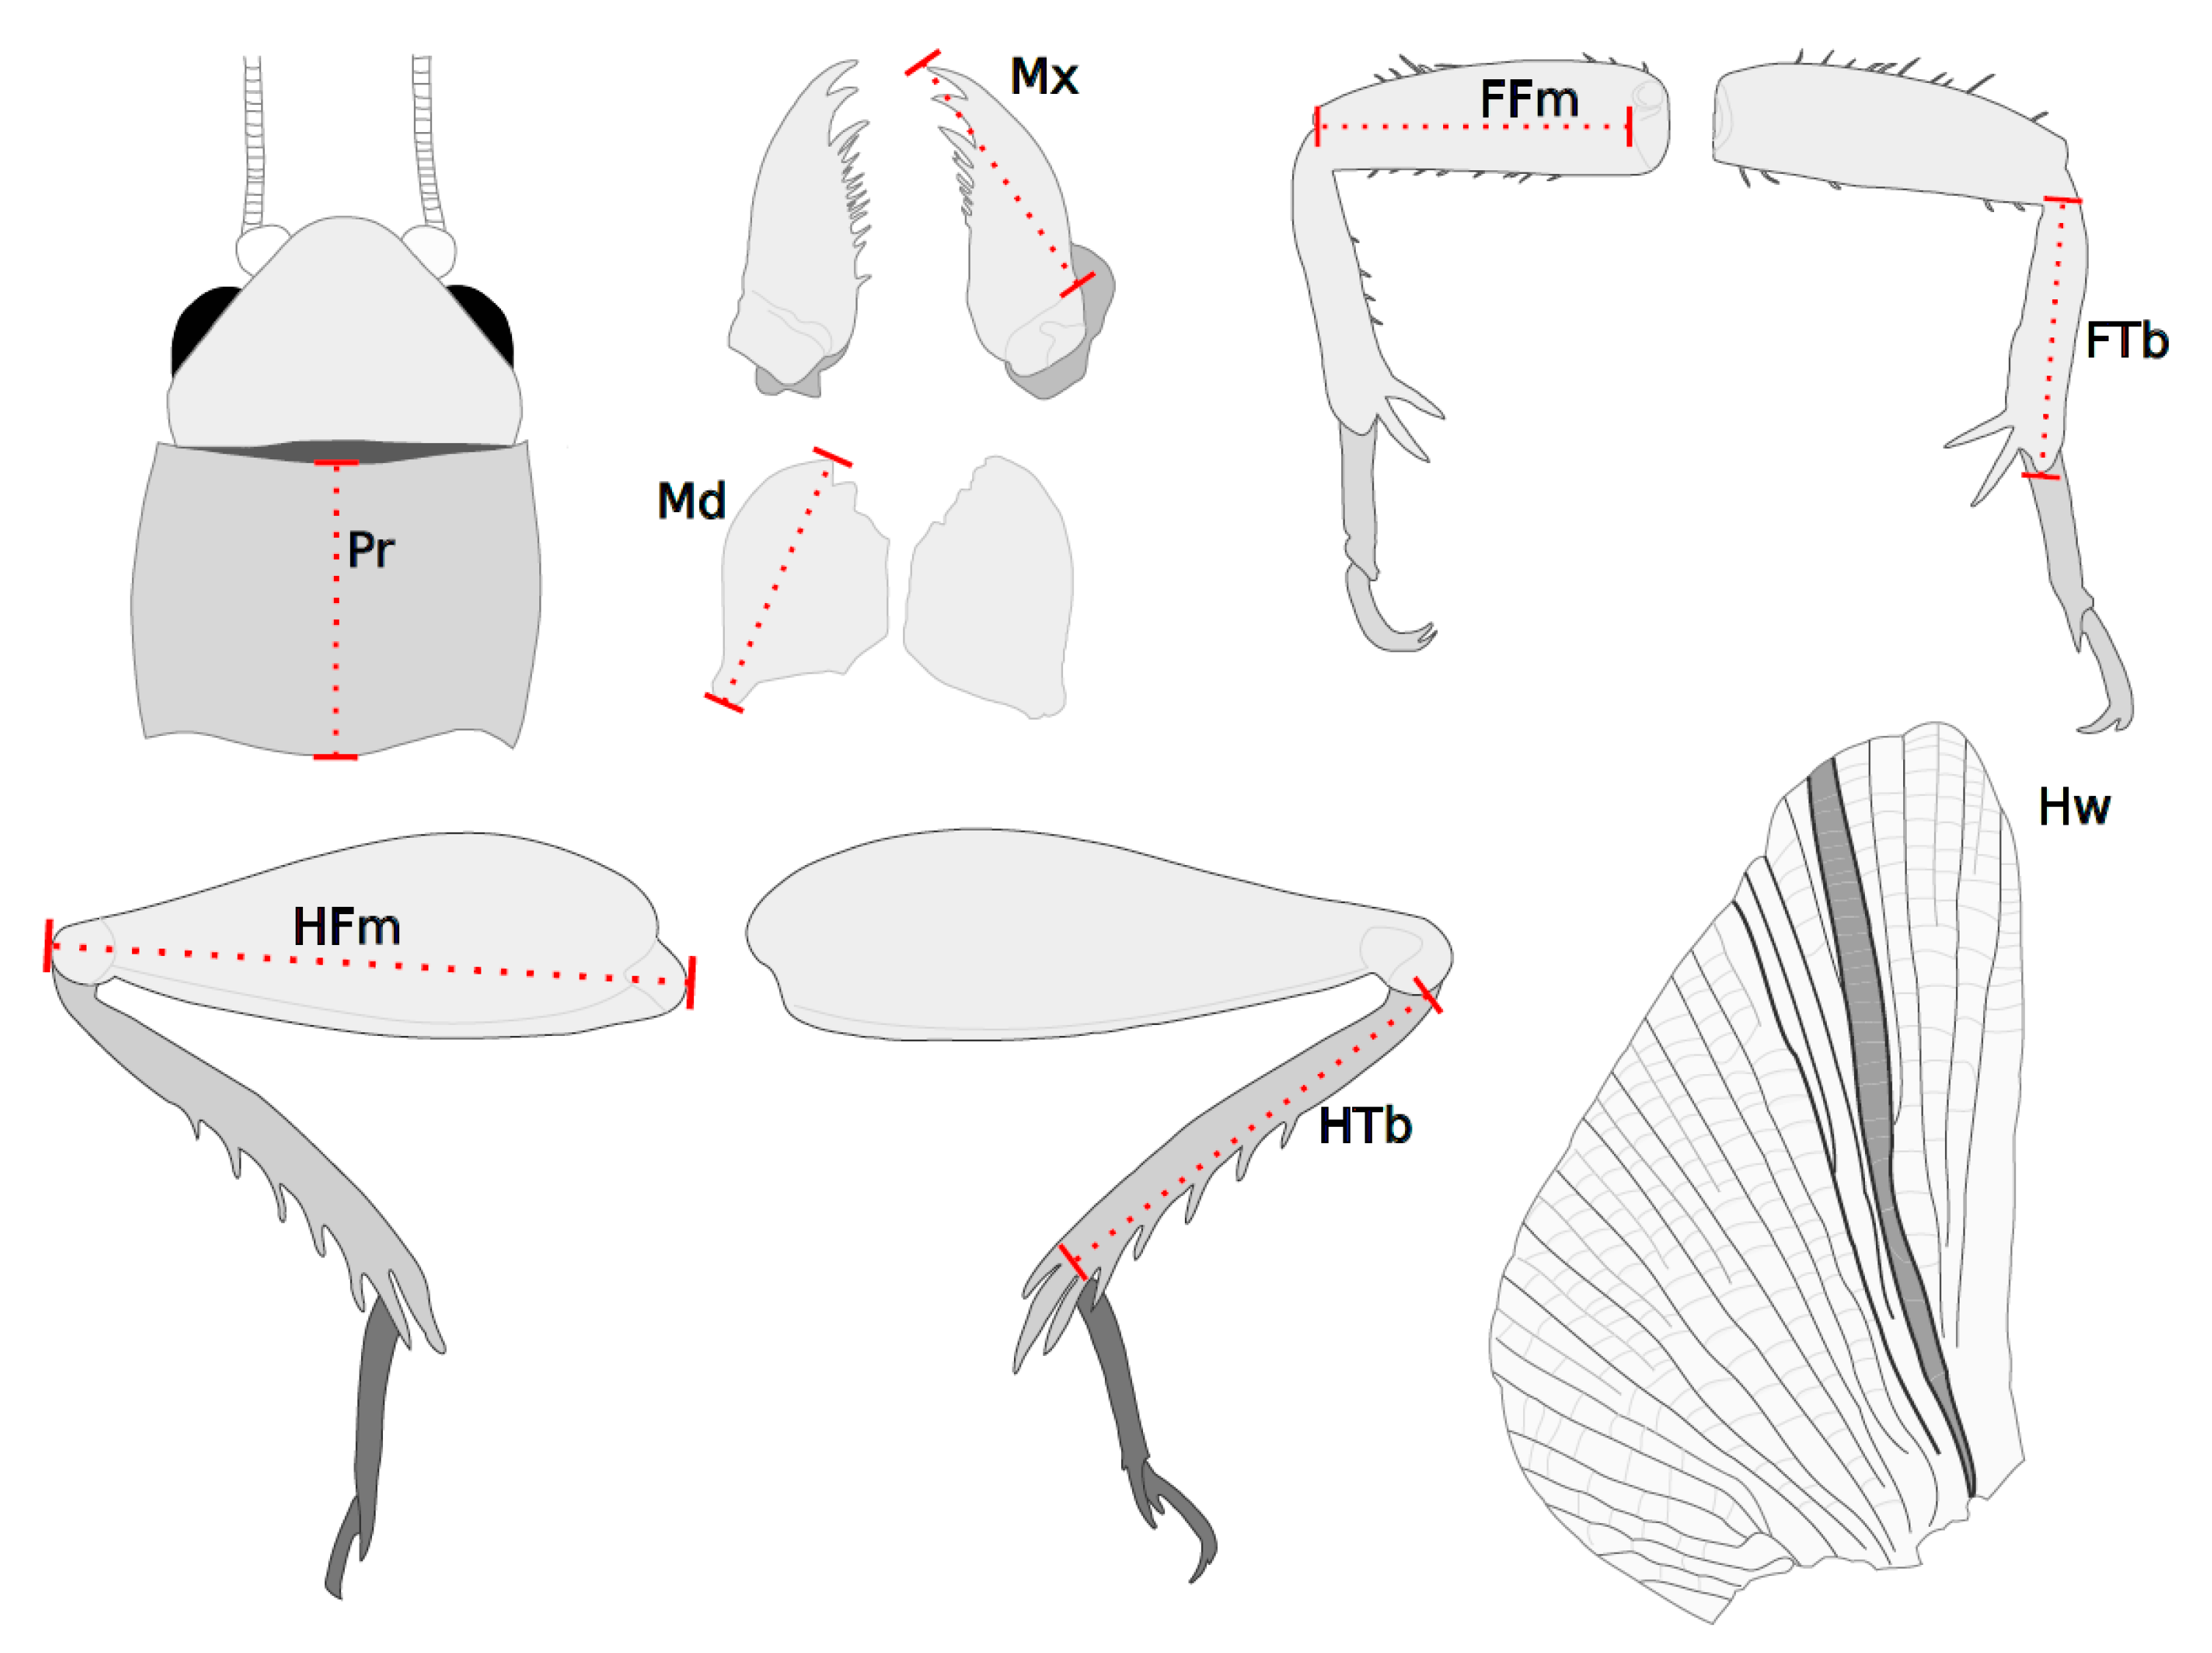
2.2. Data Collection
2.3. Statistical Analysis
2.3.1. Univariate Data
2.3.2. Multivariate
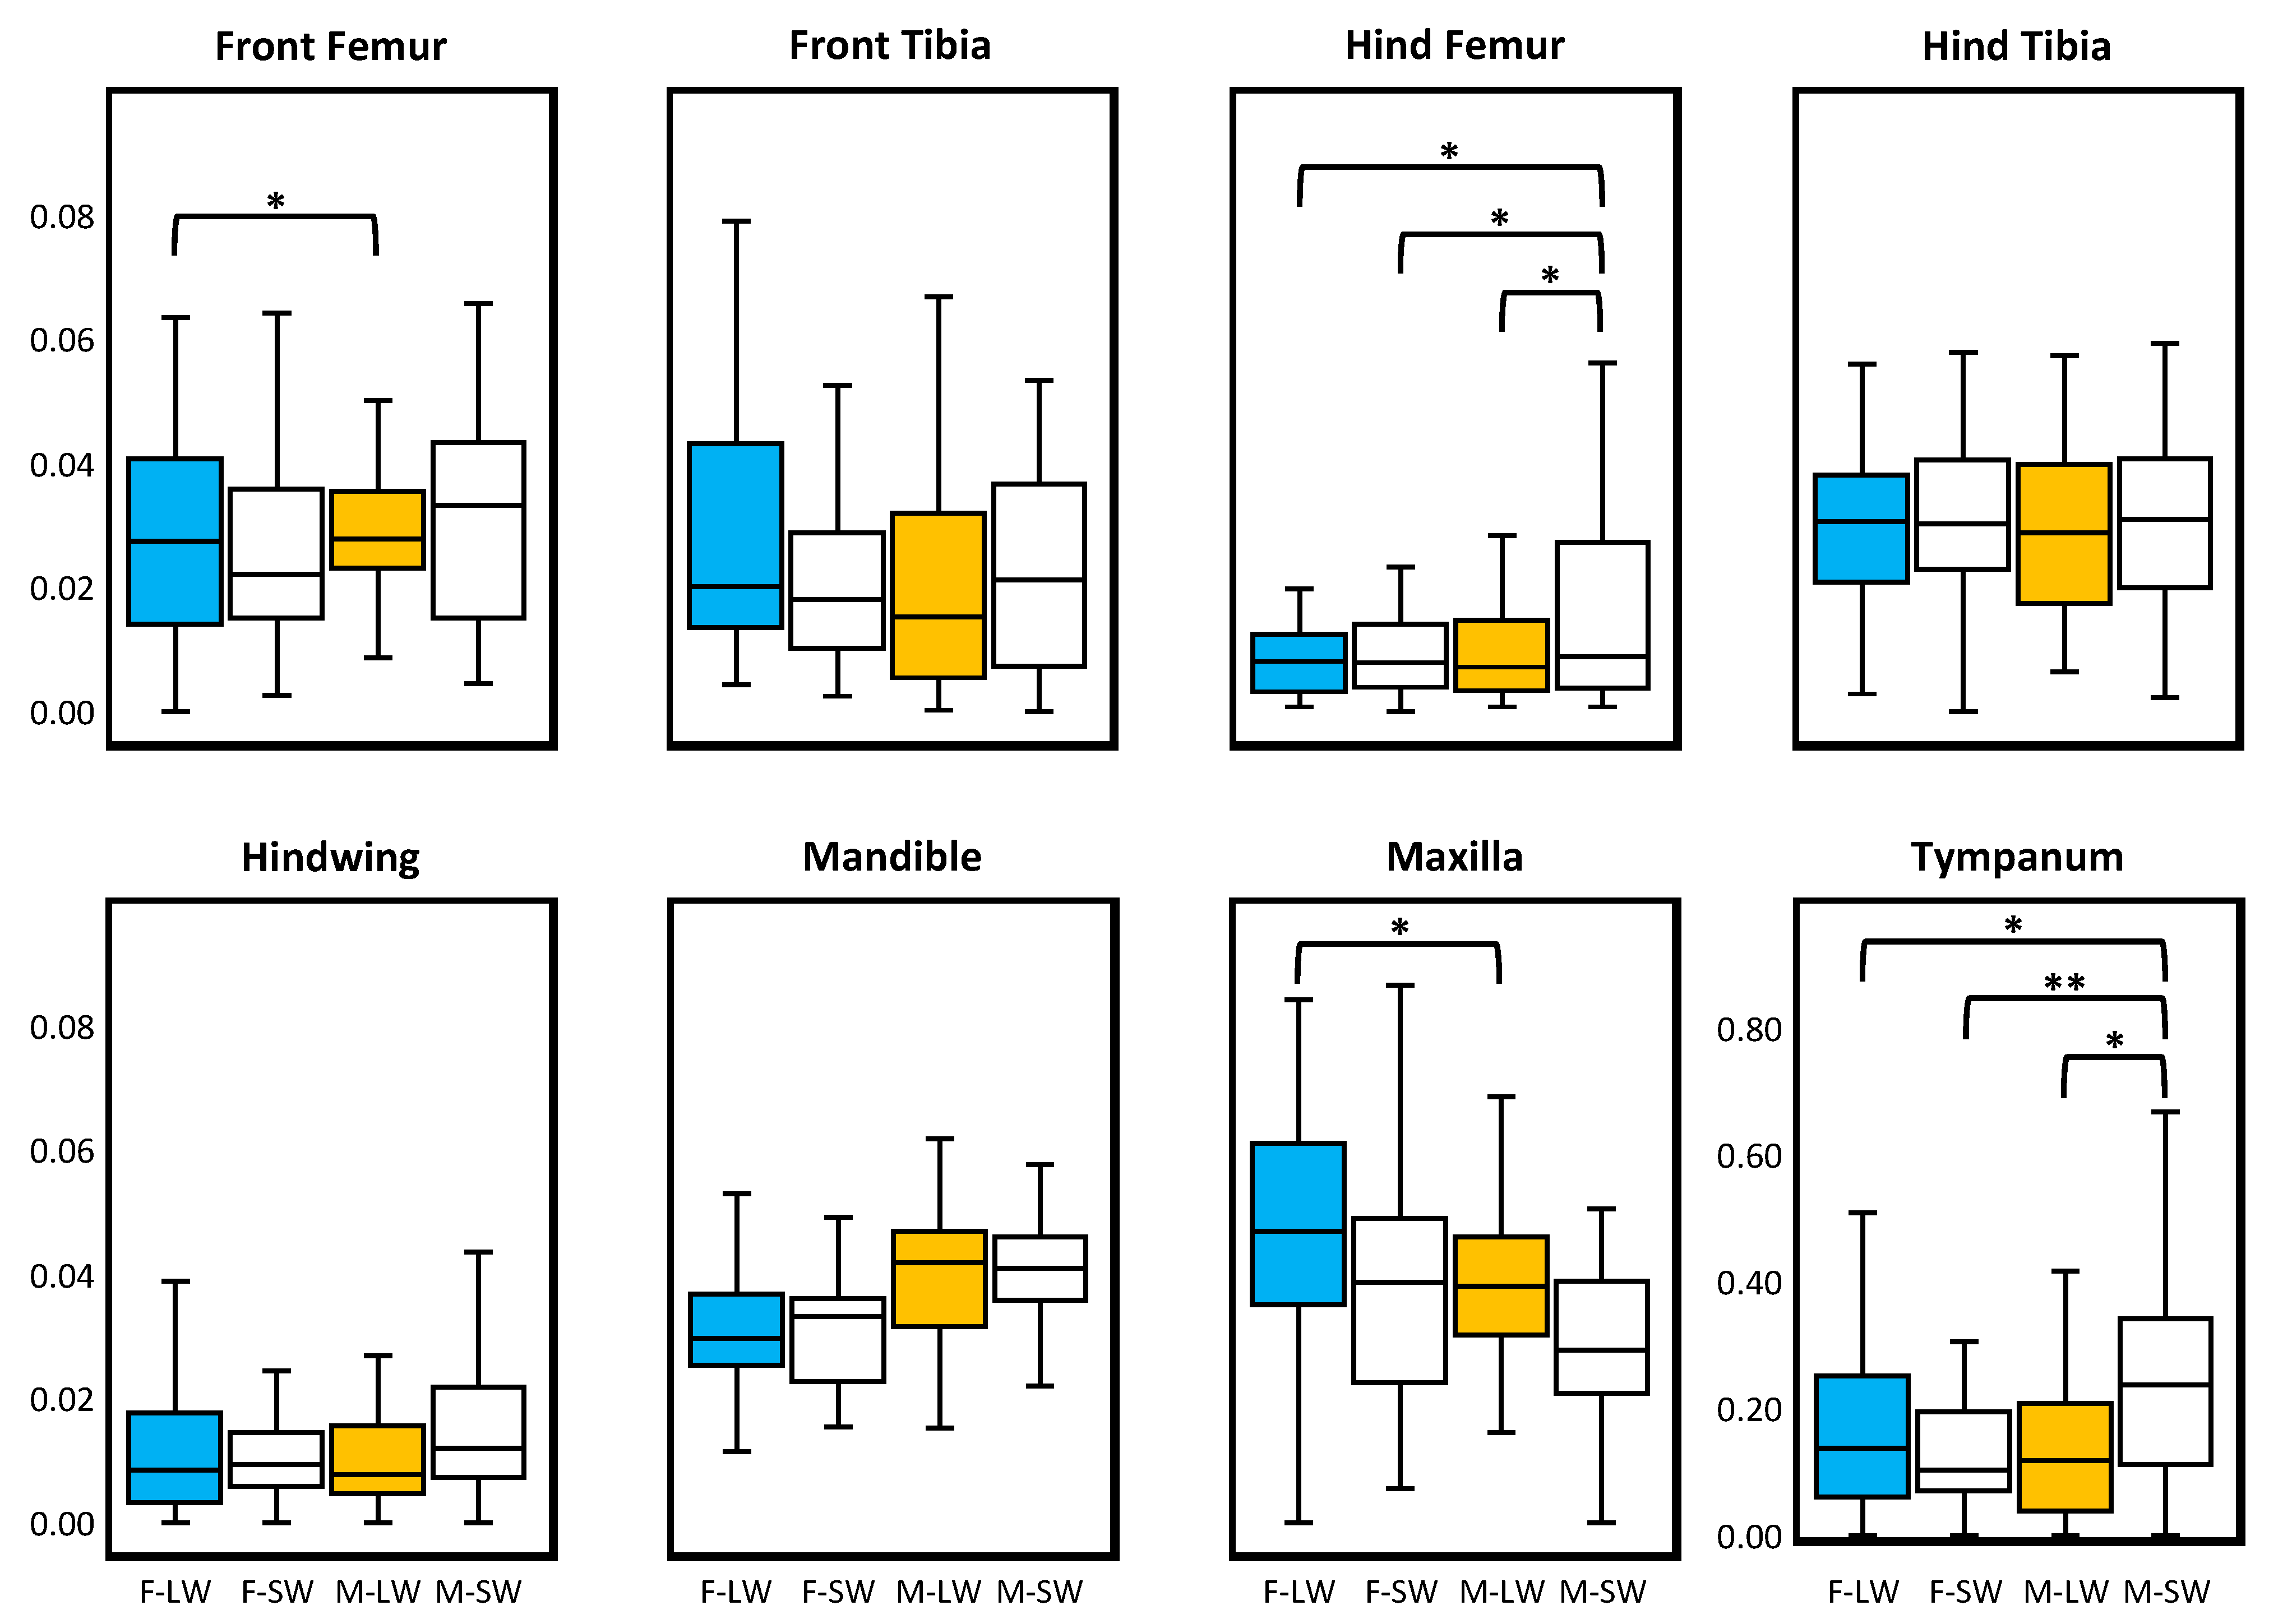
3. Results
4. Discussion
5. Conclusions
Supplementary Materials
Author Contributions
Funding
Institutional Review Board Statement
Informed Consent Statement
Data Availability Statement
Acknowledgments
Conflicts of Interest
References
- Simpson, S.J.; Sword, G.A.; Lo, N. Polyphenism in insects. Curr. Biol. 2011, 21, R738–R749. [Google Scholar] [CrossRef] [PubMed] [Green Version]
- Mayr, E. Animal Species and Evolution; Harvard University Press: Cambridge, MA, USA, 1963. [Google Scholar]
- Maret, T.J.; Collins, J.P. Individual responses to population size structure: The role of size variation in controlling expression of a trophic polyphenism. Oecologia 1994, 100, 279–285. [Google Scholar] [CrossRef] [PubMed]
- Roff, D.A.; Stirling, G.; Fairbairn, D.J. The evolution of threshold traits: A quantitative genetic analysis of the physiological and life-history correlates of wing dimorphism in the sand cricket. Evolution 1997, 51, 1910–1919. [Google Scholar] [CrossRef] [PubMed] [Green Version]
- Lin, X.; Yao, Y.; Wang, B.; Emlen, D.J.; Lavine, L.C. Ecological trade-offs between migration and reproduction are mediated by the nutrition-sensitive insulin-signaling pathway. Int. J. Biol. Sci. 2016, 12, 607–616. [Google Scholar] [CrossRef] [PubMed] [Green Version]
- Zera, A.J.; Potts, J.; Kobus, K. The physiology of life-history trade-offs: Experimental analysis of a hormonally induced life-history trade-off in Gryllus assimilis. Am. Nat. 1998, 152, 7–23. [Google Scholar] [CrossRef]
- Gotoh, H.; Cornette, R.; Koshikawa, S.; Okada, Y.; Lavine, L.C.; Emlen, D.J.; Miura, T. Juvenile hormone regulates extreme mandible growth in male stag beetles. PLoS ONE 2012, 6, e21139. [Google Scholar] [CrossRef] [Green Version]
- Scharf, M.E.; Wu-Scharf, D.; Pittendrigh, B.R.; Bennett, G.W. Caste-and development-associated gene expression in a lower termite. Genome Biol. 2003, 4, R62. [Google Scholar] [CrossRef] [Green Version]
- Casasa, S.; Zattara, E.E.; Moczek, A.P. Nutrition-responsive gene expression and the developmental evolution of insect polyphenism. Nat. Ecol. Evol. 2020, 4, 970–978. [Google Scholar] [CrossRef]
- Moczek, A.P. Facultative paternal investment in the polyphenic beetle Onthophagus taurus: The role of male morphology and social context. Behav. Ecol. 1999, 10, 641–647. [Google Scholar] [CrossRef] [Green Version]
- Friberg, M.; Wiklund, C. Generation-dependent female choice: Behavioral polyphenism in a bivoltine butterfly. Behav. Ecol. 2007, 18, 758–763. [Google Scholar] [CrossRef] [Green Version]
- Yang, C.H.; Pospisilik, J.A. Polyphenism—A window into gene-environment interactions and phenotypic plasticity. Front. Genet. 2019, 10, 132. [Google Scholar] [CrossRef] [PubMed] [Green Version]
- Emlen, D.J.; Hunt, J.; Simmons, L.W. Evolution of sexual dimorphism and male dimorphism in the expression of beetle horns: Phylogenetic evidence for modularity, evolutionary lability, and constraint. Am. Nat. 2005, 166, S42–S68. [Google Scholar] [CrossRef] [PubMed]
- Painting, C.J.; Probert, A.F.; Townsend, D.J.; Holwell, G.I. Multiple exaggerated weapon morphs: A novel form of male polymorphism in harvestmen. Sci. Rep. 2015, 5, 16368. [Google Scholar] [CrossRef] [PubMed] [Green Version]
- Diniz-Filho, J.A.F.; Von Zuben, C.J.; Fowler, H.G.; Schlindwein, M.N.; Bueno, O.C. Multivariate morphometrics and allometry in a polymorphic ant. Insectes Sociaux 1994, 41, 153–163. [Google Scholar] [CrossRef]
- Tschinkel, W.R.; Mikheyev, A.S.; Storz, S.R. Allometry of workers of the fire ant, Solenopsis invicta. J. Insect Sci. 2003, 3. [Google Scholar] [CrossRef]
- Didde, R.D.; Rivera, G. Patterns of fluctuating asymmetry in the limbs of anurans. J. Morphol. 2019, 280, 587–592. [Google Scholar] [CrossRef]
- Palmer, A.R.; Strobeck, C. Fluctuating asymmetry: Measurement, analysis, patterns. Annu. Rev. Ecol. Syst. 1986, 17, 391–421. [Google Scholar] [CrossRef]
- Lens, L.; Van Dongen, S.; Kark, S.; Matthysen, E. Fluctuating asymmetry as an indicator of fitness: Can we bridge the gap between studies? Biol. Rev. Camb. Philos. Soc. 2002, 77, 27–38. [Google Scholar] [CrossRef] [Green Version]
- Klingenberg, C.P. A developmental perspective on developmental instability: Theory, models and mechanisms. In Developmental Instability: Causes and Consequences; Polak, M., Ed.; Oxford University Press: Oxford, UK, 2003; pp. 14–34. [Google Scholar]
- Dongen, S.V. Fluctuating asymmetry and developmental instability in evolutionary biology: Past, present and future. J. Evol. Biol. 2006, 19, 1727–1743. [Google Scholar] [CrossRef]
- Rasmuson, M. Fluctuating asymmetry—Indicator of what? Hereditas 2002, 136, 177–183. [Google Scholar] [CrossRef]
- Leamy, L.J.; Klingenberg, C.P. The genetics and evolution of fluctuating asymmetry. Annu. Rev. Ecol. Evol. Syst. 2005, 36, 1–21. [Google Scholar] [CrossRef] [Green Version]
- Klingenberg, C.P.; Debat, V.; Roff, D.A. Quantitative genetics of shape in cricket wings: Developmental integration in a functional structure. Evolution 2010, 64, 2935–2951. [Google Scholar] [CrossRef] [PubMed] [Green Version]
- Carter, A.J.R.; Houle, D. Artificial selection reveals heritable variation for developmental instability. Evolution 2011, 65, 3558–3564. [Google Scholar] [CrossRef] [PubMed]
- Rivera, G.; Neely, C.M.D. Patterns of fluctuating asymmetry in the limbs of freshwater turtles: Are more functionally important limbs more symmetrical? Evolution 2020, 74, 660–670. [Google Scholar] [CrossRef]
- Brown, C.R.; Brown, M.B. Intense natural selection on body size and wing and tail asymmetry in cliff swallows during severe weather. Evolution 1998, 52, 1461–1475. [Google Scholar] [CrossRef]
- Tocts, A.M.S.; Johnson, D.W.; Carter, A.J.R. Strong nonlinear selection against fluctuating asymmetry in wild populations of a marine fish. Evolution 2016, 70, 2899–2908. [Google Scholar] [CrossRef]
- Galeotti, P.; Sacchi, R.; Vicario, A.L.R. Fluctuating asymmetry in body traits increases predation risks: Tawny owl selection against asymmetric woodmice. Evol. Ecol. 2005, 19, 405–418. [Google Scholar] [CrossRef]
- Crespi, B.J.; Vanderkist, B.A. Fluctuating asymmetry in vestigial and functional traits of a haplodiploid insect. Heredity 1997, 79, 624–630. [Google Scholar] [CrossRef]
- Okada, Y.; Fujisawa, H.; Kimura, Y.; Hasegawa, E. Morph-dependent form of asymmetry in mandibles of the stag beetle Prosopocoilus inclinatus (Coleoptera: Lucanidae). Ecol. Entomol. 2008, 33, 684–689. [Google Scholar] [CrossRef]
- Roff, D.A. The cost of being able to fly: A study of wing polymorphism in two species of crickets. Oecologia 1984, 63, 30–37. [Google Scholar] [CrossRef]
- Zera, A.J.; Denno, R.F. Physiology and ecology of dispersal polymorphism in insects. Annu. Rev. Entomol. 1997, 42, 207–230. [Google Scholar] [CrossRef] [PubMed] [Green Version]
- Zera, A.J.; Larsen, A. The metabolic basis of life history variation: Genetic and phenotypic differences in lipid reserves among life history morphos of the wing-polymorphic cricket, Gryllus firmus. J. Insect Physiol. 2001, 47, 1147–1160. [Google Scholar] [CrossRef] [Green Version]
- Nespolo, R.F.; Roff, D.A.; Fairbairn, D.J. Energetic trade-off between maintenance costs and flight capacity in the sand cricket (Gryllus firmus). Funct. Ecol. 2008, 22, 624–631. [Google Scholar] [CrossRef]
- Crnokrak, P.; Roff, D.A. The genetic basis of the trade-off between calling and wing morph in males of the cricket Gryllus firmus. Evolution 1998, 52, 1111–1118. [Google Scholar] [CrossRef] [PubMed]
- Zera, A.J.; Sall, J.; Grudzinski, K. Flight-muscle polymorphism in the cricket Gryllus firmus: Muscle characteristics and their influences on the evolution of flightlessness. Physiol. Zool. 1997, 70, 519–529. [Google Scholar] [CrossRef] [Green Version]
- Holzer, B.; Jacot, A.; Brinkhof, M.W.G. Condition-dependent signaling affects male sexual attractiveness in field crickets, Gryllus campestris. Behav. Ecol. 2003, 14, 353–359. [Google Scholar] [CrossRef] [Green Version]
- Mitra, C.; Wagner, W.E.; Zera, A.J.; Tolle, A.E. Variation in singing behavior among morphs of the sand field cricket, Gryllus firmus. Ecol. Entomol. 2011, 36, 152–160. [Google Scholar] [CrossRef]
- Leonard, A.S.; Hedrick, A.V. Single versus multiple cues in mate discrimination by males and females. Anim. Behav. 2009, 77, 151–159. [Google Scholar] [CrossRef]
- Zera, A.J.; Huang, Y. Evolutionary endocrinology of juvenile hormone esterase: Functional relationship with wing polymorphism in the cricket, Gryllus firmus. Evolution 1999, 53, 837–847. [Google Scholar] [CrossRef] [Green Version]
- Treidel, L.A.; Quintanilla Ramirez, G.S.; Chung, D.J.; Menze, M.A.; Vázquez-Medina, J.P.; Williams, C.M. Selection on dispersal drives evolution of metabolic capacities for energy production in female wing-polymorphic sand field crickets, Gryllus firmus. J. Evol. Biol. 2022, 35, 599–609. [Google Scholar] [CrossRef]
- Padda, S.S.; Stahlschmidt, Z.R. Evaluating the effects of water and food limitation on the life history of an insect using a multiple-stressor framework. Oecologia 2022, 198, 519–530. [Google Scholar] [CrossRef] [PubMed]
- Kirschman, L.J.; Morales, D.; Crawford, E.; Zera, A.J.; Warne, R.W. Sex and life history shape the strength of cellular and humoral immune responses in a wing dimorphic cricket. J. Insect Physiol. 2019, 116, 70–76. [Google Scholar] [CrossRef] [PubMed]
- Park, Y.; Stanley, D. Physiological trade-off between cellular immunity and flight capability in the wing-dimorphic sand cricket, Gryllus firmus. J. Asia-Pac. Entomol. 2015, 18, 553–559. [Google Scholar] [CrossRef]
- Zera, A.J.; Vellichirammal, N.N.; Brisson, J.A. Diurnal and developmental differences in gene expression between adult dispersing and flightless morphs of the wing polymorphic cricket, Gryllus firmus: Implications for life-history evolution. J. Insect Physiol. 2018, 107, 233–243. [Google Scholar] [CrossRef] [PubMed] [Green Version]
- Kelly, C.D.; Tawes, B.R.; Worthington, A.M. Evaluating indices of body condirion in two cricket species. Ecol. Evol. 2014, 4, 4476–4487. [Google Scholar] [CrossRef] [PubMed]
- Palmer, A.R. Fluctuating asymmetry analyses: A primer. In Developmental Instability: Its Origins and Evolutionary Implications; Contemporary Issues in Genetics and, Evolution; Markow, T.A., Ed.; Springer: Dordrecht, The Netherlands, 1994; Volume 2, pp. 335–364. [Google Scholar]
- Palmer, A.R.; Strobeck, C. Fluctuating asymmetry analyses revisited. In Developmental Instability (DI): Causes and Consequences; Polak, M., Ed.; Oxford University Press: Oxford, UK, 2003; pp. 279–319. [Google Scholar]
- Rohlf, F.; Slice, D.E. Extensions of the Procrustes methods for the optimal superimposition of landmarks. Syst. Biol. 1990, 39, 40–59. [Google Scholar] [CrossRef] [Green Version]
- Zelditch, M.L.; Swiderski, D.L.; Sheets, H.D.; Fink, W.L. Geometric Morphometrics for Biologists: A primer; Academic Press: Cambridge, MA, USA, 2004. [Google Scholar]
- Adams, D.; Collyer, M.; Kaliontzopoulou, A.; Baken, E. Geomorph: Software for geometric morphometric analyses. R package version 4.0.4. 2020. Available online: https://cran.r-project.org/package=geomorph (accessed on 1 June 2022).
- Klingenberg, C.P. Analyzing fluctuating asymmetry with geometric morphometrics: Concepts, methods, and applications. Symmetry 2015, 7, 843–934. [Google Scholar] [CrossRef] [Green Version]
- Balmford, A.; Jones, I.L.; Thomas, A.L.R. On avian asymmetry: Evidence of natural selection for symmetrical tails and wings in birds. Proc. R. Soc. Lond. B 1993, 252, 245–251. [Google Scholar]
- Manning, J.; Ockenden, L. Fluctuating asymmetry in racehorses. Nature 1994, 370, 185–186. [Google Scholar] [CrossRef]
- Martín, J.; López, P. Hindlimb asymmetry reduces escape performance in the lizard Psammodromus algirus. Physiol. Biochem. Zool. Ecol. Evol. Approaches 2001, 74, 619–624. [Google Scholar] [CrossRef]
- Swaddle, J.; Witter, M. Cluttered habitats reduce wing asymmetry and increase flight performance in European starlings. Behav. Ecol. Sociobiol. 1998, 42, 281–287. [Google Scholar] [CrossRef]
- Trivers, R.; Palestis, B.G.; Manning, J.T. The symmetry of children’s knees is linked to their adult sprinting speed and their willingness to sprint in a long-term Jamaican study. PLoS ONE 2013, 8, e72244. [Google Scholar] [CrossRef] [PubMed]
- Thomas, A.L.R. The aerodynamic costs of asymmetry in the wings and talk of birds: Asymmetric birds can’t fly round tight corners. Proc. R. Soc. Lond. B 1993, 254, 181–189. [Google Scholar]
- Fernández, M.J.; Driver, M.E.; Hedrick, T.L. Asymmetry costs: Effects of wing damage on hovering flight performance in the hawkmoth Manduca sexta. J. Exp. Biol. 2017, 220, 3649–3656. [Google Scholar] [CrossRef] [PubMed] [Green Version]
- Foster, D.J.; Cartar, R.V. What causes wing wear in foraging bumble bees? J. Exp. Biol. 2011, 214, 1896–1901. [Google Scholar] [CrossRef] [PubMed] [Green Version]
- Rajabi, H.; Dirks, J.H.; Gorb, S.N. Insect wing damage: Causes, consequences and compensatory mechanisms. J. Exp. Biol. 2020, 223, jeb215194. [Google Scholar] [CrossRef]
- Mountcastle, A.M.; Alexander, T.M.; Switzer, C.M.; Combes, S.A. Wing wear reduced bumblebee flight performance in a dynamic obstacle course. Biol. Lett. 2016, 12, 20160294. [Google Scholar] [CrossRef]
- Moiseff, A.; Pollack, G.S.; Hoy, R.R. Steering responses of flying crickets to sound and ultrasound: Mate attraction and predator avoidance. Proc. Natl. Acad. Sci. USA 1978, 75, 4052–4056. [Google Scholar] [CrossRef] [Green Version]
- Pollack, G.S.; Martins, R. Flight and hearing: Ultrasound sensitivity differs between flight-capable and flight incapable morphs of a wing-dimorphic cricket species. J. Exp. Biol. 2007, 210, 3160–3164. [Google Scholar] [CrossRef] [Green Version]
- Duncan, J.; Soulsbury, C.D.; Montealegre-Z, F. Differentiation between left and right wing stridulatory files in the field cricket Gryllus bimaculatus (Orthoptera: Gryllidae). Arthropod Struct. Dev. 2021, 65, 101076. [Google Scholar] [CrossRef]
- Carter, A.J.R.; Weier, T.M.; Houle, D. The effect of inbreeding on fluctuating asymmetry of wing veins in tow laboratory strains of Drosophila melanogaster. Heredity 2009, 102, 563–572. [Google Scholar] [CrossRef] [PubMed]
- Mallard, S.T.; Barnard, C.J. Food stress, fluctuating asymmetry and reproductive performance in the Gryllid crickets Gryllus bimaculatus and Gryllodes sigillatus. Behaviour 2004, 141, 219–232. [Google Scholar] [CrossRef]
- Nijhout, H.F. Control mechanisms of polyphenic development in insects: In polyphenic development, environmental factors alter some aspects of development in an orderly and predictable way. BioScience 1999, 49, 181–192. [Google Scholar] [CrossRef] [Green Version]


| Traits | N | MSId | MSSide | MSSide*Id | MSError | % ME | FA10 |
|---|---|---|---|---|---|---|---|
| Front Femur | |||||||
| Female Longwing | 45 | 0.388 *** | 0.861 *** | 0.017 *** | <0.001 | 4.1 | 0.0054 |
| Female Shortwing | 31 | 0.395 *** | 0.520 *** | 0.008 *** | <0.001 | 12.9 | 0.0023 |
| Male Longwing | 39 | 0.507 *** | 1.036 *** | 0.005 *** | <0.001 | 16.3 | 0.0014 |
| Male Shortwing | 30 | 0.672 *** | 0.844 *** | 0.009 *** | <0.001 | 8.1 | 0.0028 |
| Front Tibia | |||||||
| Female Longwing | 44 | 0.339 *** | 0.559 *** | 0.020 *** | <0.001 | 4.1 | 0.0064 |
| Female Shortwing | 32 | 0.270 *** | 0.229 *** | 0.011 *** | <0.001 | 5.9 | 0.0034 |
| Male Longwing | 38 | 0.409 *** | 0.170 ** | 0.016 *** | <0.001 | 4.8 | 0.0051 |
| Male Shortwing | 29 | 0.613 *** | 0.238 *** | 0.010 *** | <0.001 | 7.4 | 0.0031 |
| Hind Femur | |||||||
| Female Longwing | 42 | 3.881 *** | 0.505 *** | 0.032 *** | <0.001 | 1.0 | 0.0106 |
| Female Shortwing | 34 | 4.202 *** | 0.257 ** | 0.024 *** | <0.001 | 1.2 | 0.0079 |
| Male Longwing | 36 | 3.089 *** | 0.262 ** | 0.025 *** | <0.001 | 1.0 | 0.0082 |
| Male Shortwing | 30 | 6.794 *** | 0.359 | 0.115 *** | <0.001 | 0.2 | 0.0382 |
| Hind Tibia | |||||||
| Female Longwing | 41 | 2.675 *** | 5.765 *** | 0.046 *** | 0.009 | 19.8 | 0.0123 |
| Female Shortwing | 33 | 2.412 *** | 4.337 *** | 0.033 *** | 0.003 | 9.7 | 0.0099 |
| Male Longwing | 38 | 1.937 *** | 4.272 *** | 0.044 *** | 0.009 | 20.5 | 0.0117 |
| Male Shortwing | 30 | 3.768 *** | 3.219 *** | 0.057 *** | 0.002 | 4.1 | 0.0182 |
| Hindwing | |||||||
| Female Longwing | 41 | 7.514 *** | 0.059 | 0.198 *** | 0.014 | 7.1 | 0.0613 |
| Female Shortwing | 33 | 2.114 *** | 0.140 | 0.040 *** | 0.003 | 7.5 | 0.0123 |
| Male Longwing | 33 | 9.431 *** | 0.053 | 0.091 *** | 0.014 | 15.4 | 0.0257 |
| Male Shortwing | 30 | 2.729 *** | 0.147 | 0.039 *** | 0.003 | 7.7 | 0.0120 |
| Mandible | |||||||
| Female Longwing | 47 | 0.143 *** | 0.496 *** | 0.001 *** | <0.001 | 1.8 | 0.0003 |
| Female Shortwing | 32 | 0.159 *** | 0.308 *** | 0.001 *** | <0.001 | 2.5 | 0.0002 |
| Male Longwing | 40 | 0.828 *** | 0.970 *** | 0.003 *** | <0.001 | 0.7 | 0.0009 |
| Male Shortwing | 33 | 0.890 *** | 0.686 *** | 0.001 *** | <0.001 | 1.0 | 0.0004 |
| Maxilla | |||||||
| Female Longwing | 46 | 0.066 *** | 0.451 *** | 0.002 *** | <0.001 | 0.8 | 0.0006 |
| Female Shortwing | 35 | 0.100 *** | 0.170 *** | 0.003 *** | <0.001 | 2.7 | 0.0011 |
| Male Longwing | 41 | 0.469 *** | 0.471 *** | 0.002 *** | <0.001 | 0.9 | 0.0005 |
| Male Shortwing | 32 | 0.486 *** | 0.168 *** | 0.002 *** | <0.001 | 0.5 | 0.0007 |
| Tympanum | |||||||
| Female Longwing | 45 | 0.007 * | 0.088 *** | 0.004 *** | <0.001 | 7.2 | 0.0012 |
| Female Shortwing | 31 | 0.009 *** | 0.037 *** | 0.003 *** | <0.001 | 9.4 | 0.0008 |
| Male Longwing | 39 | 0.007 ** | 0.055 *** | 0.003 *** | <0.001 | 8.7 | 0.0009 |
| Male Shortwing | 30 | 0.009 | 0.088 ** | 0.009 *** | <0.001 | 2.2 | 0.0029 |
| Traits | Sample Size | Size (mm) | DA | Corrected FA | |
|---|---|---|---|---|---|
| N | Mean ± SD | Value | p | Mean ± SD | |
| Front Femur | |||||
| Female Longwing | 45 | 04.58 ± 0.25 | −0.0249 | <0.001 | 0.117 ± 0.059 |
| Female Shortwing | 31 | 04.55 ± 0.26 | −0.0232 | <0.001 | 0.104 ± 0.043 |
| Male Longwing | 39 | 04.53 ± 0.29 | −0.0294 | <0.001 | 0.087 ± 0.043 |
| Male Shortwing | 30 | 04.32 ± 0.33 | −0.0317 | <0.001 | 0.107 ± 0.051 |
| Front Tibia | |||||
| Female Longwing | 44 | 04.28 ± 0.24 | 0.0213 | <0.001 | 0.122 ± 0.070 |
| Female Shortwing | 32 | 04.17 ± 0.21 | 0.0163 | <0.001 | 0.106 ± 0.058 |
| Male Longwing | 38 | 04.25 ± 0.26 | 0.0126 | 0.002 | 0.120 ± 0.058 |
| Male Shortwing | 29 | 04.02 ± 0.32 | 0.0188 | <0.001 | 0.118 ± 0.052 |
| Hind Femur | |||||
| Female Longwing | 42 | 13.38 ± 0.80 | −0.0067 | <0.001 | 0.082 ± 0.038 |
| Female Shortwing | 34 | 12.98 ± 0.84 | −0.0053 | 0.004 | 0.080 ± 0.035 |
| Male Longwing | 36 | 12.61 ± 0.72 | −0.0053 | 0.004 | 0.079 ± 0.039 |
| Male Shortwing | 30 | 11.91 ± 1.06 | −0.0074 | 0.100 | 0.111 ± 0.064 |
| Hind Tibia | |||||
| Female Longwing | 41 | 10.43 ± 0.67 | −0.0297 | <0.001 | 0.097 ± 0.052 |
| Female Shortwing | 33 | 09.99 ± 0.63 | −0.0296 | <0.001 | 0.088 ± 0.048 |
| Male Longwing | 38 | 09.82 ± 0.57 | −0.0278 | <0.001 | 0.099 ± 0.054 |
| Male Shortwing | 30 | 09.22 ± 0.79 | −0.0292 | <0.001 | 0.105 ± 0.063 |
| Hindwing | |||||
| Female Longwing | 41 | 19.26 ± 1.12 | 0.0015 | 0.620 | 0.101 ± 0.055 |
| Female Shortwing | 33 | 08.22 ± 0.59 | −0.0066 | 0.057 | 0.109 ± 0.050 |
| Male Longwing | 33 | 18.47 ± 1.25 | −0.0018 | 0.444 | 0.098 ± 0.037 |
| Male Shortwing | 30 | 07.12 ± 0.67 | −0.0084 | 0.057 | 0.114 ± 0.063 |
| Mandible | |||||
| Female Longwing | 47 | 2.65 ± 0.15 | −0.0313 | <0.001 | 0.077 ± 0.032 |
| Female Shortwing | 32 | 2.59 ± 0.16 | −0.0313 | <0.001 | 0.080 ± 0.031 |
| Male Longwing | 40 | 3.15 ± 0.37 | −0.0401 | <0.001 | 0.086 ± 0.035 |
| Male Shortwing | 33 | 2.89 ± 0.39 | −0.0408 | <0.001 | 0.075 ± 0.031 |
| Maxilla | |||||
| Female Longwing | 46 | 1.75 ± 0.11 | −0.0471 | <0.001 | 0.116 ± 0.052 |
| Female Shortwing | 35 | 1.72 ± 0.13 | −0.0320 | <0.001 | 0.126 ± 0.061 |
| Male Longwing | 41 | 2.25 ± 0.28 | −0.0386 | <0.001 | 0.092 ± 0.042 |
| Male Shortwing | 32 | 2.01 ± 0.29 | −0.0287 | <0.001 | 0.099 ± 0.048 |
| Tympanum* | |||||
| Female Longwing | 45 | 0.30 ± 0.04 | 0.1189 | <0.001 | 0.347 ± 0.146 |
| Female Shortwing | 31 | 0.27 ± 0.04 | 0.1056 | <0.001 | 0.305 ± 0.146 |
| Male Longwing | 39 | 0.30 ± 0.03 | 0.1056 | <0.001 | 0.298 ± 0.148 |
| Male Shortwing | 30 | 0.25 ± 0.04 | 0.1677 | 0.004 | 0.447 ± 0.181 |
Publisher’s Note: MDPI stays neutral with regard to jurisdictional claims in published maps and institutional affiliations. |
© 2022 by the authors. Licensee MDPI, Basel, Switzerland. This article is an open access article distributed under the terms and conditions of the Creative Commons Attribution (CC BY) license (https://creativecommons.org/licenses/by/4.0/).
Share and Cite
Whalen, M.R.; Chang, K.J.; Jones, A.B.; Rivera, G.; Worthington, A.M. Fluctuating Asymmetry in the Polymorphic Sand Cricket (Gryllus firmus): Are More Functionally Important Structures Always More Symmetric? Insects 2022, 13, 640. https://doi.org/10.3390/insects13070640
Whalen MR, Chang KJ, Jones AB, Rivera G, Worthington AM. Fluctuating Asymmetry in the Polymorphic Sand Cricket (Gryllus firmus): Are More Functionally Important Structures Always More Symmetric? Insects. 2022; 13(7):640. https://doi.org/10.3390/insects13070640
Chicago/Turabian StyleWhalen, Matthew R., Krista J. Chang, Alexandria B. Jones, Gabriel Rivera, and Amy M. Worthington. 2022. "Fluctuating Asymmetry in the Polymorphic Sand Cricket (Gryllus firmus): Are More Functionally Important Structures Always More Symmetric?" Insects 13, no. 7: 640. https://doi.org/10.3390/insects13070640
APA StyleWhalen, M. R., Chang, K. J., Jones, A. B., Rivera, G., & Worthington, A. M. (2022). Fluctuating Asymmetry in the Polymorphic Sand Cricket (Gryllus firmus): Are More Functionally Important Structures Always More Symmetric? Insects, 13(7), 640. https://doi.org/10.3390/insects13070640