Article

Genome-Wide Identification and Analysis of the Heat-Shock Protein Gene Superfamily in Bemisia tabaci and Expression Pattern Analysis under Heat Shock

1
Shandong Engineering Research Center for Environment-Friendly Agricultural Pest Management, College of Plant Health and Medicine, Qingdao Agricultural University, Qingdao 266109, China
2
Department of Plant Protection, Institute of Vegetables and Flowers, Chinese Academy of Agricultural Sciences, Beijing 100081, China
*
Author to whom correspondence should be addressed.
Insects 2022, 13(7), 570; https://doi.org/10.3390/insects13070570
Submission received: 2 June 2022 / Revised: 20 June 2022 / Accepted: 21 June 2022 / Published: 23 June 2022
(This article belongs to the Section Insect Molecular Biology and Genomics)

Abstract

:

Simple Summary

Bemisia tabaci MED is an invasive pest that had caused considerable economic damage in the past decades. Its successful colonization is closely related to heat-shock proteins (HSPs), which are related to heat resistance. In this study, 33 BtaHsps were identified based on the sequenced genome of B. tabaci MED belonging to six HSP families, among which 22 BtaHsps were newly identified. Analysis of the secondary structure and evolutionary relationship showed that they were all closely related. In addition, BtaHsp90A3 of the HSP90 family was screened by analyzing the expression level changes of these genes under 42 °C heat shock and RNAi was performed on the BtaHsp90A3. The results showed that the silencing of BtaHsp90A3 is closely related to the heat resistance of B. tabaci MED. Taken together, this study conducted an in-depth identification of BtaHsps that clarifies their evolutionary relationships and their response to thermal stress in B. tabaci MED.

Abstract

The thermal tolerance of Bemisia tabaci MED, an invasive whitefly species with worldwide distribution, plays an important role in its ecological adaptation during the invasion process. Heat-shock proteins (HSPs) are closely related to heat resistance. In this study, 33 Hsps (BtaHsps) were identified based on sequenced genome of B. tabaci MED belonging to six HSP families, among which 22 Hsps were newly identified. The secondary structures of a further 22 BtaHsps were also predicted. The results of RT-qPCR showed that heat shock could affect the expression of 14 of the 22 Hsps newly identified in this study. Among them, the expression level of six Hsps increased under 42 °C treatment. As the unstudied gene, BtaHsp90A3 had the highest increase rate. Therefore, BtaHsp90A3 was chosen for the RNAi test, and silencing BtaHsp90A3 by RNAi decreased the survival rate of adult B. tabaci at 42 °C. The results indicated that only a few Hsps were involved in the thermal tolerance of host whitefly although many Hsps would response under heat stress. This study conducted a more in-depth and comprehensive identification that demonstrates the evolutionary relationship of BtaHsps and illustrates the response of BtaHsps under the influence of thermal stress in B. tabaci MED.

1. Introduction

In many insects, heat-shock proteins (HSPs) can overexpress in response to a variety of environmental stresses such as heat [1], cold [2], dehydration [3], UV exposure [4], osmolarity [5], and organic pollutants [6]. Among these abiotic stressors, thermal stress is perhaps the most important factor that commonly activates the increased expression of HSPs in insects [7,8,9]. HSPs exist widely in insects and may play an important role in their heat adaptation, heat tolerance, and heat protection [10,11]. For instance, HSPs play important roles as molecular chaperones in promoting correct protein folding and preventing denatured protein aggregation [12]. Based on molecular weight and homology, HSPs constitute a supergene family that was divided into six families (small HSPs, HSP40, HSP60, HSP70, HSP90, and HSP100) [13,14].
The sweet potato whitefly, Bemisia tabaci (Gennadius) species complex, transmits more than 320 plant viruses [15]. One member of this complex species, B. tabaci MED has invaded many countries, including China, and has caused considerable economic damage to many important crops [16]. It has been reported that temperature tolerance may have been an important factor in the successful colonization of B. tabaci MED in many locations [17,18,19]. The HSP90, HSP70, and sHSP genes were considered to be related to the high temperature tolerance in invasive B. tabaci MED [20]. For example, B. tabaci MED is more tolerant to short temperature stress than the indigenous B. tabaci ZHJ1. Meanwhile, the Hsp expression of B. tabaci MED was higher than in the indigenous species under maximal temperature, and the onset and maximal temperature induction of Hsp expression was generally 2–4 °C higher than in the indigenous species ZHJ1 [21], which is helpful in understanding the relationship between Hsps and the distribution changes of B. tabaci MED under global climate warming. In addition, Hsp expression of viruliferous B. tabaci was more easily upregulated by temperature stress [22]. Previous studies had identified and analyzed 26 Hsps based on the genome of B. tabaci MEAM1 [23], and also identified two Hsp70s and three sHsps in B. tabaci MED [19,24]. However, the information about evolutionary relationships, gene structures, and gene functions of the HSP superfamily in B. tabaci MED still remains poorly understood.
To reveal the evolutionary characteristics of Hsps in B. tabaci MED and the responses of Hsps to temperature stresses, 22 Hsps were identified from B. tabaci, including 11 HSP70 genes, four HSP90 genes, one HSP60 gene, one HSP100 gene, four HSP40 genes, and one sHSP gene. By constructing a phylogenetic tree with all these B. tabaci MED Hsps and Hsps from outgroup insects, the phylogenetic relationships of Hsps were explored. The expression pattern of BtaHsps was examined by RT-qPCR by determining the expression level of BtaHsps under treatment at 42 °C. In addition, the functions of HSPs were further clarified by silencing the Hsps whose expression increased under heat treatment. The present results could improve understanding of the mechanisms of thermotolerance in B. tabaci at the molecular level.

2. Materials and Methods

2.1. Insect Collection and Rearing Conditions

The B. tabaci population in this study was collected from Lingshui, Hainan, China in 2017, and was determined as cryptic species MED using the mtDNA COI gene (GenBank accession no. GQ371165) [25]. The whiteflies were reared on tobacco (Nicotiana tabacum L.) (breed: NC89 cultivar) in a thermostatic chamber at 27 ± 1 °C with a 16L:8D photoperiod and 60% relative humidity (RH). Before this experiment, the B. tabaci MED population had been reared in the laboratory for more than 40 generations.

2.2. Identification of HSP Genes from Genome Database

The genome of B. tabaci MED, based on the third generation sequencing technology, was generated with the PacBio Sequel Sequencing technology platform (Biomarker Technologies, Beijing, China). Three hundred male and female adult pairs of the B. tabaci MED population collected from Lingshui, Hainan, China in 2017 were used as the sequencing samples. Sequenced genes with Hsp functions were selected as candidate genes based on the genome annotation library. Afterwards, sequences of all candidate genes were subjected to the National Center for Biotechnology Information (NCBI) BlastP and BlastN and Conserved Domain Database [26] to screen and identify the candidate genes. Finally, Compute pI/Mw tool of ExPASy (https://web.expasy.org/compute_pi/ (accessed on 20 October 2021)) [27] was used to calculate the molecular weight and isoelectric point of the Hsps in this study, and subcellular localization was predicted by CELLOv2.5 (http://cello.life.nctu.edu.tw/ (accessed on 20 October 2021)) [28].

2.3. Classification and Nomenclature of HSP Genes

There were 31 Hsps identified and named in previous studies of B. tabaci. The sequences of these genes were also obtained in these studies [19,23,24]. The members of Hsp70, Hsp90, Hsp60, and sHsp families of Athalia rosae, Drosophila ananassae, Nilaparvata lugens, Plutella xylostella, and Tribolium castaneum [23] were regarded as the outgroup of the phylogenetic tree of this study. In order to comprehensively identify B. tabaci HSP families, BlastP in NCBI was used to find gene sequences of Hsp40, Hsp100, and other families (except for the HSP genes that had been found previously) [19,23,24]. These sequences were found in the published genomic databases of A. rosae, D. ananassae, and N. lugens. Then, protein sequences of candidate Hsps in this study and previously studied Hsps were aligned by Muscle [29] of MEGA7 with the default option. Subsequently, the neighbor-joining (NJ) method was used to construct the phylogenetic tree of all Hsps in MEGA7 [30] with the following parameters: Poisson correction model, pairwise deletion, and bootstraps test with 1000 replications (random seed) [23]. According to the grouping results in the phylogenetic tree and CDD prediction of each gene in NCBI, the Hsps screened were classified and further named according to their molecular weight [13,31]. The sHSP genes were named according to their molecular weight [32]. The genes in the HSP70 superfamily were divided into Hsc70 and Hsp70 according to constitutive and inducible types, respectively [33]. The HSP90 genes were named using the method described for HSP90A and HSP90B to indicate cytosolic and ER HSP90 homologs, respectively [34]. Other family members are directly named after their family names.

2.4. Structural Information Prediction and Analysis

The conserved motifs of 22 Hsps were detected by Multiple Em for Motif Elicitation (MEME) an online program [35] with the following parameters: Select the site distribution, Zero or One Occurrence per sequence; Select the number of motifs, 20; How wide can motifs be, 30 to 70 residues for HSP90, HSP70, and HSP60 family members, 10 to 40 for sHSP family members, leave other options as default [23]. Comparing the motif results of complete sequences of candidate genes, those with exactly the same motif composition and sequence were removed as redundant genes. At the same time, this method also verified the accuracy of our preliminary screening and identification. In addition, Gene Structure Display Server (http://gsds.gao−lab.org/ (accessed on 23 October 2021)) [36] was used to graphically portray the numbers and positions of coding sequence (cds)/intron by using gff file of the B. tabaci genome. In addition, Clustalw (Multiple Sequence Alignment—CLUSTALW (genome.jp) (accessed on 23 October 2021)), ExPASy (https://swissmodel.expasy.org/interactive (accessed on 23 October 2021)) [37], and ESPript (https://espript.ibcp.fr/ESPript/cgi-bin/ESPript.cgi (accessed on 23 October 2021)) were used to predict the secondary structures (α-helixs and β-sheets) of candidate genes. ALN format file and PDB format file were separately obtained using Clustalw and ExPASy, respectively, and then, the two files of each superfamily were separately put into ESPript.

2.5. Heat-Stress Treatments

For each experiment replicate, 30 female adults were collected into one ventilated plastic pipette, and were maintained at 42 °C for 3.5 h in a constant-temperature incubator. Thirty adults exposed to 27 °C were included as a control replicate. Each treatment included four biological replicates. Once the experiment finished, treated adults were frozen in liquid nitrogen and stored at −80 °C. Then, the total RNA of 20 surviving adults was extracted for each experiment replicate, using TRIzol Reagent (Thermo Fisher Scientific, Waltham, MA, USA) according to the manufacturer’s protocol. The concentration and purity of extracted RNA (A260/280 and A260/230) were detected by using NanoDrop. RNA samples were stored at −80 °C until needed. PrimeScript RT reagent Kit with gDNA Eraser (Perfect Real Time) (Takara Biotechnology, Qingdao, China) was used to reverse transcribe RNA into cDNA, and RT primer mix of random 6-mers and oligo-dT primer was used to uniformly synthesize all types of cDNA in the sample.

2.6. Quantitative Reverse Transcription PCR (RT-qPCR)

The obtained cDNA concentrate was then diluted 30 times and used as a template for RT-qPCR. RT-qPCR reaction system (20 μL): 10 μL TBGreen (Takara Biotechnology, Qingdao, Shandong, China), 7.2μL DEPC water, 0.8 μL primer (10 μM), 2 μL cDNA (30-fold dilution). The RT-qPCR experiment was performed on the JENA qTOWER 2.2 system (Biometra, Analytik Jena, Göttingen, Germany). The reaction procedure was as follows: 95 °C for 30 s, followed by 40 cycles (95 °C for 10 s and 60 °C for 30 s). After the cycling procedure, the temperature was increased from 60 to 95 °C (0.6 °C s−1) to obtain the melting curves by promoting denaturation of the double-stranded DNA. The gene-specific primers were designed by primer premier 6, and all primers are listed in Table S1. In each RT-qPCR experiment, each gene was run in three biological replicates with three technical replicates. Two single-copy genes EF-1α (forward primer 5′-3′: TAGCCTTGTGCCAATTTCCG; reverse primer 5′-3′: TCCTTCAGCATTACCGTCC) [38] and whitefly β-actin (forward primer 5′-3′: TCTTCCAGCCATCCTTCTTG; reverse primer 5′-3′: CGGTGATTTCCTTCTGCATT) [17] were used as endogenous control genes to normalize all data, and the expression level of both control genes was checked at tested temperature.

2.7. RNA Interference and Survival Rate Analysis

T7 RNAi Transcription Kit (Vazyme Biotech Co., Ltd., TR102-01, Nanjing, China) was used to synthesize double-stranded RNA (dsRNA) with specific primers. Adults were fed with 20% sucrose with 500 ng/μL dsRNA dilution. A sucrose diet containing 500 ng/μL dsHSP and dsGFP was used for the treatment group and control group, respectively. First, 150 adults were fed on a 20% sucrose diet with dsRNA for 2 days, then 30 adults per replicate were randomly selected for RT-qPCR to detect the interference efficiency, and 80 adults were subjected to 42 °C treatment for 2 h. The same approaches were performed on the negative control. Each treatment was assayed in three replicates. The mortality of adults was counted after high-temperature treatment. After recovery at 25 °C for 1 h, the survival number of adults was counted to ensure that there was no false death among these individuals.

2.8. Data Statistical Analysis

Relative expression of double parameters was measured and geometrically averaged [39], and RT-qPCR data were analyzed by 2−ΔΔCt [40]. The data obtained from three independent biological replicates were used to conduct statistical analysis. The survival rate and RT-qPCR data were tested for normality using Kolmogorov−Smirnov test, then the homogeneity of group variances was tested using Levene’s test. All the data followed normal distributions which were analyzed using Student’s t-test using IBM SPSS 21.0 (IBM Corporation, Chicago, IL, USA). The heatmap of gene expression patterns was generated by R (version 4.0.4) package heatmap (1.0.8). Since the expression levels of different genes varied greatly after heat stress, it was difficult to express them clearly in heat maps using original data. Therefore, the original data processed by log function with base 2 was used in heat maps.

3. Results

3.1. Identification of HSP Genes in the Genome of B. tabaci MED

Thirty three Hsps (BtaHsps) were identified based on sequenced genome of B. tabaci MED (Chu et al., unpublished data) and verified by BlastP, BlastN, and CDD search. Of the 33 Hsps, 22 were newly identified through a method of establishing an unrooted phylogenetic tree and comparing their common motif regions, molecular weight, and other details. Subsequently the newly founded 22 HSP genes were classified into six superfamilies, including sHSP, HSP40, HSP60, HSP70, HSP90, and HSP100, including one sHSP gene, four HSP40 genes, one HSP60 gene, 11 HSP70 genes, four HSP90 genes, and one HSP100 gene. The B. tabaci HSP genes were named as BtaHSP; the family name was behind it, and then the individual numbers were signed at the end. The detailed information on the Hsp such as CDS, molecular weight, isoelectric point, and subcellular localization is shown in Table 1. Most of the HSP genes are located in the cytoplasm and nucleus; a minority are located in the extracellular, ER, plasma membrane, and mitochondria.

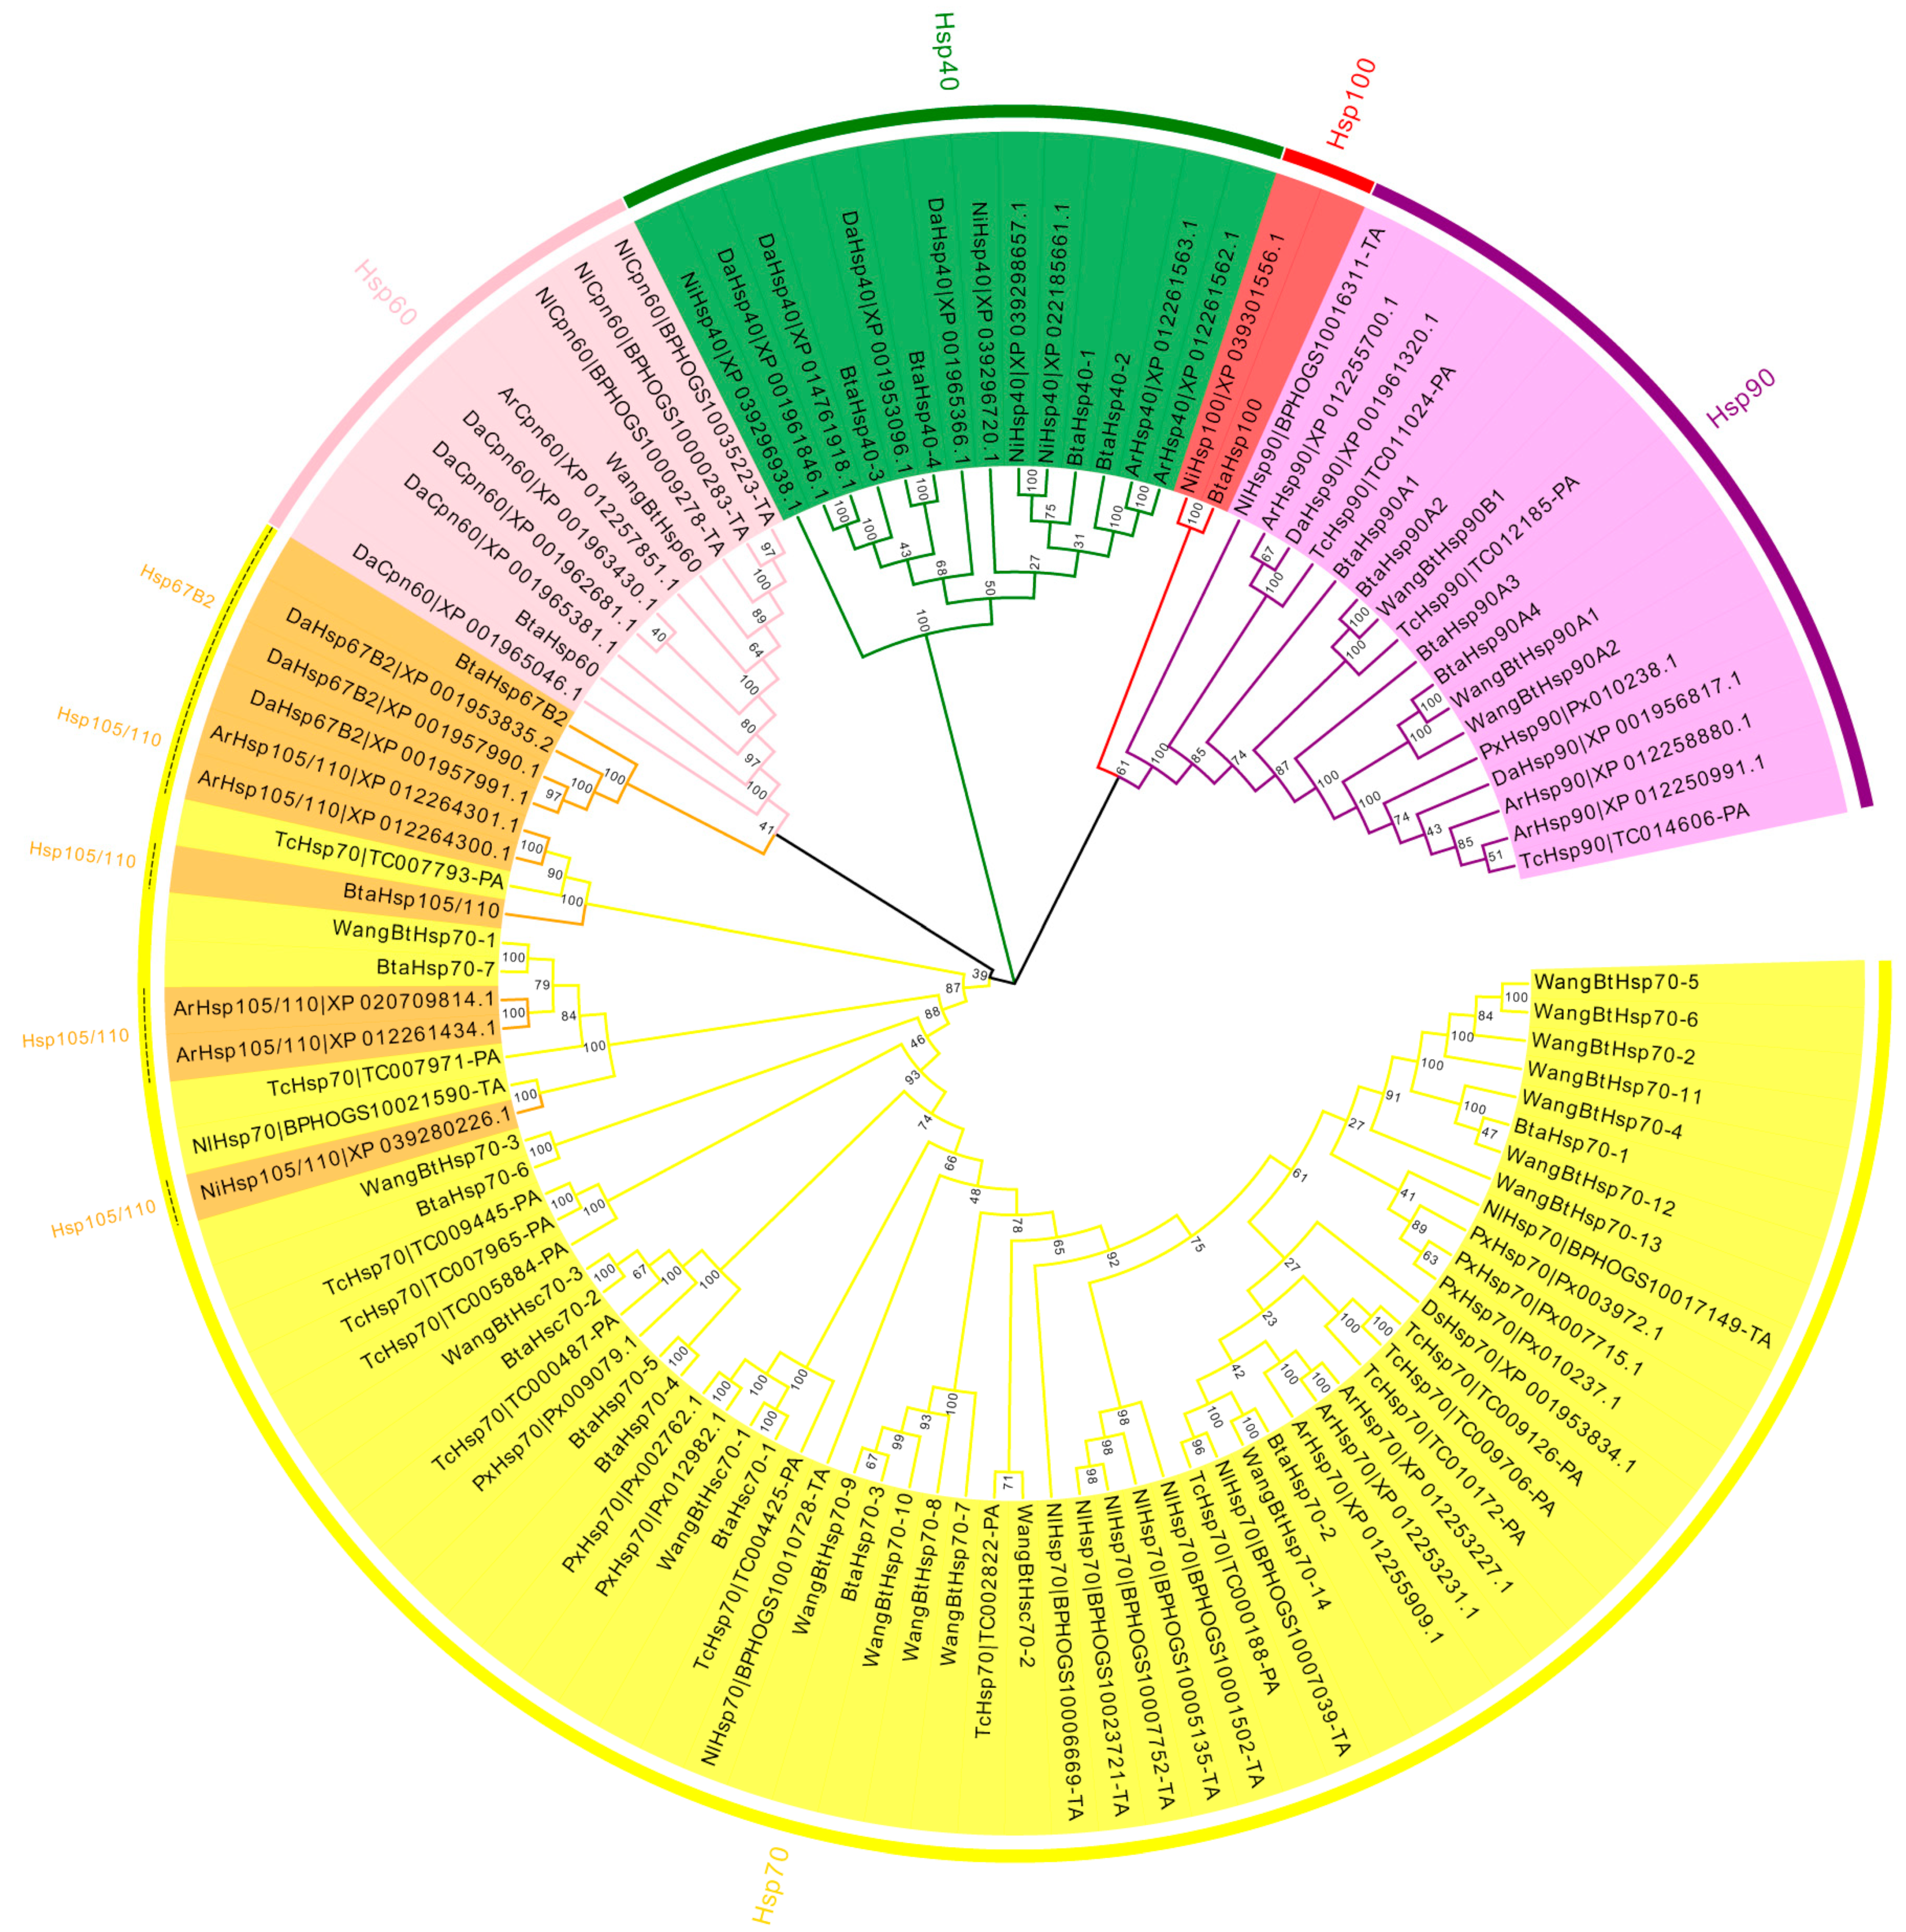
3.2. Phylogenetic Analysis for Classification Validation

To assess the phylogenetic relationship between Hsps of B. tabaci and other outgroup insects, HSP genes of different insects were put together for unrooted phylogenetic trees to further identify our classification result. As shown in Figure 1, all the HSP genes are divided into sHsp, Hsp40, Hsp60, Hsp70, Hsp90, and Hsp100, and they were clustered together to include the HSP family. Since the sHSP family gene sequence is short and the difference is too large compared with other HSP family genes, the phylogenetic tree of sHsp was constructed alone (Figure 2). In addition, Hsp40, Hsp100, Hsp67B2, and Hsp105/110 of A. rosae, D. ananassae, and N. lugens were put together with B. tabaci to further verify the reliability of classification (Figure 3). This was done to accurately verify that these HSP superfamilies remain conserved in different insects and to verify the accuracy of candidate gene annotations. Then, 29 BtHsps identified by previous studies [23,24] were put together with our 22 BtaHsps to construct the phylogenetic tree (Figure 4). These results are consistent with the previous screening and classification results using genome annotation library and NCBI CDD. At the same time, the maximum-likelihood (ML) method was used to reconstruct the phylogenetic tree of the above content, and the results were consistent with those of the NJ method, proving that our results were reliable (Supplementary Figures S1–S4).

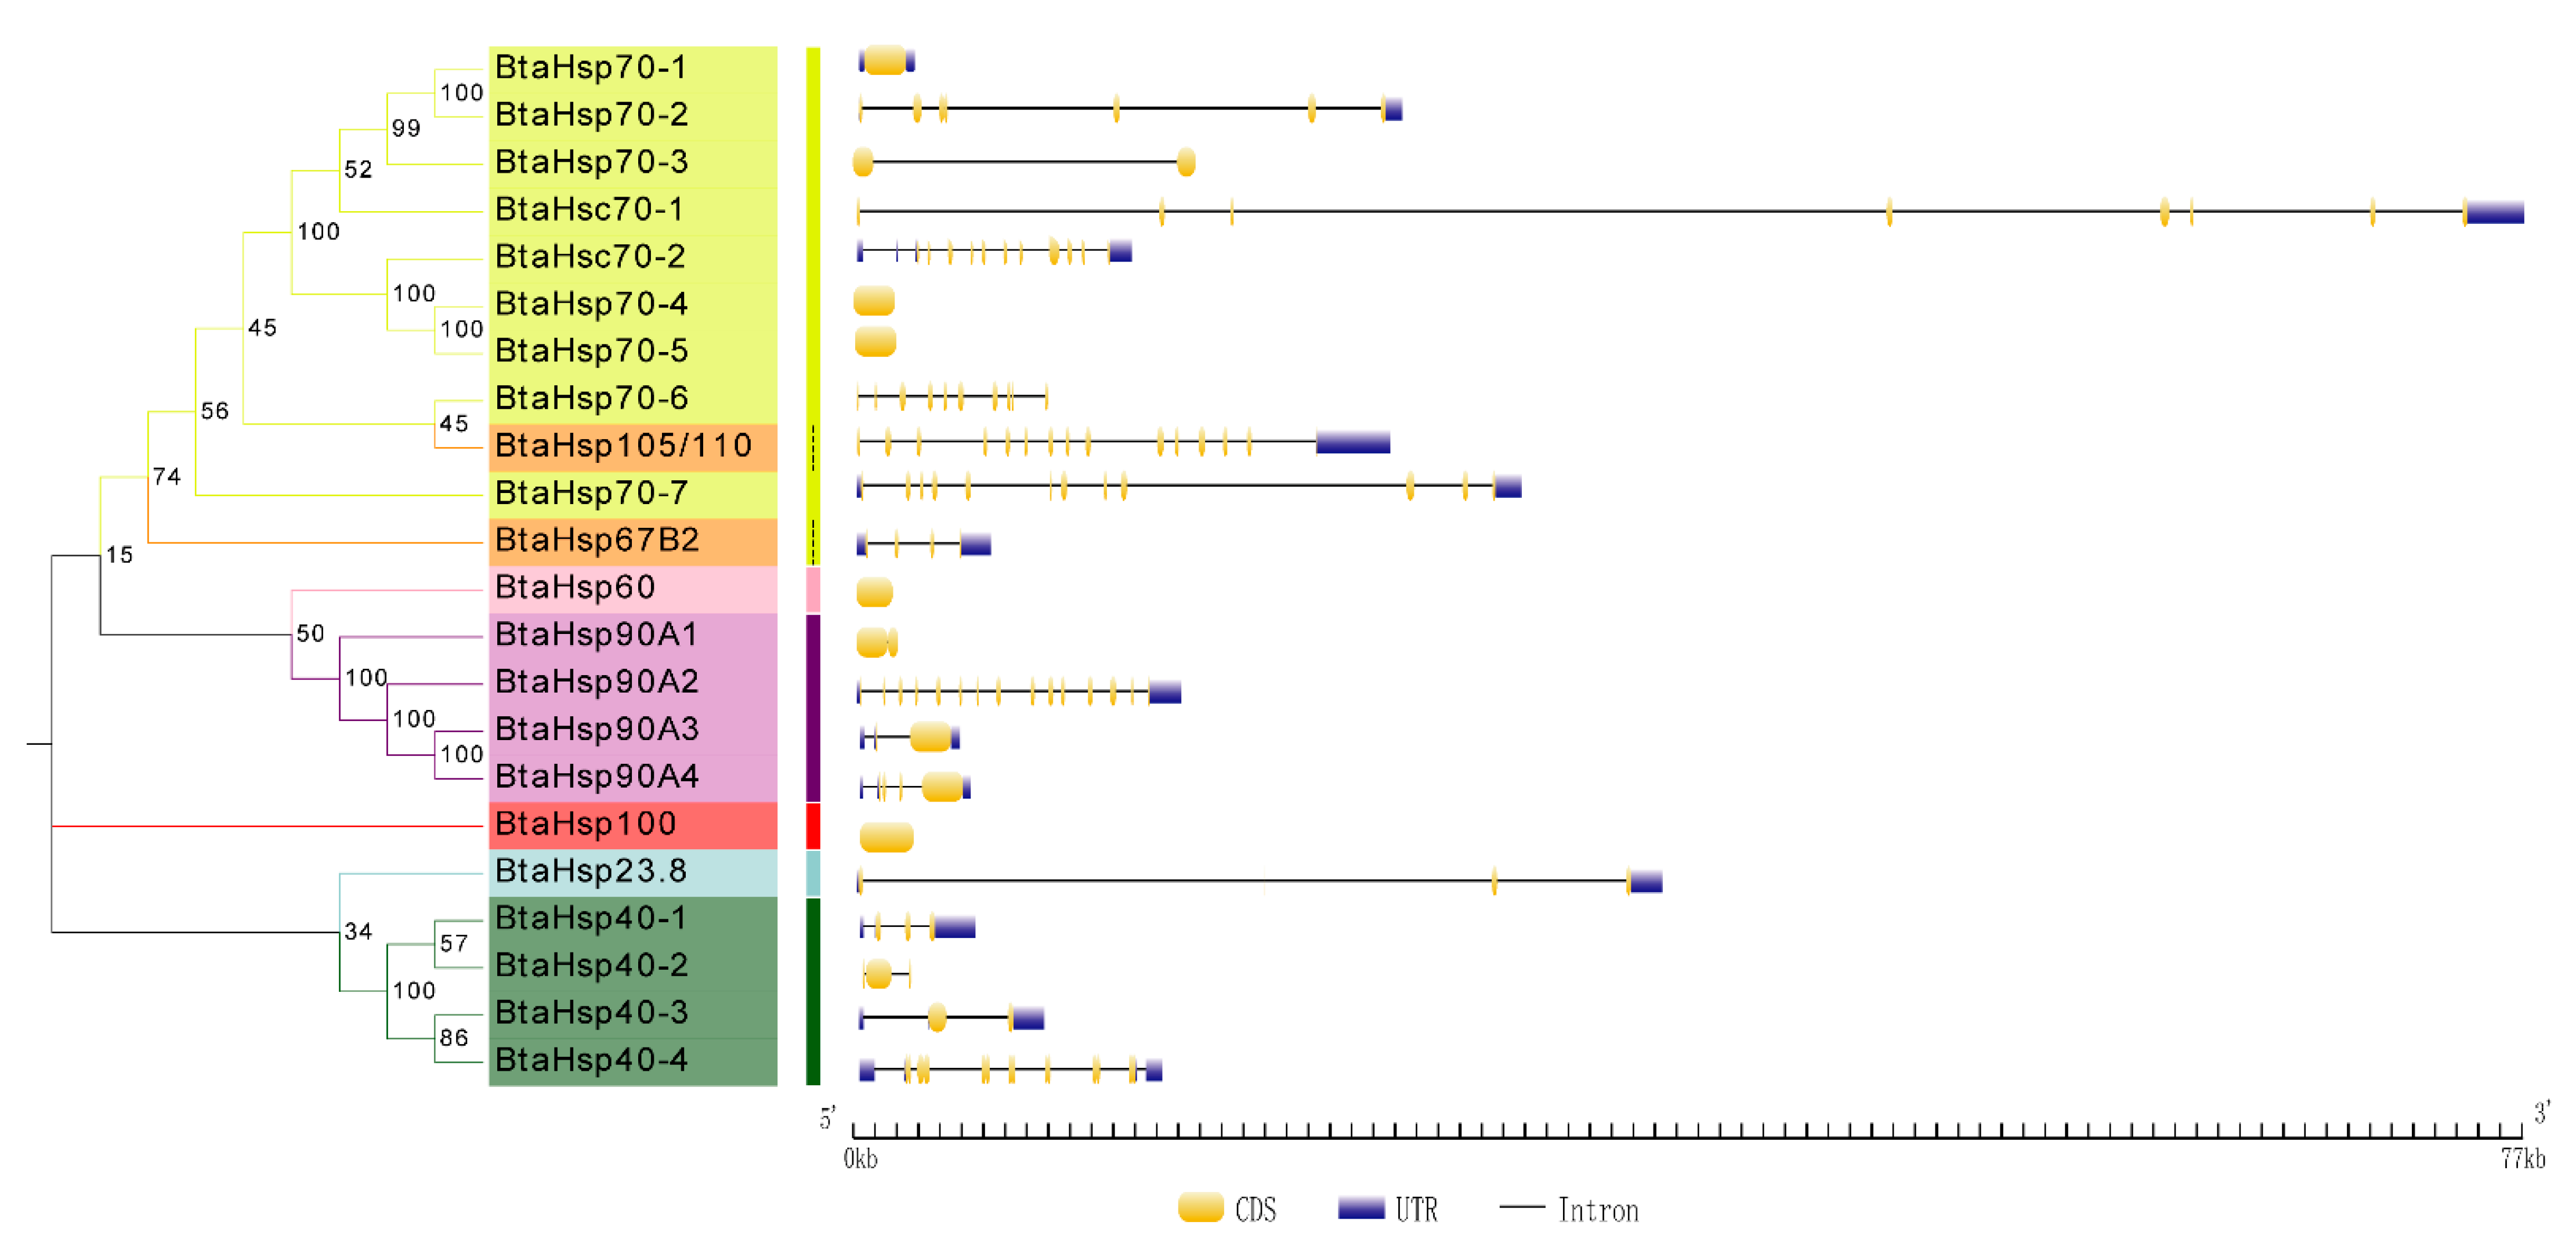
3.3. Phylogenetic and Gene Structure Analysis of BtaHSP Genes

The Gene Structure Display Server (GSDS) was used to portray the gene structure information and this was compared based on the phylogenetic classification. As shown in Figure 5, HSP70, BtaHsp70-1, BtaHsp70-4, and BtaHsp70-5 gene have no introns, while BtaHsp70-2, BtaHsp70-3, BtaHsp70-6, and BtaHsp70-7 have 6, 1, 9, and 11 introns, respectively. Hsc70 genes covered 7 (BtaHsc70-1) to 12 (BtaHsc70-2) introns. In addition, there were also great differences in genetic structure among members of the HSP90 family and HSP40 family; 1, 14, 2, and 4 introns were contained in BtaHsp90A1, BtaHsp90A2, BtaHsp90A3, and BtaHsp90A4, respectively, and 3, 2, 2, and 8 introns were contained in BtaHsp40-1, BtaHsp40-2, BtaHsp40-3, and BtaHsp40-4, respectively.

3.4. Phylogenetic and Gene Secondary Structure Analysis of BtaHSP Genes

The motif and secondary structure were analyzed to obtain the BtaHSP superfamily genes’ structural diversity. Firstly, MEME was used to search 20 motifs in each HSP family of 22 candidate BtaHSP genes. Motifs are shown in Figure 6 and also listed in Supplement Data Sheet 1. As displayed in Figure 6, HSP genes from the same superfamily always share similar motifs. The result of motif prediction shows that the distribution of family motifs is relatively conserved. It can also be used to provide a rough indication of the evolutionary relationships between family members in terms of genetic structure.
Furthermore, in order to compare the secondary structure more accurately, four gene families of 29 genes obtained by predecessors were added to each gene family obtained in this study for analysis and comparison. The secondary structure of BtasHsp, BtaHsp40, BtaHsp60, BtaHsp70, and BtaHsp90 families is displayed in Figures S5–S9. There is one α-crystalline domain with chaperone function located in the N-terminal, one in the C-terminal region, and six β-sheet sandwich structures in each member of B. tabaci sHSP family whole region. HSP40s include the C-terminal Zn-finger domain, one highly conserved J domain on N-terminal, and substrate recognition domain on C-terminal. Among them, the J domain contains four α-helices, whose ring regions contain highly conserved histidine, proline, and aspartic acid residues. There are two GroEL-like equatorial domains and one GroEL-like apical domain in the BtaHSP60. The HSP70 family has two characteristic domains, one is an ATPase functional domain located at N-terminal, and the other is the C-terminal polypeptide-binding functional domain. The N-terminal ATPase domain consists of two subdomains connected by two α-helices with a gap between them. These two subdomains are a tight structure of a β-sandwich containing eight β-folded chains. The C terminal is an α-helical relaxation structure. Like HSP70 chaperones, BtaHsp105/110s have an N-terminal nucleotide-binding domain (NBD) and a C-terminal substrate-binding domain (SBD). The BtaHsp90s contained a histidine-kinase-like adenosine triphosphatase (ATPase) domain and chaperone motifs in the N-terminal domain and the C-terminal domain, respectively.

3.5. Elevated Differential Expression of BtaHSP Genes at High Temperature

The investigation of the expression changes of different HSP genes at high temperature was revealed by RT-qPCR of all the B. tabaci HSP genes including 29 HSP genes identified by predecessors and 22 HSP genes obtained in this study (Figure 7). Although the time and temperature of heat shock were different from those of previous studies, the expression patterns of the same genes were basically the same after heat shock. Among the 22 HSP genes, the expression of BtaHsp70-1, BtaHsp40-1, BtaHsp40-3, BtaHsp40-4, BtaHsp100, and BtaHsp90A3 increased significantly (p < 0.05, Student’s t-test). In particular, the expression of BtaHsp70-1 had the highest increase rate (nearly 53 times of the normal state), and the expression of BtaHsp90A3 had the second highest increase rate (nearly four times of the normal state).

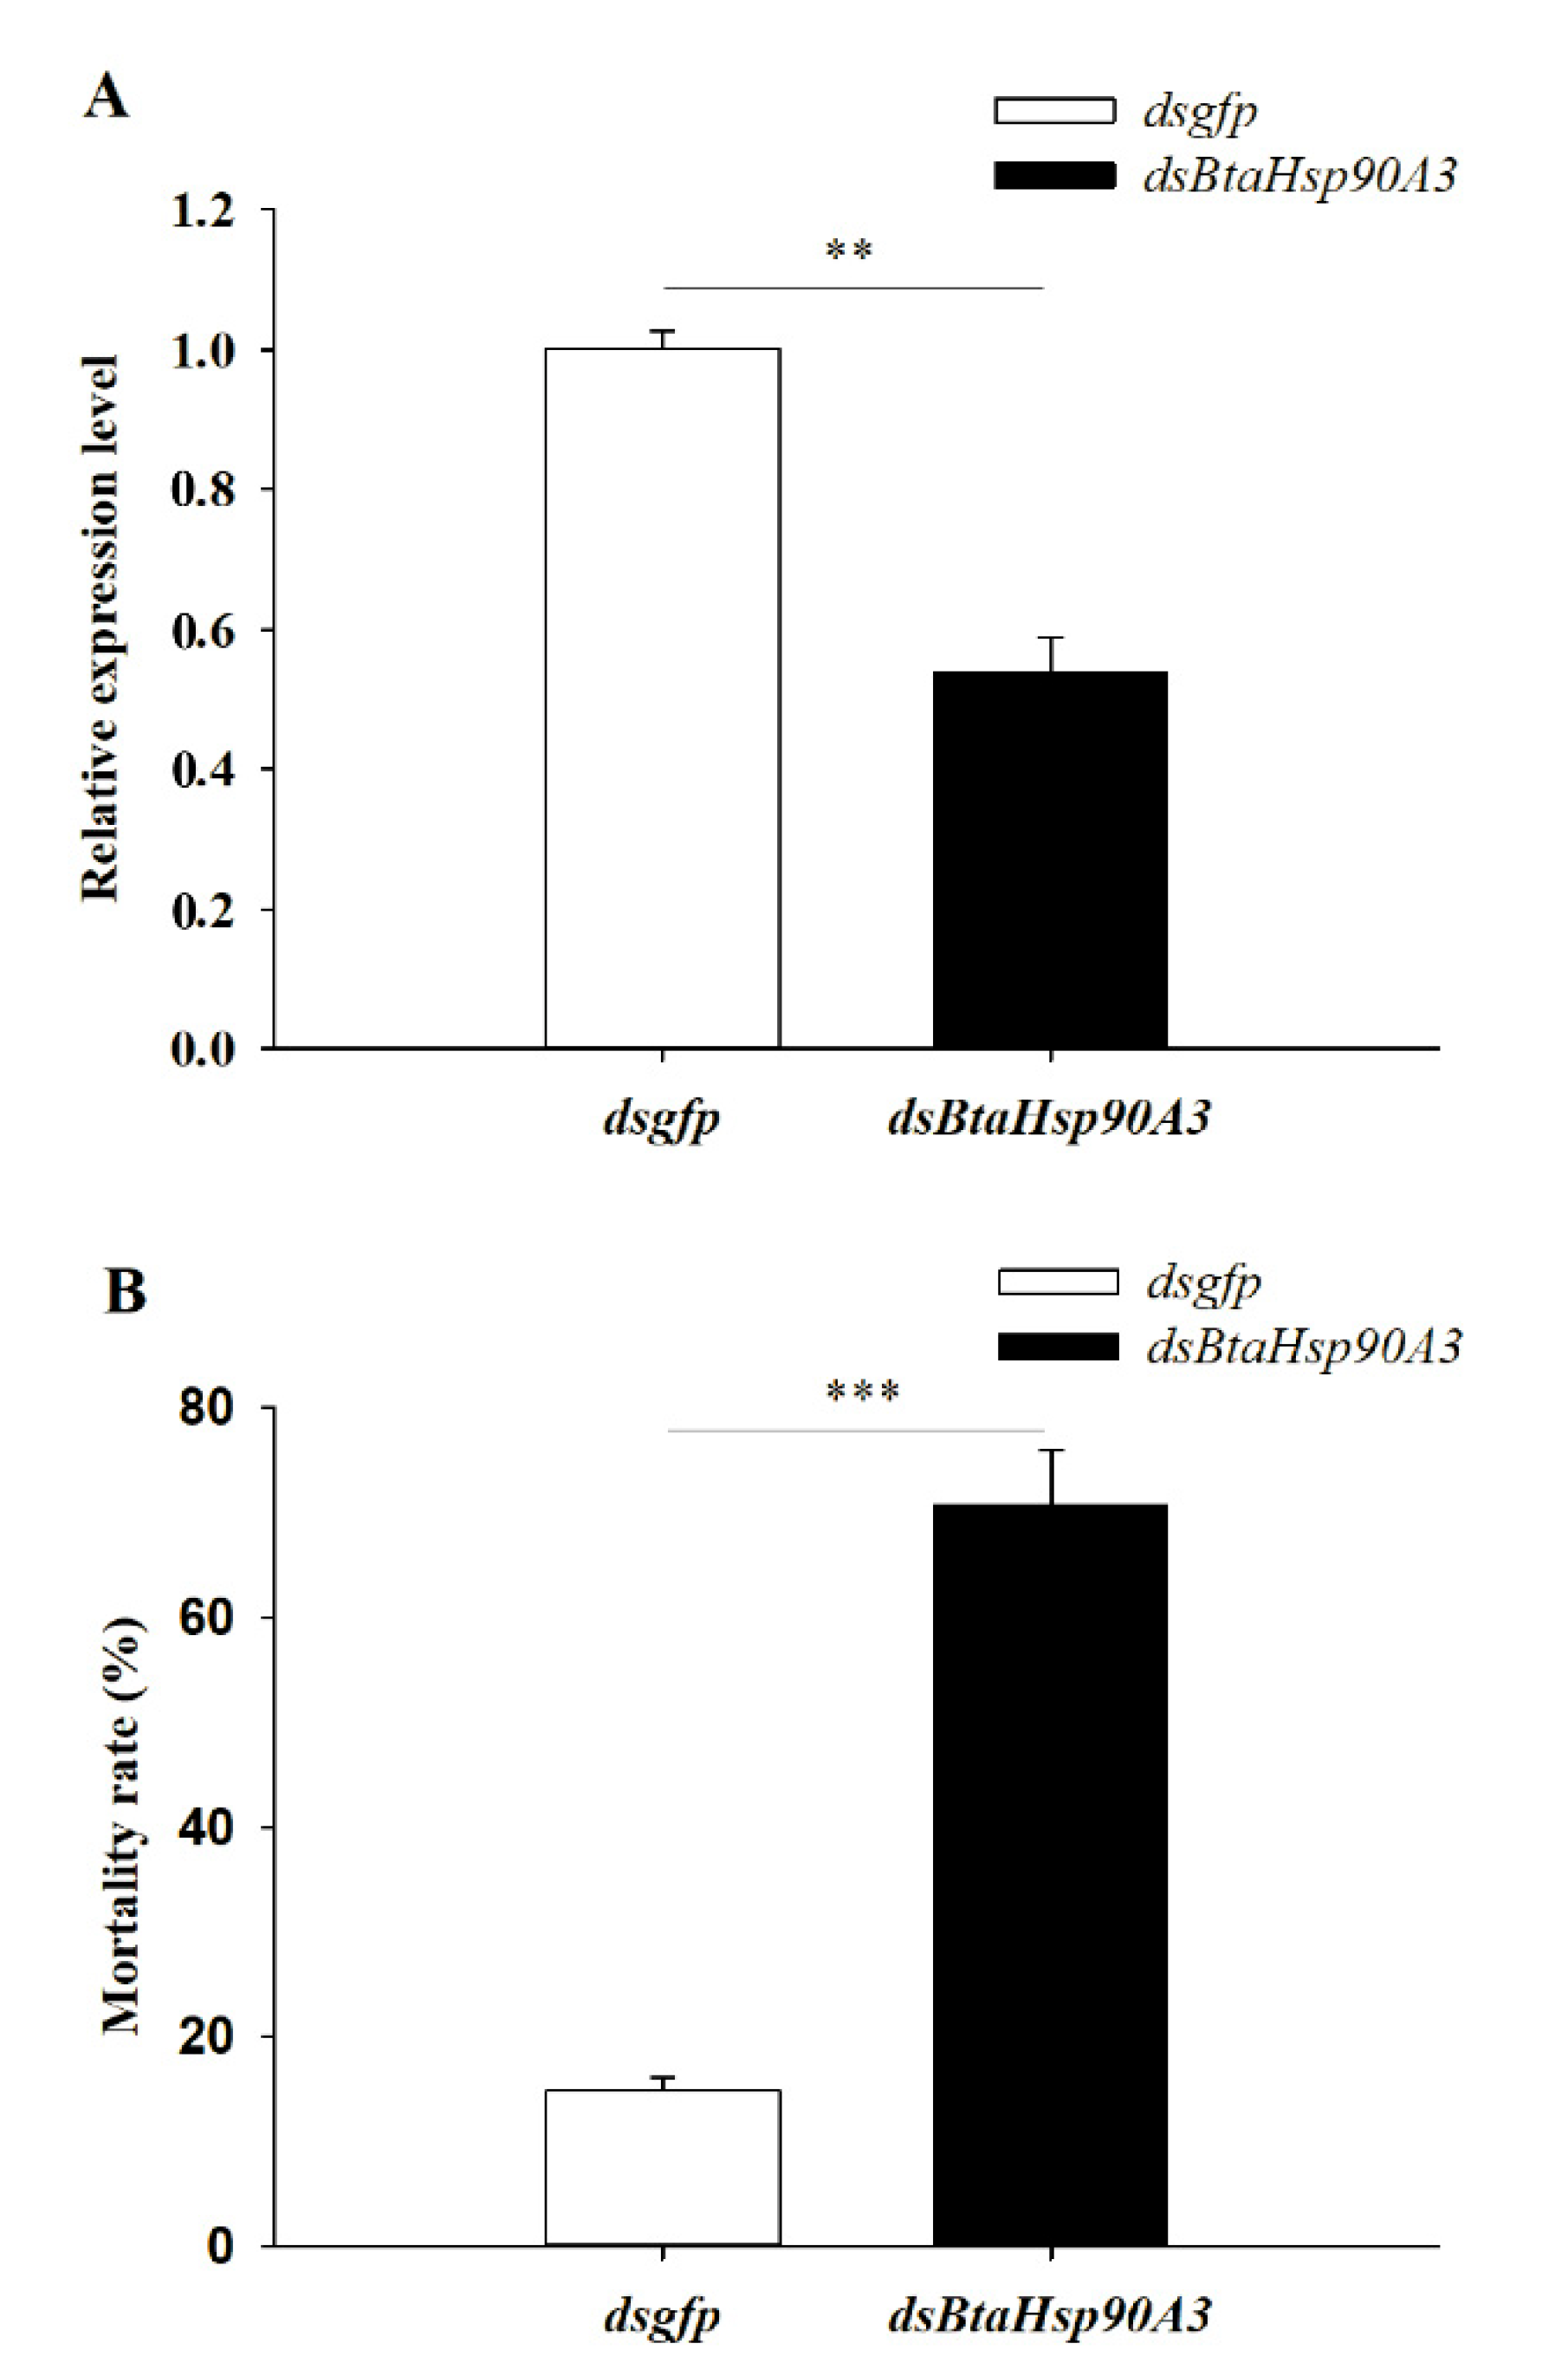
3.6. Effect of HSP Gene on High-Temperature Stress

In this study BtaHsp90A3 was selected as a candidate gene for RNA interference to further determine the role of BtaHsp in B. tabaci high-temperature stress. Changes in gene expression showed that BtaHsp90A3 could be the gene that responded positively to heat stress, which implies it has a vital function. The BtaHsp90A3 expression level of B. tabaci fed dsBtaHsp90A3 (0.54 ± 0.049) was significantly lower than that of those fed dsgfp (1.00 ± 0.025) (t0.025/4 = 8.363, p < 0.01, Student’s t-test) (Figure 8A). Furthermore, the mortality of B. tabaci fed on dsBtaHsp90A3 (70.67% ± 5.25%) was significantly higher than that of those fed on dsgfp (14.93% ± 1.17%) (t0.025/4 = 10.383, p < 0.001, Student’s t-test) (Figure 8B).

4. Discussion

4.1. Expansion of HSP Gene Superfamily in B. tabaci

Previously, 26 HSP superfamily genes have been identified based on the B. tabaci MEAM1 genome [23] and five based on the B. tabaci MED samples [19,24]. The sequence of two Hsps reported by Bai et al. (2021) [19] was not disclosed, so it is not discussed in detail. In this study, only 11 of the 31 HSP genes identified in previous studies were found in our B. tabaci MED genome (Chu et al., unpublished data), but there were also 22 HSP genes of our genome that were different from these 31 genes. The main differences may be associated with the different source of the genome.
In this study, 22 newly found BtaHsps were screened by genome annotation library and comparative genomics. The 22 Hsp genes encoding six insect HSP families were identified in the B. tabaci genome by integrated bioinformatics methods. These results indicate that the number of HSP genes is extended in B. tabaci. The results show that Hsp70 is the largest clade of B. tabaci Hsp, which is consistent with the previous reports that the HSP70 family is one of the main and most abundant HSP families [41]. In addition, we selected Hsps of three species, A. rosae, D. ananassae, and N. lugens, as the outgroup of the phylogenetic tree and used B. tabaci Hsp40, Hsp100, Hsp67B2, and Hsp105/110 for genomic gene blast. Based on the phylogenetic tree, Hsp105/110 and Hsp67B2 were found to cluster with HSP70 family genes, which was consistent with Hsp105/110 belonging to the divergent subgroup of the HSP70 family [42], suggesting that Hsp67B2 belongs to the HSP70 family. Moreover, the results indicate that Hsp40 in large numbers exists in the above-mentioned three insect species, while the other three HSP genes are rare and the number is small. This may be caused by gene loss events in the evolution of different species [23]. This phenomenon can be related to previous reports, that HSP70 is the most important and abundant HSP [41] and that HSP40 is necessary for HSP70 to function normally [43].

4.2. Conserved-Sequence Characteristics of Members of the B. tabaci HSP Superfamily

In general, HSPs from the same family have a relatively high structural identity. The prediction results of the secondary structure showed that HSPs in the same family have similar motifs. Different types of HSPs have different domains, which play important roles in their function. As the earliest family to extend from the evolutionary branch [23], the HSP70 family has the longest evolutionary history and may be more complex in structure. Three of our nine HSP70 genes have no introns, which are typical structures in prokaryotic genes [44], and introns in eukaryotes are gradually transitioned from prokaryotic to eukaryotic [45]. This suggests that the evolution and expansion of the HSP70 family in B. tabaci has already occurred.
HSP70 contains one highly conserved 44 kDa ATPase domain at the N-terminal and one 25 kDa domain at the C-terminal [46]. Furthermore, C-terminal motifs vary with subcellular localization [47]. It has been reported that WangBtHsp70-1 and WangBtHsp70-3 are isolated from other Hsp70 in the phylogenetic tree due to the absence of any known specific motif in the C-terminal [23]. When observing the motifs of the HSP70 family in the phylogenetic tree constructed from 22 BtaHSPs identified in this study, BtaHsp105/110, BtaHsp67B2, and BtaHsp70-7 were also found to be isolated from other HSP70 due to the absence of any known specific motifs at the C-terminus. HSP40 consists of a J domain, G/F domain, zinc-finger domain, and hydroxyl terminal region. HSP40 forms a heterogeneous family whose members have at least a conserved J-domain [48,49]. The HPD motif is present in all J domains known so far [50,51]. The characteristic motif of zinc-finger structure is XX-cysteine-x-glycine-x-glycine (CXXCXGXGX), and the presence of a zinc-finger structure is the basis of HSP40 classification [52]. HSP40 was identified by an HPD motif located at the N-terminal, while classification was dependent upon the presence of a zinc-finger motif and a G/F domain [52]. Taken together, either the N-terminus or the C-terminus motif can be used for the identification and classification of genes of B. tabaci HSP superfamily. From the above information, we can propose that the differentiation and conservation of gene structure are closely related to the evolution and expansion of the B. tabaci HSP gene family.

4.3. Specific BtaHSP Genes Are Important in Coping with Temperature Stress

Previous studies have demonstrated that HSPs contribute to temperature tolerance, and our study obtained 22 BtaHSPs. Therefore, we obtained the expression pattern of the HSP gene superfamily of B. tabaci under heat stress by RT-qPCR. HSP70 is a highly conserved protein that acts as a molecular chaperone, and it is a strong indicator of the response of B. tabaci to heat shock [41,53]. The results showed that most BtaHSP70 genes were induced by heat stress, which was consistent with reported results [23]. As a helper protein of HSP70, HSP40 can promote the ATPase activity of HSP70 [43]. It is speculated that HSP40 is necessary for HSP70 to function properly. Both Hsp70 and Hsp40 are highly conserved, and have high homology in different species [54], so such a mechanism of action is likely to apply to B. tabaci. Our results showed that most HSP40 genes of B. tabaci were induced by heat stress. Although the specific regulatory role of B. tabaci HSP40 on HSP70 is still unclear, in the current study most HSP40s and HSP70 was induced by high temperature. However, members of the Hsc70 family have been reported not to respond to heat stress [55], which is consistent with the description of Hsc70 in the current study.
The expression of BtaHsp70-1 was highest among the candidate genes (nearly 53 times of the normal state). The function of BtaHsp70-1 had been well-studied previously [56]. Therefore, the expression of BtaHsp90A3 (the second-highest increase rate, nearly four times of the normal state) was chosen for the RNA interference test to further study the role of BtaHSP in B. tabaci under high-temperature stress. After silencing of BtaHsp90A3, the heat tolerance of B. tabaci decreased with the decrease of the expression level of the gene, which indicated that BtaHsp90A3 contributes to temperature tolerance.
As the most conserved gene in the HSP family, HSP70 has been extensively studied [19]. Studies have shown that the HSP70 members have the function of receiving the denatured protein caused by stress and then transporting it to HSP90 for repair to complete the resisting process [57]. HSP90 is highly conserved in evolution, and plays a crucial role in different cellular processes, especially reflected in signal transduction and gene transcription [58,59]. Furthermore, HSP90 interacts with intermediates at later stages than HSP70 to make the protein-folding process complete [60]. Therefore, it can be speculated that HSP70 requires HSP90 for complete functionality. No studies on RNA interference in the HSP90 family of B. tabaci MED have been reported. Therefore, this study provides a new idea for the prevention and control of B. tabaci MED by targeting the RNAi of the HSP90 family gene.

5. Conclusions

The 22 Hsps identified in this study were verified by phylogenetic tree construction and secondary structure prediction analysis. Furthermore, we have confirmed that the secondary structure of the genes is closely related to their evolutionary relationships. In this study, we linked the response of these genes, especially BtaHsp90A3 of the HSP90 family, to heat stress. Therefore, it can be inferred that searching for genes related to Hsp70 function from the above-mentioned members of the HSP family is feasible. It can provide new ideas about the regulation mechanism of HSP gene expression in B. tabaci.

Supplementary Materials

The following supporting information can be downloaded at: https://www.mdpi.com/article/10.3390/insects13070570/s1, Figure S1: Phylogenetic relationships of Hsps from Bemisia tabaci, Plutella xylostella, Tribolium castaneum, Drosophila ananassae, Athalia rosae, and Nilaparvata lugens. Figure S2: Phylogenetic relationships of sHsps from Bemisia tabaci, Drosophila ananassae, Athalia rosae, and Nilaparvata lugens. Figure S3: Phylogenetic relationships of Hsp40, Hsp100, Hsp105/110, Hsp67B2 from Bemisia tabaci, Drosophila ananassae, Athalia rosae, and Nilaparvata lugens. Figure S4: Phylogenetic relationships and gene structures analysis of the Bemisia tabaci HSP (BtaHSP) gene superfamily. Figures S5−S9: The secondary structures of Bemisia tabaci sHSPs, HSP40s, HSP60s, HSP70s, and HSP90s. Supplementary Data Sheet 1: Sequence logos for the conserved motifs of sHSPs in the Bemisia tabaci BtasHsp motif. Supplementary Data Sheet 2: Information of Hsp sequences in the six surveyed species. Table S1: Gene-specific primers for RT-qPCR used in this study.

Author Contributions

Conceptualization, H.-Y.Z. and D.C.; methodology, H.-Y.Z., K.Y. and P.-H.Q.; software, H.-Y.Z. and K.Y.; validation, D.C.; formal analysis, H.-Y.Z. and K.Y.; investigation, H.-Y.Z. and P.-H.Q.; resources, D.C.; data curation, H.-Y.Z.; writing—original draft preparation, H.-Y.Z.; writing—review and editing, D.C., K.Y., T.-X.L. and Y.-J.Z.; visualization, H.-Y.Z.; supervision, D.C., T.-X.L. and Y.-J.Z.; project administration, D.C.; funding acquisition, D.C. and K.Y. All authors have read and agreed to the published version of the manuscript.

Funding

This research was funded by the National Natural Science Foundation of China (31872030), the Taishan Scholar Foundation of Shandong Province (tsqn20161040), the First-Class Grassland Science Discipline Program in Shandong Province (1619002), and the Qingdao Agricultural University High-Level Talent Fund (633-1121025), China.

Institutional Review Board Statement

Not applicable.

Informed Consent Statement

Not applicable.

Data Availability Statement

The data presented in this study are available within the article and Supplementary Materials.

Acknowledgments

The authors would like to thank all the editors and reviewers for the modifications and suggestions regarding the manuscript.

Conflicts of Interest

The authors declare no conflict of interest.

References

  1. Boher, F.; Trefault, N.; Piulachs, M.D.; Belles, X.; Godoy, H.R.; Bozinovic, F. Biogeographic origin and thermal acclimation interact to determine survival and hsp90 expression in Drosophila species submitted to thermal stress. Comp. Biochem. Physiol. Part A Mol. Integr. Physiol. 2012, 162, 391–396. [Google Scholar] [CrossRef]
  2. Stetina, T.; Kostal, V.; Korbelova, J. The role of inducible Hsp70, and other heat shock proteins, in adaptive complex of cold tolerance of the fruit fly (Drosophila melanogaster). PLoS ONE 2015, 10, e0128976. [Google Scholar] [CrossRef] [Green Version]
  3. Teets, N.M.; Peyton, J.T.; Colinet, H.; Renault, D.; Denlinger, D.L. Gene expression changes governing extreme dehydration tolerance in an antarctic insect. Proc. Natl. Acad. Sci. USA 2013, 109, 20744–20749. [Google Scholar] [CrossRef] [Green Version]
  4. Cao, F.L.; Cheng, H.; Cheng, S.Y.; Li, L.L.; Xu, F.; Yu, W.W.; Yuan, H.H. Expression of selected Ginkgo biloba heat shock protein genes after cold treatment could be induced by other abiotic stress. Int. J. Mol. Sci. 2012, 13, 5768–5788. [Google Scholar] [CrossRef]
  5. Brigotti, M.; Petronini, P.G.; Carnicelli, D.; Alfieri, R.R.; Bonelli, M.A.; Borghetti, A.F.; Wheeler, K.P. Effects of osmolarity, ions and compatible osmolytes on cell−free protein synthesis. Biochem. J. 2003, 369, 369–374. [Google Scholar] [CrossRef]
  6. Xin, L.L.; Li, X.H.; Deng, H.X.; Kuang, D.; Dai, X.Y.; Huang, S.L.; Wang, F.; He, M.A.; Currie, R.W.; Wu, T.C. Development of stable HSPA1A promoter−driven luciferase reporter HepG2 cells for assessing the toxicity of organic pollutants present in air. Cell Stress Chaperones 2012, 17, 567–576. [Google Scholar] [CrossRef] [Green Version]
  7. Cui, Y.D.; Du, Y.Z.; Lu, M.X.; Qiang, C.K. Cloning of the heat shock protein 60 gene from the stem borer, Chilo suppressalis, and analysis of expression characteristics under heat stress. J. Insect Sci. 2010, 10, 100. [Google Scholar] [CrossRef] [Green Version]
  8. Advani, N.K.; Kenkel, C.D.; Davies, S.W.; Parmesan, C.; Singer, M.C.; Matz, M.V. Variation in heat shock protein expression at the latitudinal range limits of a widely−distributed species, the Glanville fritillary butterfly (Melitaea cinxia). Physiol. Entomol. 2016, 41, 241–248. [Google Scholar] [CrossRef]
  9. Cahan, S.H.; Nguyen, A.D.; Stanton, G.J.; Penick, C.A.; Hernaiz, H.Y.; de Marco, B.B.; Gotelli, N.J. Modulation of the heat shock response is associated with acclimation to novel temperatures but not adaptation to climatic variation in the ants Aphaenogaster picea and A. rudis. Comp. Biochem. Physiol. A Mol. Integr. Physiol. 2017, 204, 113–120. [Google Scholar] [CrossRef] [Green Version]
  10. Shu, Y.H.; Du, Y.; Wang, J.W. Molecular characterization and expression patterns of Spodoptera litura heat shock protein 70/90, and their response to zinc stress. Comp. Biochem. Physiol. Part A Mol. Integr. Physiol. 2011, 158, 102–110. [Google Scholar] [CrossRef]
  11. Kim, B.M.; Rhee, J.S.; Jeong, C.B.; Seo, J.S.; Park, G.S.; Lee, Y.M.; Lee, J.S. Heavy metals induce oxidative stress and trigger oxidative stress−mediated heat shock protein (hsp) modulation in the intertidal copepod Tigriopus japonicus. Comp. Biochem. Physiol. Part A Mol. Integr. Physiol. 2014, 166, 65–74. [Google Scholar] [CrossRef]
  12. Ashbrook, A.R.; Feder, J.L.; Scharf, M.E.; Bennett, G.W.; Gondhalekar, A.D. Characterization of heat exposure−associated escape behaviors and HSP gene expression in bed bugs (Cimex lectularius L.). Pest Manag. Sci. 2021, 78, 205–216. [Google Scholar] [CrossRef]
  13. Feder, M.E.; Hofmann, G.E. Heat−shock proteins, molecular chaperones, and the stress response: Evolutionary and ecological physiology. Ann. Rev. Physiol. 1999, 61, 243–282. [Google Scholar] [CrossRef] [Green Version]
  14. Sørensen, J.G.; Kristensen, T.N.; Loeschcke, V. The evolutionary and ecological role of heat shock proteins. Ecol. Lett. 2003, 6, 1025–1037. [Google Scholar] [CrossRef]
  15. Mugerwa, H.; Colvin, J.; Alicai, T.; Omongo, C.A.; Kabaalu, R.; Visendi, P.; Sseruwagi, P.; Seal, S.E. Genetic diversity of whitefly (Bemisia spp.) on crop and uncultivated plants in Uganda: Implications for the control of this devastating pest species complex in Africa. J. Pest Sci. 2021, 94, 1307–1330. [Google Scholar] [CrossRef]
  16. Guo, C.L.; Zhu, Y.Z.; Zhang, Y.J.; Keller, M.A.; Liu, T.X.; Chu, D. Invasion biology and management of sweetpotato whitefly (Hemiptera: Aleyrodidae) in China. J. Integr. Pest Manag. 2021, 12, pmaa024. [Google Scholar] [CrossRef]
  17. Díaz, F.; Orobio, R.F.; Chavarriaga, P.; Toro−Perea, N. Differential expression patterns among heat−shock protein genes and thermal responses in the whitefly Bemisia tabaci (MEAM1). J. Therm. Biol. 2015, 52, 199–207. [Google Scholar] [CrossRef]
  18. Su, Q.; Li, S.; Shi, C.; Zhang, J.; Zhang, G.; Jin, Z.; Zhang, Y. Implication of heat−shock protein 70 and UDP−glucuronosyltransferase in thiamethoxam−induced whitefly Bemisia tabaci thermotolerance. J. Pest Sci. 2018, 91, 469–478. [Google Scholar] [CrossRef]
  19. Bai, J.; Wang, Y.C.; Liu, Y.C.; Chang, Y.W.; Liu, X.N.; Gong, W.R.; Du, Y.-Z. Isolation of two new genes encoding heat shock protein 70 in Bemisia tabaci and analysis during thermal stress. Int. J. Biol. Macromol. 2021, 193, 933–940. [Google Scholar] [CrossRef]
  20. Xiao, N.; Pan, L.L.; Zhang, C.R.; Shan, H.W.; Liu, S.S. Differential tolerance capacity to unfavourable low and high temperatures between two invasive whiteflies. Sci. Rep. 2016, 6, 24306. [Google Scholar] [CrossRef] [Green Version]
  21. Yu, H.; Wan, F.H.; Guo, J.Y. Different thermal tolerance and hsp gene expression in invasive and indigenous sibling species of Bemisia tabaci. Biol. Invasions 2012, 14, 1587–1595. [Google Scholar] [CrossRef]
  22. Pusag, J.C.A.; Jahan, S.M.H.; Lee, K.S.; Lee, S.; Lee, K.Y. Upregulation of temperature susceptibility in Bemisia tabaci upon acquisition of tomato yellow leaf curl virus (TYLCV). J. Insect Physiol. 2012, 58, 1343–1348. [Google Scholar] [CrossRef]
  23. Wang, X.R.; Wang, C.; Ban, F.X.; Zhu, D.T.; Liu, S.S.; Wang, X.W. Genome−wide identification and characterization of HSP gene superfamily in whitefly (Bemisia tabaci) and expression profiling analysis under temperature stress. Insect Sci. 2019, 26, 44–57. [Google Scholar] [CrossRef] [Green Version]
  24. Bai, J.; Liu, X.N.; Lu, M.X.; Du, Y.Z. Characterization of genes encoding small heat shock proteins from Bemisia tabaci and expression under thermal stress. PeerJ 2019, 7, e6992. [Google Scholar] [CrossRef] [Green Version]
  25. Chu, D.; Hu, X.; Gao, C.; Zhao, H.; Nichols, R.L.; Li, X. Use of mitochondrial cytochrome oxidase I polymerase chain reaction−restriction fragment length polymorphism for identifying subclades of Bemisia tabaci Mediterranean group. J. Econ. Entomol. 2012, 105, 242–251. [Google Scholar] [CrossRef]
  26. Marchler−Bauer, A.; Derbyshire, M.K.; Gonzales, N.R.; Lu, S.; Chitsaz, F.; Geer, L.Y.; Geer, R.C.; He, J.; Gwadz, M.; Hurwitz, D.I.; et al. CDD: NCBI’s conserved domain database. Nucleic Acids Res. 2015, 43, D222–D226. [Google Scholar] [CrossRef] [Green Version]
  27. Cai, Q.; Tian, L.; Xie, J.T.; Huang, Q.Y.; Feng, M.G.; Keyhani, N.O. A fungal sirtuin modulates development and virulence in the insect pathogen, Beauveria bassiana. Environ. Microbiol. 2021, 23, 5164–5183. [Google Scholar] [CrossRef]
  28. Yu, C.S.; Lin, C.J.; Hwang, J.K. Predicting subcellular localization of proteins for Gram−negative bacteria by support vector machines based on n−peptide compositions. Protein Sci. 2004, 13, 1402–1406. [Google Scholar] [CrossRef] [Green Version]
  29. Edgar, R.C. MUSCLE: A multiple sequence alignment method with reduced time and space complexity. BMC Bioinform. 2004, 5, 113. [Google Scholar] [CrossRef] [Green Version]
  30. Pignatelli, P.; Ingham, V.A.; Balabanidou, V.; Vontas, J.; Lycett, G.; Ranson, H. The Anopheles gambiae ATP−binding cassette transporter family: Phylogenetic analysis and tissue localization provide clues on function and role in insecticide resistance. Insect Mol. Biol. 2018, 27, 110–122. [Google Scholar] [CrossRef] [Green Version]
  31. Lindquist, S.; Craig, E.A. The heat−shock proteins. Ann. Rev. Genet. 1988, 22, 631–677. [Google Scholar] [CrossRef]
  32. Li, Z.W.; Li, X.; Yu, Q.Y.; Xiang, Z.H.; Kishino, H.; Zhang, Z. The small heat shock protein (sHSP) genes in the silkworm, Bombyx mori, and comparative analysis with other insect sHSP genes. BMC Evol. Biol. 2009, 9, 1–14. [Google Scholar] [CrossRef] [Green Version]
  33. Kiang, J.G.; Tsokos, G.C. Heat shock protein 70 kDa: Molecular biology, biochemistry, and physiology. Pharmacol. Ther. 1998, 80, 183–201. [Google Scholar] [CrossRef]
  34. Chen, B.; Zhong, D.; Monteiro, A. Comparative genomics and evolution of the HSP90 family of genes across all kingdoms of organisms. BMC Genom. 2006, 7, 596–609. [Google Scholar] [CrossRef] [Green Version]
  35. Bailey, T.L.; Boden, M.; Buske, F.A.; Frith, M.; Grant, C.E.; Clementi, L.; Ren, J.; Li, W.W.; Noble, W.S. MEME SUITE: Tools for motif discovery and searching. Nucleic Acids Res. 2009, 37, W202–W208. [Google Scholar] [CrossRef]
  36. Hu, B.; Jin, J.; Guo, A.Y.; Zhang, H.; Luo, J.; Gao, G. GSDS 2.0: An upgraded gene feature visualization server. Bioinformatics 2015, 31, 1296–1297. [Google Scholar] [CrossRef] [Green Version]
  37. Robert, X.; Gouet, P. Deciphering key features in protein structures with the new ENDscript server. Nucleic Acids Res. 2014, 42, W320–W324. [Google Scholar] [CrossRef] [Green Version]
  38. Lu, D.Y.H.; Yue, H.; Huang, L.P.; Zhang, D.Y.; Zhang, Z.H.; Zhang, Z.; Zhang, Y.J.; Li, F.; Yan, F.; Zhou, X.G.; et al. Suppression of Bta11975, an α-glucosidase, by RNA interference reduces transmission of tomato chlorosis virus by Bemisia tabaci. Pest Manag. Sci. 2021, 77, 5294–5303. [Google Scholar] [CrossRef]
  39. Gharbi, S.; Shamsara, M.; Khateri, S.; Soroush, M.R.; Mowla, S.J. Identification of reliable reference genes for quantification of microRNAs in serum samples of sulfur mustard−exposed veterans. Cell J. 2015, 17, 494–501. [Google Scholar] [CrossRef]
  40. Livak, K.J.; Schmittgen, T.D. Analysis of relative gene expression data using real−time quantitative PCR. Methods 2002, 25, 402–408. [Google Scholar] [CrossRef]
  41. Neven, L.G. Physiological responses of insects to heat. Postharvest Biol. Technol. 2000, 21, 103–111. [Google Scholar] [CrossRef]
  42. Nobuyuki, Y.; Hajime, F.; Youhei, S.; Takumi, H. Hsp105β upregulates hsp70 gene expression through signal transducer and activator of transcription−3. FEBS J. 2009, 276, 5870–5880. [Google Scholar] [CrossRef]
  43. Hartl, F.U. Molecular chaperones in cellular protein folding. Nature 1996, 381, 571–580. [Google Scholar] [CrossRef]
  44. Huang, W.; Xian, Z.; Kang, X.; Tang, N.; Li, Z. Genome−wide identification, phylogeny and expression analysis of GRAS gene family in tomato. BMC Plant Biol. 2015, 15, 1–18. [Google Scholar] [CrossRef] [Green Version]
  45. Zou, M.; Guo, B.; He, S. The roles and evolutionary patterns of intronless genes in deuterostomes. Compar. Funct. Genom. 2011, 252–254. [Google Scholar] [CrossRef] [PubMed] [Green Version]
  46. Bukau, B.; Horwich, A.L. The Hsp70 and Hsp60 chaperone machines. Cell 1998, 92, 351–366. [Google Scholar] [CrossRef] [Green Version]
  47. Boorstein, W.R.; Ziegelhoffer, T.; Craig, E.A. Molecular evolution of the Hsp70 multigene family. J. Mol. Biol. 1994, 38, 1–17. [Google Scholar] [CrossRef]
  48. Mayer, M.P.; Bukau, B. Hsp70 chaperones: Cellular functions and molecular mechanism. Cell. Mol. Life Sci. 2005, 62, 670–684. [Google Scholar] [CrossRef] [Green Version]
  49. Kampinga, H.H.; Craig, E.A. The HSP70 chaperone machinery: J proteins as drivers of functional specificity. Nat. Rev. Mol. Cell Biol. 2010, 11, 579–592. [Google Scholar] [CrossRef] [Green Version]
  50. Kluck, C.J.; Patzelt, H.; Genevaux, P.; Brehmer, D.; Rist, W.; Schneider−Mergener, J.; Bukau, B.; Mayer, M.P. Structure−function analysis of HscC, the Escherichia coli member of a novel subfamily of specialized Hsp70 chaperones. J. Biol. Chem. 2002, 277, 41060–41069. [Google Scholar] [CrossRef] [Green Version]
  51. Walsh, P.; Bursa, D.; Law, Y.C.; Cyr, D.; Lithgow, T. The J−protein family: Modulating protein assembly, disassembly and translocation. EMBO Rep. 2004, 5, 567–571. [Google Scholar] [CrossRef] [PubMed] [Green Version]
  52. Fritha, H.; Michael, E.C.; Heini, W.D.; Gregory, L.B. Analysis of the levels of conservation of the J domain among the various types of DnaJ−like proteins. Cell Stress Chaperones 2000, 5, 347. [Google Scholar] [CrossRef]
  53. Jiang, X.; Zhai, H.; Wang, L.; Luo, L.; Zhang, S.L. Cloning of the heat shock protein 90 and 70 genes from the beet armyworm, Spodoptera exigua, and expression characteristics in relation to thermal stress and development. Cell Stress Chaperones 2012, 17, 67–80. [Google Scholar] [CrossRef] [Green Version]
  54. Balchin, D.; Hayer-Hartl, M.; Hartl, F.U. Recent advances in understanding catalysis of protein folding by molecular chaperones. FEBS Lett. 2020, 594, 2770–2781. [Google Scholar] [CrossRef] [PubMed]
  55. Sun, G.; Cao, Y.; Xu, Y.T.; Huai, D.; Chen, P.; Guo, J.; Li, M.; Dai, Y.Y. Overexpression of Hsc70 promotes proliferation, migration, and invasion of human glioma cells. J. Cell. Biochem. 2019, 120, 10707–10714. [Google Scholar] [CrossRef]
  56. Shim, J.K.; Lee, G.S.; Lee, S.; Lee, K.Y. Oral ingestion of heat shock protein 70 dsRNA is lethal under normal and thermal stress conditions in the sweetpotato whitefly, Bemisia tabaci. J. Asia Pac. Entomol. 2015, 18, 797–800. [Google Scholar] [CrossRef]
  57. Jiang, F.; Chang, G.; Li, Z.; Abouzaid, M.; Du, X.; Lin, Y. The HSP/co−chaperone network in environmental cold adaptation of Chilo suppressalis. Int. J. Biol. Macromol. 2021, 187, 780–788. [Google Scholar] [CrossRef]
  58. Schopf, F.H.; Biebl, M.M.; Buchner, J. The HSP90 chaperone machinery. Nat. Rev. Mol. Cell Biol. 2017, 18, 345–360. [Google Scholar] [CrossRef]
  59. Tania, M.L.; Matthias, P.M.; Stefan, G.R. The Hsp70−Hsp90 chaperone cascade in protein folding. Trends Cell Biol. 2019, 29, 164–177. [Google Scholar] [CrossRef]
  60. Karagoez, G.E.; Rudiger, S.G.D. Hsp90 interaction with clients. Trends Biochem. Sci. 2015, 40, 117–125. [Google Scholar] [CrossRef]
Figure 1. Phylogenetic relationships of Hsp from Bemisia tabaci, Plutella xylostella, Tribolium castaneum, Drosophila ananassae, Athalia rosae, and Nilaparvata lugens. The unrooted phylogenetic tree was constructed using MEGA7 by the neighbor-joining method and the bootstrap test was set as 1000 replicates. The colored shadow represents the different BtaHsp families.
Insects 13 00570 g001
Figure 2. Phylogenetic relationships of sHsps from Bemisia tabaci, Plutella xylostella, Tribolium castaneum, Drosophila ananassae, Athalia rosae, and Nilaparvata lugens. The unrooted phylogenetic tree was constructed using MEGA7 by the neighbor-joining method and the bootstrap test was set as 1000 replicates. The colored shadow represents the different BtaHsp families.
Insects 13 00570 g002
Figure 3. Phylogenetic relationships of Hsp40, Hsp100, Hsp105/110, and Hsp67B2 from Bemisia tabaci, Drosophila ananassae, Athalia rosae, and Nilaparvata lugens. The unrooted phylogenetic tree was constructed using MEGA7 by the neighbor-joining method. The bootstrap test set as 1000 replicates.
Insects 13 00570 g003
Figure 4. Phylogenetic relationships of 29 BtHsp of Bemisia tabaci (Wang et al., 2019; Bai et al., 2019) and 22 BtaHsps of this study. The unrooted phylogenetic tree was constructed using MEGA7 by the neighbor−joining method and the bootstrap test was set as 1000 replicates. The colored shadow represents the different BtaHsp families.
Insects 13 00570 g004
Figure 5. Phylogenetic relationships and gene structures analysis of the Bemisia tabaci HSP (BtaHSP) gene superfamily. The unrooted phylogenetic tree was constructed using MEGA7 by the neighbor-joining method and the bootstrap test was set as 1000 replicates. The colored shadow represents the different BtaHsp families. CDS/intron structures of BtaHSP genes. The yellow boxes, gray lines, and blue boxes, respectively, represent the cds, intron, and untranslated regions (UTR).
Insects 13 00570 g005
Figure 6. Phylogenetic relationships and protein motif analysis of the Bemisia tabaci heat shock protein (BtaHSP) gene superfamily. The unrooted phylogenetic tree was constructed using MEGA7 by the neighbor-joining method and the bootstrap test was set as 1000 replicates. The colored shadow represents the different BtaHsp families. The MEME database identified all the motifs with the complete amino acid sequences of BtaHsps. Lengths of each BtaHSP motif were demonstrated proportionally.
Insects 13 00570 g006
Figure 7. Phylogenetic relationships and gene expression under 42 °C treatment for 3.5 h of the Bemisia tabaci HSP (BtaHSP) gene superfamily. The unrooted phylogenetic tree was constructed using MEGA7 by the neighbor-joining method and the bootstrap test was set as 1000 replicates. The colored shadow represents the different HSP families. The heatmap showed the RT-qPCR analysis results of HSP genes in B. tabaci subjected to heat stress. The colors of the bar vary from blue to red and represent the scale of relative expression levels. The two columns represent the two processing temperatures, and each row represents one HSP gene member.
Insects 13 00570 g007
Figure 8. (A) RNAi efficiency of BtaHsp90A3 after feeding double-stranded RNA (dsRNA). (B) Survival rates: percentage of surviving adults after 42 °C treatment for 2 h. The survival rate of Bemisia tabaci treated with dsgfp and dsBtaHsp90A3 in different treatment groups. Significant differences are calculated by Student’s t-test, ** p < 0.01, *** p < 0.001.
Insects 13 00570 g008
Table 1. Information on HSP genes superfamily in Bemisia tabaci.
FamilyGene
Identifier
Gene NameCDSMw
(kDa)
pISubcelluar LocationStrand
sHSPOM176688BtaHsp23.891–72023.86.92Extracellular/nuclearPlus
HSP40OM176682BtaHsp40-1202–95728.96.55NuclearPlus
OM176693BtaHsp40-21–135050.29.31NuclearPlus
OM176684BtaHsp40-3232–128438.89.11NuclearPlus
OM176675BtaHsp40-4380–157944.46.35NuclearPlus
HSP60OM176680BtaHsp601–166858.95.38Cytoplasmic/nuclearPlus
HSP70OM176673BtaHsp70-1228–2180728.22Mitochondrial/nuclearPlus
OM176691BtaHsp70-27–165960.75.6Cytoplasmic/nuclearPlus
OM176686BtaHsp70-31–177665.75.92Cytoplasmic/nuclearPlus
OM176692BtaHsc70-11–175865.35.21ER/nuclearPlus
OM176674BtaHsc70-2394–225367.55.3NuclearPlus
OM176678BtaHsp70-41–190868.74.94Cytoplasmic/nuclearPlus
OM176681BtaHsp70-51–192670.75.5Cytoplasmic/nuclearPlus
OM176685BtaHsp70-61–157257.65.57Plasma membranePlus
OM176676BtaHsp70-7207–261889.95.43Cytoplasmic/nuclearPlus
OM176689BtaHsp105/1101–2904107.65.32Cytoplasmic/ERPlus
OM176683BtaHsp67B2420–91718.68.91MitochondrialPlus
HSP90OM176677BtaHsp90A11–190272.45.11Cytoplasmic/nuclearPlus
OM176694BtaHsp90A2135–246288.75.09Cytoplasmic/cytoskeletal/nuclearPlus
OM176687BtaHsp90A3308–224274.25.07Cytoplasmic/nuclearPlus
OM176690BtaHsp90A4207–2402845.01Cytoplasmic/nuclearPlus
HSP100OM176679BtaHsp1001–247292.45.96CytoplasmicPlus
Publisher’s Note: MDPI stays neutral with regard to jurisdictional claims in published maps and institutional affiliations.

