Monitoring Temporal Trends in Internet Searches for “Ticks” across Europe by Google Trends: Tick–Human Interaction or General Interest?
Simple Summary
Abstract
1. Introduction
2. Materials and Methods
2.1. Regarding the Credibility of Search Term Records
2.2. Google Trends Search Data Entry, Selection and Reports
2.3. The Influence of Search Terms in Records Pertaining to Denmark
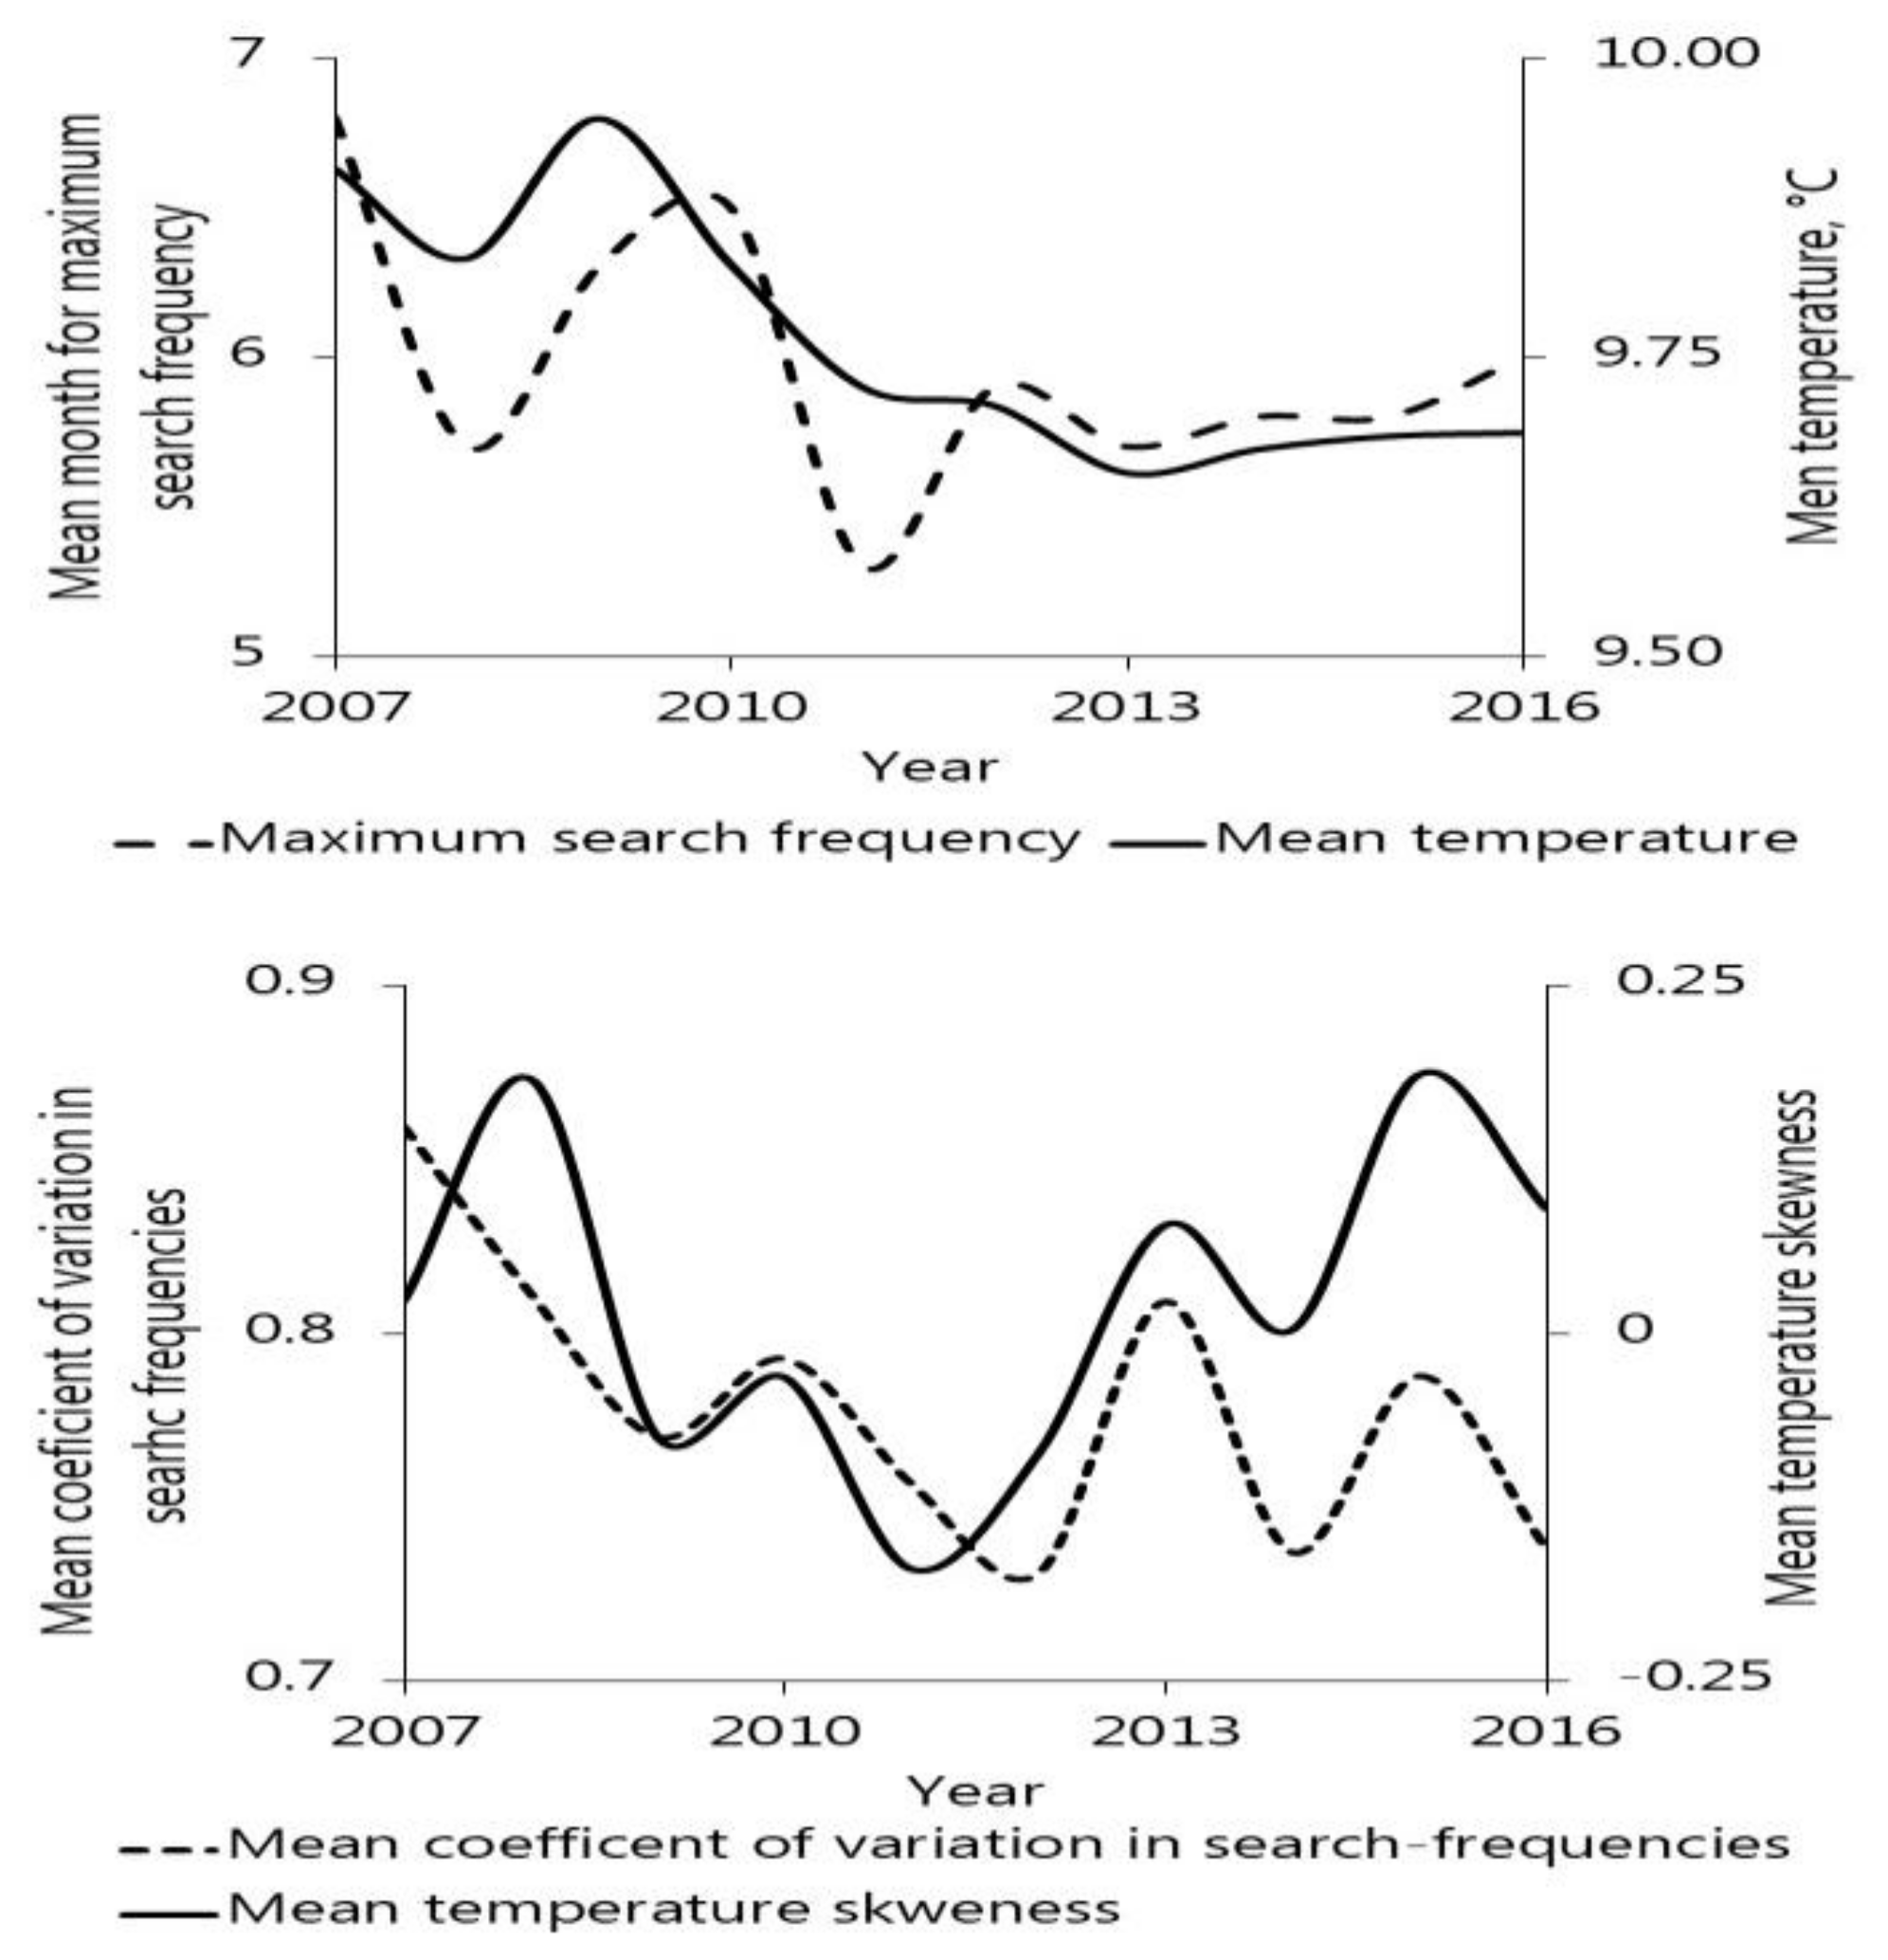
2.4. Seasonal Characteristics and Their Association with Varying Weather Patterns across Europe
3. Results
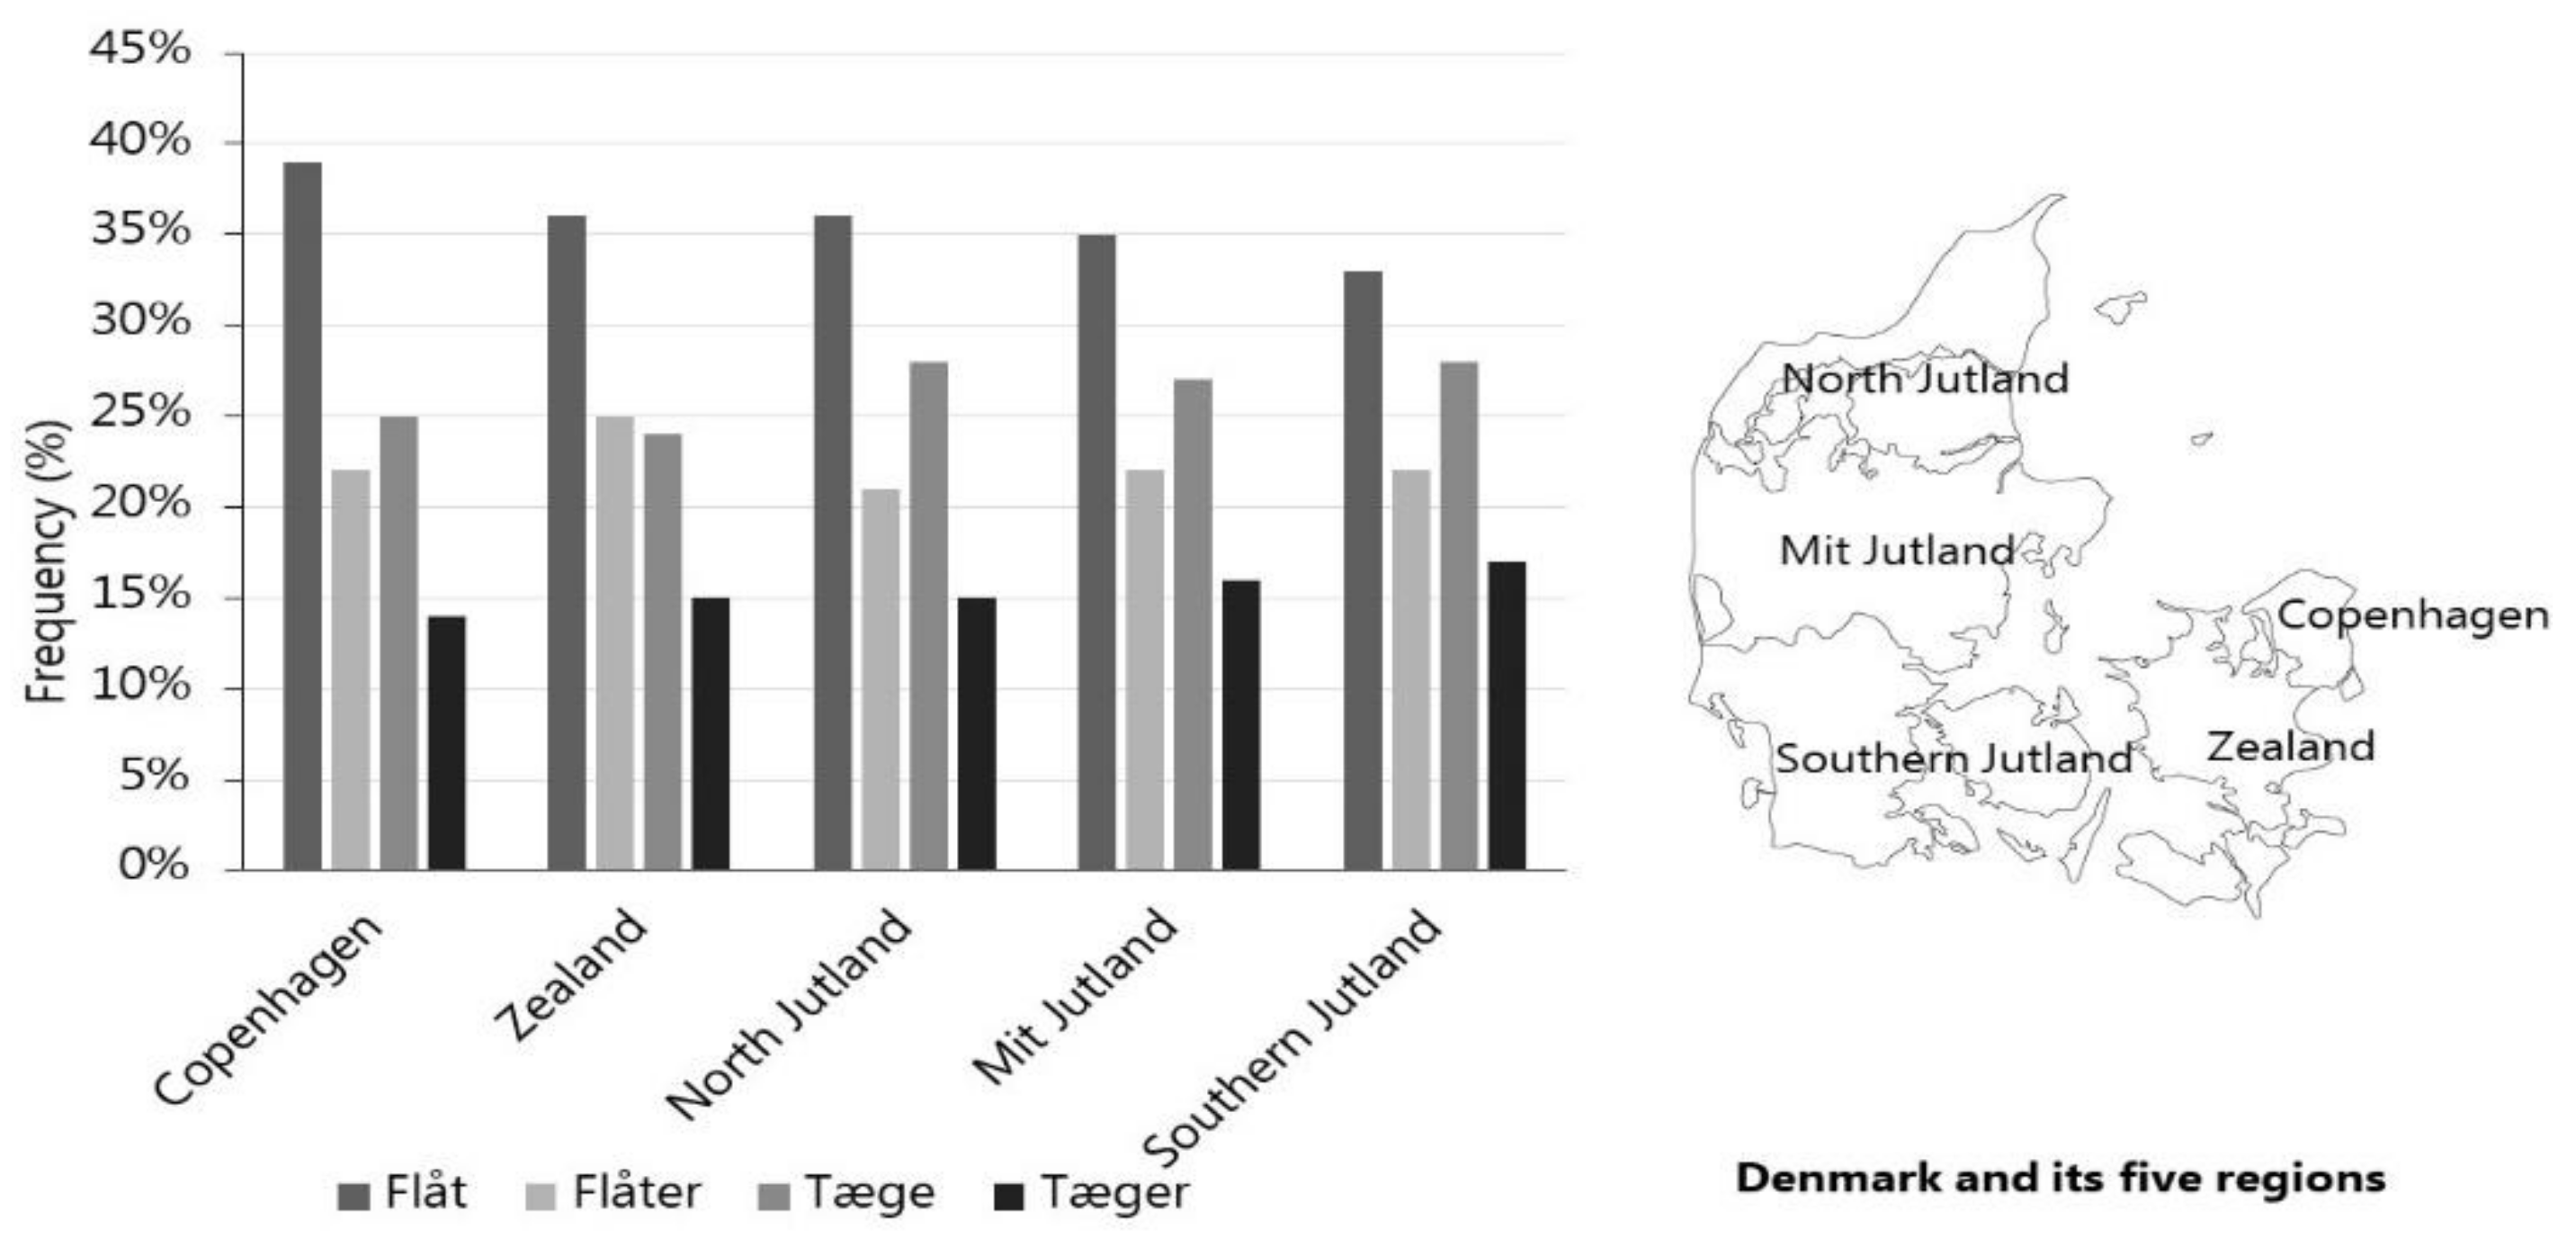
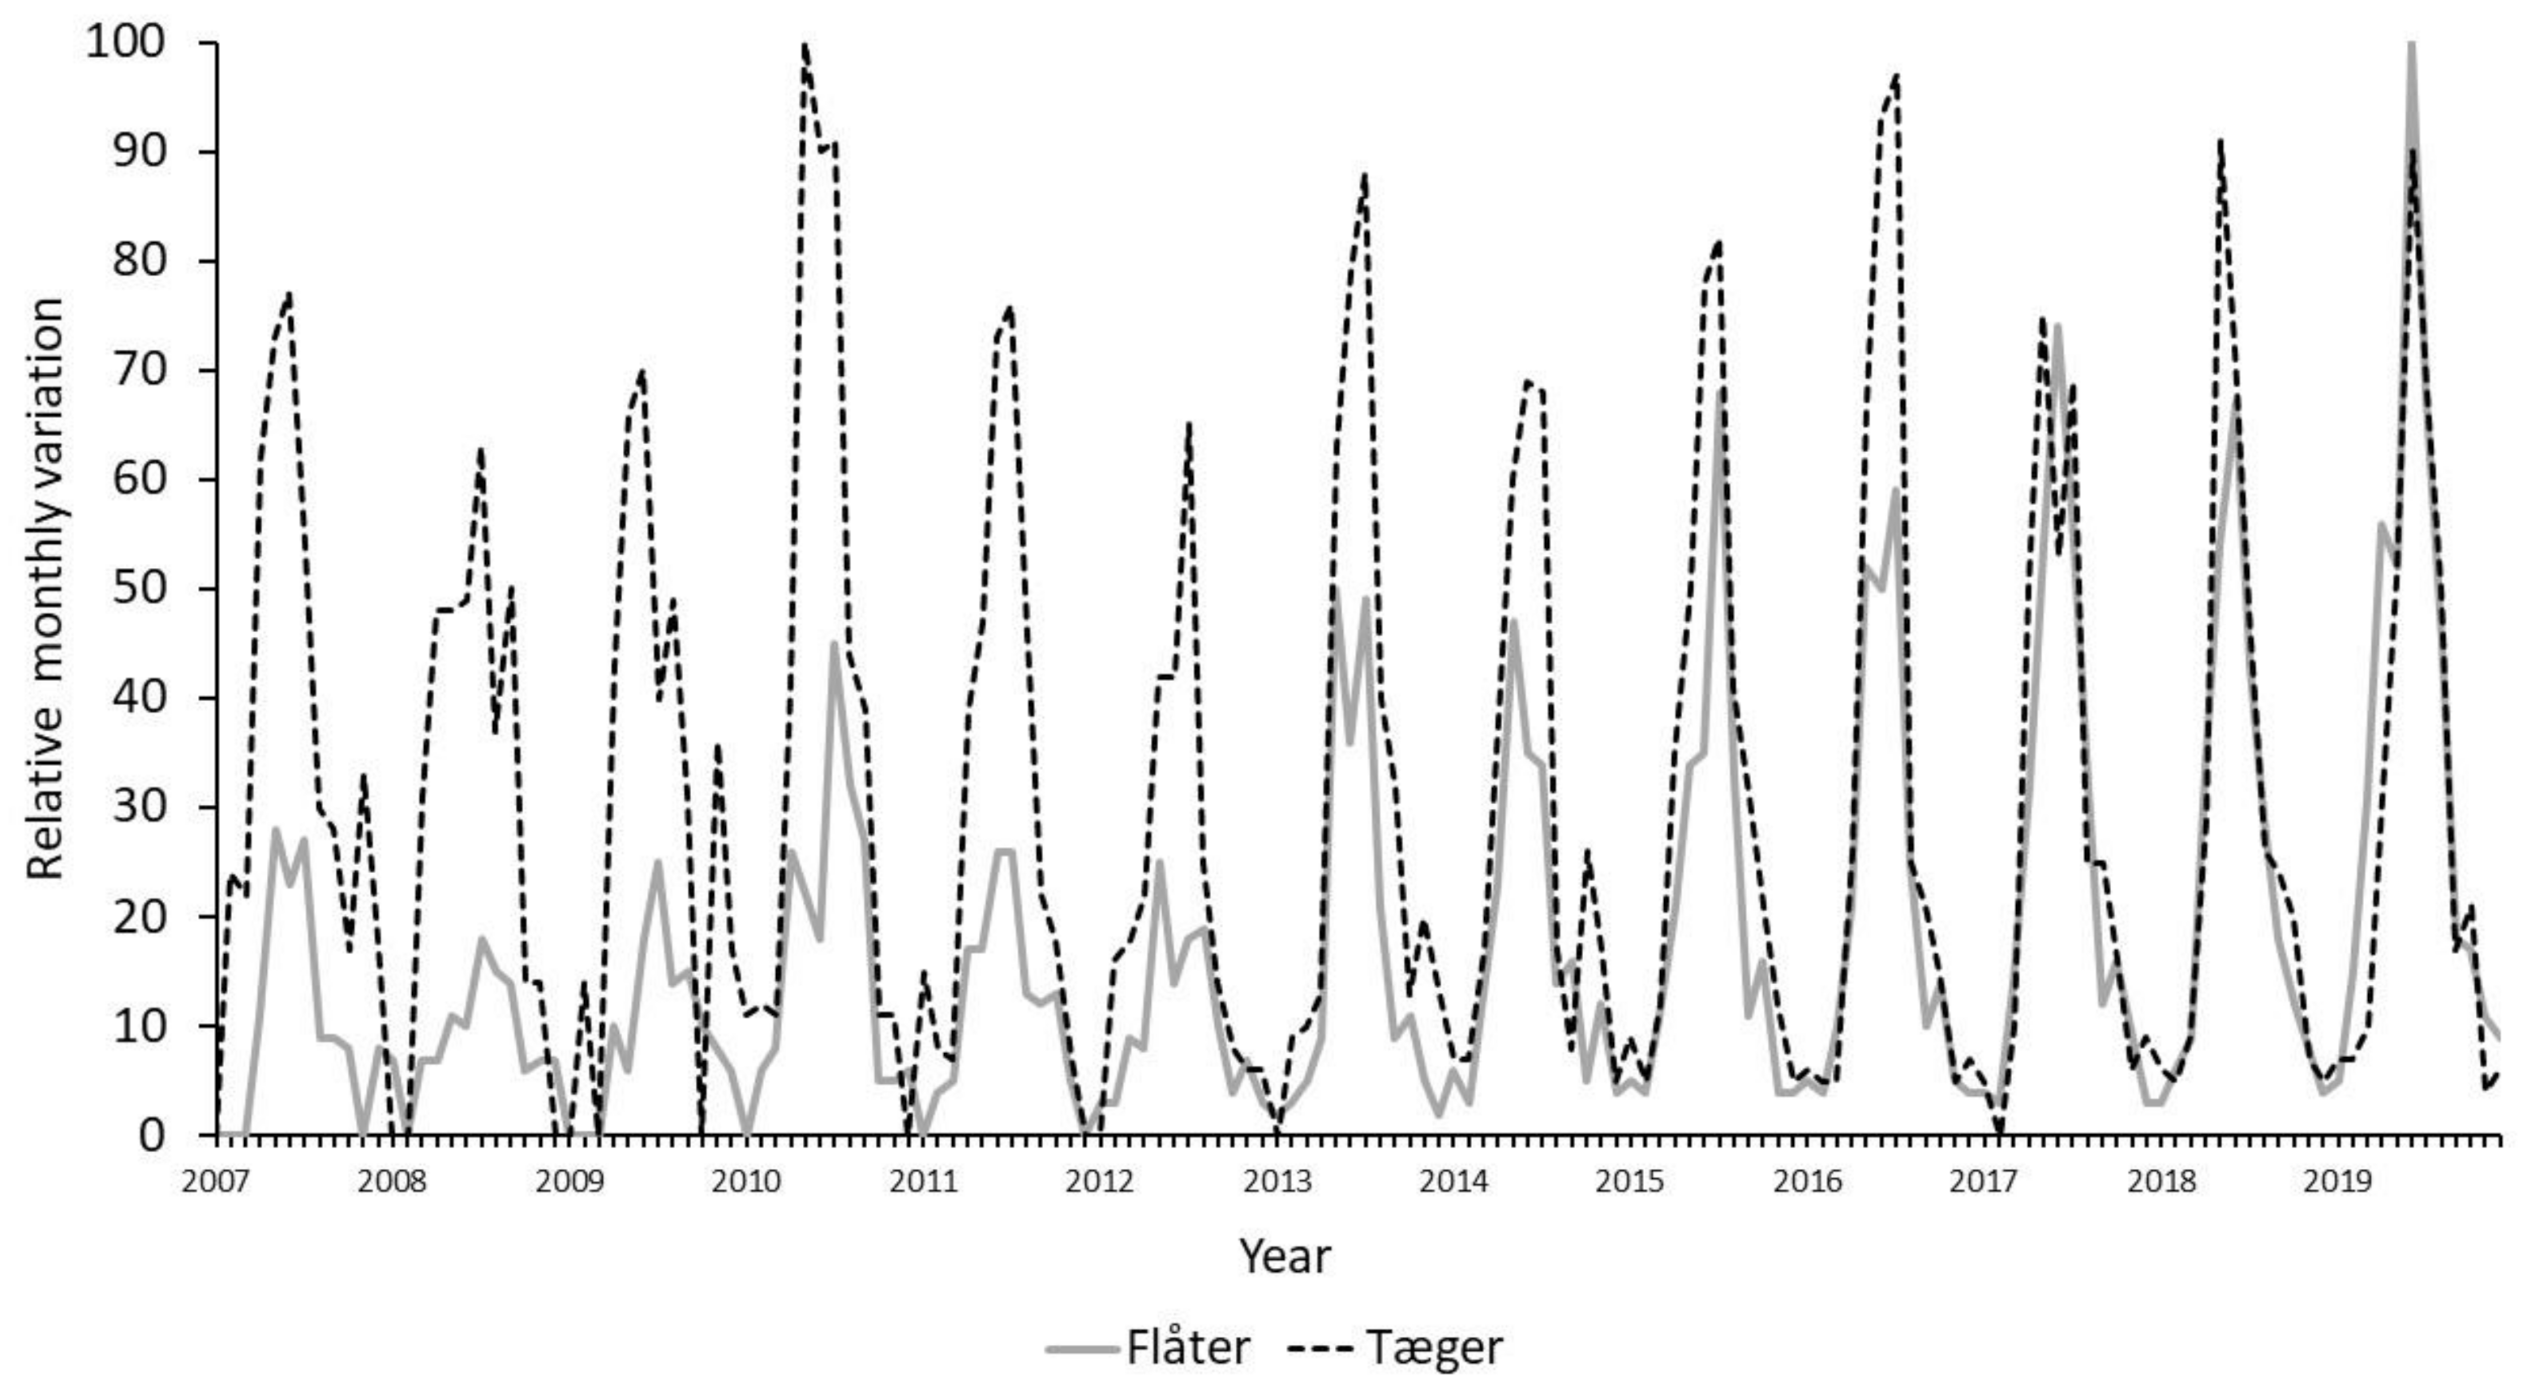
3.1. The Influence of Search Terms
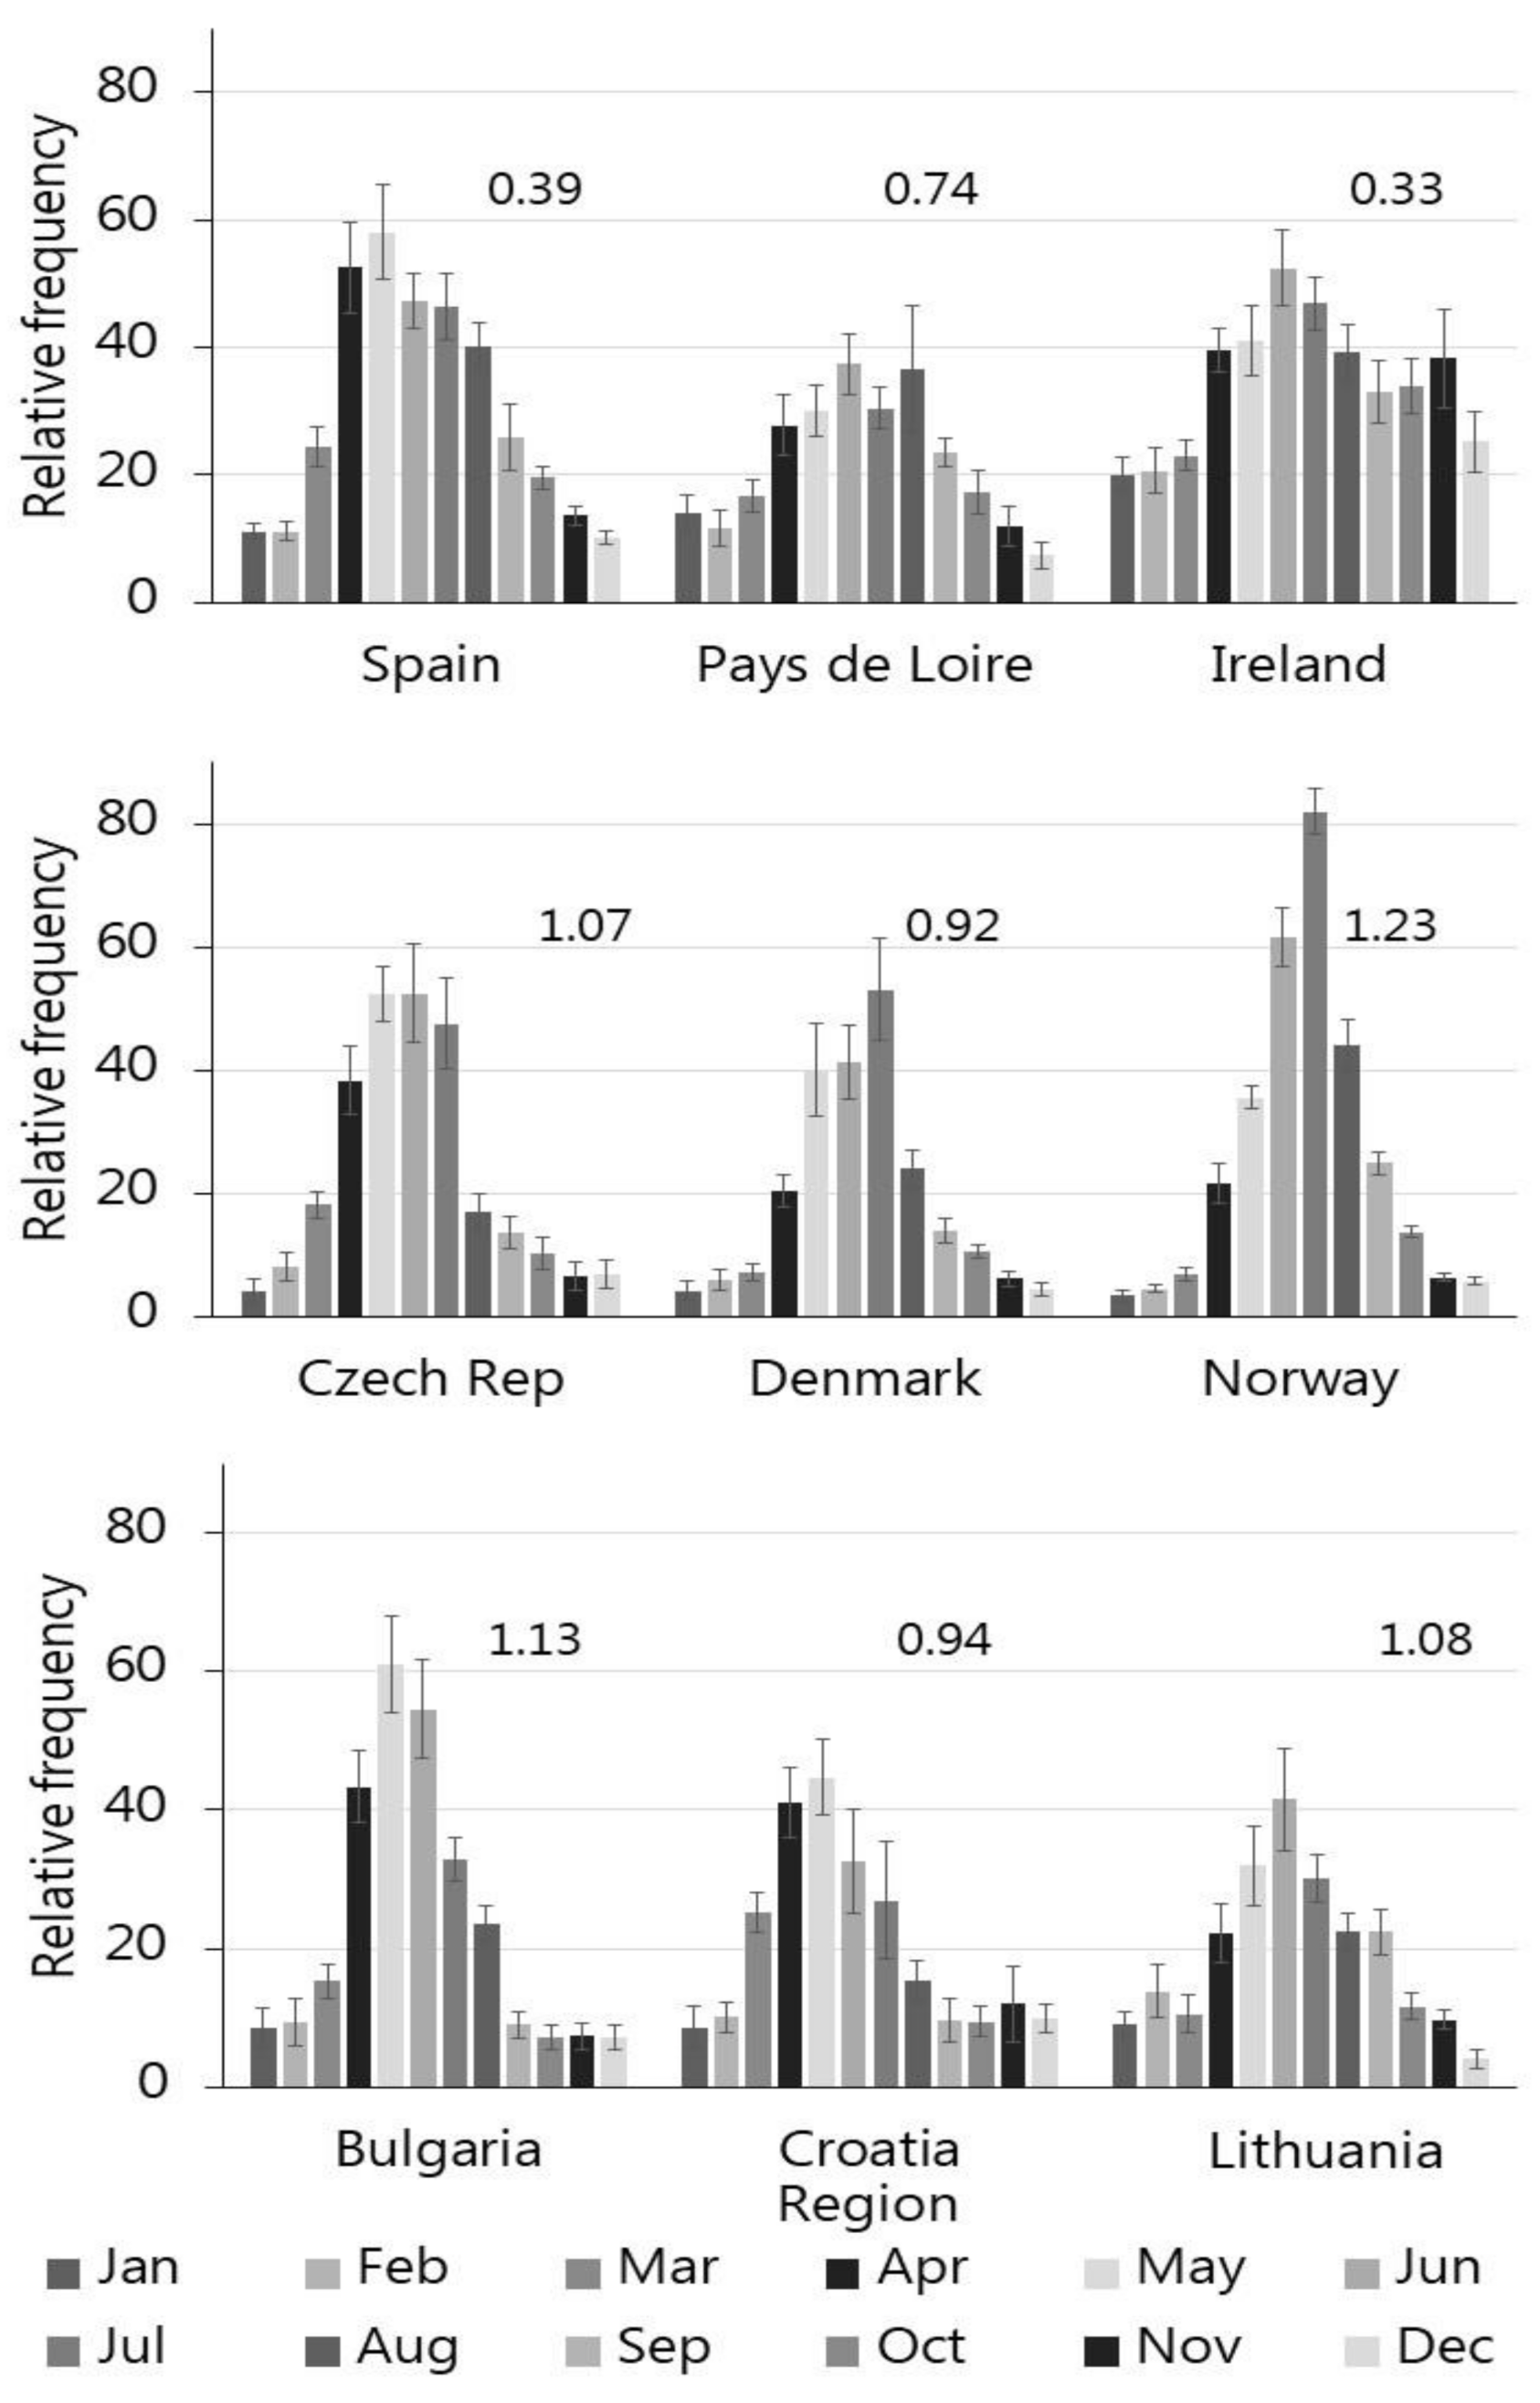
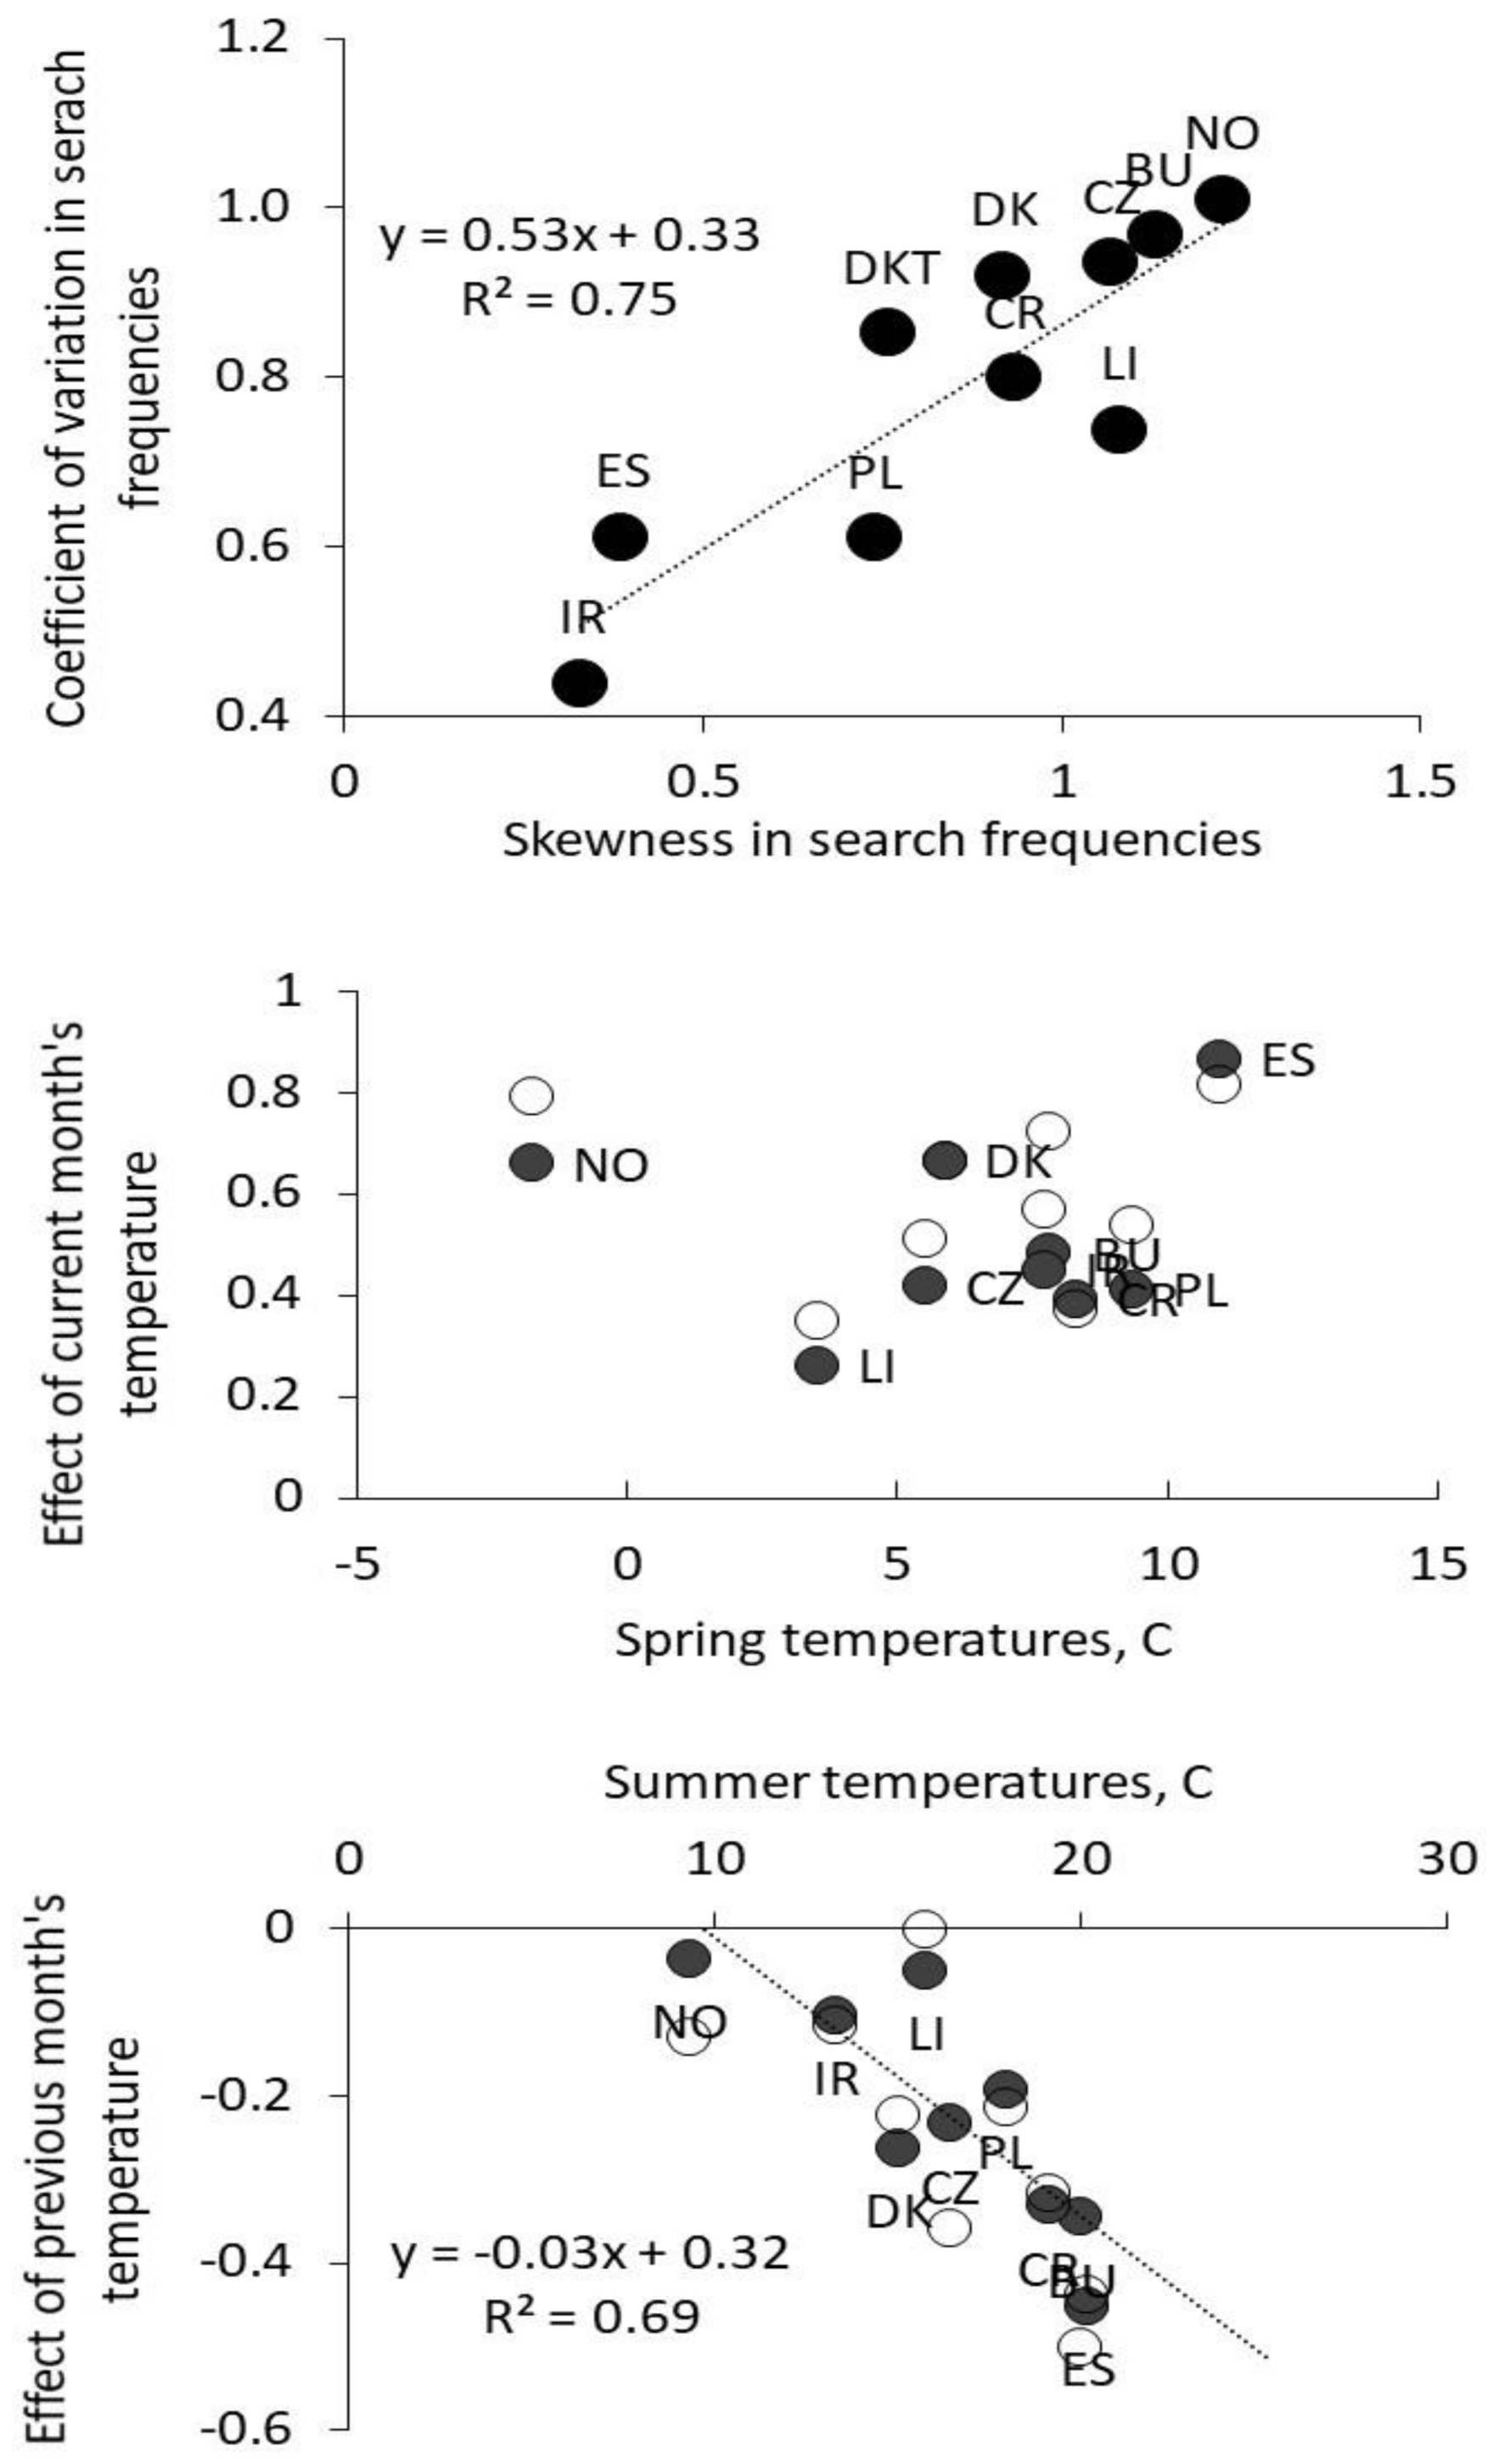
3.2. Seasonal Characteristics
4. Discussion
Author Contributions
Funding
Institutional Review Board Statement
Data Availability Statement
Acknowledgments
Conflicts of Interest
References
- Rizzoli, A.; Tagliapietra, V.; Cagnacci, F.; Marini, G.; Arnoldi, D.; Rosso, F.; Rosà, R. Parasite-wildlife interaction in a changing world: Vector–borne diseases as example. Int. J. Parasitol. 2019, 9, 394–401. [Google Scholar] [CrossRef]
- Alarcon-Chaidez, F.; Ryan, R.; Wikel, S.; Dardick, K.; Lawler, C.; Foppa, I.M.; Tomas, P.; Cushman, A.; Hsieh, A.; Spielman, A.; et al. Confirmation of tick bite by detection of antibody to Ixodes calreticulin salivary protein. Clin. Vaccine Immunol. 2006, 13, 1217–1222. [Google Scholar] [CrossRef]
- Kulkarni, M.A.; Lecocq, A.C.; Artsob, H.; Drebot, M.A.; Ogden, N.H. Epidemiology and aetiology of encephalitis in Canada, 1994–2008: A case for undiagnosed arboviral agents. Epidemiol. Infect. 2013, 141, 2243–2255. [Google Scholar] [CrossRef] [PubMed]
- Kurbasic, I.; Pandza, H.; Masic, I.; Huseinagic, S.; Tandir, S.; Alicajic, F.; Toromanovic, S. The advantages and limitations of international classification of diseases, injuries and causes of death from aspect of existing health care system of Bosnia and Herzegovina. Acta Inform. Med. 2008, 16, 159. [Google Scholar] [CrossRef] [PubMed]
- European Centre for Disease Prevention and Control (ECDC). Information on Tick Borne Diseases. 2020. Available online: https://www.ecdc.europa.eu/en/tick-borne-diseases (accessed on 15 June 2020).
- Boehnke, D.; Brugger, K.; Pfäffle, M.; Sebastian, P.; Norra, S.; Petney, T.; Oehme, R.; Littwin, N.; Lebl, K.; Raith, J.; et al. Estimating Ixodes ricinus densities on the landscape scale. Int. J. Health Geogr. 2015, 14, 23. [Google Scholar] [CrossRef] [PubMed]
- Kjær, L.J.; Soleng, A.; Edgar, K.S.; Lindstedt, H.E.H.; Paulsen, K.M.; Andreassen, Å.K.; Korslund, L.; Kjelland, V.; Slettan, A.; Stuen, S.; et al. Predicting and mapping human risk of exposure to Ixodes ricinus nymphs using climatic and environmental data, Denmark, Norway and Sweden, 2016. Eurosurveillance 2019, 24, 1800101. [Google Scholar] [CrossRef] [PubMed]
- Lindblom, P.; Wilhelmsson, P.; Fryland, L.; Sjöwall, J.; Haglund, M.; Matussek, A.; Ernerudh, J.; Vene, S.; Nyman, D.; Andreassen, A.; et al. Tick-borne encephalitis virus in ticks detached from humans and follow-up of serological and clinical response. Ticks Tick Borne Dis. 2014, 5, 21–28. [Google Scholar] [CrossRef] [PubMed]
- I–noue, Y.; Natsuaki, M.; Yamanishi, K. Epidemiological survey of tick bites occurring in Hyogo Prefecture from 2014 through 2018. Med. Entomol. Zool. 2020, 71, 31–38. [Google Scholar] [CrossRef]
- Daniel, M.; Zitek, K.; Danielová, V.; Kříž, B.; Valter, J.; Kott, I. Risk assessment and prediction of Ixodes ricinus tick questing activity and human tick-borne encephalitis infection in space and time in the Czech Republic. Int. J. Med. Microbiol. 2006, 296, 41–47. [Google Scholar] [CrossRef]
- Pocock, M.J.; Chandler, M.; Bonney, R.; Thornhill, I.; Albin, A.; August, T.; Bachman, S.; Brown, P.M.J.; Cunha, D.G.F.; Grez, A.; et al. A vision for global biodiversity monitoring with citizen science. Adv. Ecol. Res. 2018, 59, 169–223. [Google Scholar] [CrossRef]
- Danielsen, F.; Adrian, T.; Jensen, P.M.; Muñoz, J.; Shirk, J.L.; Burgess, N.D. Current approaches to citizen science. In Handbook of Citizen Science in Ecology and Conservation; Lepczyk, C.A., Boyle, O.D., Vargo, T.L.V., Eds.; University of California Press: Oakland, CA, USA, 2020; pp. 25–29. [Google Scholar]
- The Tick App. Available online: https://apps.apple.com/us/app/the-tick-app/id1374944136 (accessed on 10 June 2020).
- Tick Tracker. Available online: https://ticktracker.com/#features (accessed on 10 June 2020).
- Katrak-Adefowora, R.; Blickley, J.L.; Zellmer, A.J. Just-in-Time Training Improves Accuracy of Citizen Scientist Wildlife Identifications from Camera Trap Photos. Citiz. Sci. 2020, 5. [Google Scholar] [CrossRef]
- Sherbinin, A.; Bowser, A.; Chuang, T.-R.; Cooper, C.; Danielsen, F.; Edmunds, R.; Elias, P.; Faustman, E.; Hultquist, C.; Mondardini, R.; et al. The critical importance of data to citizen science. Front. Clim. 2021, 3, 20. [Google Scholar] [CrossRef]
- West, S.E.; Pateman, R.M. Recruiting and retaining participants in citizen science: What can be learned from the volunteering literature? Citiz. Sci. 2016, 1, 15. [Google Scholar] [CrossRef]
- Goad, R.; Masi, S.; Vitt, P. Retaining citizen scientists. In Handbook of Citizen Science in Ecology and Conservation; Lepczyk, C.A., Boyle, O.D., Vargo, T.L.V., Eds.; University of California Press: Oakland, CA, USA, 2020; pp. 87–97. [Google Scholar]
- Hester, S.M.; Cacho, O.J. The contribution of passive surveillance to invasive species management. Biol. Invasions 2017, 19, 737–748. [Google Scholar] [CrossRef]
- Jarić, I.; Correia, R.A.; Brook, B.W.; Buettel, J.C.; Courchamp, F.; Di Minin, E.; Firth, J.A.; Gaston, K.J.; Jepson, P.; Kalinkat, G.; et al. iEcology: Harnessing large online resources to generate ecological insights. Trends Ecol. Evol. 2020, 35, 630–639. [Google Scholar] [CrossRef]
- Seifter, A.; Schwarzwalder, A.; Geis, K.; Aucott, J. The utility of “Google Trends” for epidemiological research: Lyme disease as an example. Geospat. Health 2010, 4, 135–137. [Google Scholar] [CrossRef]
- Bogdziewicz, M.; Szymkowiak, J. Oak acorn crop and Google search volume predict Lyme disease risk in temperate Europe. Basic App. Ecol. 2016, 17, 300–307. [Google Scholar] [CrossRef]
- Pelat, C.; Turbelin, C.; Bar-Hen, A.; Flahault, A.; Valleron, A.J. More diseases tracked by using Google Trends. Emerg. Infect. Dis. 2009, 15, 1327. [Google Scholar] [CrossRef]
- Nuti, S.V.; Wayda, B.; Ranasinghe, I.; Wang, S.; Dreyer, R.P.; Chen, S.I.; Murugiah, K. The use of google trends in health care research: A systematic review. PLoS ONE 2014, 9, e109583. [Google Scholar] [CrossRef]
- Google Trends. Available online: https://trends.google.com/trends/?geo=DK (accessed on 30 March 2020).
- Andersen, N.S.; Skarphédinsson, S.; Knudtzen, F.C.; Olesen, C.R.; Jensen, T.G.; Jensen, P.M. Reduction in human Lyme neuroborreliosis associated with a major epidemic among roe deer. Ticks Tick Borne Dis. 2018, 9, 379–381. [Google Scholar] [CrossRef]
- Estrada-Peña, A.; Adkin, A.; Bertolini, S.; Cook, C.; Crescio, M.I.; Grosbois, V.; Horigan, V.; Ip, S.; Leger, A.; Mastrantonio, G.; et al. Evaluating a mixed abiotic–biotic model for the distribution and host contact rates of an arthropod vector of pathogens: An example with Ixodes ricinus (Ixodidae). Microbiol. Risk Anal. 2019, 13, 100067. [Google Scholar] [CrossRef]
- Dobson, A.D.; Finnie, T.J.; Randolph, S.E. A modified matrix model to describe the seasonal population ecology of the European tick Ixodes ricinus. J. Appl. Ecol. 2011, 48, 1017–1028. [Google Scholar] [CrossRef]
- Estrada-Peña, A.; Estrada-Sánchez, D. Deconstructing Ixodes ricinus: A partial matrix model allowing mapping of tick development, mortality and activity rates. Med. Vet. Entomol. 2014, 28, 35–49. [Google Scholar] [CrossRef] [PubMed]
- Hancock, P.A.; Brackley, R.; Palmer, S.C. Modelling the effect of temperature variation on the seasonal dynamics of Ixodes ricinus tick populations. Int. J. Parasitol. 2011, 41, 513–522. [Google Scholar] [CrossRef]
- Gray, J.S.; Kahl, O.; Lane, R.S.; Levin, M.L.; Tsao, J.I. Diapause in ticks of the medically important Ixodes ricinus species complex. Ticks Tick Borne Dis. 2016, 7, 992–1003. [Google Scholar] [CrossRef]
- Daniel, M.; Malý, M.; Danielová, V.; Kříž, B.; Nuttall, P. Abiotic predictors and annual seasonal dynamics of Ixodes ricinus, the major disease vector of Central Europe. Parasites Vectors 2015, 8, 478. [Google Scholar] [CrossRef]
- WBGCKP. The World Bank Climate Knowledge Portal. Historical Data Covering 1901 to 2016. Available online: https://climateknowledgeportal.worldbank.org/download-data (accessed on 30 June 2020).
- Stanek, G.; Wormser, G.P.; Gray, J.; Strle, F. Lyme borreliosis. Lancet 2012, 379, 461–473. [Google Scholar] [CrossRef]
- Nahimana, I.; Gern, L.; Blanc, D.S.; Praz, G.; Francioli, P.; Peter, O. Risk of Borrelia burgdorferi infection in western Switzerland following a tick bite. Eur. J. Clin. Microbiol. Infect. Dis. 2004, 23, 603–608. [Google Scholar] [CrossRef]
- Jensen, P.M.; Jespersen, J.B. Five decades of tick–man interaction in Denmark—An analysis. Exp. Appl. Acarol. 2005, 35, 131–146. [Google Scholar] [CrossRef]
| Denmark Nationwide | ||||
| Flåt | Flåter | Tæge | Tæger | |
| Year | 0.32 *** | 0.30 *** | 0.16 | −0.08 |
| Flåt | 0.87 *** | 0.88 *** | 0.77 *** | |
| Flåter | 0.86 *** | 0.77 *** | ||
| Tæge | 0.81 *** | |||
| Southern Denmark | ||||
| Year | 0.35 *** | 0.32 *** | 0.18 * | −0.19 * |
| Flåt | 0.50 *** | 0.63 *** | 0.44 *** | |
| Flåter | 0.49 *** | 0.36 *** | ||
| Tæge | 0.57 *** | |||
| Country/Region | Variable | Mean | SD | Mean | SD | |
|---|---|---|---|---|---|---|
| Spain | Month of maximum | 5.00 | 0.82 | Skew | 0.39 | 0.19 |
| (14.0 ± 6.1 °C) | Month of largest increase | 4.30 | 0.48 | Kurtosis | −1.57 | 0.34 |
| Month of largest decrease | 8.10 | 0.99 | Coef. of variation | 0.61 | 0.05 | |
| Pay de Loire | Month of maximum | 6.60 | 1.51 | Skew | 0.74 | 0.76 |
| France | Month of largest increase | 6.10 | 1.73 | Kurtosis | 1.07 | 1.53 |
| (12.2 ± 5.7 °C) | Month of largest decrease | 9.30 | 1.49 | Coef. of variation | 0.61 | 0.24 |
| Bulgaria | Month of maximum | 5.40 | 0.70 | Skew | 1.13 | 0.67 |
| (11.9 ± 8.1 °C) | Month of largest increase | 4.80 | 0.63 | Kurtosis | 1.19 | 2.32 |
| Month of largest decrease | 8.10 | 0.99 | Coef. of variation | 0.97 | 0.12 | |
| Croatia | Month of maximum | 4.80 | 0.85 | Skew | 0.94 | 0.54 |
| (11.9 ± 7.2 °C) | Month of largest increase | 4.10 | 1.20 | Kurtosis | 0.56 | 1.30 |
| Month of largest decrease | 7.40 | 0.84 | Coef. of variation | 0.80 | 0.09 | |
| Czech Rep | Month of maximum | 5.50 | 0.85 | Skew | 1.07 | 0.34 |
| (9.2 ± 7.3 °C) | Month of largest increase | 4.70 | 0.67 | Kurtosis | 0.06 | 1.44 |
| Month of largest decrease | 8.00 | 0.94 | Coef. of variation | 0.93 | 0.13 | |
| Denmark | Month of maximum | 6.20 | 0.92 | Skew | 0.92 | 0.60 |
| (8.9 ± 6.2 °C) | Month of largest increase | 5.70 | 0.95 | Kurtosis | 0.41 | 1.44 |
| (Flåter) | Month of largest decrease | 8.60 | 0.70 | Coef. of variation | 0.92 | 0.17 |
| Ireland | Month of maximum | 7.20 | 2.25 | Skew | 0.33 | 0.74 |
| (9.6 ± 3.7 °C) | Month of largest increase | 5.60 | 2.07 | Kurtosis | −0.39 | 0.55 |
| Month of largest decrease | 9.10 | 0.99 | Coef. of variation | 0.44 | 0.09 | |
| Lithuania | Month of maximum | 5.80 | 0.92 | Skew | 1.08 | 0.63 |
| (7.6 ± 8.1 °C) | Month of largest increase | 5.20 | 0.79 | Kurtosis | 1.73 | 2.31 |
| Month of largest decrease | 8.60 | 1.43 | Coef. of variation | 0.74 | 0.10 | |
| Norway | Month of maximum | 6.90 | 0.32 | Skew | 1.23 | 0.21 |
| (1.9 ± 7.3 °C) | Month of largest increase | 6.30 | 0.82 | Kurtosis | 0.65 | 0.87 |
| Month of largest decrease | 9.10 | 0.32 | Coef. of variation | 1.01 | 0.10 | |
| Denmark | Month of maximum | 6.40 | 0.84 | Skew | 0.76 | 0.37 |
| (Tæger) | Month of largest increase | 4.70 | 1.06 | Kurtosis | −0.59 | 0.58 |
| Month of largest decrease | 8.80 | 0.63 | Coef. of variation | 0.85 | 0.08 |
| Country/Region | Variable | Estimate | SE | Wald-Chisq | p > Chi | AIC |
|---|---|---|---|---|---|---|
| Spain | Current temperature | 0.864 | 0.088 | 96.81 | <0.0001 | 865 |
| (14.0 ± 6.1 °C) | Current precipitation | 0.015 | 0.007 | 4.85 | 0.027 | |
| Previous temperature | −0.452 | 0.063 | 52.22 | <0.0001 | ||
| Previous precipitation | 0.014 | 0.007 | 3.86 | 0.049 | ||
| Pay de Loire | Current temperature | 0.411 | 0.060 | 47.58 | <0.0001 | 868 |
| France | Current precipitation | 0.004 | 0.006 | 0.37 | 0.54 | |
| (12.2 ± 5.7 °C) | Previous temperature | −0.193 | 0.052 | 13.88 | 0.0002 | |
| Previous precipitation | 0.011 | 0.006 | 2.75 | 0.097 | ||
| Bulgaria | Current temperature | 0.482 | 0.055 | 77.83 | <0.0001 | 910 |
| (11.9 ± 8.1 °C) | Current precipitation | 0.008 | 0.006 | 1.62 | 0.20 | |
| Previous temperature | −0.345 | 0.047 | 54.00 | <0.0001 | ||
| Previous precipitation | 0.004 | 0.006 | 0.40 | 0.52 | ||
| Croatia | Current temperature | 0.392 | 0.053 | 55.08 | <0.0001 | 847 |
| (11.9 ± 7.2 °C) | Current precipitation | 0.000 | 0.004 | 0.00 | 0.99 | |
| Previous temperature | −0.332 | 0.051 | 42.69 | <0.0001 | ||
| Previous precipitation | −0.001 | 0.004 | 0.04 | 0.83 | ||
| Czech Rep | Current temperature | 0.417 | 0.055 | 58.32 | <0.0001 | 873 |
| (9.2 ± 7.3 °C) | Current precipitation | 0.010 | 0.007 | 2.18 | 0.13 | |
| Previous temperature | −0.233 | 0.046 | 25.55 | <0.0001 | ||
| Previous precipitation | −0.009 | 0.007 | 2.06 | 0.15 | ||
| Denmark | Current temperature | 0.663 | 0.076 | 76.70 | <0.0001 | 779 |
| (8.9 ± 6.2 °C) | Current precipitation | −0.002 | 0.006 | 0.09 | 0.75 | |
| (Flåter) | Previous temperature | −0.263 | 0.062 | 18.22 | <0.0001 | |
| Previous precipitation | −0.007 | 0.006 | 1.31 | 0.25 | ||
| Ireland | Current temperature | 0.449 | 0.092 | 23.69 | <0.0001 | 943 |
| (9.6 ± 3.7 °C) | Current precipitation | 0.000 | 0.004 | 0.00 | 0.99 | |
| Previous temperature | −0.104 | 0.082 | 1.63 | 0.20 | ||
| Previous precipitation | −0.001 | 0.004 | 0.12 | 0.72 | ||
| Lithuania | Current temperature | 0.260 | 0.040 | 42.10 | <0.0001 | 836 |
| (7.6 ± 8.1 °C) | Current precipitation | −0.005 | 0.007 | 0.46 | 0.49 | |
| Previous temperature | −0.051 | 0.039 | 1.65 | 0.19 | ||
| Previous precipitation | −0.007 | 0.007 | 0.94 | 0.33 | ||
| Norway | Current temperature | 0.659 | 0.075 | 77.04 | <0.0001 | 816 |
| (1.9 ± 7.3 °C) | Current precipitation | −0.027 | 0.007 | 15.06 | 0.0001 | |
| Previous temperature | −0.037 | 0.052 | 0.51 | 0.47 | ||
| Previous precipitation | −0.016 | 0.008 | 4.38 | 0.036 | ||
| Denmark | Current temperature | 0.617 | 0.072 | 73.81 | <0.0001 | 922 |
| (Tæger) | Current precipitation | 0.001 | 0.006 | 0.02 | 0.86 | |
| Previous temperature | −0.260 | 0.061 | 18.33 | <0.0001 | ||
| Previous precipitation | −0.007 | 0.006 | 1.36 | 0.24 |
Publisher’s Note: MDPI stays neutral with regard to jurisdictional claims in published maps and institutional affiliations. |
© 2022 by the authors. Licensee MDPI, Basel, Switzerland. This article is an open access article distributed under the terms and conditions of the Creative Commons Attribution (CC BY) license (https://creativecommons.org/licenses/by/4.0/).
Share and Cite
Jensen, P.M.; Danielsen, F.; Skarphedinsson, S. Monitoring Temporal Trends in Internet Searches for “Ticks” across Europe by Google Trends: Tick–Human Interaction or General Interest? Insects 2022, 13, 176. https://doi.org/10.3390/insects13020176
Jensen PM, Danielsen F, Skarphedinsson S. Monitoring Temporal Trends in Internet Searches for “Ticks” across Europe by Google Trends: Tick–Human Interaction or General Interest? Insects. 2022; 13(2):176. https://doi.org/10.3390/insects13020176
Chicago/Turabian StyleJensen, Per M., Finn Danielsen, and Sigurdur Skarphedinsson. 2022. "Monitoring Temporal Trends in Internet Searches for “Ticks” across Europe by Google Trends: Tick–Human Interaction or General Interest?" Insects 13, no. 2: 176. https://doi.org/10.3390/insects13020176
APA StyleJensen, P. M., Danielsen, F., & Skarphedinsson, S. (2022). Monitoring Temporal Trends in Internet Searches for “Ticks” across Europe by Google Trends: Tick–Human Interaction or General Interest? Insects, 13(2), 176. https://doi.org/10.3390/insects13020176


