
Why Do Insects Close Their Spiracles? A Meta-Analytic Evaluation of the Adaptive Hypothesis of Discontinuous Gas Exchange in Insects


Abstract
Simple Summary
Abstract
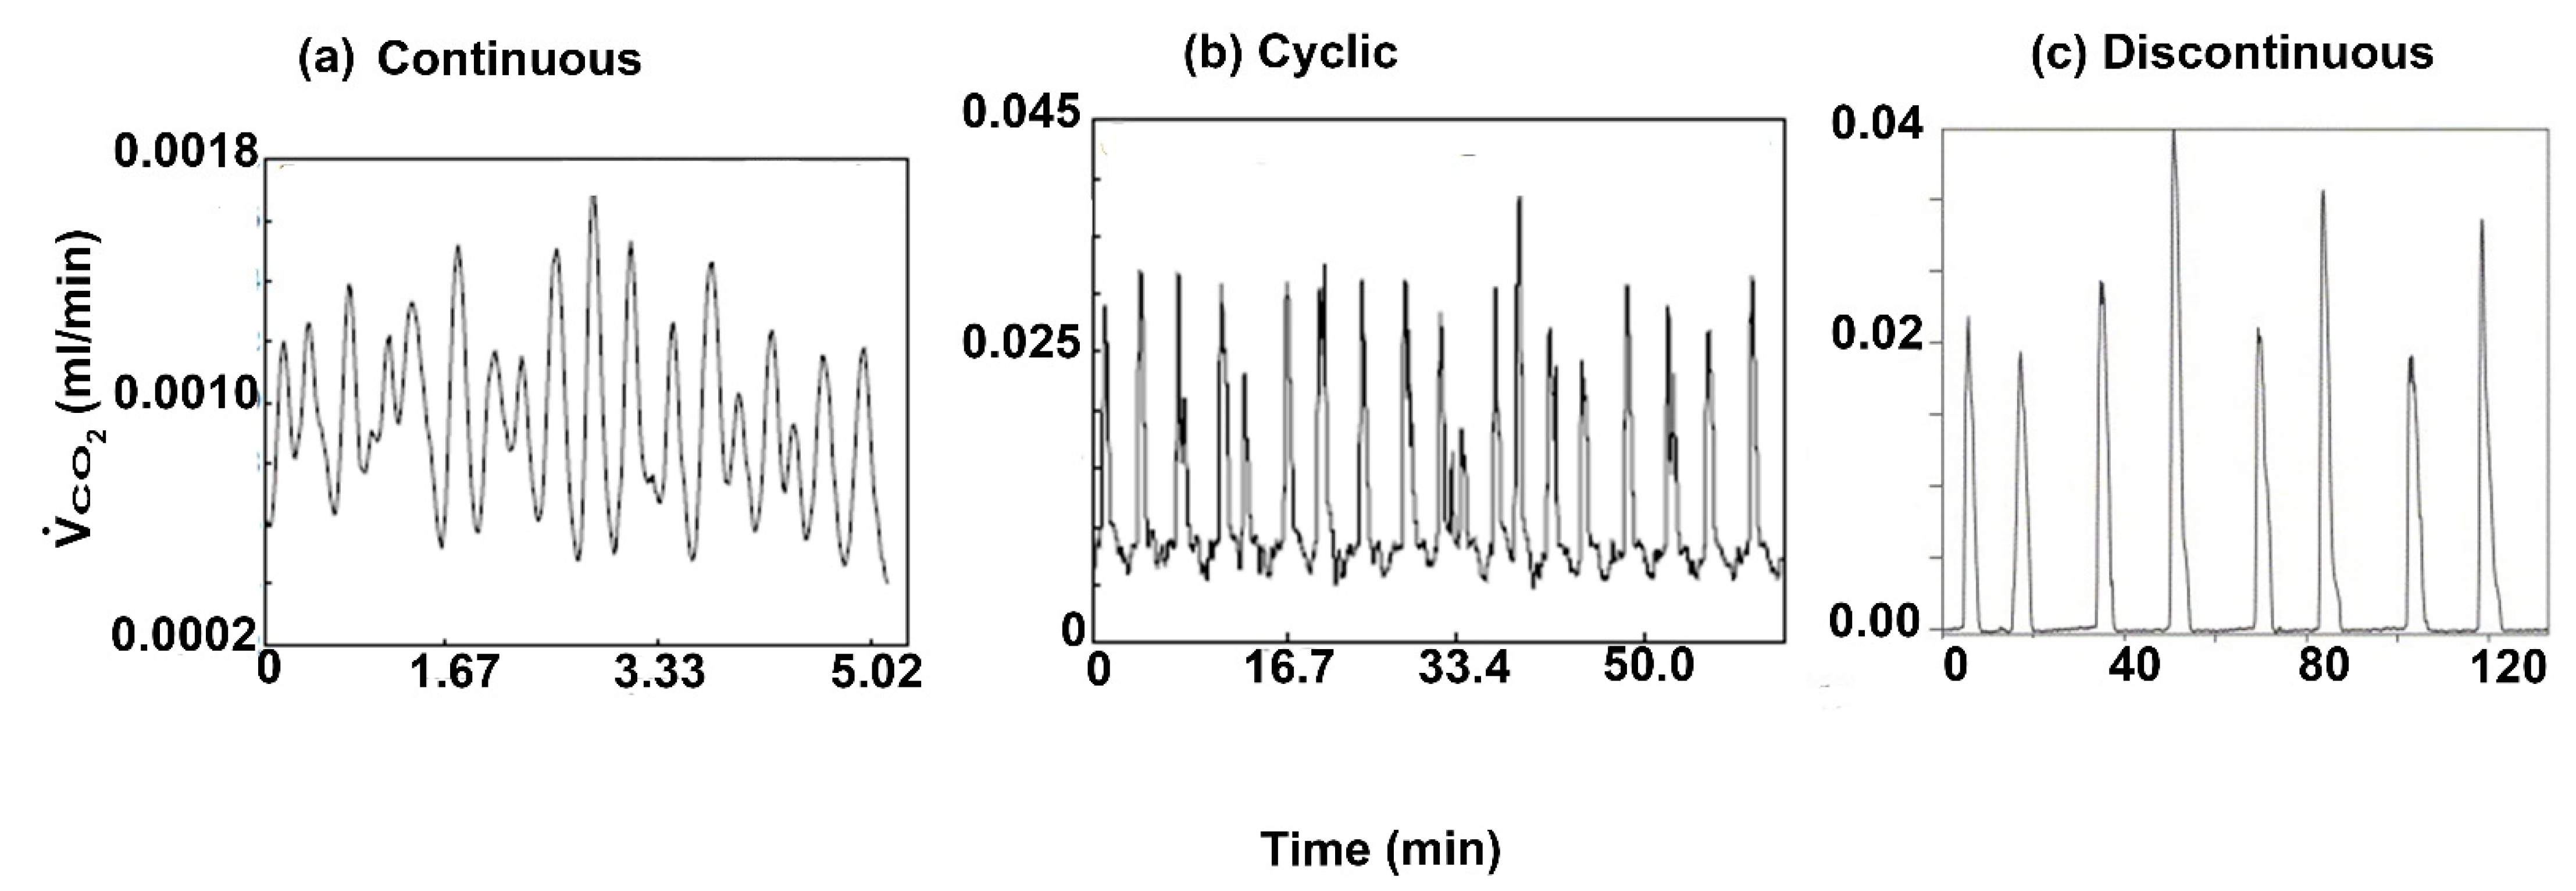
1. Introduction
2. Materials and Methods
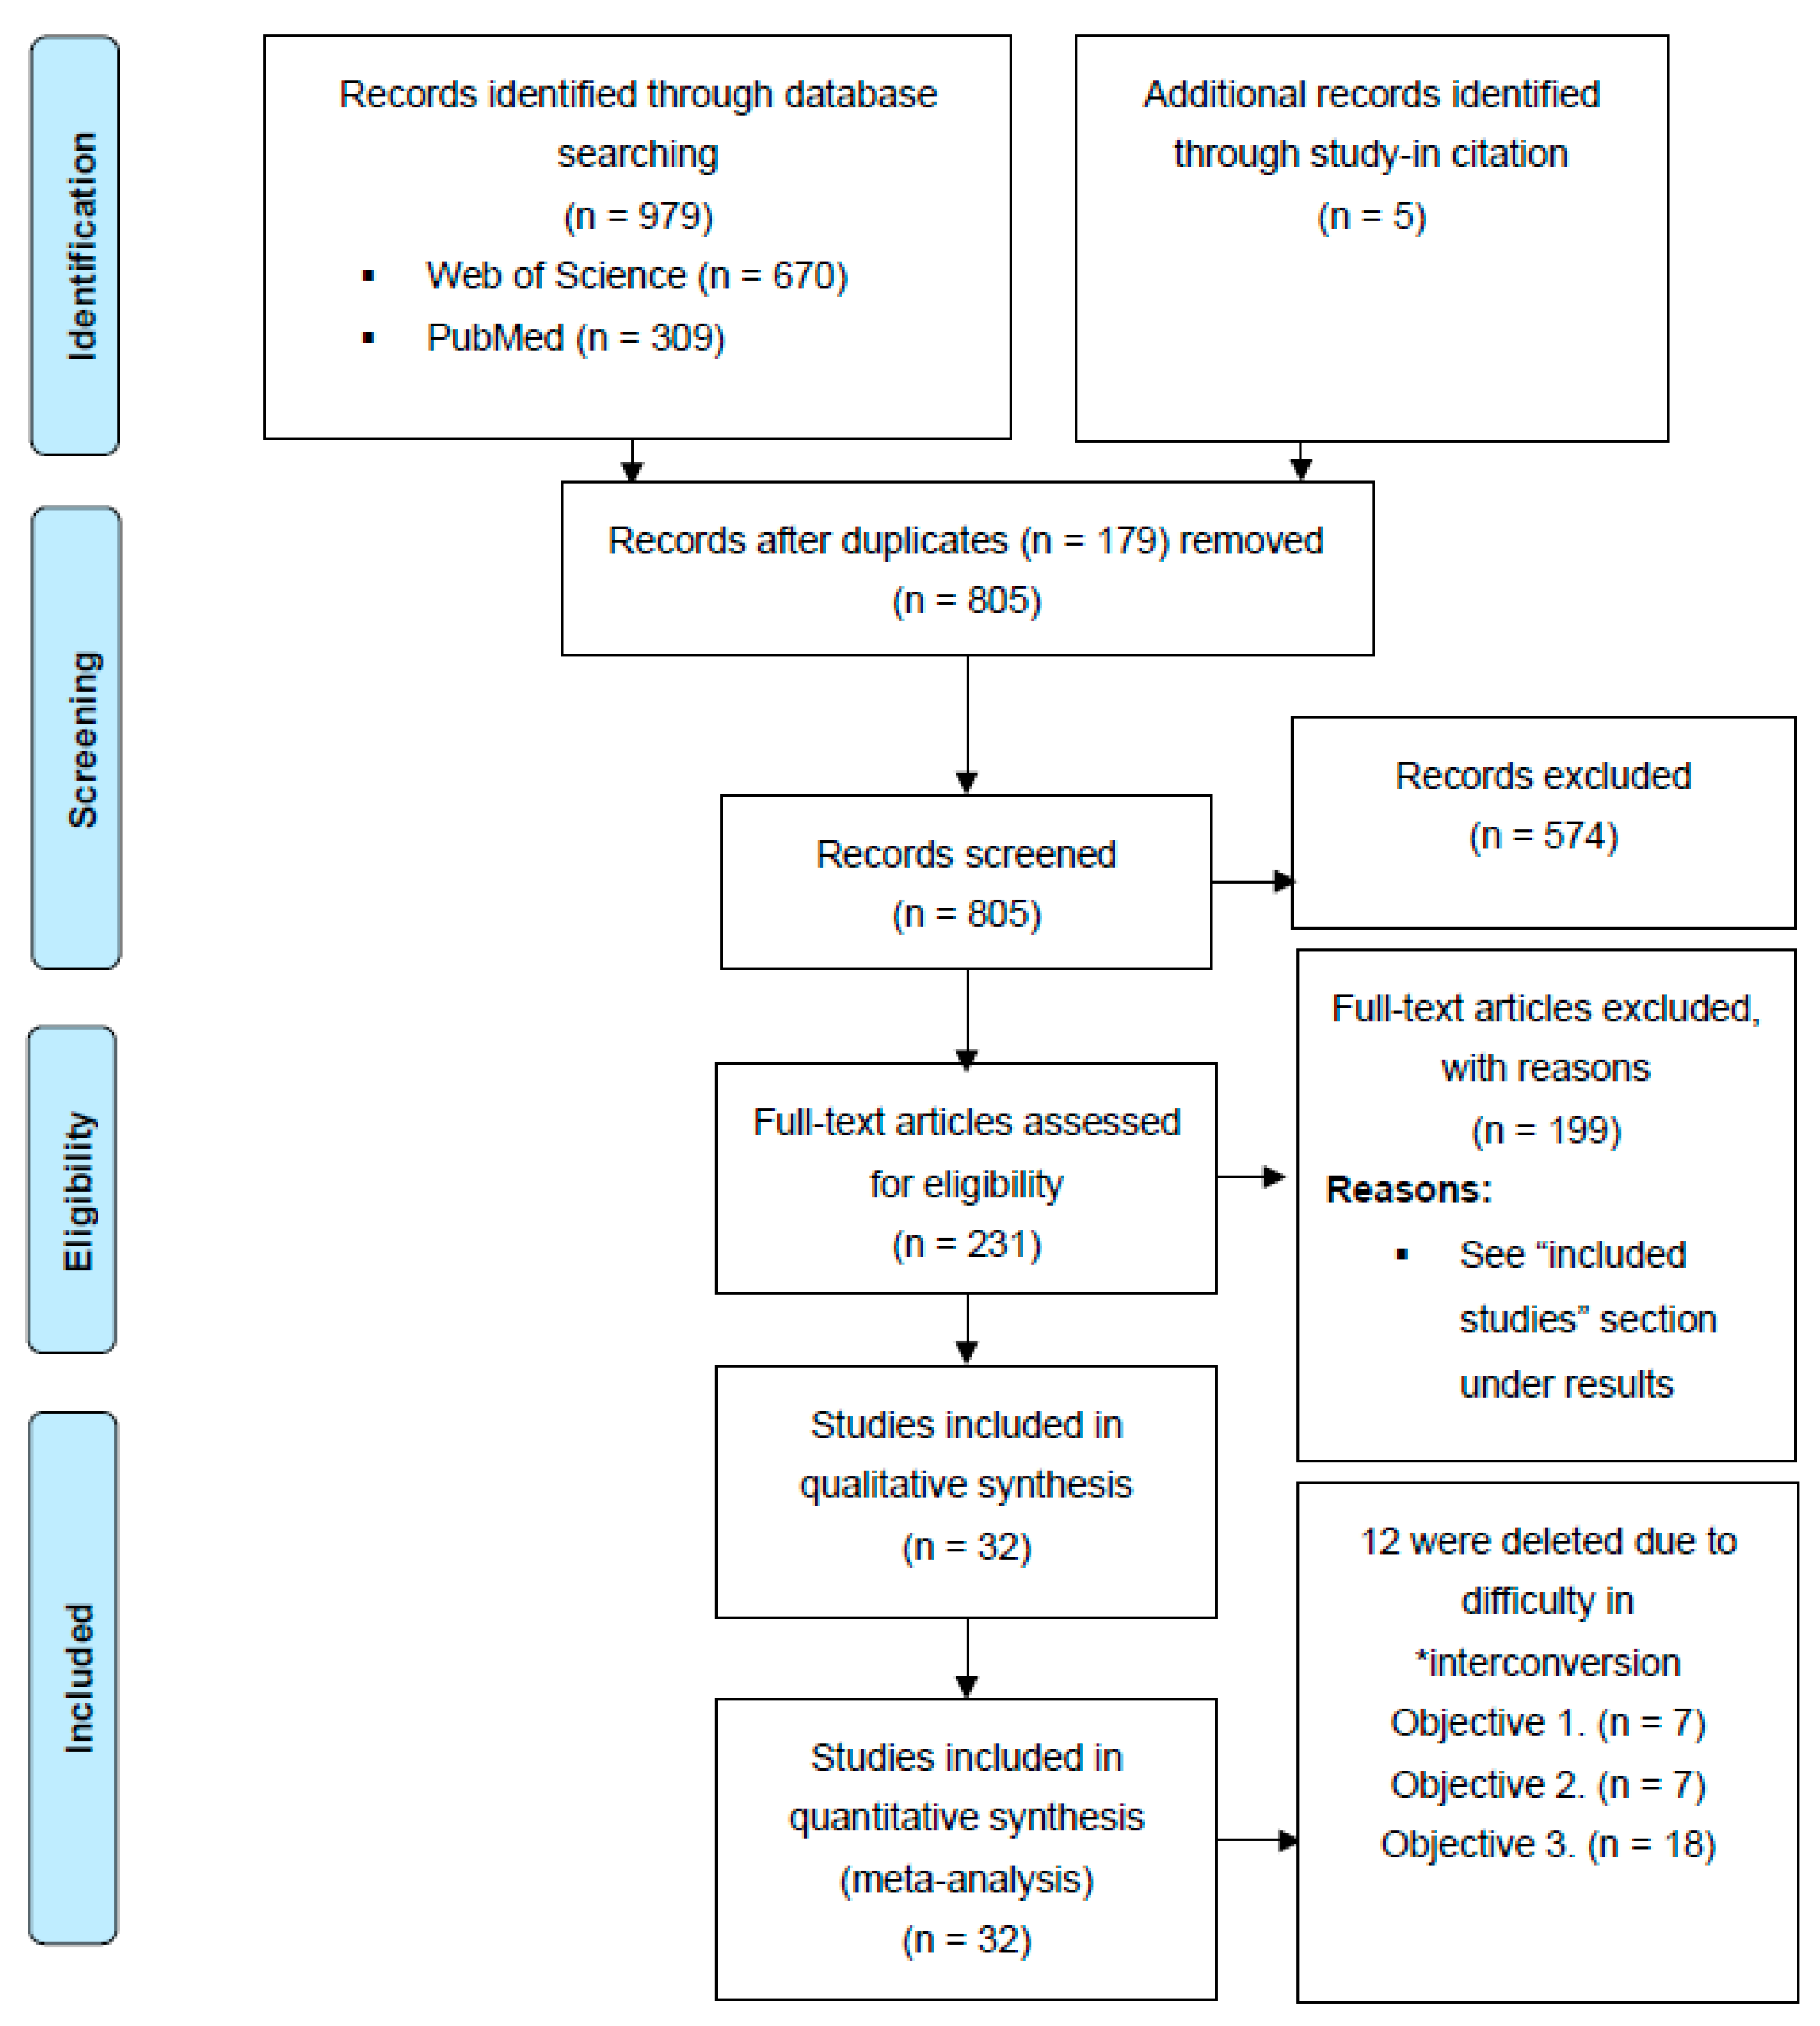
2.1. Search Strategy
2.2. Inclusion Criteria and Data Extraction
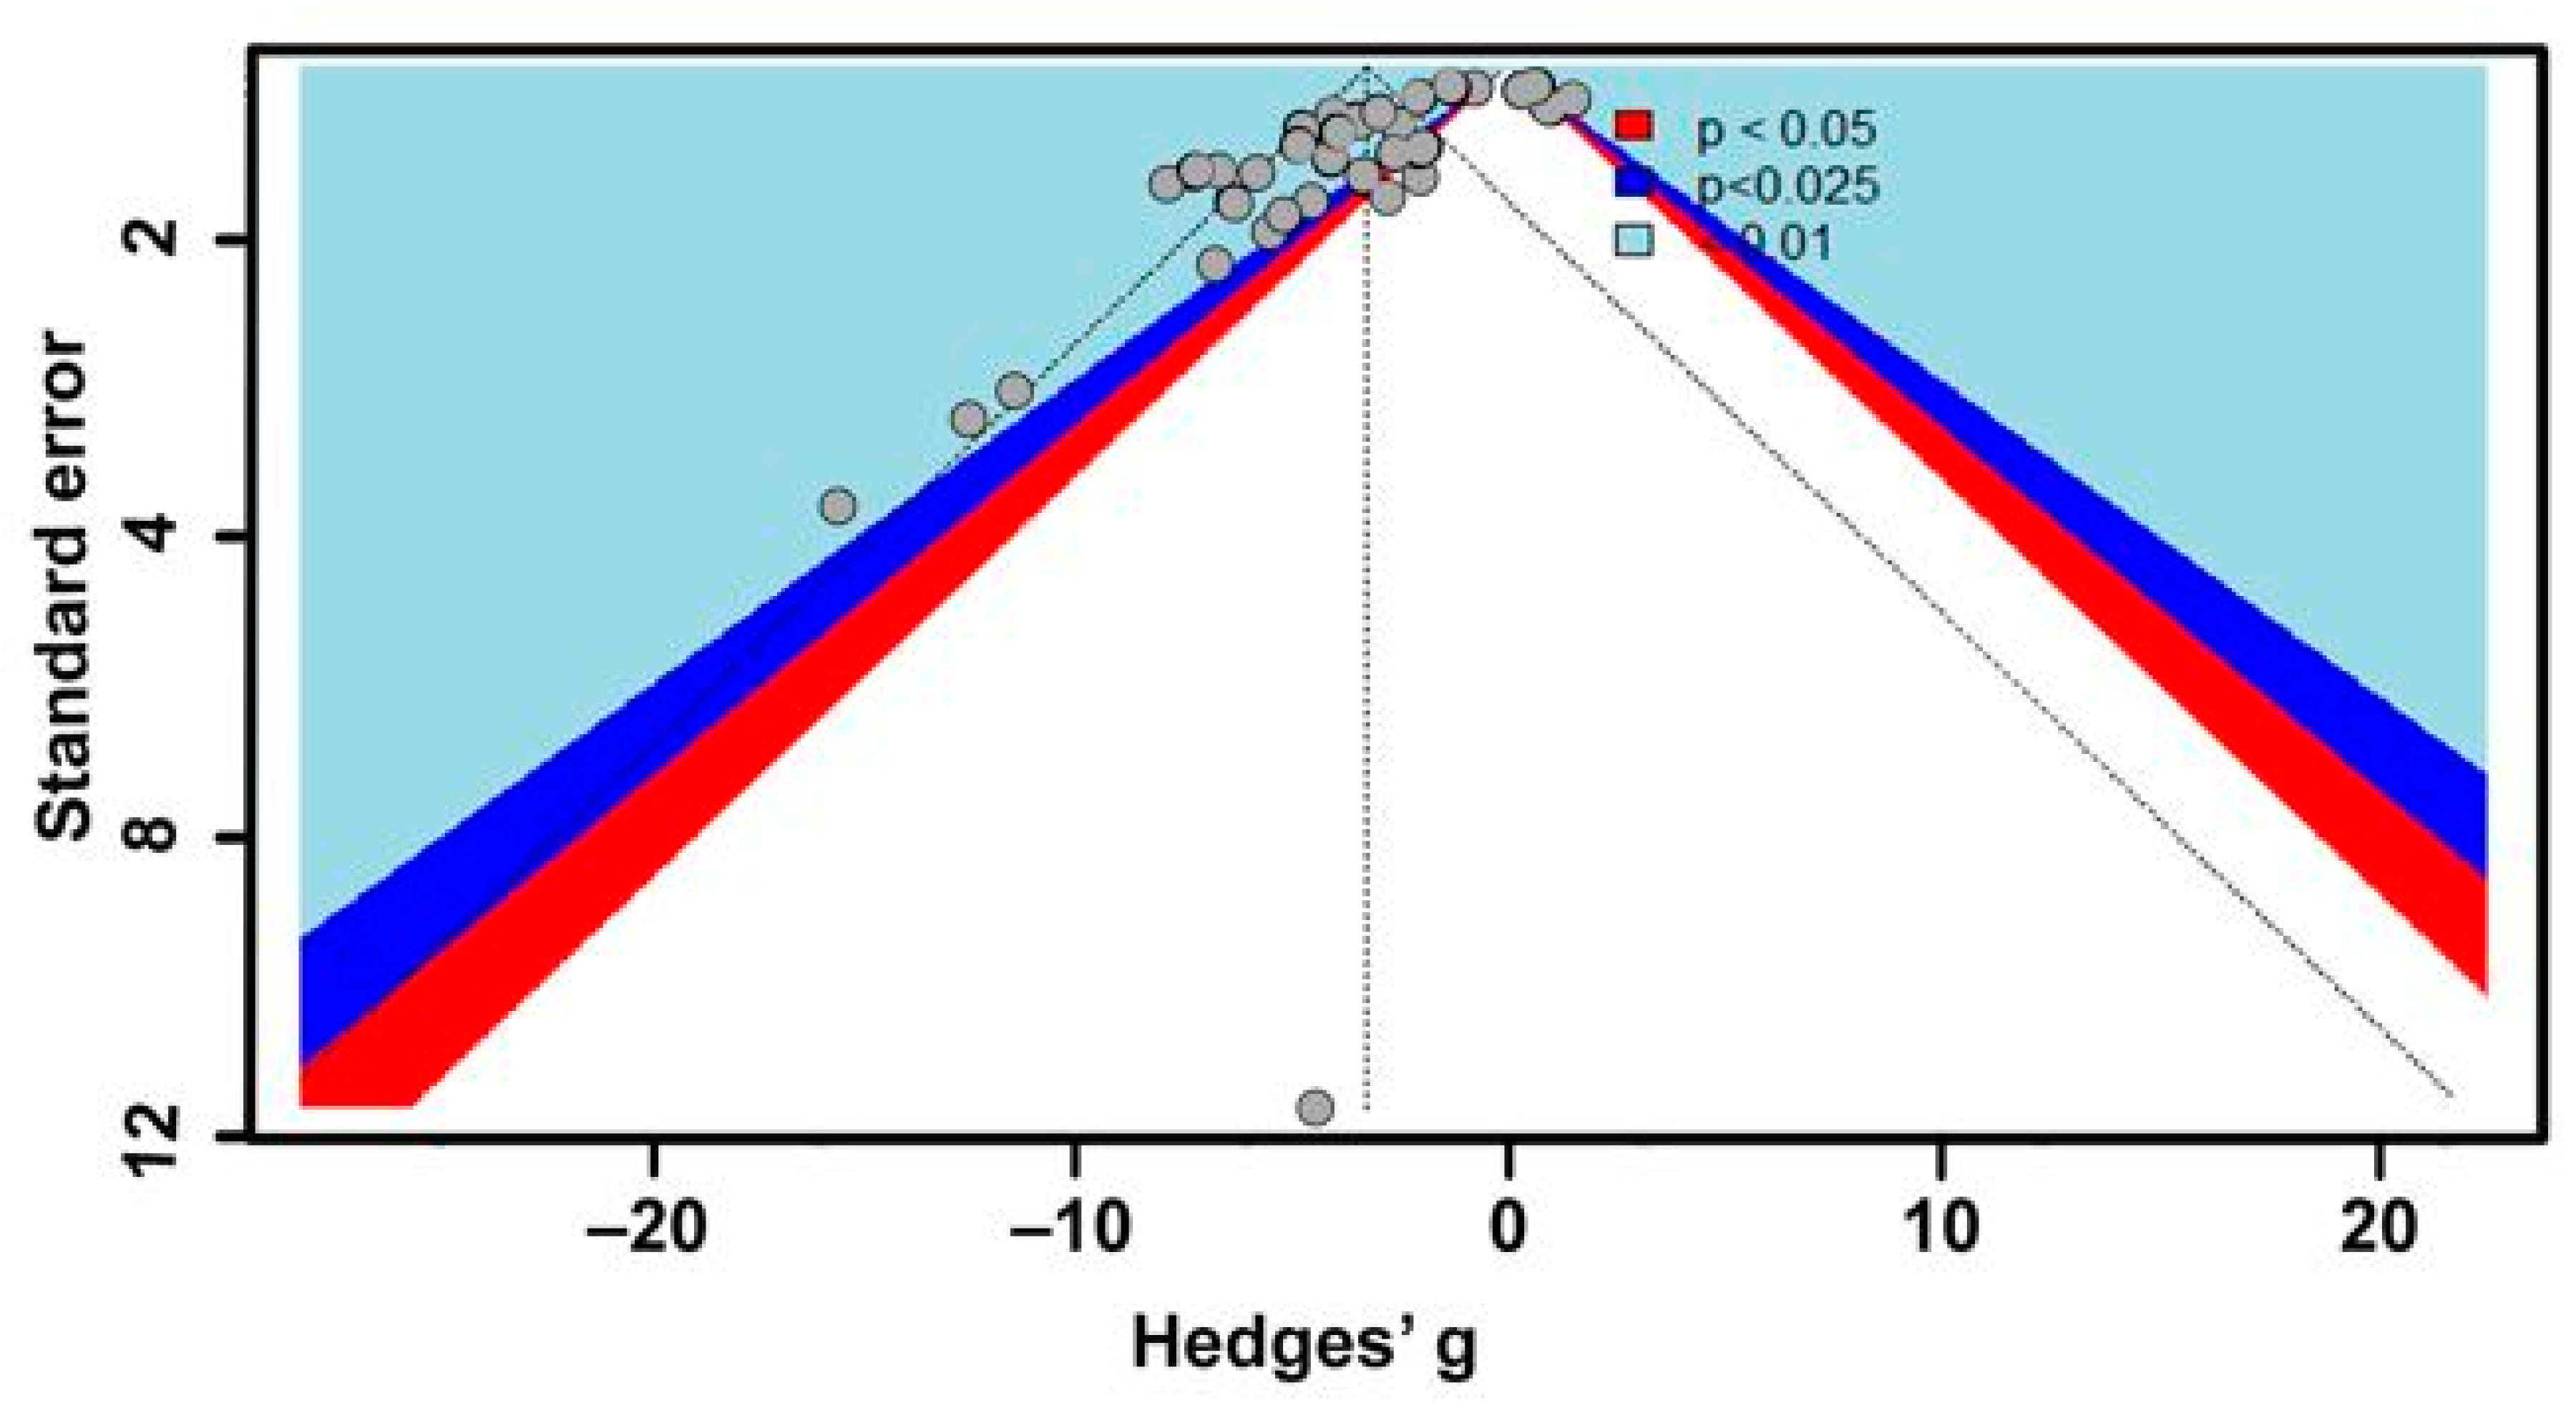
2.3. Statistical Analyses
3. Results
3.1. Included Studies
3.2. Objectives
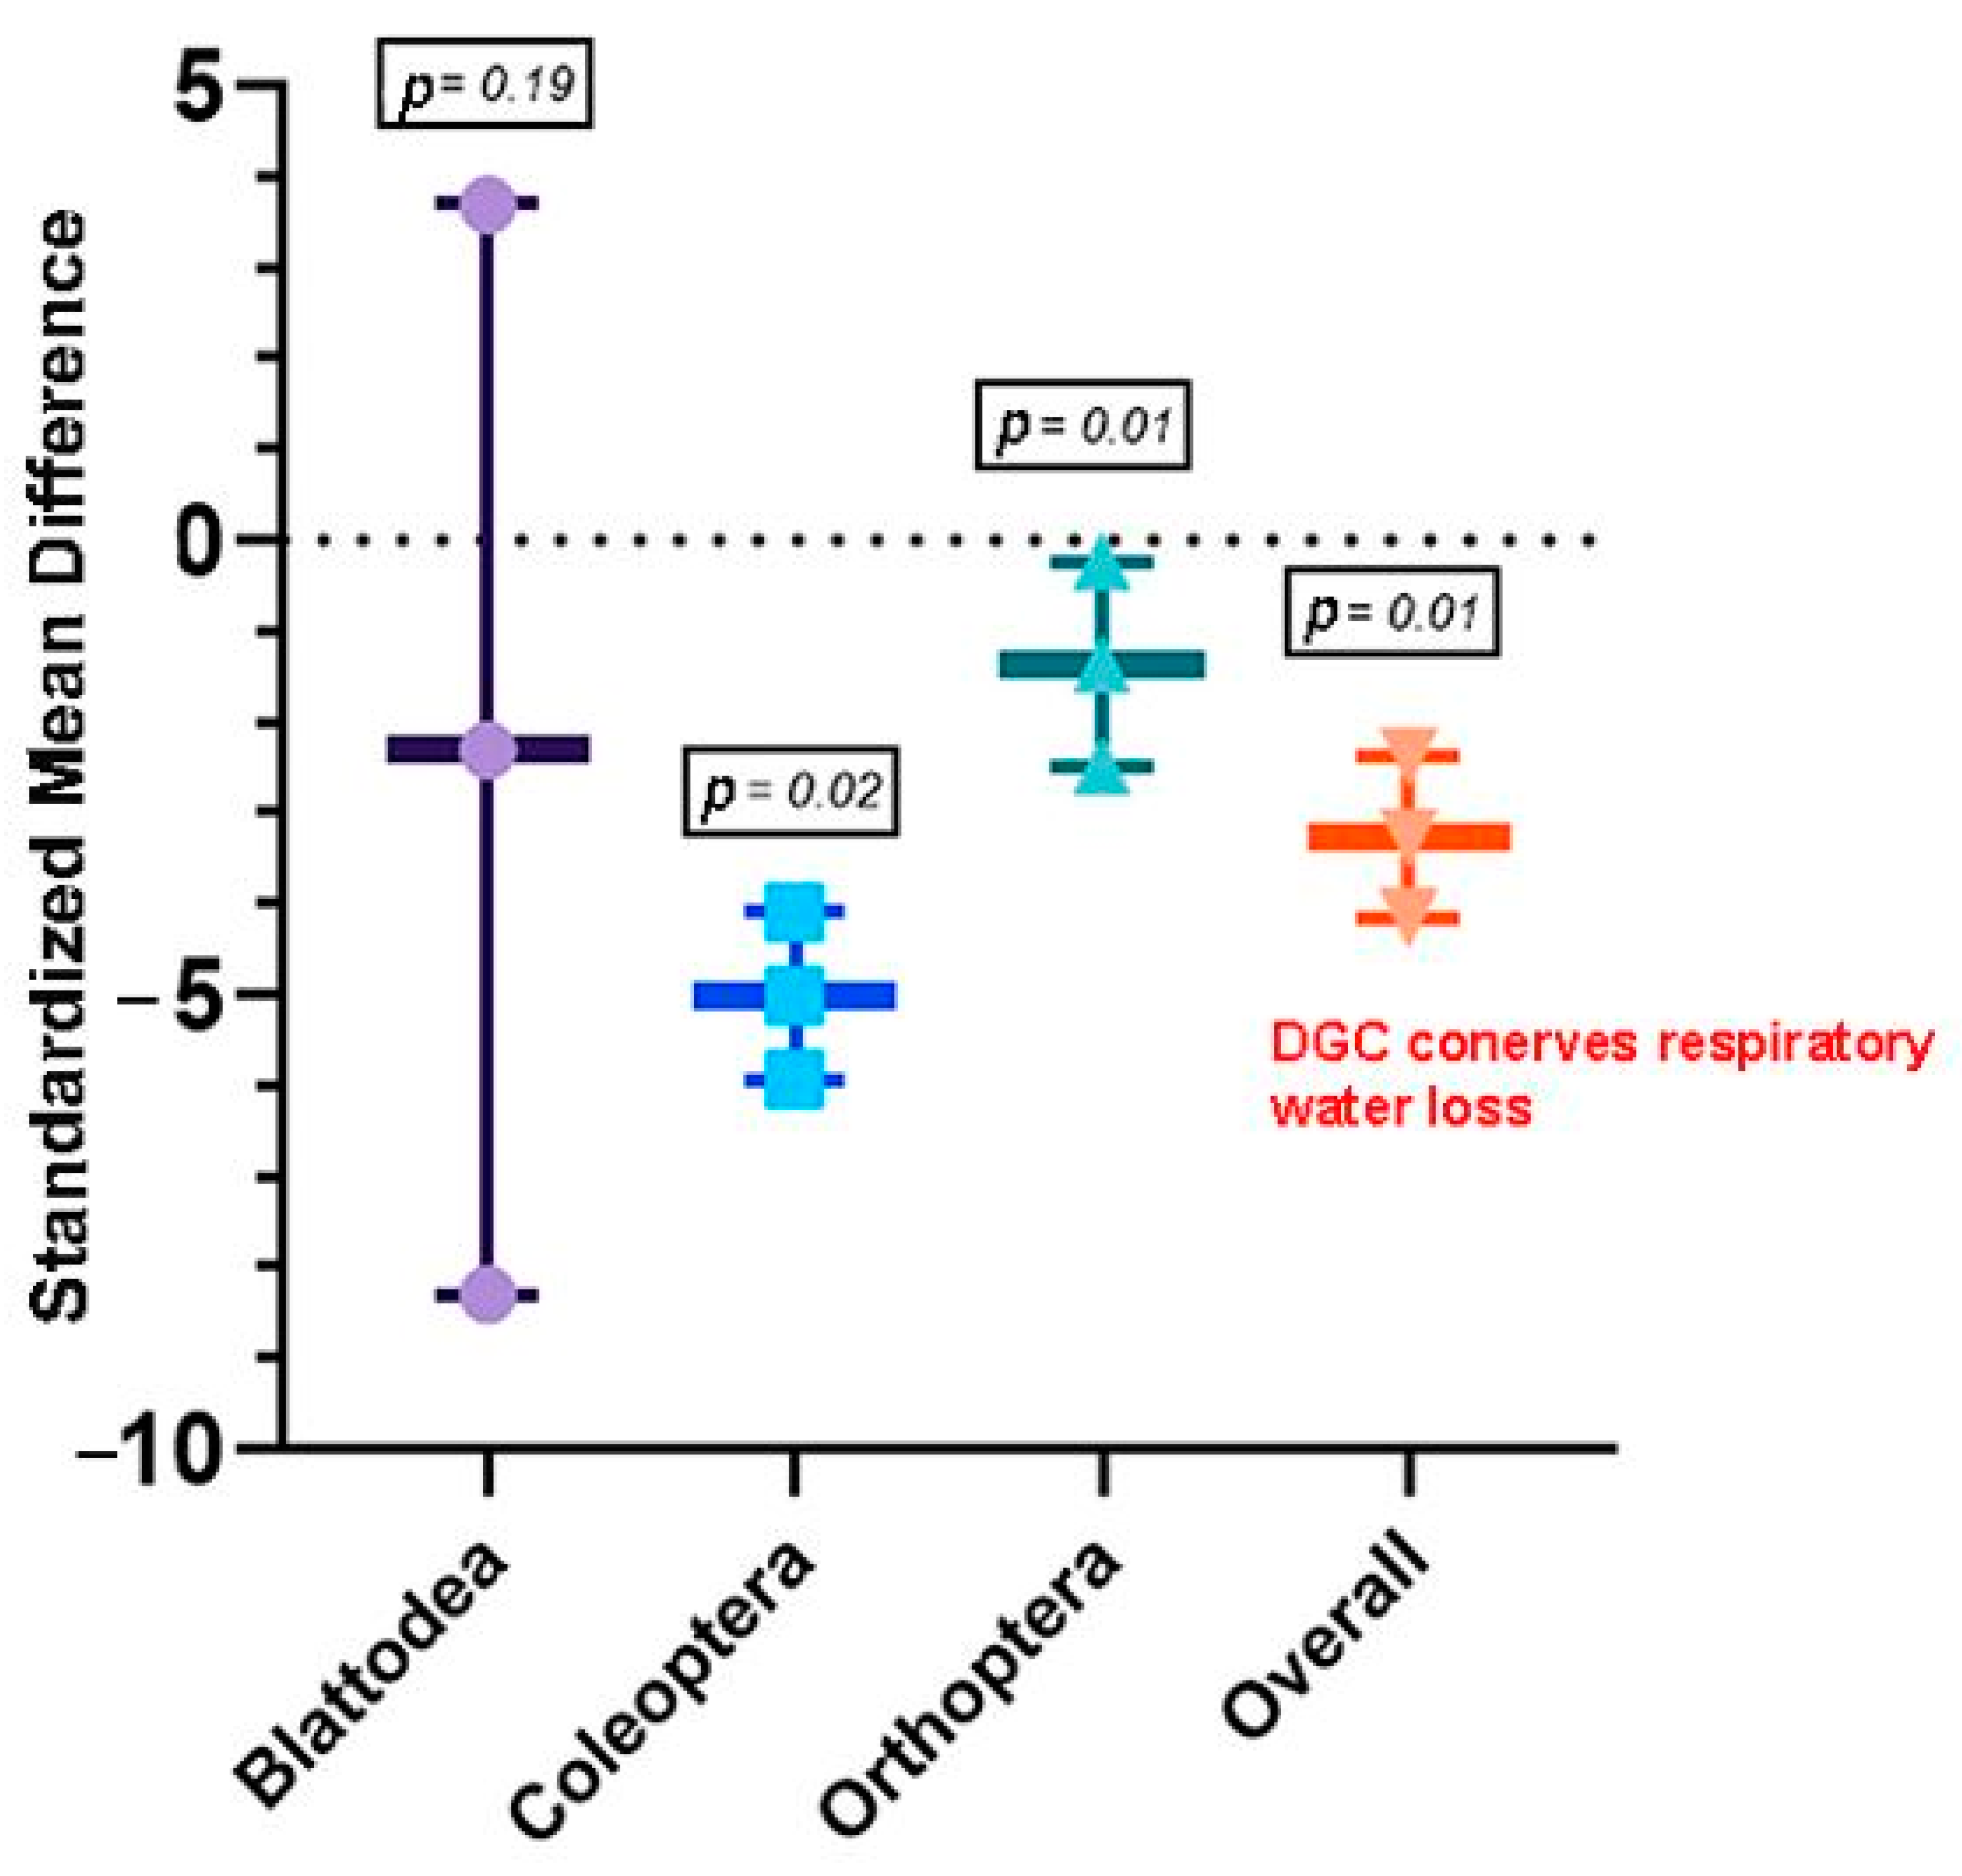
3.2.1. Objective 1: Does the DGC Reduce Water Loss in Insects?
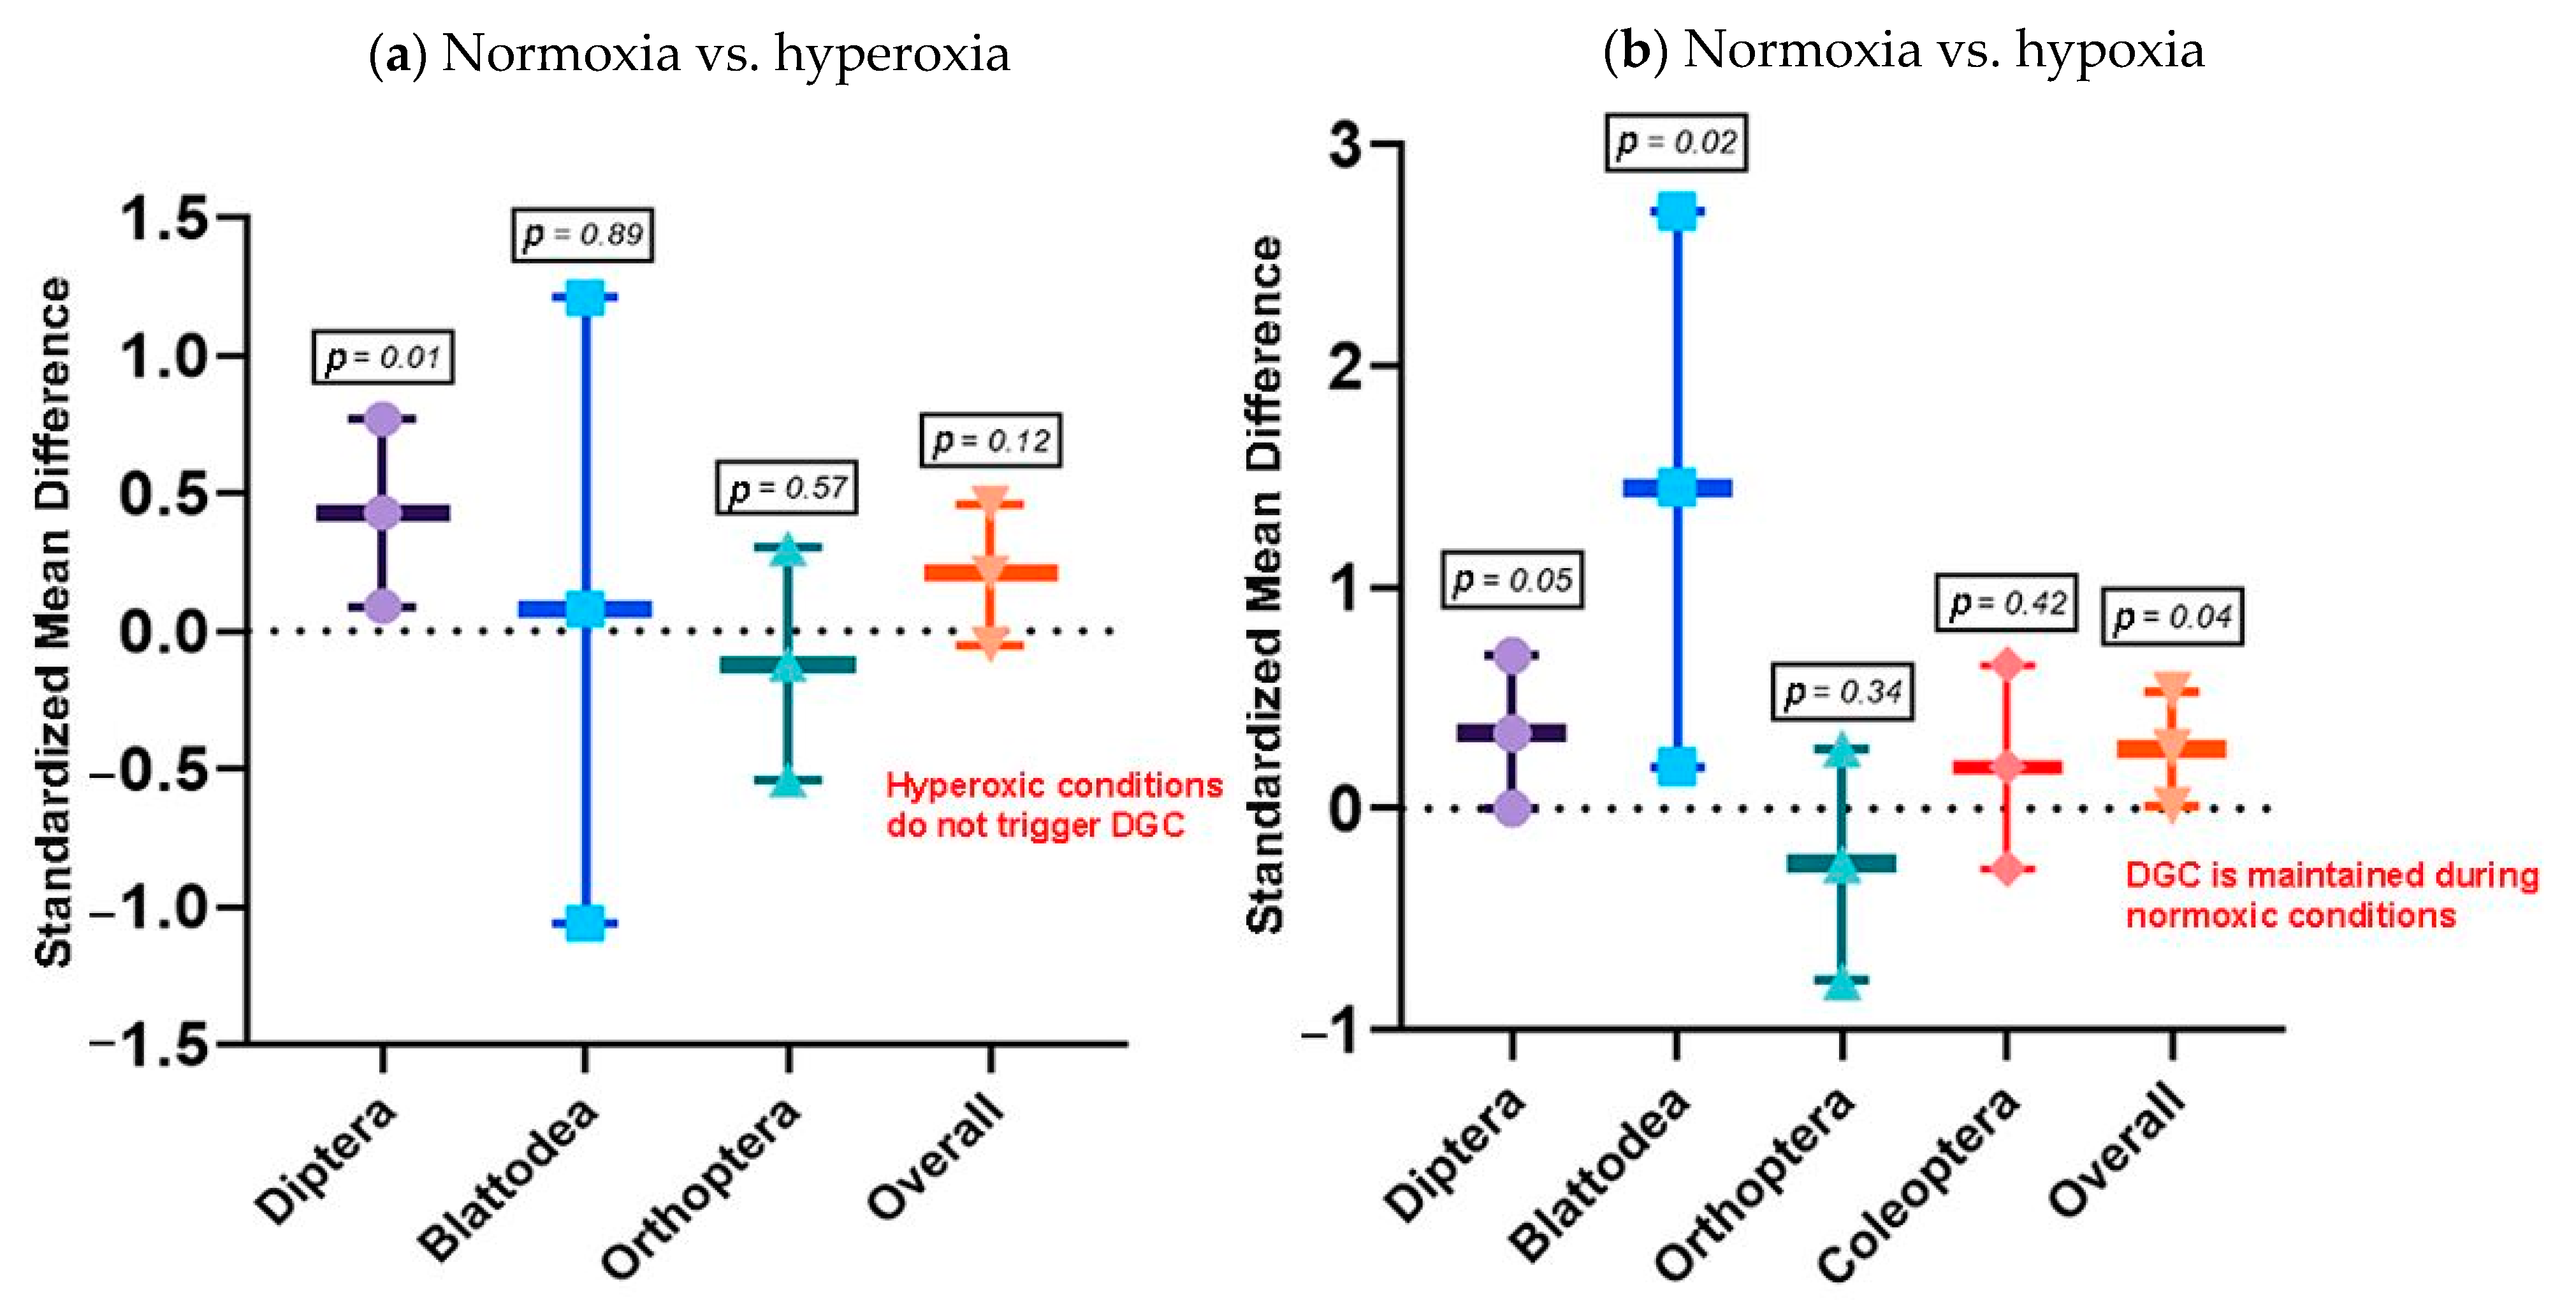
3.2.2. Objective 2: What Is the Role of the DGC under Chthonic Conditions?
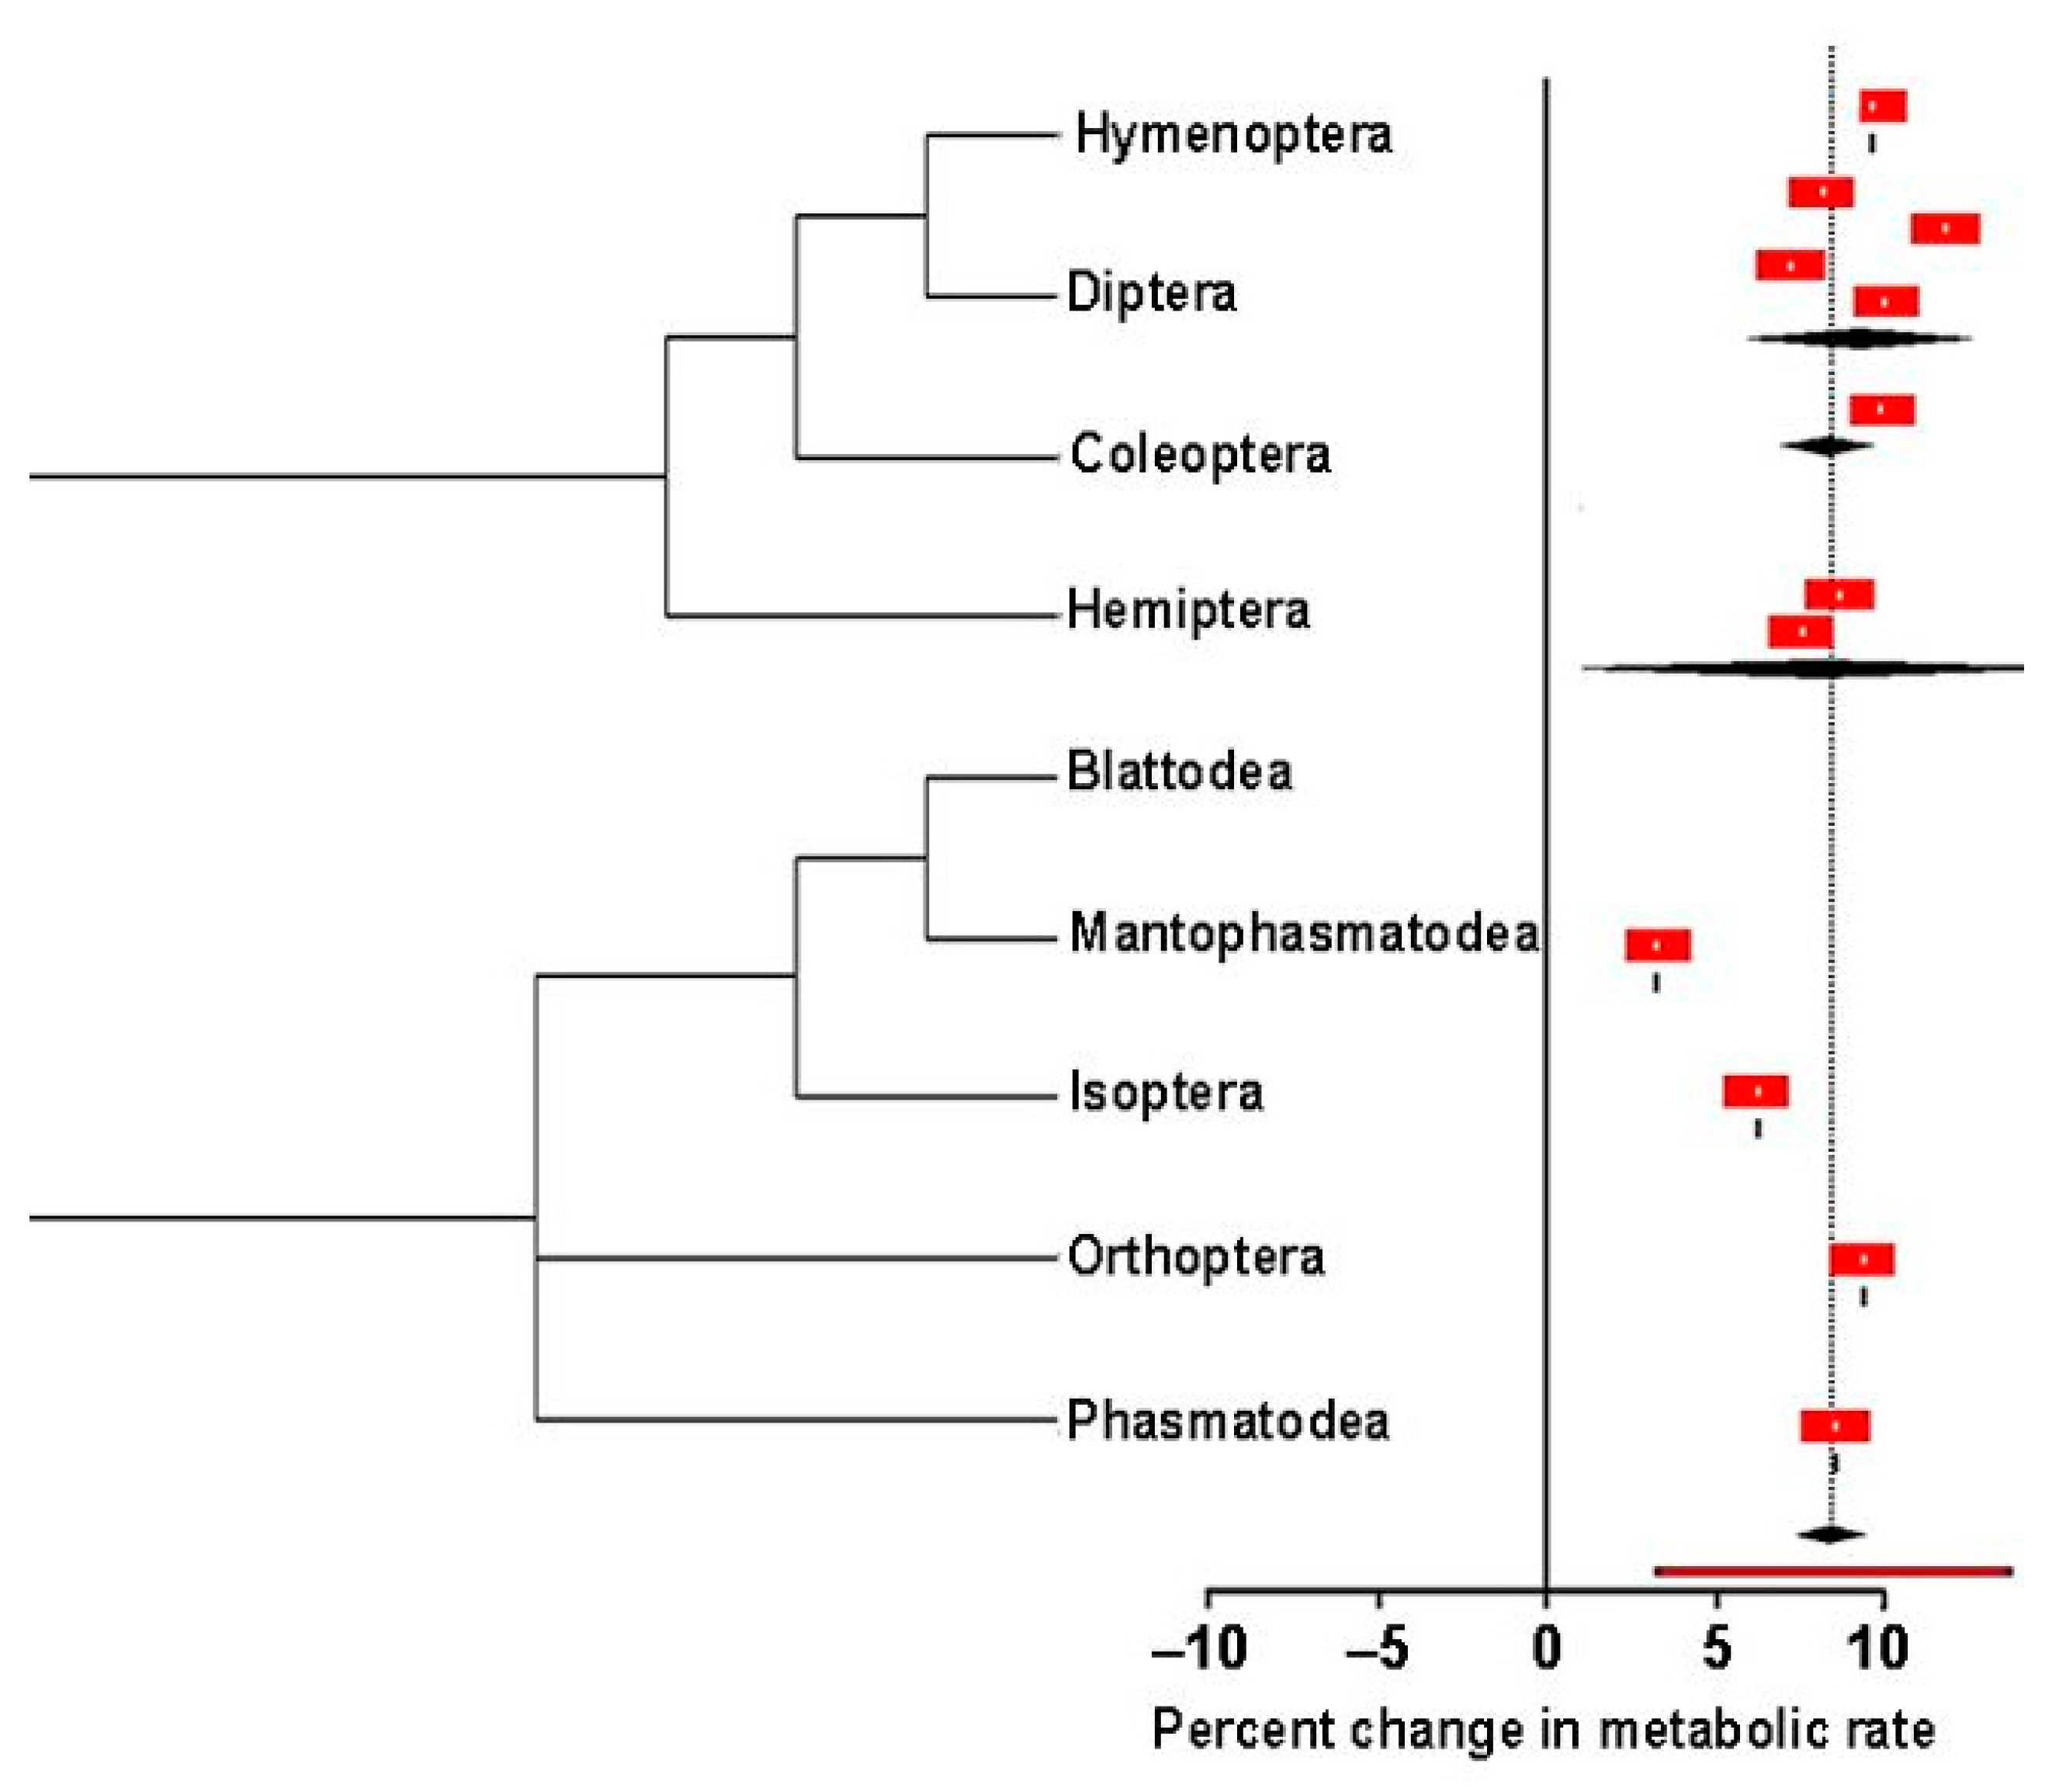
3.2.3. Objective 3. How Does the Metabolic Rate Change with Respect to Temperature?
4. Discussion
5. Conclusions
Supplementary Materials
Author Contributions
Funding
Institutional Review Board Statement
Data Availability Statement
Acknowledgments
Conflicts of Interest
References
- Wigglesworth, V.R. The direct transport of oxygen in insects by large tracheae. Tissue Cell 1990, 22, 239–243. [Google Scholar] [CrossRef]
- Gullan, P.; Cranston, P. The Insects, 2nd ed.; Blackwell Publishing Ltd.: Oxford, UK, 2000; pp. 406–423. [Google Scholar]
- Wigglesworth, V.R. The Principles of Insect Physiology, 7th ed.; Chapman and Hall: London, UK, 1972; pp. 825–827. [Google Scholar]
- Woods, H.A.; Smith, J.N. Universal model for water costs of gas exchange by animals and plants. Proc. Natl. Acad. Sci. USA 2010, 107, 8469–8474. [Google Scholar] [CrossRef] [PubMed]
- Marais, E.; Klok, C.J.; Terblanche, J.S.; Chown, S.L. Insect gas exchange patterns: A phylogenetic perspective. J. Exp. Biol. 2005, 208, 4495–4507. [Google Scholar] [CrossRef] [PubMed]
- Quinlan, M.C.; Gibbs, A.G. Discontinuous gas exchange in insects. Respir. Physiol. Neurobiol. 2006, 154, 18–29. [Google Scholar] [CrossRef] [PubMed]
- Kestler, P. Respiration and respiratory water loss. In Environmental Physiology and Biochemistry of Insects, 2nd ed.; Springer: Berlin/Heidelberg, Germany, 1985; pp. 137–183. [Google Scholar]
- Shelton, T.G.; Appel, A.G. Cyclic carbon dioxide release in the dampwood termite, Zootermopsis nevadensis (Hagen). Comp. Biochem. Physiol. Part A Mol. Integr. Physiol. 2000, 126, 539–545. [Google Scholar] [CrossRef]
- Dingha, B.N.; Appel, A.G.; Eubanks, M.D. Discontinuous carbon dioxide release in the German cockroach, Blattella germanica (Dictyoptera: Blattellidae), and its effect on respiratory transpiration. J. Insect Physiol. 2005, 51, 825–836. [Google Scholar] [CrossRef]
- Chown, S.L. Discontinuous gas exchange: New perspectives on evolutionary origins and ecological implications: New perspectives on discontinuous gas exchange. Funct. Ecol. 2011, 25, 1163–1168. [Google Scholar] [CrossRef]
- Groenewald, B.; Hetz, S.K.; Chown, S.L.; Terblanche, J.S. Respiratory dynamics of discontinuous gas exchange in the tracheal system of the desert locust, Schistocerca gregaria. J. Exp. Biol. 2012, 215, 2301–2307. [Google Scholar] [CrossRef][Green Version]
- Duncan, F.D. The role of the subelytral cavity in water loss in flightless dung beetle, Circellium bacchus (Coleoptera: Scarabaeinae). Eur. J. Entomol. 2002, 99, 253–258. [Google Scholar] [CrossRef]
- Contreras, H.L.; Heinrich, E.C.; Bradley, T.J. Hypotheses regarding the discontinuous gas exchange cycle (DGC) of insects. Curr. Opin. Insect Sci. 2014, 4, 48–53. [Google Scholar] [CrossRef]
- Levy, R.I.; Schneiderman, H.A. Discontinuous respiration in insects—III. The effect of temperature and ambient oxygen tension on the gaseous composition of the tracheal system of silkworm pupae. J. Insect Physiol. 1966, 12, 105–121. [Google Scholar] [CrossRef]
- Terblanche, J.S.; Woods, H.A. Why do models of insect respiratory patterns fail? J. Exp. Biol. 2018, 221, jeb130039. [Google Scholar] [CrossRef]
- Lighton, J.R.B.; Berrigan, D. Questioning paradigms: Caste-specific ventilation in harvester ants, Messor pergandei and M. julianus (Hymenoptera: Formicidae). J. Exp. Biol. 1995, 198, 521–530. [Google Scholar] [CrossRef]
- Buck, J.; Keister, M.; Specht, H. Discontinuous respiration in diapausing Agapema pupae. Anat. Rec. 1953, 117, 539–541. [Google Scholar]
- Hadley, N.F. Water Relations of Terrestrial Arthropods; Academic Press, Inc.: San Diego, CA, USA, 1994; pp. 200–210. [Google Scholar]
- Hetz, S.K.; Bradley, T.J. Insects breathe discontinuously to avoid oxygen toxicity. Nature 2005, 433, 516–519. [Google Scholar] [CrossRef]
- Contreras, H.L.; Bradley, T.J. Transitions in insect respiratory patterns are controlled by changes in metabolic rate. J. Insect Physiol. 2010, 56, 522–528. [Google Scholar] [CrossRef] [PubMed]
- Moerbitz, C.; Hetz, S.K. Tradeoffs between metabolic rate and spiracular conductance in discontinuous gas exchange of Samia cynthia (Lepidoptera, Saturniidae). J. Exp. Biol. 2010, 56, 536–542. [Google Scholar] [CrossRef] [PubMed]
- Chown, S.L.; Gibbs, A.G.; Hetz, S.K.; Klok, C.J.; Lighton, J.R.B.; Marais, E. Discontinuous gas exchange in insects: A clarification of hypotheses and approaches. Physiol. Biochem. Zool. 2006, 79, 333–343. [Google Scholar] [CrossRef]
- Schilman, P.E. Metabolism and gas exchange patterns in Rhodnius prolixus. J. Insect Physiol. 2017, 97, 38–44. [Google Scholar] [CrossRef]
- Glass, G.V. Integrating findings: The meta-analysis of research. In Review of Research in Education, 5th ed.; Peacock: Itasca, IL, USA, 1976; pp. 351–379. [Google Scholar]
- Nakagawa, S.; Cuthill, I.C. Effect size, confidence interval and statistical significance: A practical guide for biologists. Biol. Rev. 2007, 82, 591–605. [Google Scholar] [CrossRef] [PubMed]
- Gurevitch, J.; Koricheva, J.; Nakagawa, S.; Stewart, G. Meta-analysis and the science of research synthesis. Nature 2018, 555, 175–182. [Google Scholar] [CrossRef]
- R Core Team. R: A Language and Environment for Statistical Computing; R Foundation for Statistical Computing: Vienna, Austria, 2018; Available online: http://www.R-project.org/ (accessed on 14 February 2021).
- Ver Hoef, J.M. Who invented the delta method? Am. Stat. 2012, 66, 124–127. [Google Scholar] [CrossRef]
- Heine, K.B.; Abebe, A.; Wilson, A.E.; Hood, W.R. Copepod respiration increases by 7% per °C increase in temperature: A meta-analysis. Limnol. Oceanogr. Lett. 2019, 4, 53–61. [Google Scholar] [CrossRef]
- Hadfield, J.D. MCMC methods for multi-response generalized linear mixed models: The MCMCglmm R package. J. Stat. Soft. 2010, 33, 1–22. [Google Scholar] [CrossRef]
- Hadfield, J.D.; Nakagawa, S. General quantitative genetic methods for comparative biology: Phylogenies, taxonomies and multi-trait models for continuous and categorical characters. J. Evol. Biol. 2010, 23, 494–508. [Google Scholar] [CrossRef]
- Paradis, E.; Claude, J.; Strimmer, K. APE: Analyses of phylogenetics and evolution in R language. Bioinformatics 2004, 20, 289–290. [Google Scholar] [CrossRef] [PubMed]
- Review Manager (RevMan) [Computer program]; Version 5.3; The Cochrane Collaboration: Copenhagen, Denmark, 2014.
- Egger, M.; Smith, G.D.; Schneider, M.; Minder, C. Bias in meta-analysis detected by a simple, graphical test. BMJ 1997, 315, 629–634. [Google Scholar] [CrossRef]
- Schneiderman, H.A. Discontinuous respiration in insects: Role of the spiracles. Biol. Bull. 1960, 119, 494–528. [Google Scholar] [CrossRef]
- Levy, R.I.; Schneiderman, H.A. Discontinuous respiration in insects—II. The direct measurement and significance of changes in tracheal gas composition during the respiratory cycle of silkworm pupae. J. Insect Physiol. 1966, 12, 83–104. [Google Scholar] [CrossRef]
- Gibbs, A.G.; Johnson, R.A. The role of discontinuous gas exchange in insects: The chthonic hypothesis does not hold water. J. Exp. Biol. 2004, 207, 3477–3482. [Google Scholar] [CrossRef]
- Lighton, J.R.B.; Turner, R.J. The hygric hypothesis does not hold water: Abolition of discontinuous gas exchange cycles does not affect water loss in the ant Camponotus vicinus. J. Exp. Biol. 2008, 211, 563–567. [Google Scholar] [CrossRef] [PubMed][Green Version]
- White, C.R.; Blackburn, T.M.; Terblanche, J.S.; Marais, E.; Gibernau, M.; Chown, S.L. Evolutionary responses of discontinuous gas exchange in insects. Proc. Natl. Acad. Sci. USA 2007, 104, 8357–8361. [Google Scholar] [CrossRef] [PubMed]
- Lighton, J.R.B. Respiratory biology: Why insects evolved discontinuous gas exchange. Curr. Biol. 2007, 17, R645–R647. [Google Scholar] [CrossRef]
- Lighton, J.R.B. Direct measurement of mass loss during discontinuous ventilation in two species of ants. J. Exp. Biol. 1992, 173, 289–293. [Google Scholar] [CrossRef]
- Lighton, J.R.B.; Turner, R.J. Thermolimit respirometry: An objective assessment of critical thermal maxima in two sympatric desert harvester ants, Pogonomyrmex rugosus and P. californicus. J. Exp. Biol. 2004, 207, 1903–1913. [Google Scholar] [CrossRef]
- Lighton, J.R.B. Discontinuous gas exchange in insects. Annu. Rev. Entomol. 1996, 41, 309–324. [Google Scholar] [CrossRef] [PubMed]
- Lighton, J.R.B. Slow discontinuous ventilation in the Namib dune-sea ant Campotonus detritus (Hymenoptera, Formicidae). J. Exp. Biol. 1990, 151, 71–82. [Google Scholar] [CrossRef]
- Zachariassen, K.E. The water conserving physiological compromise of desert insects. Eur. J. Entomol. 1996, 93, 359–367. [Google Scholar]
- Hadley, N.F.; Quinlan, M.C. Discontinuous carbon dioxide release in the eastern lubber grasshopper Romalea guttata and its effect on respiratory transpiration. J. Exp. Biol. 1993, 177, 169–180. [Google Scholar] [CrossRef]
- Quinlan, M.C.; Hadley, N.F. Gas exchange, ventilatory patterns, and water loss in two lubber grasshoppers: Quantifying cuticular and respiratory transpiration. Physiol. Zool. 1993, 66, 628–642. [Google Scholar] [CrossRef]
- Rourke, B.C. Geographic and altitudinal variation in water balance and metabolic rate in a California grasshopper, Melanopus sanguinipes. J. Exp. Biol. 2000, 203, 2699–2712. [Google Scholar] [CrossRef]
- Edney, E.B. Water Balance in Land Arthropods, 1st ed.; Springer: Berlin, Germany, 1977. [Google Scholar]
- Chown, S.L. Respiratory water loss in insects. Comp. Biochem. Physiol. Part. A. Mol. Integr. Physiol. 2002, 133, 791–804. [Google Scholar] [CrossRef]
- Lighton, J.R.B. Discontinuous CO2 emission in a small insect, the formicine ant Campoxotus vicixus. J. Exp. Biol. 1988, 134, 363–376. [Google Scholar] [CrossRef]
- Noble-Nesbitt, J.; Appel, A.G.; Croghan, P.C. Water and carbon dioxide loss from the cockroach Periplaneta americana (L.) measured using radioactive isotopes. J. Exp. Biol. 1995, 198, 235–240. [Google Scholar] [PubMed]
- Lighton, J.R.B.; Feener, D.H. Water-Loss Rate and Cuticular Permeability in Foragers of the Desert Ant Pogonomyrmex rugosus. Physiol. Zool. 1989, 62, 1232–1256. [Google Scholar] [CrossRef]
- Addo-Bediako, A.; Chown, S.L.; Gaston, K.J. Revisiting water loss in insects: A large scale view. J. Insect Physiol. 2001, 47, 1377–1388. [Google Scholar] [CrossRef]
- Schneiderman, H.A. Spiracular control of discontinuous respiration in insects. Nature 1956, 177, 1169–1171. [Google Scholar] [CrossRef]
- Kanwisher, J.W. Tracheal gas dynamics in pupae of the Cecropia silkworm. Biol. Bull. 1966, 130, 96–105. [Google Scholar] [CrossRef]
- Heinrich, E.; Bradley, T. Temperature-dependent variation in gas exchange patterns and spiracular control in Rhodnius prolixus. J. Exp. Biol. 2014, 217, 2752–2760. [Google Scholar] [CrossRef]
- Vogt, J.T.; Appel, A.G. Discontinuous gas exchange in the fire ant, Solenopsis invicta Buren:: Caste differences and temperature effects. J. Insect Physiol. 2000, 46, 403–416. [Google Scholar] [CrossRef]
- Schilman, P.E.; Lighton, J.R.B.; Holway, D.A. Respiratory and cuticular water loss in insects with continuous gas exchange: Comparison across five ant species. J. Insect Physiol. 2005, 51, 1295–1305. [Google Scholar] [CrossRef] [PubMed]
- Waters, J.S.; Harrison, J.F. Insect metabolic rates. In Metabolic Ecology: A Scaling Approach, 2nd ed.; Wiley-Blackwell: Oxford, UK, 2012; pp. 198–211. [Google Scholar]
- Irlich, U.M.; Terblanche, J.S.; Blackburn, T.M.; Chown, S.L. Insect rate-temperature relationships: Environmental variation and the metabolic theory of ecology. Am. Nat. 2009, 174, 819–835. [Google Scholar] [CrossRef] [PubMed]
- Gillooly, J.F.; Brown, J.H.; West, G.B.; Savage, V.M.; Charnov, E.L. Effects of size and temperature on metabolic rate. Science 2001, 239, 2248–2251. [Google Scholar] [CrossRef] [PubMed]
- Lighton, J.R.B. Measuring Metabolic Rates: A Manual For Scientists; Oxford University Press: New York, NY, USA, 2008; pp. 90–95. [Google Scholar]
- Leis, M.; Pereira, M.H.; Casas, J.; Menu, F.; Lazzari, C.R. Haematophagy is costly: Respiratory patterns and metabolism during feeding in Rhodnius prolixus. J. Exp. Biol. 2016, 219, 1820–1826. [Google Scholar] [CrossRef]
- Contreras, H.L.; Bradley, T.J. Metabolic rate controls respiratory pattern in insects. J. Exp. Biol. 2009, 212, 424–428. [Google Scholar] [CrossRef] [PubMed]
- Terblanche, J.S.; Clusella-Trullas, S.; Chown, S.L. Phenotypic plasticity of gas exchange pattern and water loss in Scarabaeus spretus (Coleoptera: Scarabaeidae): Deconstructing the basis for metabolic rate variation. J. Exp. Biol. 2010, 213, 2940–2949. [Google Scholar] [CrossRef]
- Duncan, F.D.; Dickman, C.R. Respiratory patterns and metabolism in tenebrionid and carabid beetles from the Simpson Desert Australia. Oecologia 2001, 129, 509–517. [Google Scholar] [CrossRef]
- Darwin, C. On the Origin of Species by Means of Natural Selection, or Preservation of Favoured Races in the Struggle for Life; John Murray: London, UK, 1859. [Google Scholar]
- Folk, D.G.; Bradley, T.J. The evolution of recovery from desiccation stress in laboratory-selected populations of Drosophila melanogaster. J. Exp. Biol. 2004, 207, 2671–2678. [Google Scholar] [CrossRef]


Publisher’s Note: MDPI stays neutral with regard to jurisdictional claims in published maps and institutional affiliations. |
© 2022 by the authors. Licensee MDPI, Basel, Switzerland. This article is an open access article distributed under the terms and conditions of the Creative Commons Attribution (CC BY) license (https://creativecommons.org/licenses/by/4.0/).
Share and Cite
Oladipupo, S.O.; Wilson, A.E.; Hu, X.P.; Appel, A.G. Why Do Insects Close Their Spiracles? A Meta-Analytic Evaluation of the Adaptive Hypothesis of Discontinuous Gas Exchange in Insects. Insects 2022, 13, 117. https://doi.org/10.3390/insects13020117
Oladipupo SO, Wilson AE, Hu XP, Appel AG. Why Do Insects Close Their Spiracles? A Meta-Analytic Evaluation of the Adaptive Hypothesis of Discontinuous Gas Exchange in Insects. Insects. 2022; 13(2):117. https://doi.org/10.3390/insects13020117
Chicago/Turabian StyleOladipupo, Seun O., Alan E. Wilson, Xing Ping Hu, and Arthur G. Appel. 2022. "Why Do Insects Close Their Spiracles? A Meta-Analytic Evaluation of the Adaptive Hypothesis of Discontinuous Gas Exchange in Insects" Insects 13, no. 2: 117. https://doi.org/10.3390/insects13020117
APA StyleOladipupo, S. O., Wilson, A. E., Hu, X. P., & Appel, A. G. (2022). Why Do Insects Close Their Spiracles? A Meta-Analytic Evaluation of the Adaptive Hypothesis of Discontinuous Gas Exchange in Insects. Insects, 13(2), 117. https://doi.org/10.3390/insects13020117