
Decrease in Carabid Beetles in Grasslands of Northwestern China: Further Evidence of Insect Biodiversity Loss


Abstract
:Simple Summary
Abstract
1. Introduction
2. Materials and Methods
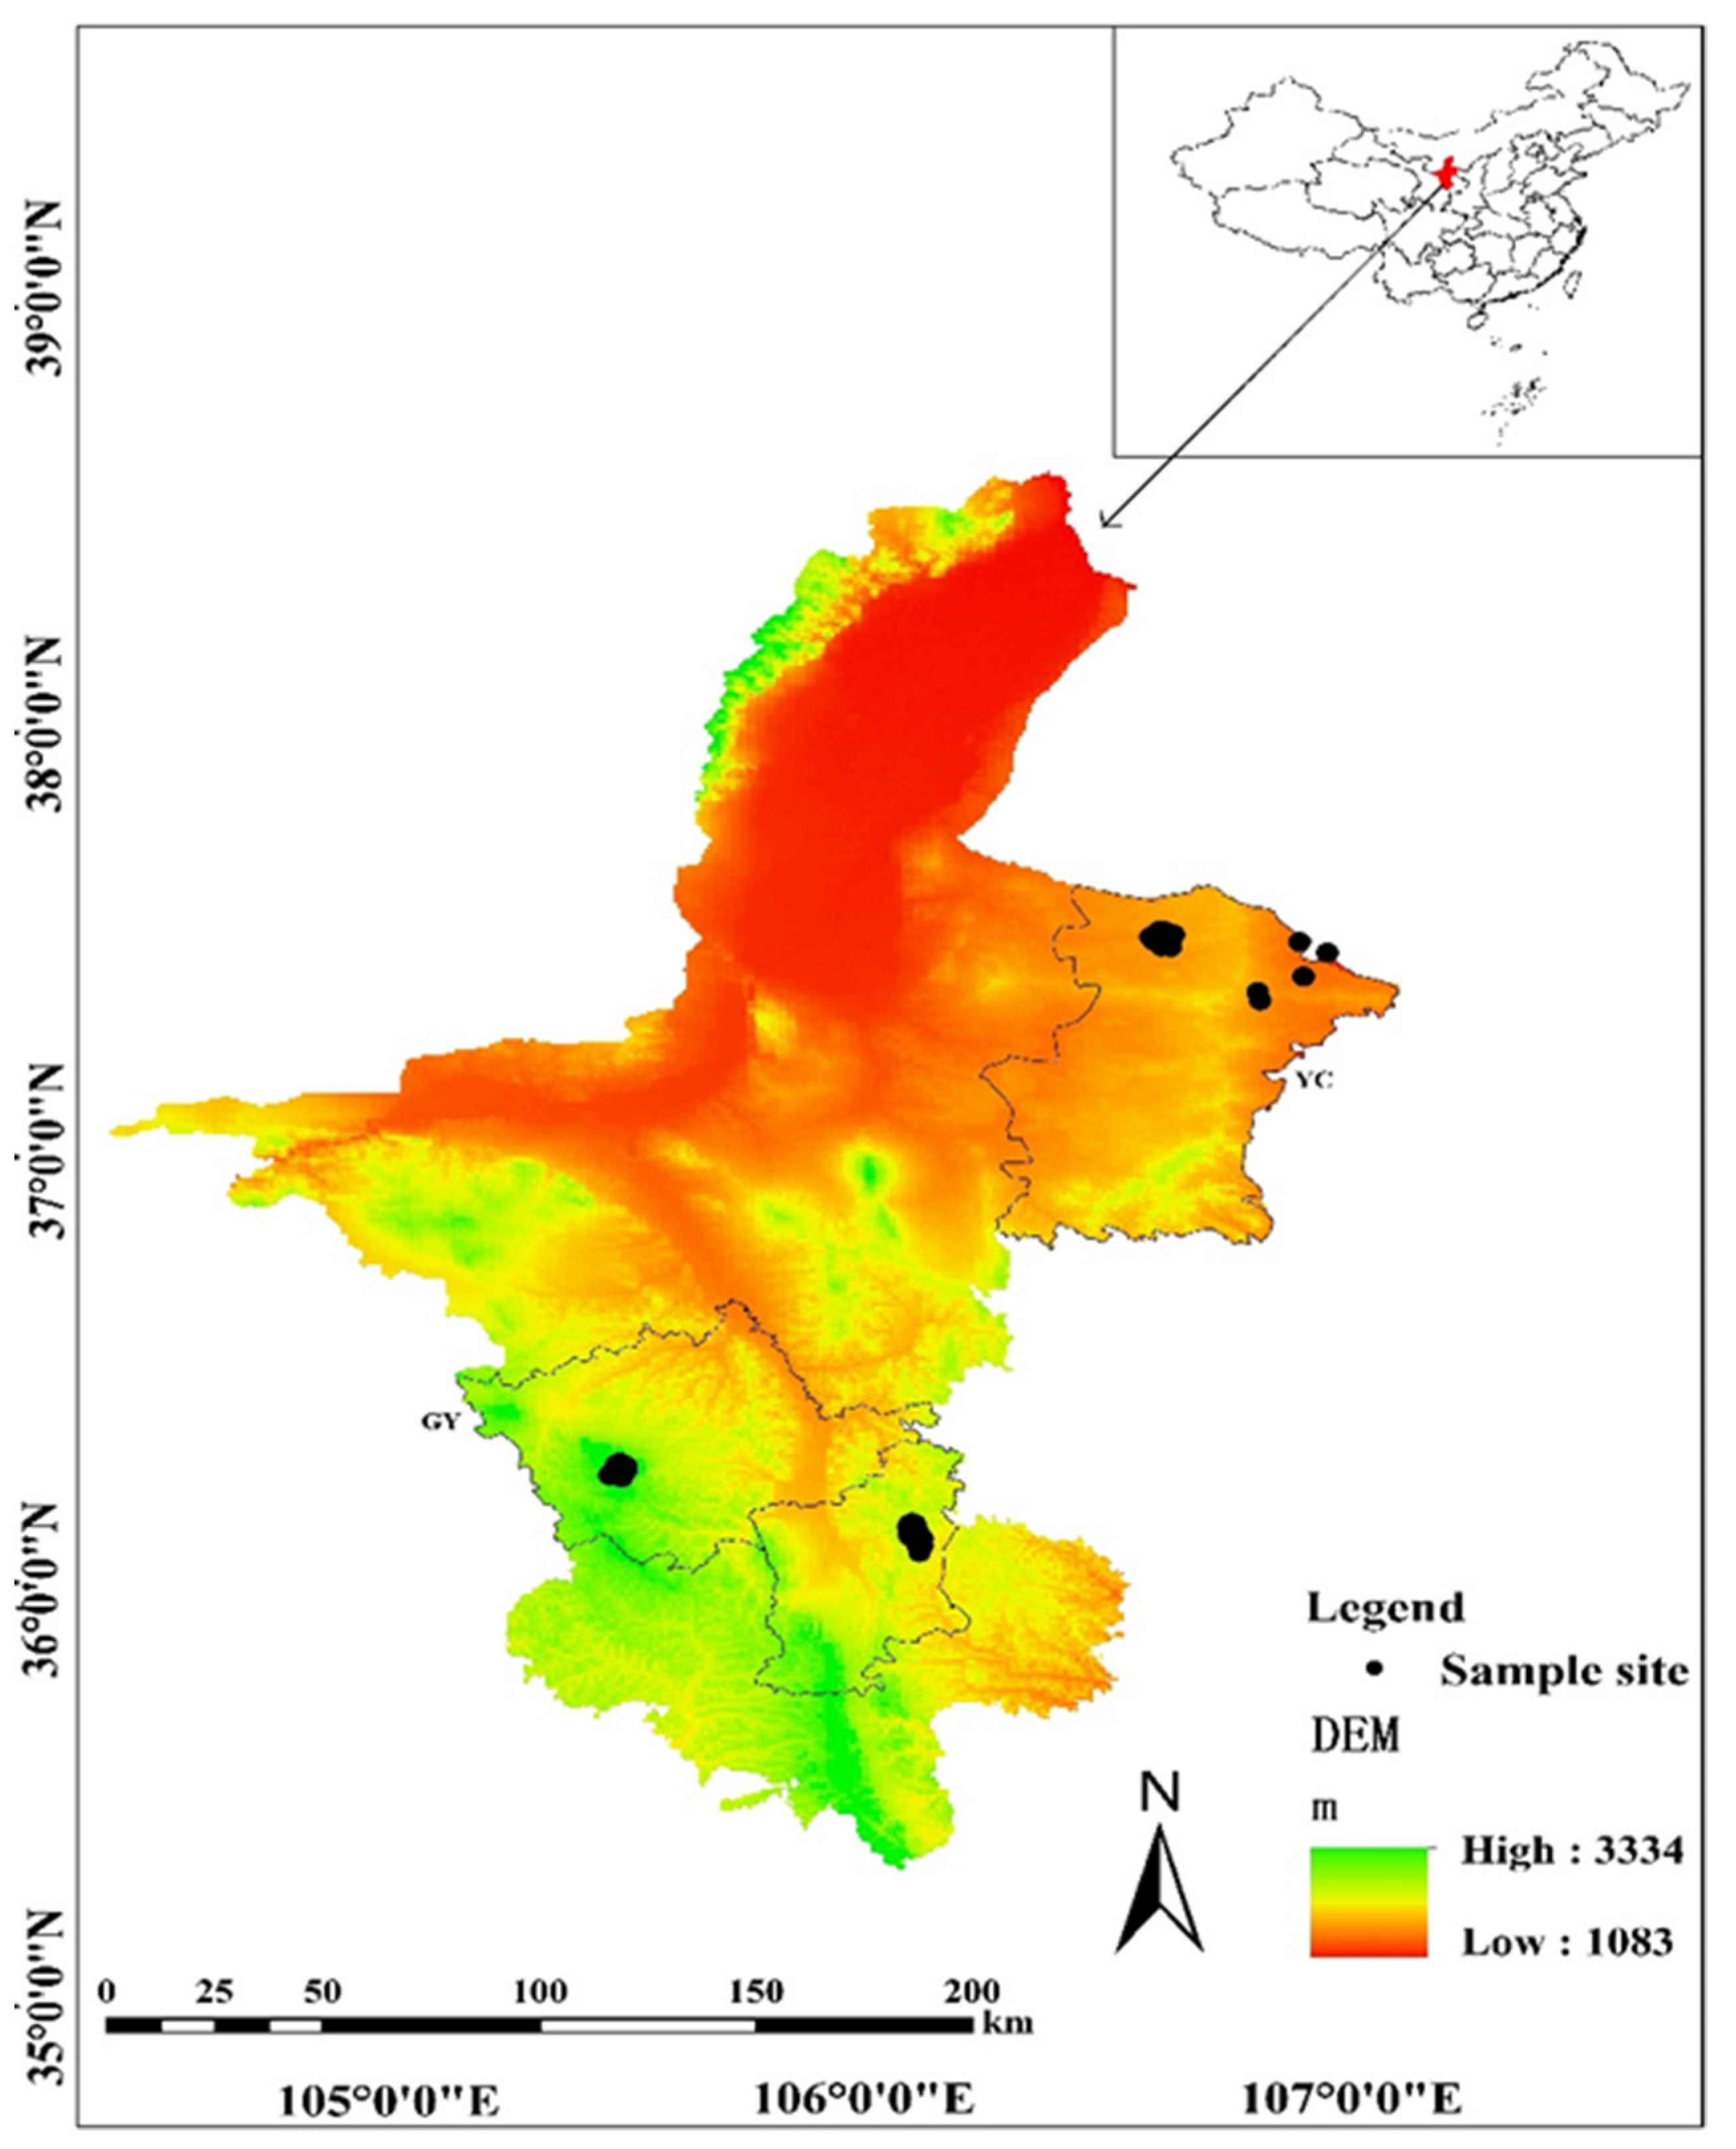
2.1. Study Area
2.2. Beetle Samples
2.3. Soil and Environment Parameters
2.4. Data Analysis
3. Results
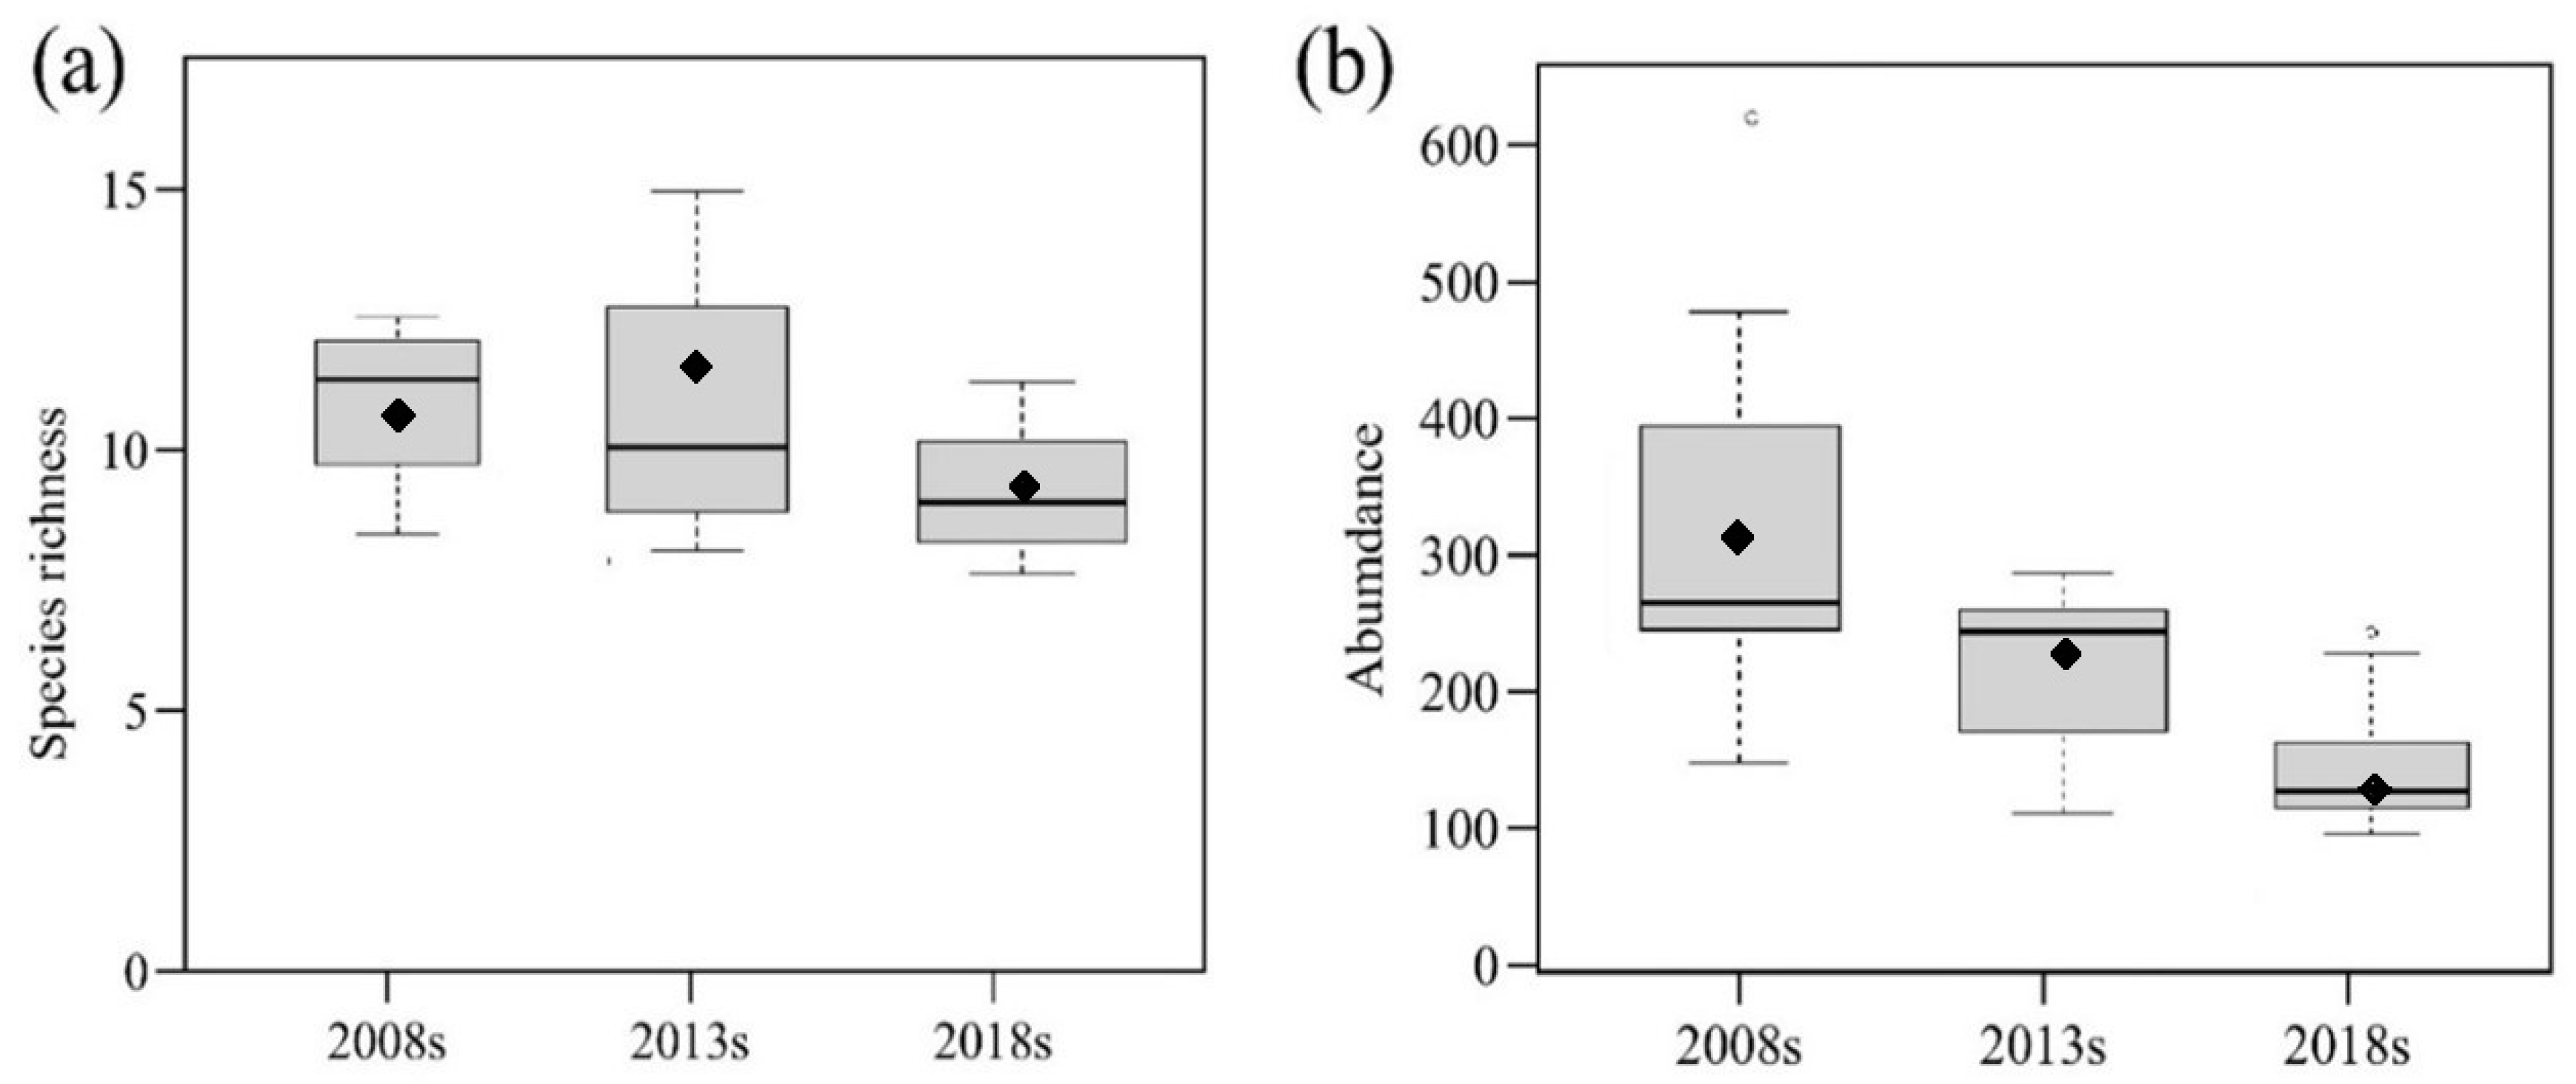
3.1. Beetle Abundance and Species Richness
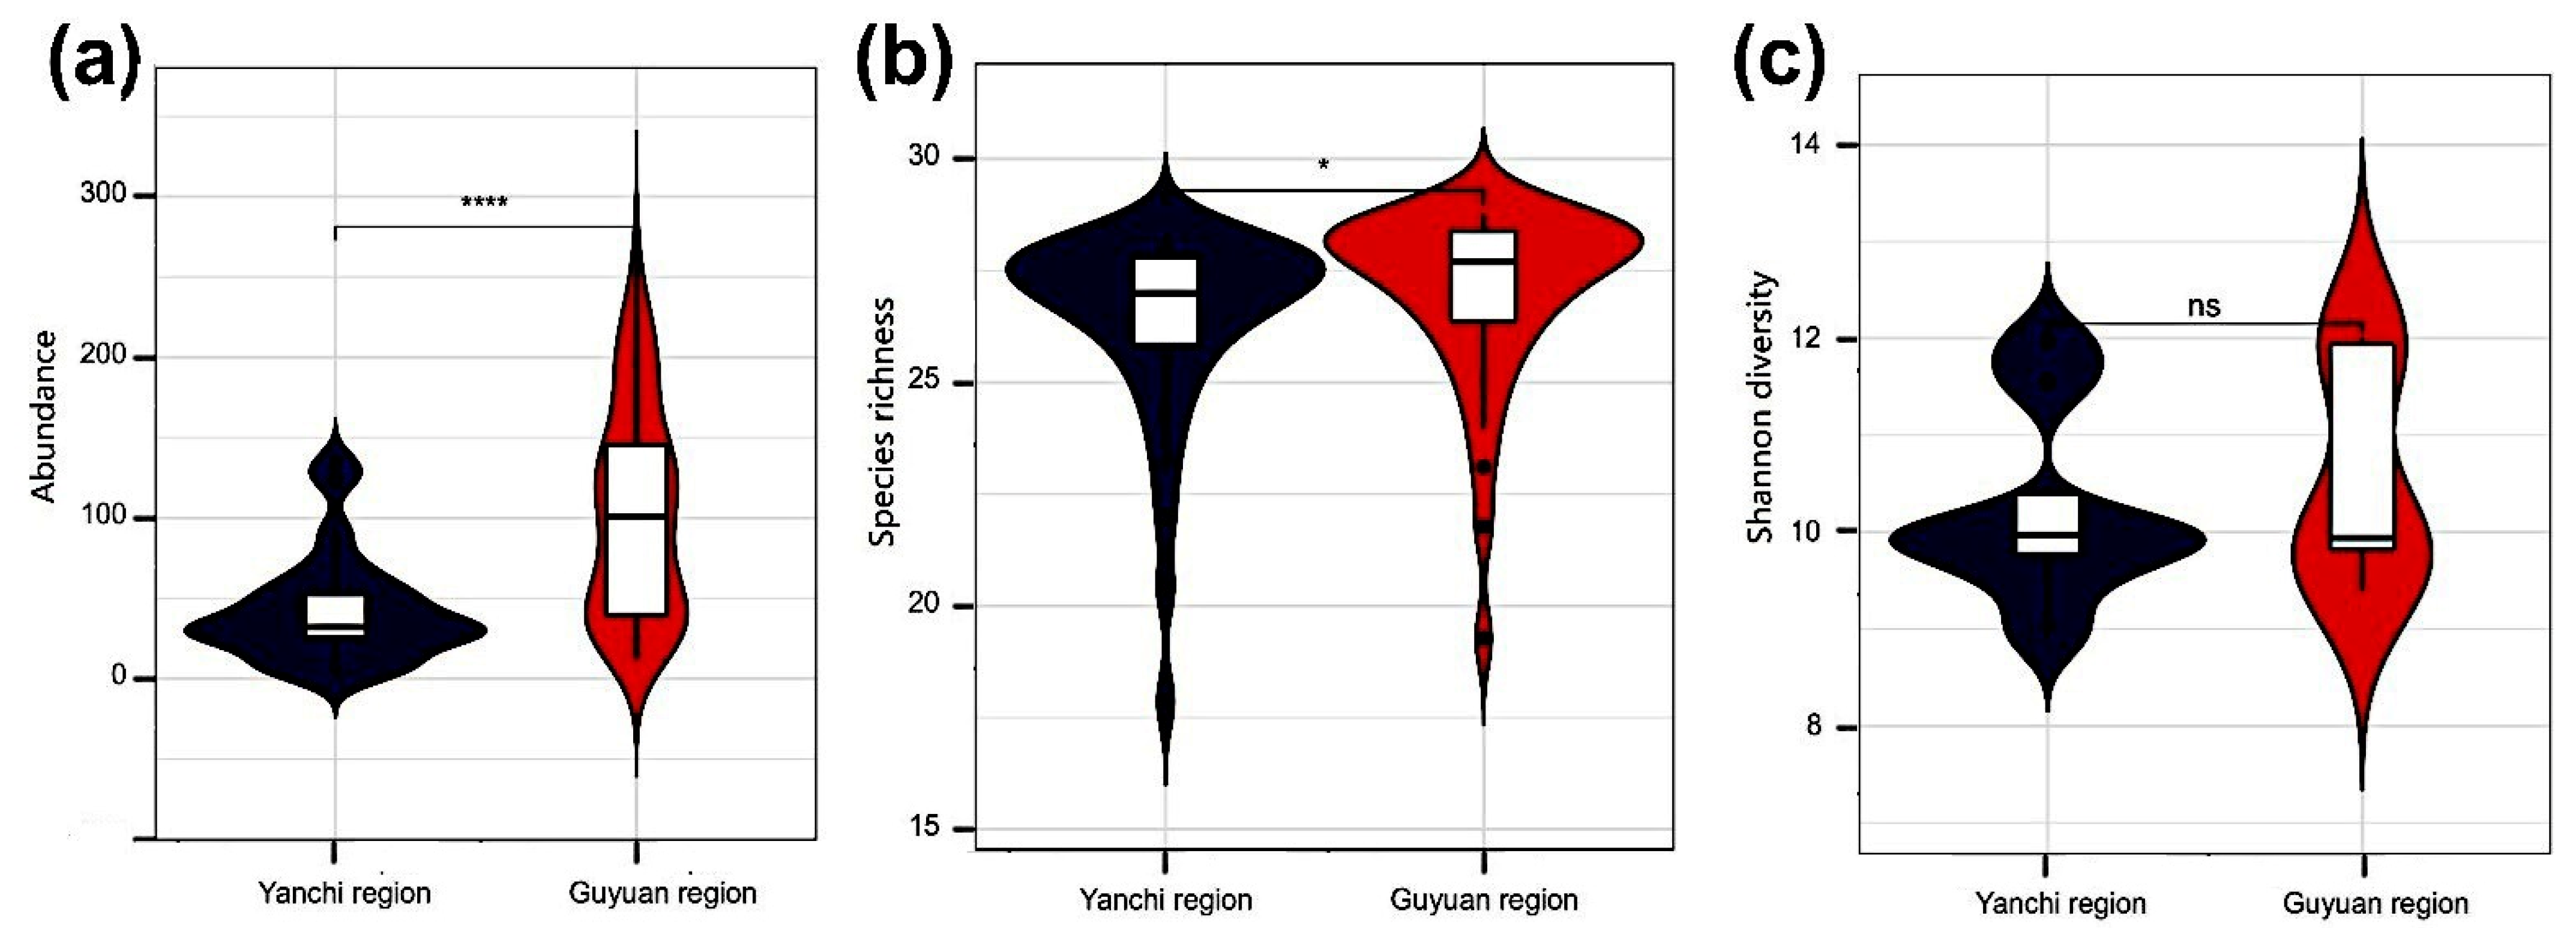
3.2. Measure Diversity
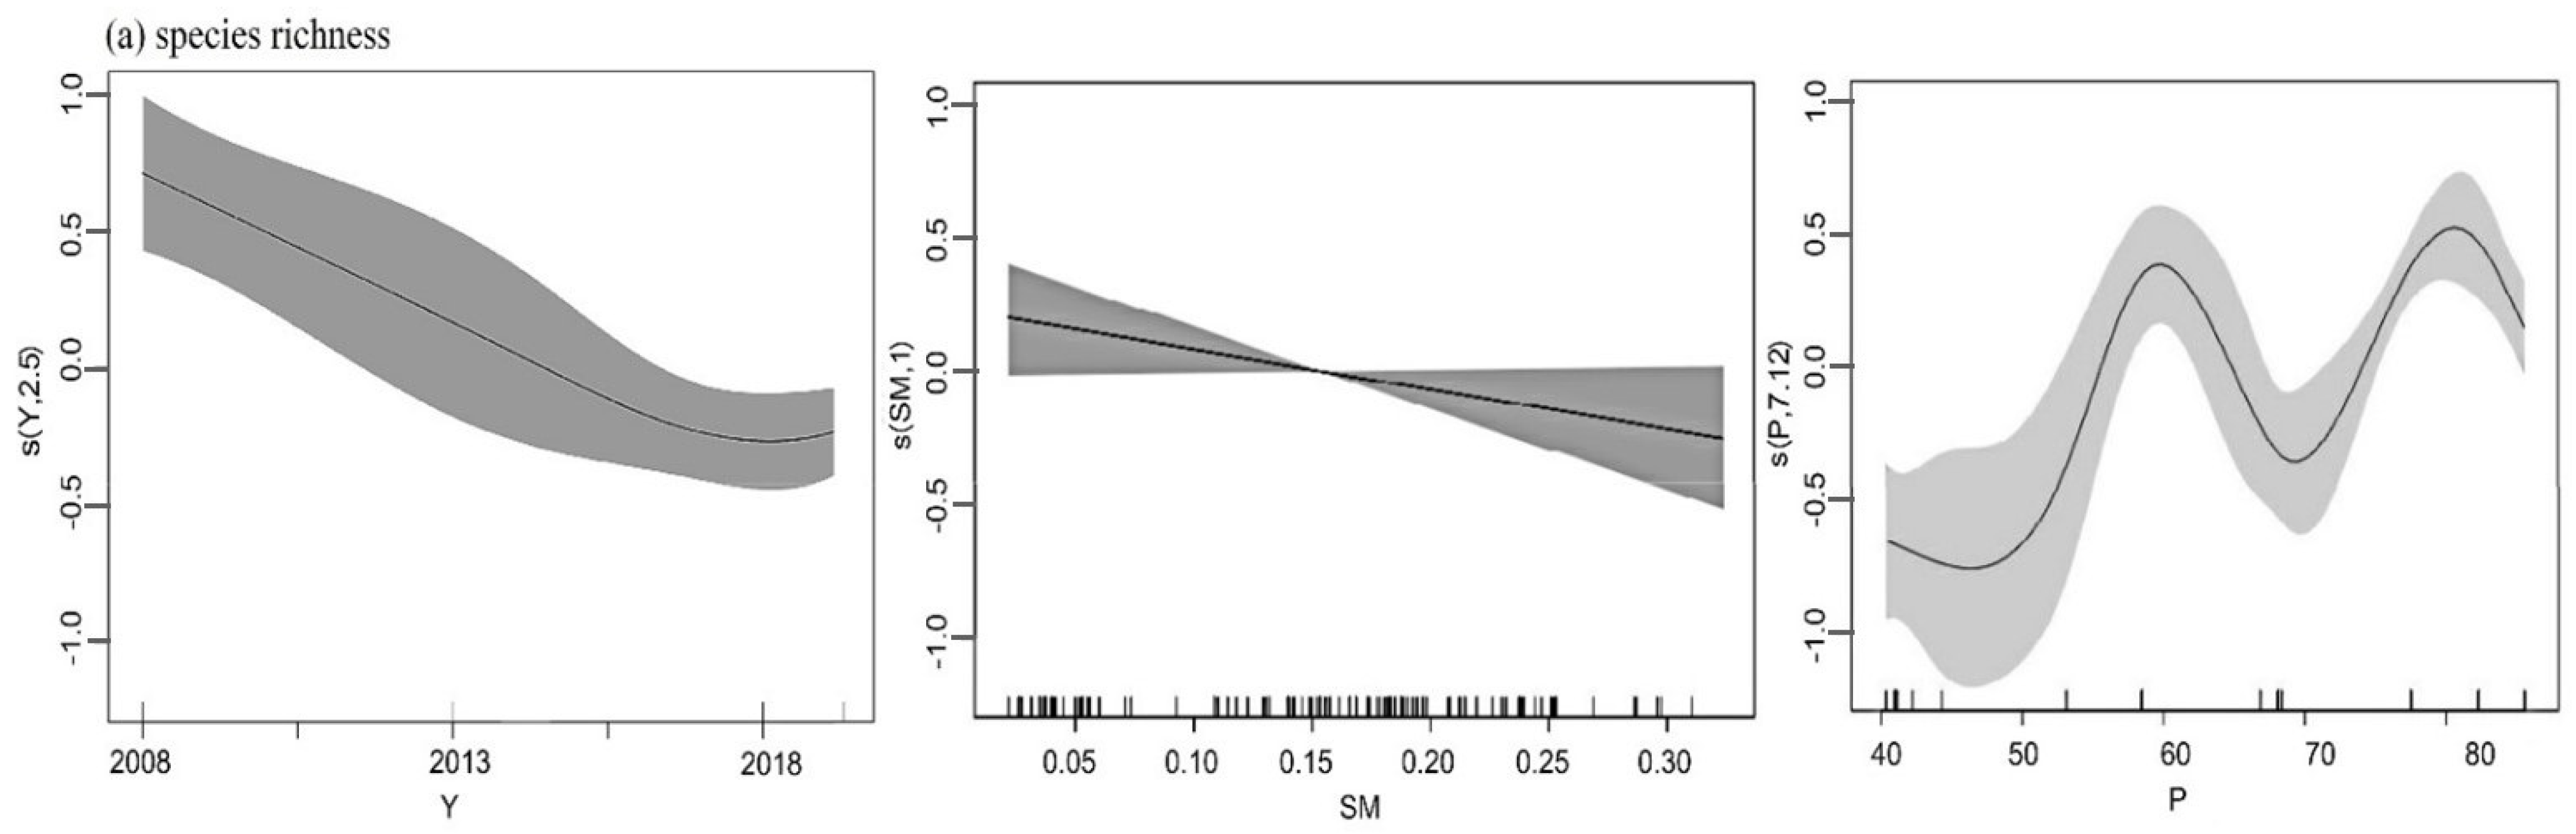
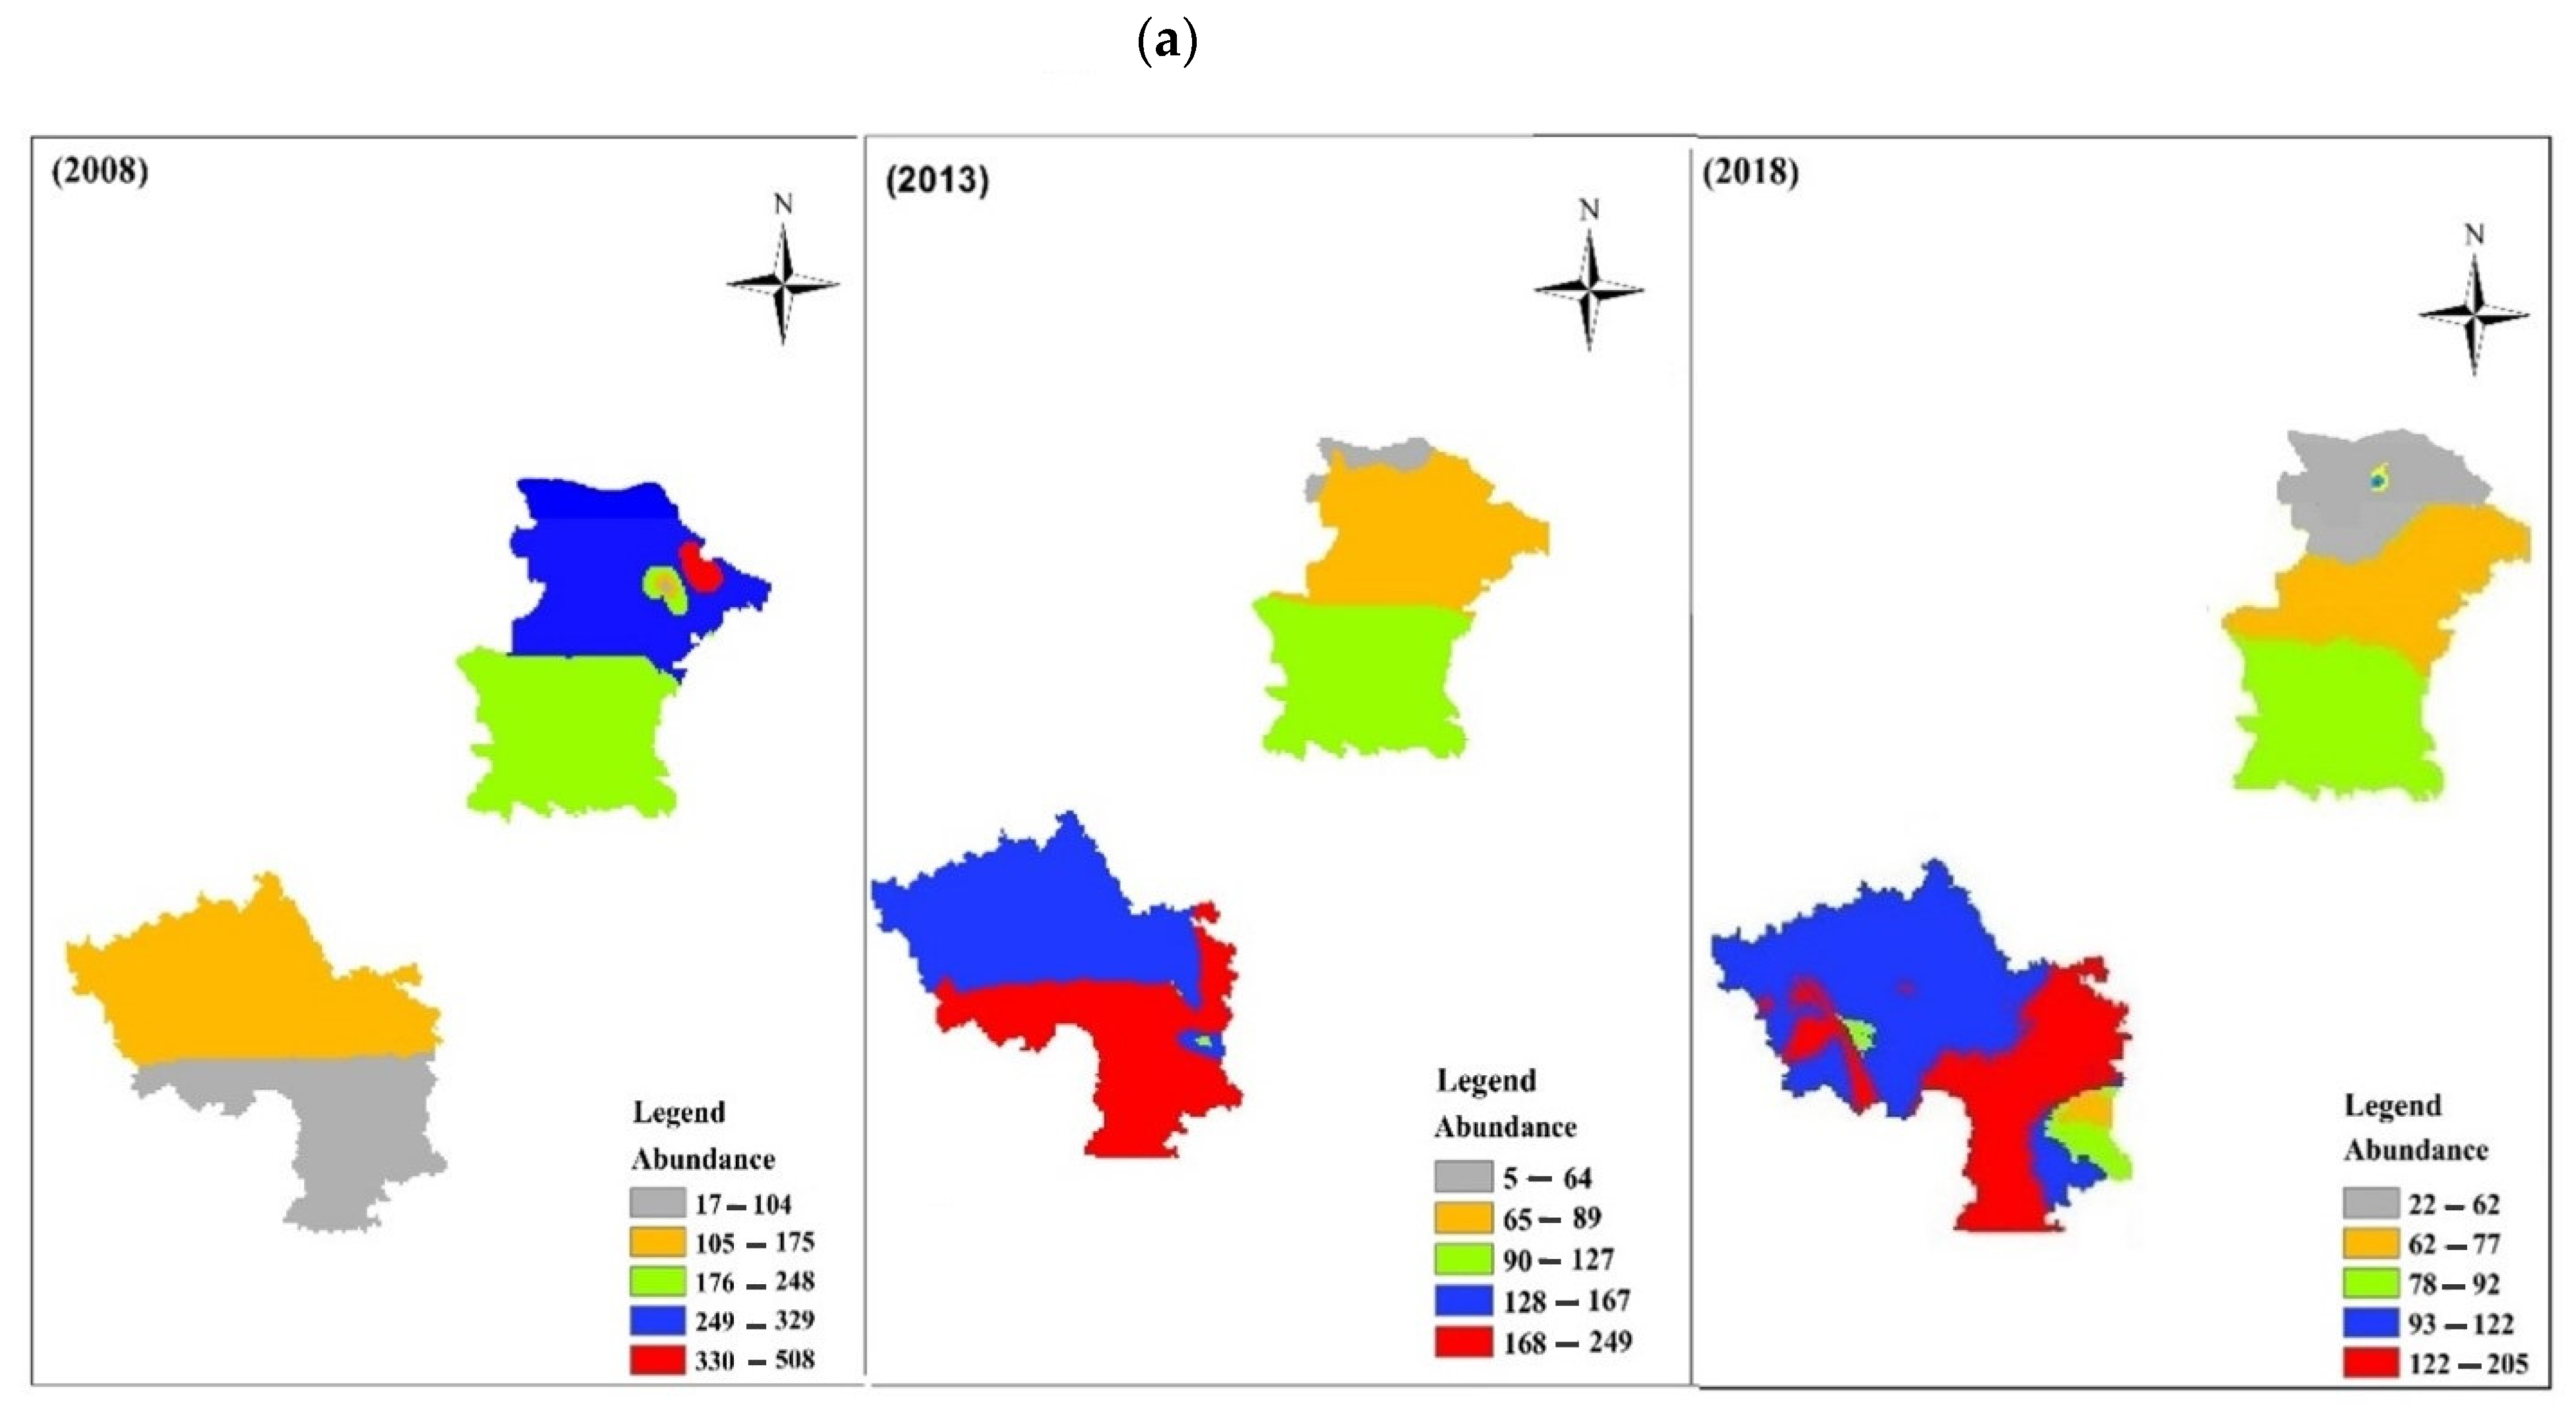
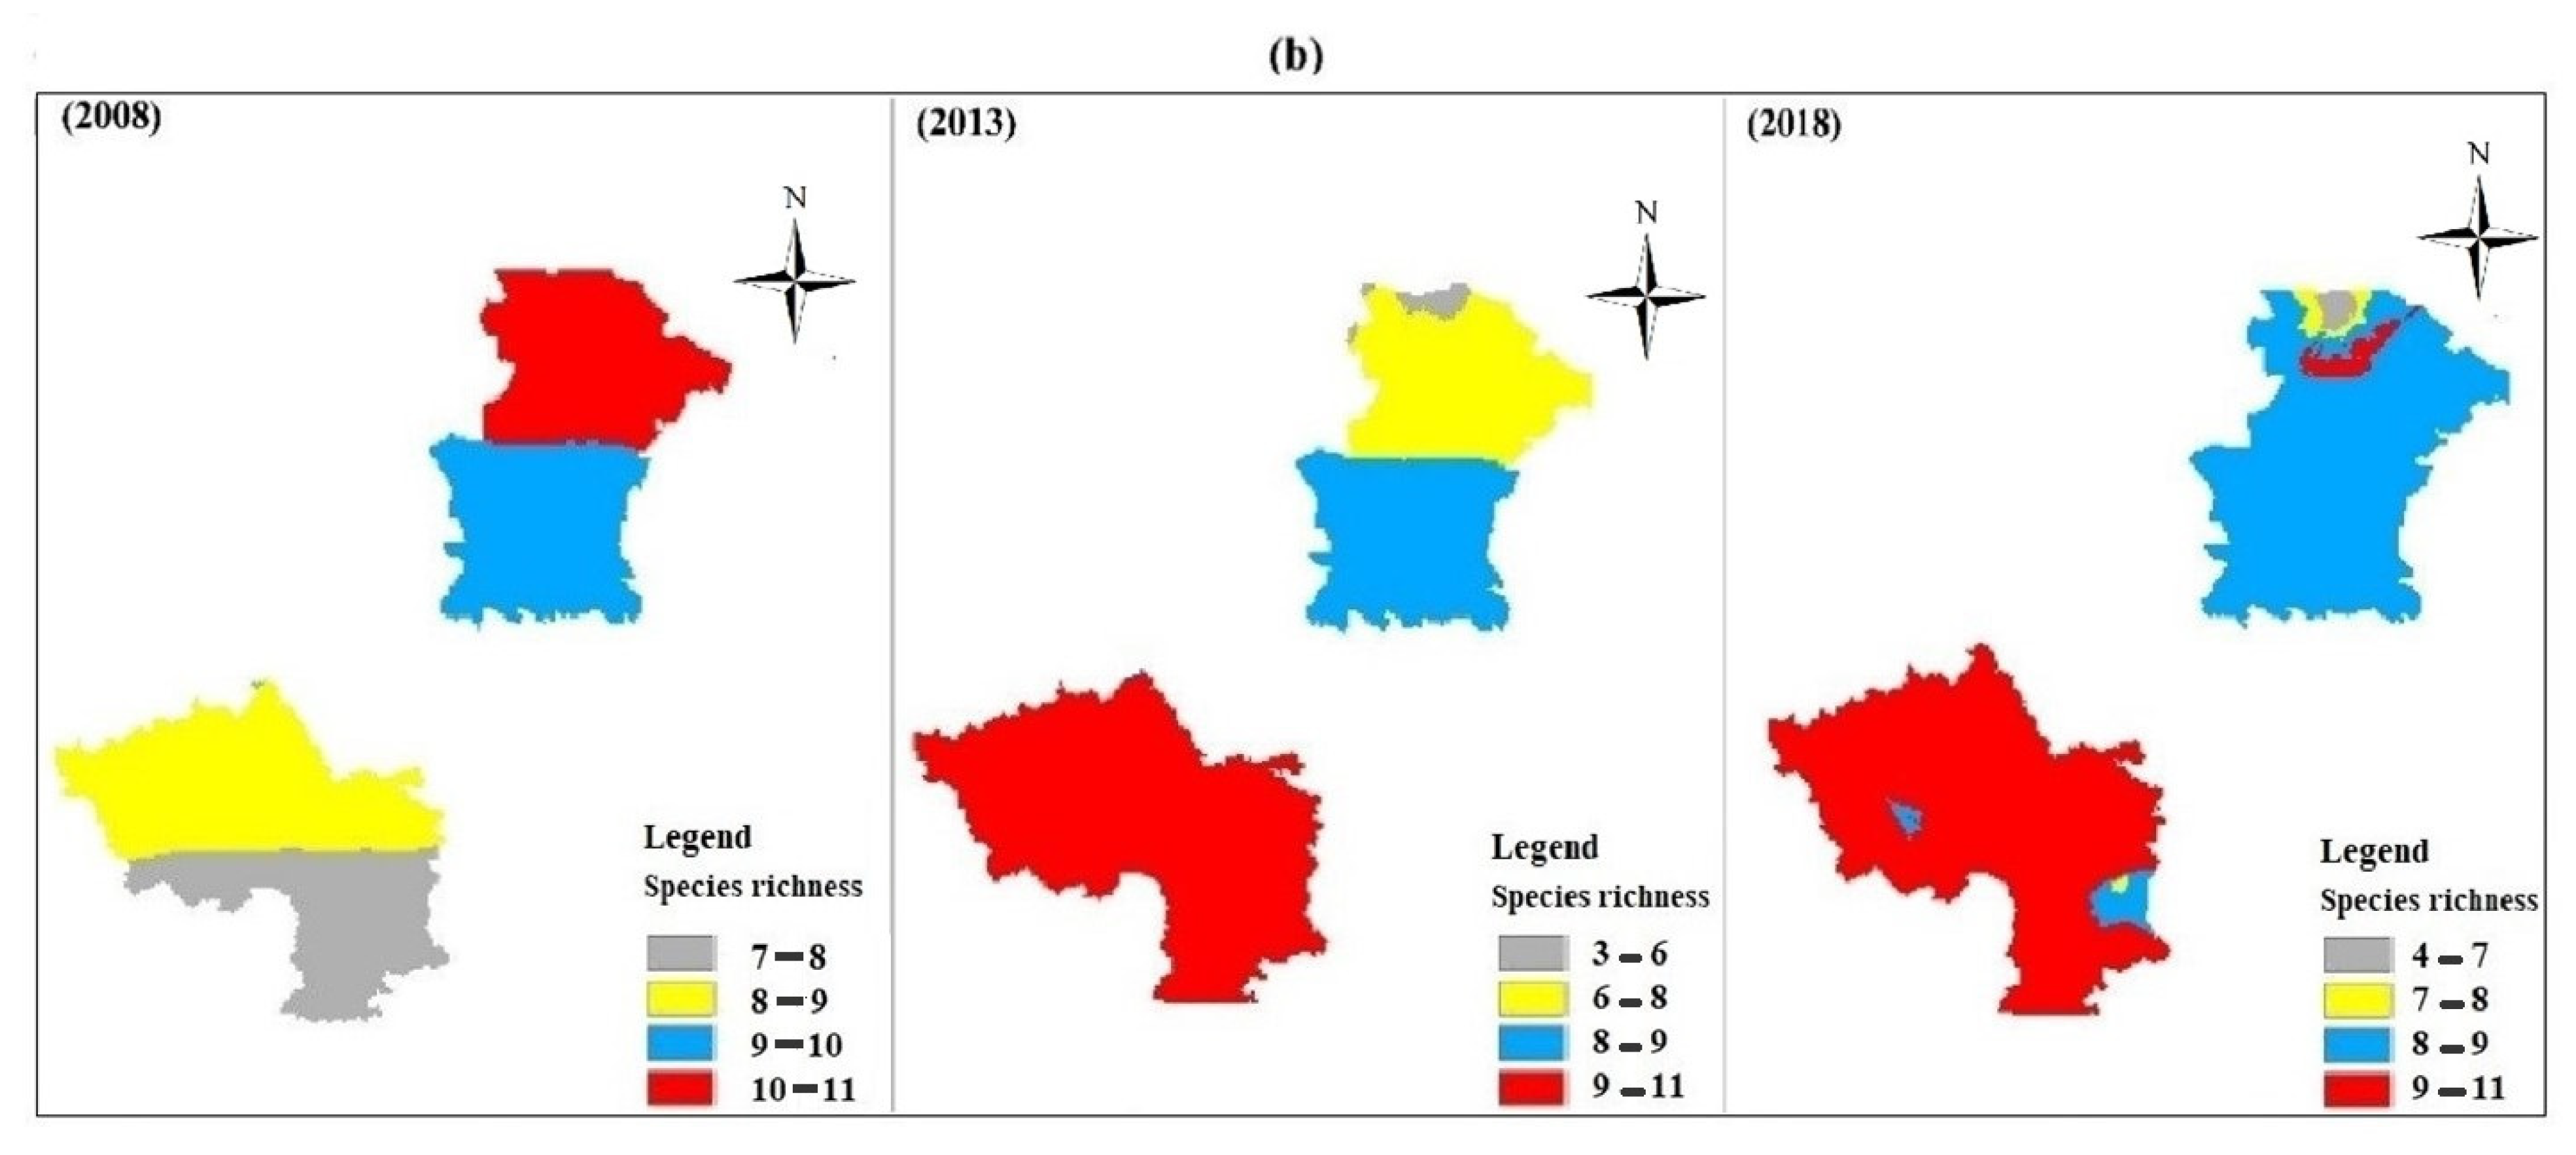
3.3. Pattern of Spatial Distribution
4. Discussion
5. Conclusions
Author Contributions
Funding
Institutional Review Board Statement
Data Availability Statement
Acknowledgments
Conflicts of Interest
Appendix A

| Site/ Quadrat | Latitude/ Longitude | 2008 | 2009 | 2013 | 2017 | 2018 | 2019 | Site | Latitude/ Longitude | 2008 | 2009 | 2013 | 2017 | 2018 | 2019 | Site/ Quadrat | Latitude/ Longitude | 2008 | 2009 | 2013 | 2017 | 2018 | 2019 |
|---|---|---|---|---|---|---|---|---|---|---|---|---|---|---|---|---|---|---|---|---|---|---|---|
| Yanchi Region | Guyuan Region | ||||||||||||||||||||||
| 1 | 38.0233 | 0 | 0 | 0 | 5 | 0 | 4 | 46 | 36.242222 | 0 | 0 | 0 | 5 | 4 | 4 | 91 | 36.430833 | 0 | 0 | 1 | 5 | 0 | 0 |
| 2 | 38.021667 | 0 | 0 | 0 | 5 | 0 | 4 | 47 | 36.210000 | 0 | 0 | 1 | 5 | 4 | 4 | 92 | 36.419444 | 0 | 0 | 0 | 5 | 0 | 0 |
| 3 | 38.019722 | 0 | 0 | 0 | 5 | 0 | 4 | 48 | 36.209167 | 0 | 0 | 0 | 5 | 4 | 4 | 93 | 36.419722 | 0 | 0 | 0 | 5 | 0 | 0 |
| 4 | 38.021111 | 0 | 0 | 0 | 5 | 0 | 4 | 49 | 36.208611 | 0 | 0 | 0 | 5 | 4 | 4 | 94 | 36.420278 | 0 | 0 | 0 | 5 | 0 | 0 |
| 5 | 38.022778 | 0 | 0 | 0 | 5 | 0 | 4 | 50 | 36.207222 | 0 | 0 | 1 | 5 | 4 | 4 | 95 | 36.420833 | 0 | 0 | 0 | 5 | 0 | 0 |
| 6 | 38.024444 | 0 | 0 | 0 | 5 | 0 | 4 | 51 | 36.205278 | 0 | 0 | 0 | 5 | 4 | 4 | 96 | 36.420833 | 0 | 0 | 1 | 5 | 0 | 0 |
| 7 | 38.022778 | 0 | 0 | 0 | 5 | 0 | 4 | 52 | 36.2075 | 0 | 0 | 0 | 5 | 4 | 4 | 97 | 36.419444 | 0 | 0 | 0 | 5 | 0 | 0 |
| 8 | 38.020833 | 0 | 0 | 0 | 5 | 0 | 4 | 53 | 36.206111 | 0 | 0 | 0 | 5 | 4 | 4 | 98 | 36.419444 | 0 | 0 | 0 | 5 | 0 | 0 |
| 9 | 38.022222 | 0 | 0 | 0 | 5 | 0 | 4 | 54 | 36.204722 | 0 | 0 | 0 | 5 | 4 | 4 | 99 | 36.418889 | 0 | 0 | 0 | 5 | 0 | 0 |
| 10 | 38.024167 | 0 | 0 | 0 | 5 | 0 | 4 | 55 | 36.204167 | 0 | 0 | 0 | 5 | 4 | 4 | 100 | 36.420833 | 0 | 0 | 0 | 5 | 0 | 0 |
| 11 | 38.025833 | 0 | 0 | 0 | 5 | 0 | 4 | 56 | 36.2025 | 0 | 0 | 0 | 5 | 4 | 4 | 101 | 36.420556 | 0 | 0 | 0 | 5 | 0 | 0 |
| 12 | 38.024167 | 0 | 0 | 0 | 5 | 0 | 4 | 57 | 36.203056 | 0 | 0 | 0 | 5 | 4 | 4 | 102 | 36.418056 | 0 | 0 | 1 | 5 | 0 | 0 |
| 13 | 38.022222 | 0 | 0 | 0 | 5 | 0 | 4 | 58 | 36.201389 | 0 | 0 | 0 | 5 | 4 | 4 | 103 | 36.418056 | 0 | 0 | 0 | 5 | 0 | 0 |
| 14 | 38.023889 | 0 | 0 | 0 | 5 | 0 | 4 | 59 | 36.201667 | 0 | 0 | 0 | 5 | 4 | 4 | 104 | 36.420000 | 0 | 0 | 0 | 5 | 0 | 0 |
| 15 | 38.025278 | 0 | 0 | 0 | 5 | 0 | 4 | 60 | 36.200556 | 0 | 0 | 0 | 5 | 4 | 4 | 105 | 36.419444 | 0 | 0 | 0 | 5 | 0 | 0 |
| 16 | 38.025918 | 0 | 0 | 0 | 0 | 4 | 4 | 61 | 36.200000 | 0 | 0 | 0 | 5 | 4 | 4 | 106 | 36.418611 | 0 | 0 | 0 | 5 | 0 | 0 |
| 17 | 38.024109 | 0 | 0 | 0 | 0 | 4 | 4 | 62 | 36.251944 | 0 | 0 | 0 | 5 | 4 | 4 | 107 | 36.271611 | 0 | 0 | 0 | 5 | 0 | 0 |
| 18 | 38.014326 | 0 | 0 | 0 | 0 | 4 | 4 | 63 | 36.251667 | 0 | 0 | 0 | 5 | 4 | 4 | 108 | 36.261023 | 0 | 0 | 1 | 0 | 4 | 4 |
| 19 | 38.008726 | 0 | 0 | 0 | 0 | 4 | 4 | 64 | 36.250556 | 0 | 0 | 1 | 5 | 4 | 4 | 109 | 36.251991 | 0 | 0 | 0 | 0 | 4 | 4 |
| 20 | 38.003333 | 0 | 0 | 0 | 0 | 4 | 4 | 65 | 36.251944 | 0 | 0 | 0 | 5 | 4 | 4 | 110 | 36.242936 | 0 | 0 | 1 | 0 | 4 | 4 |
| 21 | 38.008149 | 0 | 0 | 0 | 0 | 4 | 4 | 66 | 36.252778 | 0 | 0 | 0 | 5 | 4 | 4 | 111 | 36.231224 | 0 | 0 | 1 | 0 | 4 | 4 |
| 22 | 37.996558 | 0 | 0 | 0 | 0 | 4 | 4 | 67 | 36.253056 | 0 | 0 | 0 | 5 | 4 | 4 | 112 | 36.263662 | 0 | 0 | 0 | 0 | 4 | 4 |
| 23 | 37.979796 | 0 | 0 | 0 | 0 | 4 | 4 | 68 | 36.254444 | 0 | 0 | 0 | 5 | 0 | 0 | 113 | 36.25482 | 0 | 0 | 0 | 0 | 4 | 4 |
| 24 | 37.987471 | 0 | 0 | 0 | 0 | 4 | 4 | 69 | 36.255833 | 0 | 0 | 0 | 5 | 0 | 0 | 114 | 36.245969 | 0 | 0 | 0 | 0 | 4 | 4 |
| 25 | 37.978304 | 0 | 0 | 0 | 0 | 4 | 4 | 70 | 36.253889 | 0 | 0 | 0 | 5 | 0 | 0 | 115 | 36.233981 | 0 | 0 | 3 | 0 | 4 | 4 |
| 26 | 37.890833 | 8 | 6 | 0 | 0 | 0 | 0 | 71 | 36.255556 | 0 | 0 | 0 | 5 | 0 | 0 | 116 | 36.242716 | 0 | 0 | 0 | 0 | 4 | 4 |
| 27 | 37.819722 | 8 | 6 | 0 | 0 | 0 | 1 | 72 | 36.257222 | 0 | 0 | 0 | 5 | 0 | 0 | 117 | 36.224906 | 0 | 0 | 0 | 0 | 4 | 4 |
| 28 | 37.796111 | 8 | 6 | 0 | 0 | 0 | 0 | 73 | 36.259444 | 0 | 0 | 0 | 5 | 0 | 0 | 118 | 36.217012 | 0 | 0 | 0 | 0 | 4 | 4 |
| 29 | 37.992778 | 8 | 6 | 0 | 0 | 0 | 1 | 74 | 36.257222 | 0 | 0 | 0 | 5 | 0 | 0 | 119 | 36.201447 | 0 | 0 | 0 | 0 | 4 | 4 |
| 30 | 37.961111 | 8 | 6 | 0 | 0 | 0 | 1 | 75 | 36.258889 | 0 | 0 | 0 | 5 | 0 | 0 | 120 | 36.203179 | 0 | 0 | 0 | 0 | 4 | 4 |
| 31 | 37.844444 | 8 | 6 | 0 | 0 | 0 | 1 | 76 | 36.260278 | 0 | 0 | 0 | 5 | 0 | 0 | 121 | 36.429613 | 0 | 0 | 0 | 0 | 4 | 4 |
| Guyuan region | |||||||||||||||||||||||
| 32 | 36.251667 | 0 | 0 | 0 | 5 | 0 | 0 | 77 | 36.441111 | 0 | 0 | 0 | 5 | 0 | 0 | 122 | 36.438564 | 0 | 0 | 0 | 0 | 4 | 4 |
| 33 | 36.250556 | 0 | 0 | 0 | 5 | 0 | 0 | 78 | 36.44 | 0 | 0 | 0 | 5 | 0 | 0 | 123 | 36.444252 | 0 | 0 | 2 | 0 | 4 | 4 |
| 34 | 36.250278 | 0 | 0 | 0 | 5 | 0 | 0 | 79 | 36.436944 | 0 | 0 | 2 | 5 | 0 | 0 | 124 | 36.4505 | 0 | 0 | 0 | 0 | 4 | 4 |
| 35 | 36.248889 | 0 | 0 | 0 | 5 | 0 | 0 | 80 | 36.435833 | 0 | 0 | 0 | 5 | 0 | 0 | 125 | 36.444761 | 0 | 0 | 0 | 0 | 4 | 4 |
| 36 | 36.256111 | 0 | 0 | 0 | 5 | 0 | 0 | 81 | 36.435278 | 0 | 0 | 0 | 5 | 0 | 0 | 126 | 36.413512 | 0 | 0 | 0 | 0 | 4 | 4 |
| 37 | 36.255556 | 0 | 0 | 0 | 5 | 0 | 0 | 82 | 36.438889 | 0 | 0 | 0 | 5 | 0 | 0 | 127 | 36.417967 | 0 | 0 | 0 | 0 | 4 | 4 |
| 38 | 36.252222 | 0 | 0 | 0 | 5 | 0 | 0 | 83 | 36.436944 | 0 | 0 | 0 | 5 | 0 | 0 | 128 | 36.41978 | 0 | 0 | 0 | 0 | 4 | 4 |
| 39 | 36.250556 | 0 | 0 | 1 | 5 | 0 | 0 | 84 | 36.435000 | 0 | 0 | 0 | 5 | 0 | 0 | 129 | 36.415722 | 0 | 0 | 0 | 0 | 4 | 4 |
| 40 | 36.248889 | 0 | 0 | 0 | 5 | 0 | 0 | 85 | 36.433889 | 0 | 0 | 0 | 5 | 0 | 0 | 130 | 36.406674 | 0 | 0 | 0 | 0 | 4 | 4 |
| 41 | 36.240833 | 0 | 0 | 0 | 5 | 0 | 0 | 86 | 36.432778 | 0 | 0 | 2 | 5 | 0 | 0 | 131 | 36.260947 | 0 | 0 | 9 | 4 | 0 | 0 |
| 42 | 36.25 | 0 | 0 | 0 | 5 | 0 | 0 | 87 | 36.433056 | 0 | 0 | 0 | 5 | 0 | 0 | 132 | 36.267219 | 0 | 0 | 9 | 4 | 0 | 0 |
| 43 | 36.250278 | 0 | 0 | 0 | 5 | 0 | 0 | 88 | 36.431389 | 0 | 0 | 0 | 5 | 0 | 0 | 133 | 36.268022 | 0 | 0 | 9 | 4 | 0 | 0 |
| 44 | 36.249444 | 0 | 0 | 1 | 5 | 0 | 0 | 89 | 36.432222 | 0 | 0 | 0 | 5 | 0 | 0 | 134 | 36.201883 | 0 | 0 | 9 | 4 | 0 | 0 |
| 45 | 36.246944 | 0 | 0 | 0 | 5 | 0 | 0 | 90 | 36.431111 | 0 | 0 | 1 | 5 | 0 | 0 | 135 | 36.184792 | 0 | 0 | 9 | 4 | 0 | 0 |
| Species | Species Abbreviation | Trophic Level | 2008 | 2009 | 2013 | 2017 | 2018 | 2019 | Region |
|---|---|---|---|---|---|---|---|---|---|
| Individuals | |||||||||
| Amara dux | Amar.dux | herbivores | 112 | 9 | 3 | 67 | 17 | 15 | YC, GY |
| Amara harpaloides | Amar.har | herbivores | 0 | 0 | 0 | 11 | 5 | 12 | YC, GY |
| Amara helva | Amar.hel | herbivores | 0 | 0 | 0 | 9 | 40 | 4 | YC, GY |
| Amara sp | Amar.sp | herbivores | 0 | 0 | 0 | 15 | 16 | 0 | YC, GY |
| Broscus kozlovi | Bros.koz | predators | 0 | 0 | 10 | 8 | 3 | 4 | GY |
| Carabus anchocephalus | Cara.anc | predators | 0 | 0 | 0 | 85 | 21 | 0 | GY |
| Carabus brandti | Cara.bra | predators | 0 | 0 | 23 | 0 | 9 | 20 | YC |
| Carabus crassesculptus | Cara.cra | predators | 0 | 0 | 0 | 285 | 198 | 88 | GY |
| Carabus modestulus | Cara.mod | predators | 0 | 0 | 0 | 84 | 88 | 7 | GY |
| Carabus glyptoterus | Cara.gly | predators | 0 | 0 | 2055 | 868 | 177 | 130 | YC, GY |
| Carabus gigoloides | Cara.gig | predators | 0 | 0 | 0 | 168 | 329 | 192 | GY |
| Carabus sculptipennis | Cara.scu | predators | 0 | 0 | 0 | 377 | 73 | 62 | GY |
| Carabus vladimirskyi | Cara.vla | predators | 0 | 0 | 2318 | 1742 | 316 | 470 | GY |
| Callsoma anthrax | Call.ant | predators | 0 | 0 | 0 | 41 | 7 | 11 | GY |
| Calosoma chinense | Calo.chi | predators | 0 | 0 | 1 | 3 | 0 | 0 | GY |
| Calosoma lugens | Calo.lug | predators | 0 | 0 | 3 | 11 | 0 | 3 | YC, GY |
| Cymindis daimio | Cymi.dai | predators | 5 | 2 | 0 | 0 | 2 | 1 | YC, GY |
| Corsyra fusula | Cors.fus | herbivores | 20 | 51 | 0 | 3 | 4 | 3 | YC |
| Cymindis binotata | Cymi.bin | predators | 109 | 44 | 0 | 19 | 9 | 12 | YC, GY |
| Dolichus halensis | Doli.hal | predators | 62 | 62 | 235 | 3 | 0 | 0 | YC |
| Harpalus amplicollis | Harp.amp | predators | 6 | 5 | 0 | 0 | 0 | 0 | YC |
| Harpalus calceatus | Harp.cal | predators | 3 | 50 | 0 | 0 | 0 | 0 | YC |
| Harpalus crates | Harp.cra | predators | 26 | 12 | 0 | 0 | 0 | 0 | YC |
| Harpalus lumbaris | Harp.lum | herbivores | 0 | 0 | 0 | 11 | 3 | 1 | YC |
| Harpalus pallidipennis | Harp.pal | predators | 76 | 64 | 4 | 0 | 0 | 0 | YC |
| Harpalus salinus | Harp.sal | predators | 152 | 210 | 0 | 0 | 0 | 0 | YC |
| Poecilus gebleri | Poec.geb | predators | 383 | 436 | 0 | 947 | 158 | 26 | YC, GY |
| Pseudotaphoxenus brevipennis | Pseu.bre | predators | 160 | 106 | 24 | 0 | 0 | 0 | YC, GY |
| Pseudotaphoxenus rugipennis | Pseu.rug | predators | 0 | 0 | 0 | 301 | 62 | 39 | YC, GY |
| Pseudotaphoxenus mongolicus | Pseu.mon | predators | 539 | 260 | 86 | 77 | 14 | 32 | YC, GY |
| Poecilus fortipes | Poec.for | herbivores | 0 | 0 | 0 | 543 | 53 | 82 | GY |
| Reflexisphodrus reflexipennis | Refl.ref | predators | 0 | 0 | 0 | 368 | 78 | 20 | GY |
| Scarites terricola | Scar.ter | herbivores | 5 | 8 | 0 | 0 | 0 | 0 | YC |
| Zabrus potanini | Zabr.pot | herbivores | 0 | 0 | 0 | 116 | 8 | 9 | GY |
| Term | Environmental Factor | F | Sign | Adjusted Fit Factor (R2) | Generalized Cross Validation (GCV) | Deviance Explained (%) |
|---|---|---|---|---|---|---|
| Species richness | P + SM + Year | 88.16 | *** | 0.579 | 0.11 | 60.1% |
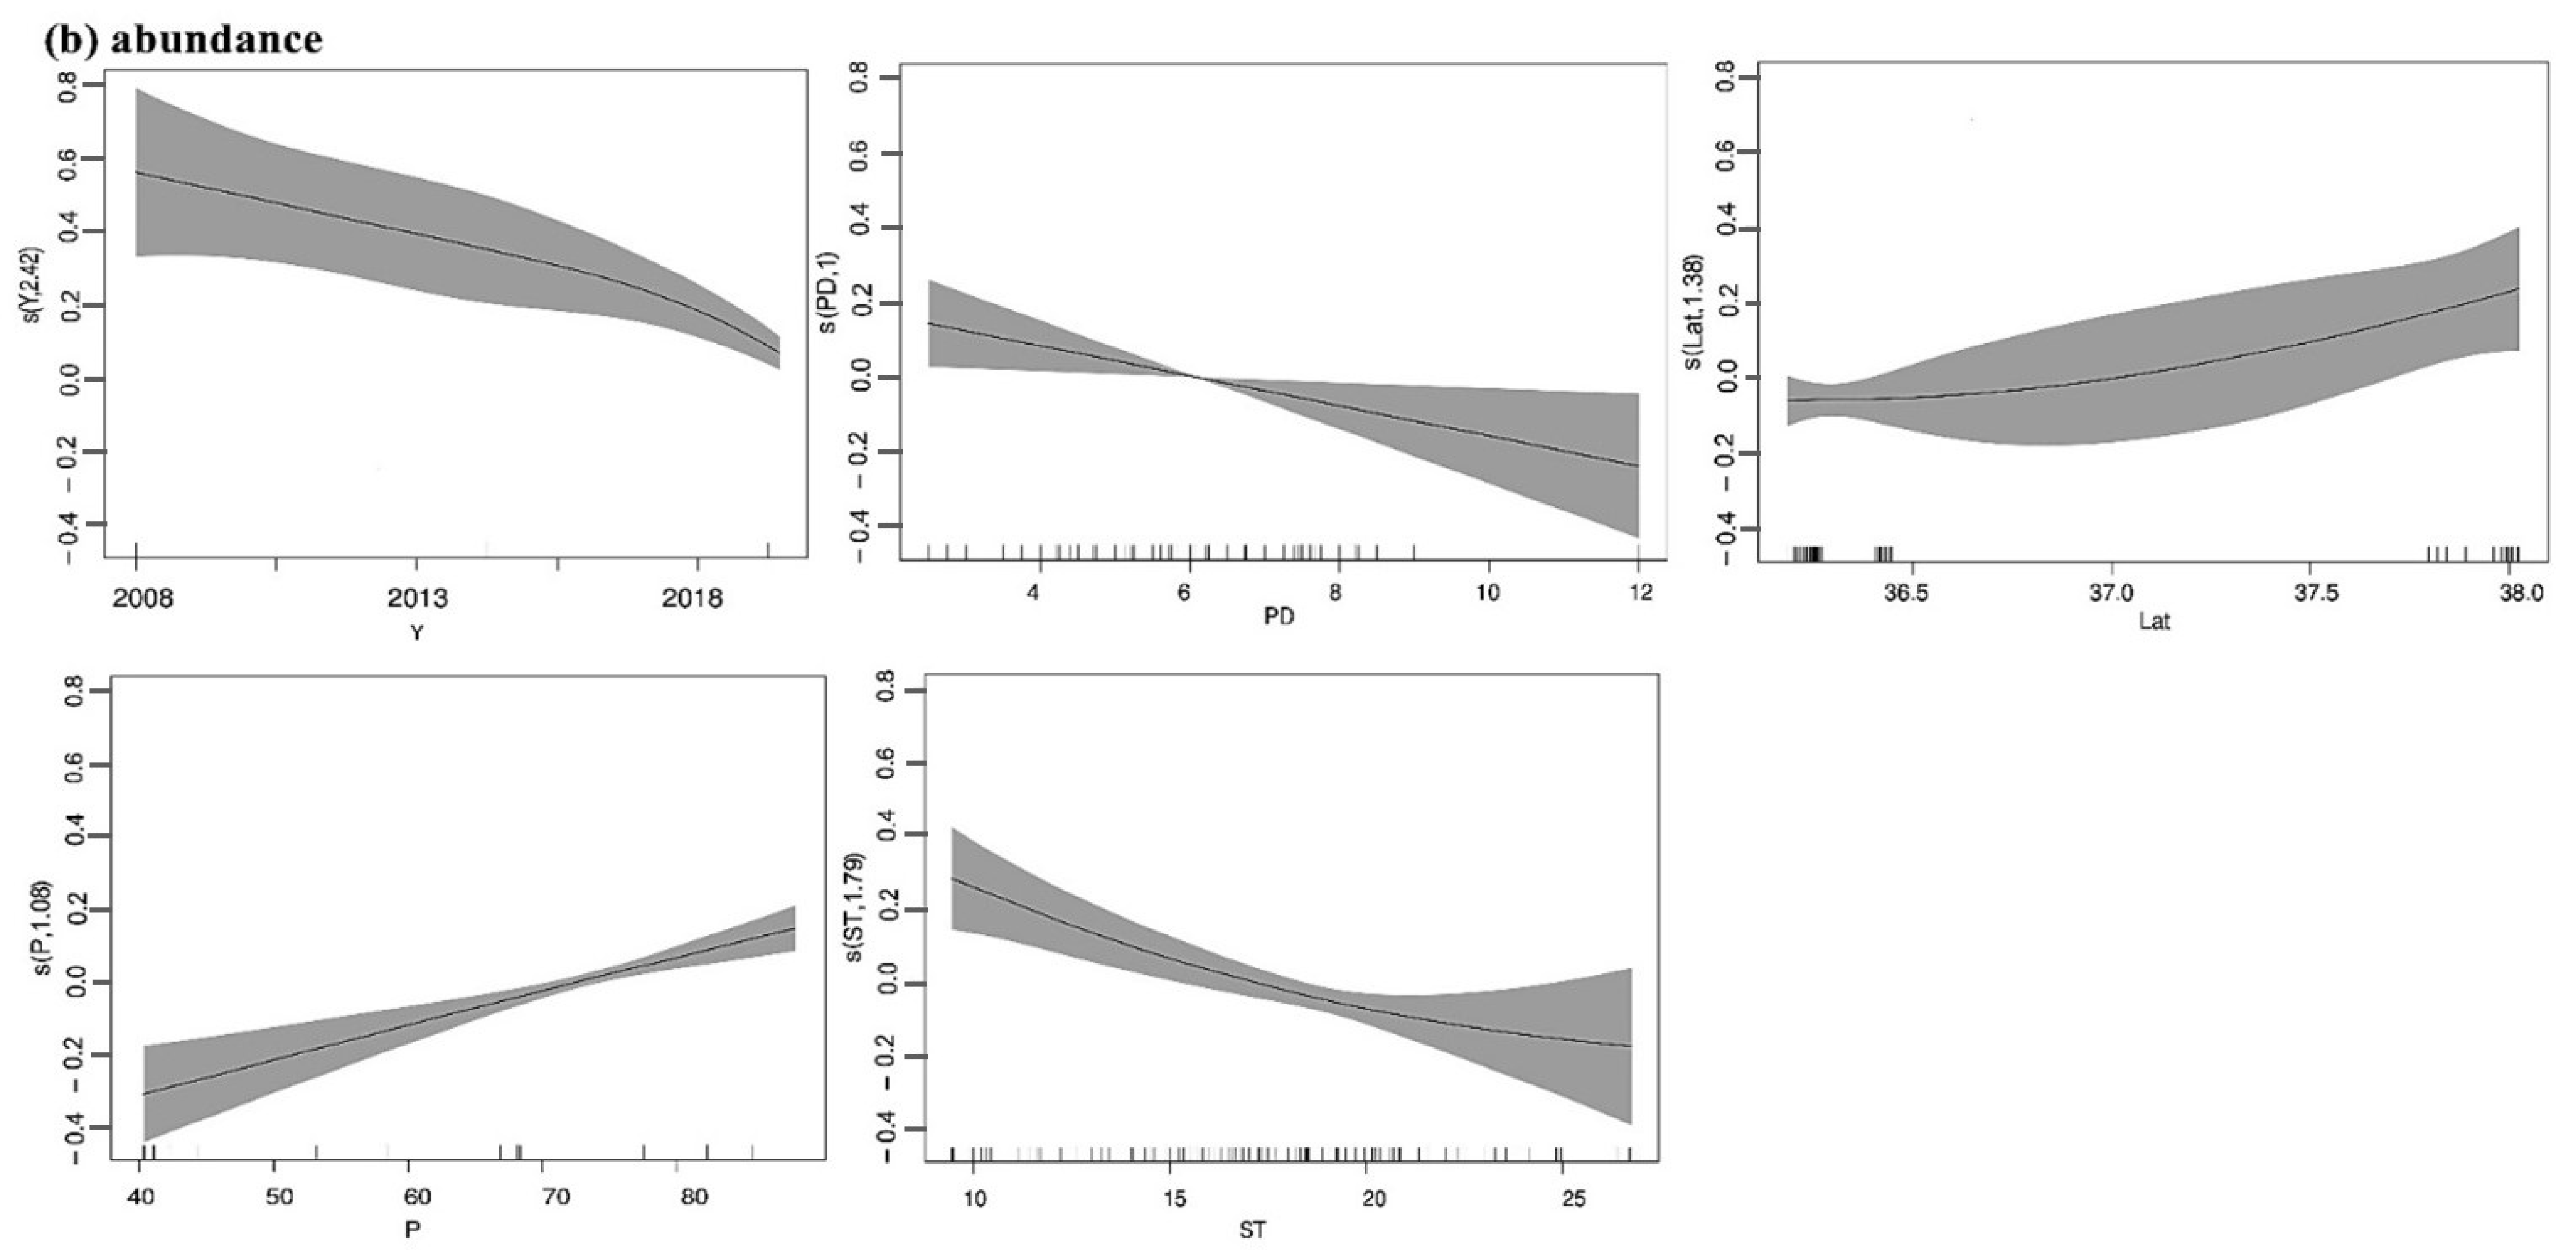
| Abundance | Year + P + Lat + PD + ST | 64.55 | *** | 0.506 | 0.31 | 71.9% |
| Item | CCA1 | CCA2 | CCA3 | CCA4 |
|---|---|---|---|---|
| Eigenvalue | 0.6088 | 0.4060 | 0.2652 | 0.1310 |
| Explained variation | 31.9 | 57.75 | 71.64 | 85.50 |
| Explained fitted variation | 39.41 | 65.70 | 82.87 | 91.35 |
References
- Hallmann, C.A.; Sorg, M.; Jongejans, E.; Jongejans, E.; Siepel, H.; Hofland, N.; Schwan, H.; Stenmans, W.; Müller, A.; Sumser, H.; et al. More than 75 percent decline over 27 years in total flying insect biomass in protected areas. PLoS ONE 2017, 12, e0185809. [Google Scholar] [CrossRef] [Green Version]
- Öckinger, E.; Smith, H.G. Semi-natural grasslands as population sources for pollinating insects in agricultural landscapes. J. Appl. Ecol. 2007, 44, 50–59. [Google Scholar] [CrossRef]
- Ollerton, J.; Winfree, R.; Tarrant, S. How many flowering plants are pollinated by animals? Oikos 2011, 120, 321–326. [Google Scholar] [CrossRef]
- Yang, L.H.; Gratton, C. Insects as drivers of ecosystem processes. Curr. Opin. Insect Sci. 2014, 2, 26–32. [Google Scholar] [CrossRef]
- Powney, G.D.; Carvell, C.; Edwards, M.; Morris, R.K.A.; Roy, H.E.; Woodcock, B.A.; Isaac, N.J.B. Widespread losses of pollinating insects in Britain. Nat. Commun. 2019, 10, 1018. [Google Scholar] [CrossRef]
- Gallai, N.; Salles, J.M.; Settele, J.; Vaissiere, B.E. Economic valuation of the vulnerability of world agriculture confronted with pollinator decline. Ecol. Econ. 2009, 68, 810–821. [Google Scholar] [CrossRef]
- Macgregor, C.J.; Williams, J.H.; Bell, J.R.; Thomas, C.D. Moth biomass increases and decreases over 50 years in Britain. Nat. Ecol. Evol. 2019, 3, 1645–1649. [Google Scholar] [CrossRef]
- Ollerton, J.; Erenler, H.; Edwards, M.; Crockett, R. Extinctions of aculeate pollinators in Britain and the role of large-scale agricultural changes. Science 2014, 346, 1360–1362. [Google Scholar] [CrossRef] [Green Version]
- Aizen, M.A.; Garibaldi, L.A.; Cunningham, S.A.; Klein, A.M. How much does agriculture depend on pollinators? Lessons from long-term trends in crop production. Ann. Bot. 2009, 9, 1579–1588. [Google Scholar] [CrossRef]
- Losey, J.E.; Vaughan, M. The economic value of ecological services provided by insects. Bioscience 2006, 56, 311–323. [Google Scholar] [CrossRef] [Green Version]
- Lister, B.C.; Garcia, A. Climate-driven declines in arthropod abundance restructure a rainforest food web. Proc. Natl. Acad. Sci. USA 2018, 115, E10397–E10406. [Google Scholar] [CrossRef] [Green Version]
- Leather, S.R. “Ecological Armageddon”—More evidence for the drastic decline in insect numbers. Ann. Appl. Biol. 2018, 172, 1–3. [Google Scholar] [CrossRef] [Green Version]
- Brooks, D.R.; Bater, J.E.; Clark, S.J.; Monteith, D.T.; Andrews, C.; Corbett, S.J.; Beaumont, D.A.; Chapman, J.W. Large carabid beetle declines in a United Kingdom monitoring network increases evidence for a widespread loss in insect biodiversity. J. Appl. Ecol. 2012, 49, 1009–1019. [Google Scholar] [CrossRef]
- Cardinale, B.; Emmett Duffy, J.; Gonzalez, A.; Hooper, D.; Perrings, C.; Venail, P.; Narwani, A.; Mace, G.; Tilman, D.; A Wardle, D. Biodiversity loss and its impact on humanity. Nature 2012, 486, 59–67. [Google Scholar] [CrossRef] [PubMed]
- Oliver, T.H.; Isaac, N.J.B.; August, T.A.; Woodcock, B.A.; Roy, D.B.; Bullock, J.M. Declining resilience of ecosystem functions under biodiversity loss. Nat. Commun. 2015, 6, 10122. [Google Scholar] [CrossRef] [Green Version]
- Maes, D.; Dyck, H.V. Butterfly diversity loss in Flanders (north Belgium): Europe’s worst case scenario? Biol. Conserv. 2001, 99, 263–276. [Google Scholar] [CrossRef]
- Ashton, L.A.; Griffiths, H.M.; Parr, C.L.; Evans, T.A.; Didham, R.K.; Hasan, F.; Teh, Y.A.; Tin, H.S.; Vairappan, C.S.; Eggleton, P. Termites mitigate the effects of drought in tropical rainforest. Science 2019, 363, 174–177. [Google Scholar] [CrossRef] [Green Version]
- Habel, J.C.; Samways, M.J.; Schmitt, T. Mitigating the precipitous decline of terrestrial European insects: Requirements for a new strategy. Biodivers. Conserv. 2019, 28, 1343–1360. [Google Scholar] [CrossRef]
- Wagner, D.L. Insect declines in the Anthropocene. Annu. Rev. Entomol. 2020, 65, 457–480. [Google Scholar] [CrossRef] [Green Version]
- Seibold, S.; Gossner, M.M.; Simons, N.K.; Blüthgen, N.; Müller, J.; Ambarl, D.; Ammer, C.; Bauhus, J.; Fischer, M.; Habel, J.C. Arthropod decline in grasslands and forests is associated with landscape-level drivers. Nature 2019, 574, 671–674. [Google Scholar] [CrossRef]
- Desquilbet, M.; Gaume, L.; Grippa, M.; Cereghino, R.; Goulson, D. Comment on “Meta-analysis reveals declines in terrestrial but increases in freshwater insect abundances”. Science 2020, 370, 417–420. [Google Scholar] [CrossRef]
- Nemesio, A. Are orchid bees at risk? First comparative survey suggests declining opulations of forest-dependent species. Braz. J. Biol. 2013, 73, 367–374. [Google Scholar] [CrossRef] [Green Version]
- Welti, E.A.; Roeder, K.A.; de Beurs, K.M.; Joern, A.; Kaspari, M. Nutrient dilution and climate cycles underlie declines in a dominant insect herbivore. Proc. Nat. Acad. Sci. USA 2020, 117, 7271–7275. [Google Scholar] [CrossRef]
- Walpole, M.; Almond, R.E.A.; Besancon, C.; Butchard, S.H.M.; Campbell-Lendrum, D.; Carr, G.M.; Collen, B.; Collette, L.; Davidson, N.C.; Dulloo, E.; et al. Tracking progress toward the 2010 biodiversity target and beyond. Science 2009, 325, 1503–1504. [Google Scholar] [CrossRef]
- Tsafack, N.; Rebaudo, F.; Wang, H.; Nagy, D.D.; Xie, Y.Z.; Wang, X.P.; Fattorini, S. Carabid community structure in northern China grassland ecosystems: Effects of local habitat on species richness, species composition and functional diversity. PeerJ 2019, 6, e2197. [Google Scholar] [CrossRef] [PubMed]
- Arya, M.K.; Dayakrishna; Verma, A. Patterns in distribution of butterfly assemblages at different habitats of Corbett Tiger Reserve, Northern India. Trop. Ecol. 2020, 61, 1–7. [Google Scholar] [CrossRef]
- Butchart, S.H.M. Global biodiversity: Indicators of recent declines. Science 2010, 328, 1164–1168. [Google Scholar] [CrossRef] [PubMed]
- Kotze, D.J.; Brandmayr, P.; Casale, A.; Dauffy-richard, E.; Dekoninck, W.; Koivula, M.J.; Lövei, G.L.; Mossakowski, D.; Noordijk, J.; Paarmann, W.; et al. Forty years of carabid beetle research in Europe—From taxonomy, biology, ecology and population studies to bioindication, habitat assessment and conservation. ZooKeys 2011, 100, 55–148. [Google Scholar] [CrossRef] [PubMed]
- Thiele, H.-U. Carabid Beetles in Their Environments; Springer: Berlin, Germany, 1977. [Google Scholar]
- Pozsgai, G.; Baird, J.; Littlewood, N.; Pakeman, R. Phenological changes of the most commonly sampled ground beetle (Coleoptera: Carabidae) species in the UK environmental change network. Int. J. Biometeorol. 2018, 62, 1063–1074. [Google Scholar] [CrossRef] [PubMed]
- Thomas, J.A. Why small cold-blooded insects pose different conservation problems to birds in modern landscapes. Ibis 1994, 137, 112–119. [Google Scholar] [CrossRef]
- Lovei, G.L.; Sunderland, K.D. The ecology and behavior of ground beetles. Annu. Rev. Entomol. 1996, 41, 231–256. [Google Scholar] [CrossRef] [PubMed]
- Mazancourt, C.D.; Isbell, F.; Larocque, A.; Berendse, F.; Luca, E.D.; Grace, J.B.; Haegeman, B.; Polley, H.W.; Roscher, C.; Schmid, B. Predicting ecosystem stability from community composition and biodiversity. Ecol. Lett. 2013, 16, 617–625. [Google Scholar] [CrossRef] [Green Version]
- Glendining, M.J.; Dailey, A.G.; Williams, A.G.; Evert, F.K.V.; Goulding, K.W.T.; Whitmore, A.P. Is it possible to increase the sustainability of arable and ruminant agriculture by reducing inputs? Agric. Syst. 2009, 99, 117–125. [Google Scholar] [CrossRef] [Green Version]
- Wilson, R.J.; Fox, R. Insect responses to global change offer signposts for biodiversity and conservation. Ecol. Entomol. 2020, 46, 699–717. [Google Scholar] [CrossRef]
- Paul, K.; Nicolas, F.; David, A.W. Long-term effects of species loss on community properties across contrasting ecosystems. Nature 2018, 557, 710–713. [Google Scholar]
- Kehoe, R.; Frago, E.; Sanders, D. Cascading extinctions as a hidden driver of insect decline. Ecol. Entomol. 2021, 46, 743–756. [Google Scholar] [CrossRef]
- Tilman, D.; Reich, P.B.; Knops, J. Biodiversity and ecosystem stability in a decade-long grassland experiment. Nature 2006, 441, 629–632. [Google Scholar] [CrossRef]
- Reich, P.B.; Tilman, D.; Isbell, F.; Mueller, K.; Hobbie, S.E.; Flynn, D.; Eisenhauer, N. Impacts of biodiversity loss escalate through time as redundancy fades. Science 2012, 336, 589–592. [Google Scholar] [CrossRef] [Green Version]
- Guerrero-Ramirez, N.R.; Craven, D.; Reich, P.B.; Ewel, J.J.; Isbell, F.; Koricheva, J.; Parrotta, J.A.; Auge, H.; Erickson, H.E.; Forrester, D.I.; et al. Diversity-dependent temporal divergence of ecosystem functioning in experimental ecosystems. Nat. Ecol. Evol. 2017, 1, 1639–1642. [Google Scholar] [CrossRef] [PubMed]
- Parmesan, C.; Yohe, G.A. Globally coherent fingerprint of climate change impacts across natural systems. Nature 2003, 421, 37–42. [Google Scholar] [CrossRef]
- Hooper, D.U.; Adair, E.C.; Cardinale, B.J.; Byrnes, J.; Hungate, B.A.; Matulich, K.L.; Gonzalez, A.; Duffy, J.E.; Gamfeldt, L.; Connor, M.O. A global synthesis reveals biodiversity loss as a major driver of ecosystem change. Nature 2012, 486, 105–108. [Google Scholar] [CrossRef] [PubMed]
- Strebel, G.; Jacot, A.; Horch, P.; Spaar, R.; Fletcher, R. Effects of grassland intensification on whinchats Saxicola rubetra and implications for conservation in upland habitats. Ibis 2015, 157, 250–259. [Google Scholar] [CrossRef]
- Lu, Y.H.; Fu, B.J.; Wei, W.; Yu, X.B.; Sun, R.H. Major ecosystems in China: Dynamics and challenges for sustainable management. Environ. Manag. 2011, 48, 13–27. [Google Scholar] [CrossRef] [PubMed]
- Wei, S.H.; Huang, W.G.; Zhu, M.M.; Gao, L.Y.; Zhao, Z.H. The asymmetric responses of carabid beetles to steppe fragmentation in Northwest China. Glob. Ecol. Conserv. 2020, 23, e01058. [Google Scholar] [CrossRef]
- Tsafack, N.; Xie, Y.Z.; Wang, X.P.; Fattorini, S. Influence of climate and local habitat characteristics on carabid beetle abundance and diversity in northern Chinese steppes. Insects 2020, 11, 19. [Google Scholar] [CrossRef] [PubMed] [Green Version]
- Tsafack, N.; Fattorini, S.; Benavides Frias, C.; Xie, Y.Z.; Wang, X.P.; Rebaudo, F. Competing vegetation structure indices for estimating spatial constrains in carabid abundance patterns in Chinese grasslands reveal complex scale and habitat patterns. Insects 2020, 11, 249. [Google Scholar] [CrossRef]
- Kang, L.; Han, X.; Zhang, Z.; Sun, O.J. Grassland ecosystems in China: Review of current knowledge and research advancement. Philos. Trans. R. Soc. Lond. 2007, 362, 997–1008. [Google Scholar] [CrossRef]
- Liu, X.Q.; Wang, H.; He, D.H.; Wang, X.P.; Bai, M. The modeling and forecasting of carabid beetle distribution in northwestern China. Insects 2021, 12, 168. [Google Scholar] [CrossRef] [PubMed]
- Roswell, M.; Dushoff, J.; Winfree, R. A conceptual guide to measuring species diversity. Oikos 2021, 130, 321–338. [Google Scholar] [CrossRef]
- Hsieh, T.C.; Ma, K.H.; Chao, A. iNEXT: An R package for rarefaction and extrapolation of species diversity (Hill numbers). Methods. Ecol. Evol. 2016, 7, 1451–1456. [Google Scholar]
- Lehmann, A.; Overton, J.M.; Leathwick, J.R. GRASP: Generalized regression analysis and spatial prediction. Ecol. Model. 2002, 160, 165–183. [Google Scholar] [CrossRef]
- Guisan, A.; Edwards, T.C.; Hastie, T. Generalized linear and generalized additive models in studies of species distributions: Setting the scene. Ecol. Model. 2002, 157, 89–100. [Google Scholar] [CrossRef] [Green Version]
- Hastie, T.; Tibshirani, R. Generalized Additive Models. Stat. Sci. 1986, 1, 297–310. [Google Scholar] [CrossRef]
- Colwell, R.K.; Gotelli, N.J.; Ashton, L.A.; Beck, J.; Brehm, G.; Fayle, T.M.; Fiedler, K.; Forister, M.L.; Kessler, M.; Kitching, R.L. Midpoint attractors and species richness: Modelling the interaction between environmental drivers and geometric constraints. Ecol. Lett. 2016, 19, 1009–1022. [Google Scholar] [CrossRef] [Green Version]
- Griffin, J.N.; Byrnes, J.E.K.; Cardinale, B.J. Effects of predator richness on prey suppression: A meta-analysis. Ecology 2013, 94, 2180–2187. [Google Scholar] [CrossRef]
- van Strien, A.J.; van Swaay, C.A.M.; van Strien-van Liempt, W.T.F.H.; Poot, M.J.M.; WallisDeVries, M.F. Over a century of data reveal more than 80% decline in butterflies in the netherlands. Biol. Conserv. 2019, 234, 116–122. [Google Scholar] [CrossRef]
- Homburg, K.; Drees, C.; Boutaud, E.; Nolte, D.; Schuett, W.; Zumstein, P.; Von Ruschkowski, E.; Assmann, T. Where have all the beetles gone? Long—Term study reveals carabid species decline in a nature reserve in northern Germany. Insect Conserv. Diver. 2019, 12, 268–277. [Google Scholar] [CrossRef] [Green Version]
- Conrad, K.F.; Warren, M.S.; Fox, R.; Parsons, M.S.; Woiwod, I.P. Rapid declines of common, widespread British moths provide evidence of an insect biodiversity crisis. Biol. Conserv. 2006, 132, 279–291. [Google Scholar] [CrossRef]
- Magurran, A.E.; Baillie, S.R.; Buckland, S.T.; Dick, J.M.; Elston, D.A.; Scott, E.M.; Smith, R.I.; Somerfield, P.J.; Watt, A.D. Long-term datasets in biodiversity research and monitoring: Assessing change in ecological communities through time. Trends Ecol. Evol. 2010, 25, 574–582. [Google Scholar] [CrossRef]
- IPCC. The Third Climate Change Assessment in China; Science Press: Beijing, China, 2015. [Google Scholar]
- Rossolimo, T. Temperature adaptations of Siberian Pterostichus species (Coleoptera: Carabidae). Eur. J. Entomol. 1997, 94, 235–242. [Google Scholar]
- Saska, P.; Martinkova, Z.; Honek, A. Temperature and rate of seed consumption by ground beetles (Carabidae). Biol. Control 2010, 52, 91–95. [Google Scholar] [CrossRef]
- Winkler, M.; Illmer, P.; Querner, P.; Fischer, B.M.; Hofmann, K.; Lamprecht, A.; Praeg, N.; Schied, J.; Steinbauer, K.; Pauli, H. Side by side? Vascular plant, invertebrate, and microorganism distribution patterns along an alpine to nival elevation gradient. Arct. Antarct. Alp. Res. 2018, 50, e1475951. [Google Scholar] [CrossRef] [Green Version]
- Thomas, C.D.; Bodsworth, E.J.; Wilson, R.J.; Simmons, A.D.; Conradt, L. Ecological and evolutionary processes at expanding range margins. Nature 2001, 411, 577–581. [Google Scholar] [CrossRef]
- Death, R.G.; Zimmermann, E.M. Interaction between disturbance and primary productivity in determining stream invertebrate diversity. Oikos 2005, 111, 392–402. [Google Scholar] [CrossRef]
- Thomas, J.A. Monitoring change in the abundance and distribution of insects using butterflies and other indicator groups. Philos. Trans. R. Soc. B 2005, 360, 339–357. [Google Scholar] [CrossRef] [PubMed]
- Morecroft, M.D.; Bealey, C.E.; Beaumont, D.A.; Benham, S.; Brooks, D.R.; Burt, T.P.; Critchley, C.N.R.; Dick, J.; Littlewood, N.A.; Monteith, D.T.; et al. The UK Environmental Change Network: Emerging trends in the composition of plant and animal communities and the physical environment. Biol. Conserv. 2009, 142, 2814–2832. [Google Scholar] [CrossRef]
- Yang, Y.; Dou, Y.; An, S. Environmental driving factors affecting plant biomass in natural grassland in the loess plateau, China. Ecol. Indic. 2017, 82, 250–259. [Google Scholar] [CrossRef]
- Desender, K.; Dekoninck, W.; Dufrêne, M.; Maes, D. Changes in the distribution of carabid beetles in Belgium revisited: Have we halted the diversity loss? Biol. Conserv. 2010, 143, 1549–1557. [Google Scholar] [CrossRef]
- Kotze, J.D.; O’Hara, R.B. Species decline—But why? Explanations of carabid beetle (Coleoptera, Carabidae) declines in Europe. Oecologia 2003, 135, 138–148. [Google Scholar]
- Fattorini, S.; Dapporto, L.; Strona, G.; Borges, P.A.V. Calling for a new strategy to measure environmental (habitat) diversity in island biogeography: A case study of Mediterranean tenebrionids (Coleoptera: Tenebrionidae). Fragm. Entomol. 2015, 47, 1–14. [Google Scholar] [CrossRef]
- Høye, T.T.; Thackeray, S.; Henrys, P.A.; Hemming, D.; Bell, J.R.; Botham, M.S.; Burthe, S.; Helaouet, P.; Johns, D.; Jones, I.D. Taxonomic and trophic-level differences in the climate sensitivity of seasonal events. In Proceedings of the Agu Fall Meeting, San Francisco, CA, USA, 14–18 December 2015. [Google Scholar]
- Koivula, M.J. Useful model organisms, indicators, or both? Ground beetles (Coleoptera, Carabidae) reflecting environmental conditions. Zookeys 2011, 100, 287–317. [Google Scholar] [CrossRef] [PubMed] [Green Version]
- Simone, F. Disentangling the effects of available area, mid-domain constraints, and species environmental tolerance on the altitudinal distribution of tenebrionid beetles in a mediterranean area. Biodivers. Conserv. 2014, 23, 2545–2560. [Google Scholar]
- Gossner, M.M.; Lewinsohn, T.M.; Kahl, T.; Grassein, F.; Boch, S.; Prati, D.; Birkhofer, K.; Renner, S.C.; Sikorski, J.; Wubet, T.; et al. Land-use intensification causes multitrophic homogenization of grassland communities. Nature 2016, 540, 266. [Google Scholar] [CrossRef]
- Wallisdevries, M.F.; Poschlod, P.; Willems, J.H. Challenges for the conservation of calcareous grasslands in northwestern Europe: Integrating the requirements of flora and fauna. Biol. Conserv. 2002, 104, 265–273. [Google Scholar] [CrossRef]
- Warren, M.S.; Maes, D.; Swaay, C.A.M.V.; Goffart, P.; Ellis, S. The decline of butterflies in Europe: Problems, significance, and possible solutions. Proc. Natl. Acad. Sci. USA 2021, 118, e2002551117. [Google Scholar] [CrossRef]
- Barber, N.A.; Lamagdeleine-Dent, K.A.; Willand, J.E.; Jones, H.P.; McCravy, K.W. Species and functional trait re-assembly of ground beetle communities in restored grasslands. Biodivers. Conserv. 2017, 26, 3481–3498. [Google Scholar] [CrossRef]
- Rainio, J.; Niemel, J. Ground beetles (Coleoptera: Carabidae) as bioindicators. Biodivers. Conserv. 2003, 12, 487–506. [Google Scholar] [CrossRef]
- Baselga, A. Determinants of species richness, endemism and turnover in European longhorn beetles. Ecography 2008, 31, 263–271. [Google Scholar] [CrossRef]
- Vamosi, S.M.; Naydani, C.J.; Vamosi, J.C. Body size and species richness along geographical gradients in Albertan diving beetle (Coleoptera: Dytiscidae) communities. Can. J. Zool. 2007, 85, 443–449. [Google Scholar] [CrossRef]

| Value | Study Area | |||
|---|---|---|---|---|
| Yanchi Region (n = 31) | Guyuan Region (n = 104) | |||
| Species Richness Individuals/Plot | Abundance | Species Richness | Abundance | |
| Average value | 5.26 | 62.91 | 9.32 | 92.95 |
| Standard deviation | 3.56 | 103.85 | 3.03 | 64.04 |
| Maximum | 17 | 523 | 16 | 268 |
| Minimum | 1 | 2 | 6 | 30 |
| Term | Abbreviation | Species Richness | Abundance | ||||
|---|---|---|---|---|---|---|---|
| Df | F | p | Df | F | p | ||
| Year | Year | 2.751 | 9.871 | *** | 2.760 | 21.74 | *** |
| Latitude | Lat | - | - | - | 1.658 | 5.338 | * |
| Mean annual temperature | T | - | - | - | - | - | - |
| Mean annual precipitation | P | 7.12 | 8.729 | *** | 5.152 | 19.516 | *** |
| Altitude | Alt | - | - | - | - | - | - |
| Vegetation coverage | VC | - | - | - | - | - | - |
| Plant diversity | PD | - | - | - | 1.000 | 6.114 | * |
| Soil moisture | SM | 1.00 | 3.458 | * | - | - | - |
| Soil temperature | ST | - | - | - | 2.269 | 7.264 | *** |
| Site | S | - | - | - | - | - | - |
Publisher’s Note: MDPI stays neutral with regard to jurisdictional claims in published maps and institutional affiliations. |
© 2021 by the authors. Licensee MDPI, Basel, Switzerland. This article is an open access article distributed under the terms and conditions of the Creative Commons Attribution (CC BY) license (https://creativecommons.org/licenses/by/4.0/).
Share and Cite
Liu, X.; Wang, X.; Bai, M.; Shaw, J.J. Decrease in Carabid Beetles in Grasslands of Northwestern China: Further Evidence of Insect Biodiversity Loss. Insects 2022, 13, 35. https://doi.org/10.3390/insects13010035
Liu X, Wang X, Bai M, Shaw JJ. Decrease in Carabid Beetles in Grasslands of Northwestern China: Further Evidence of Insect Biodiversity Loss. Insects. 2022; 13(1):35. https://doi.org/10.3390/insects13010035
Chicago/Turabian StyleLiu, Xueqin, Xinpu Wang, Ming Bai, and Josh Jenkins Shaw. 2022. "Decrease in Carabid Beetles in Grasslands of Northwestern China: Further Evidence of Insect Biodiversity Loss" Insects 13, no. 1: 35. https://doi.org/10.3390/insects13010035
APA StyleLiu, X., Wang, X., Bai, M., & Shaw, J. J. (2022). Decrease in Carabid Beetles in Grasslands of Northwestern China: Further Evidence of Insect Biodiversity Loss. Insects, 13(1), 35. https://doi.org/10.3390/insects13010035