
Coping with Environmental Extremes: Population Ecology and Behavioural Adaptation of Erebia pronoe, an Alpine Butterfly Species


Abstract
:Simple Summary
Abstract
1. Introduction
2. Materials and Methods
2.1. Study Species
2.2. Study Area
2.3. Mark-Release-Recapture Study
2.4. Population Demography
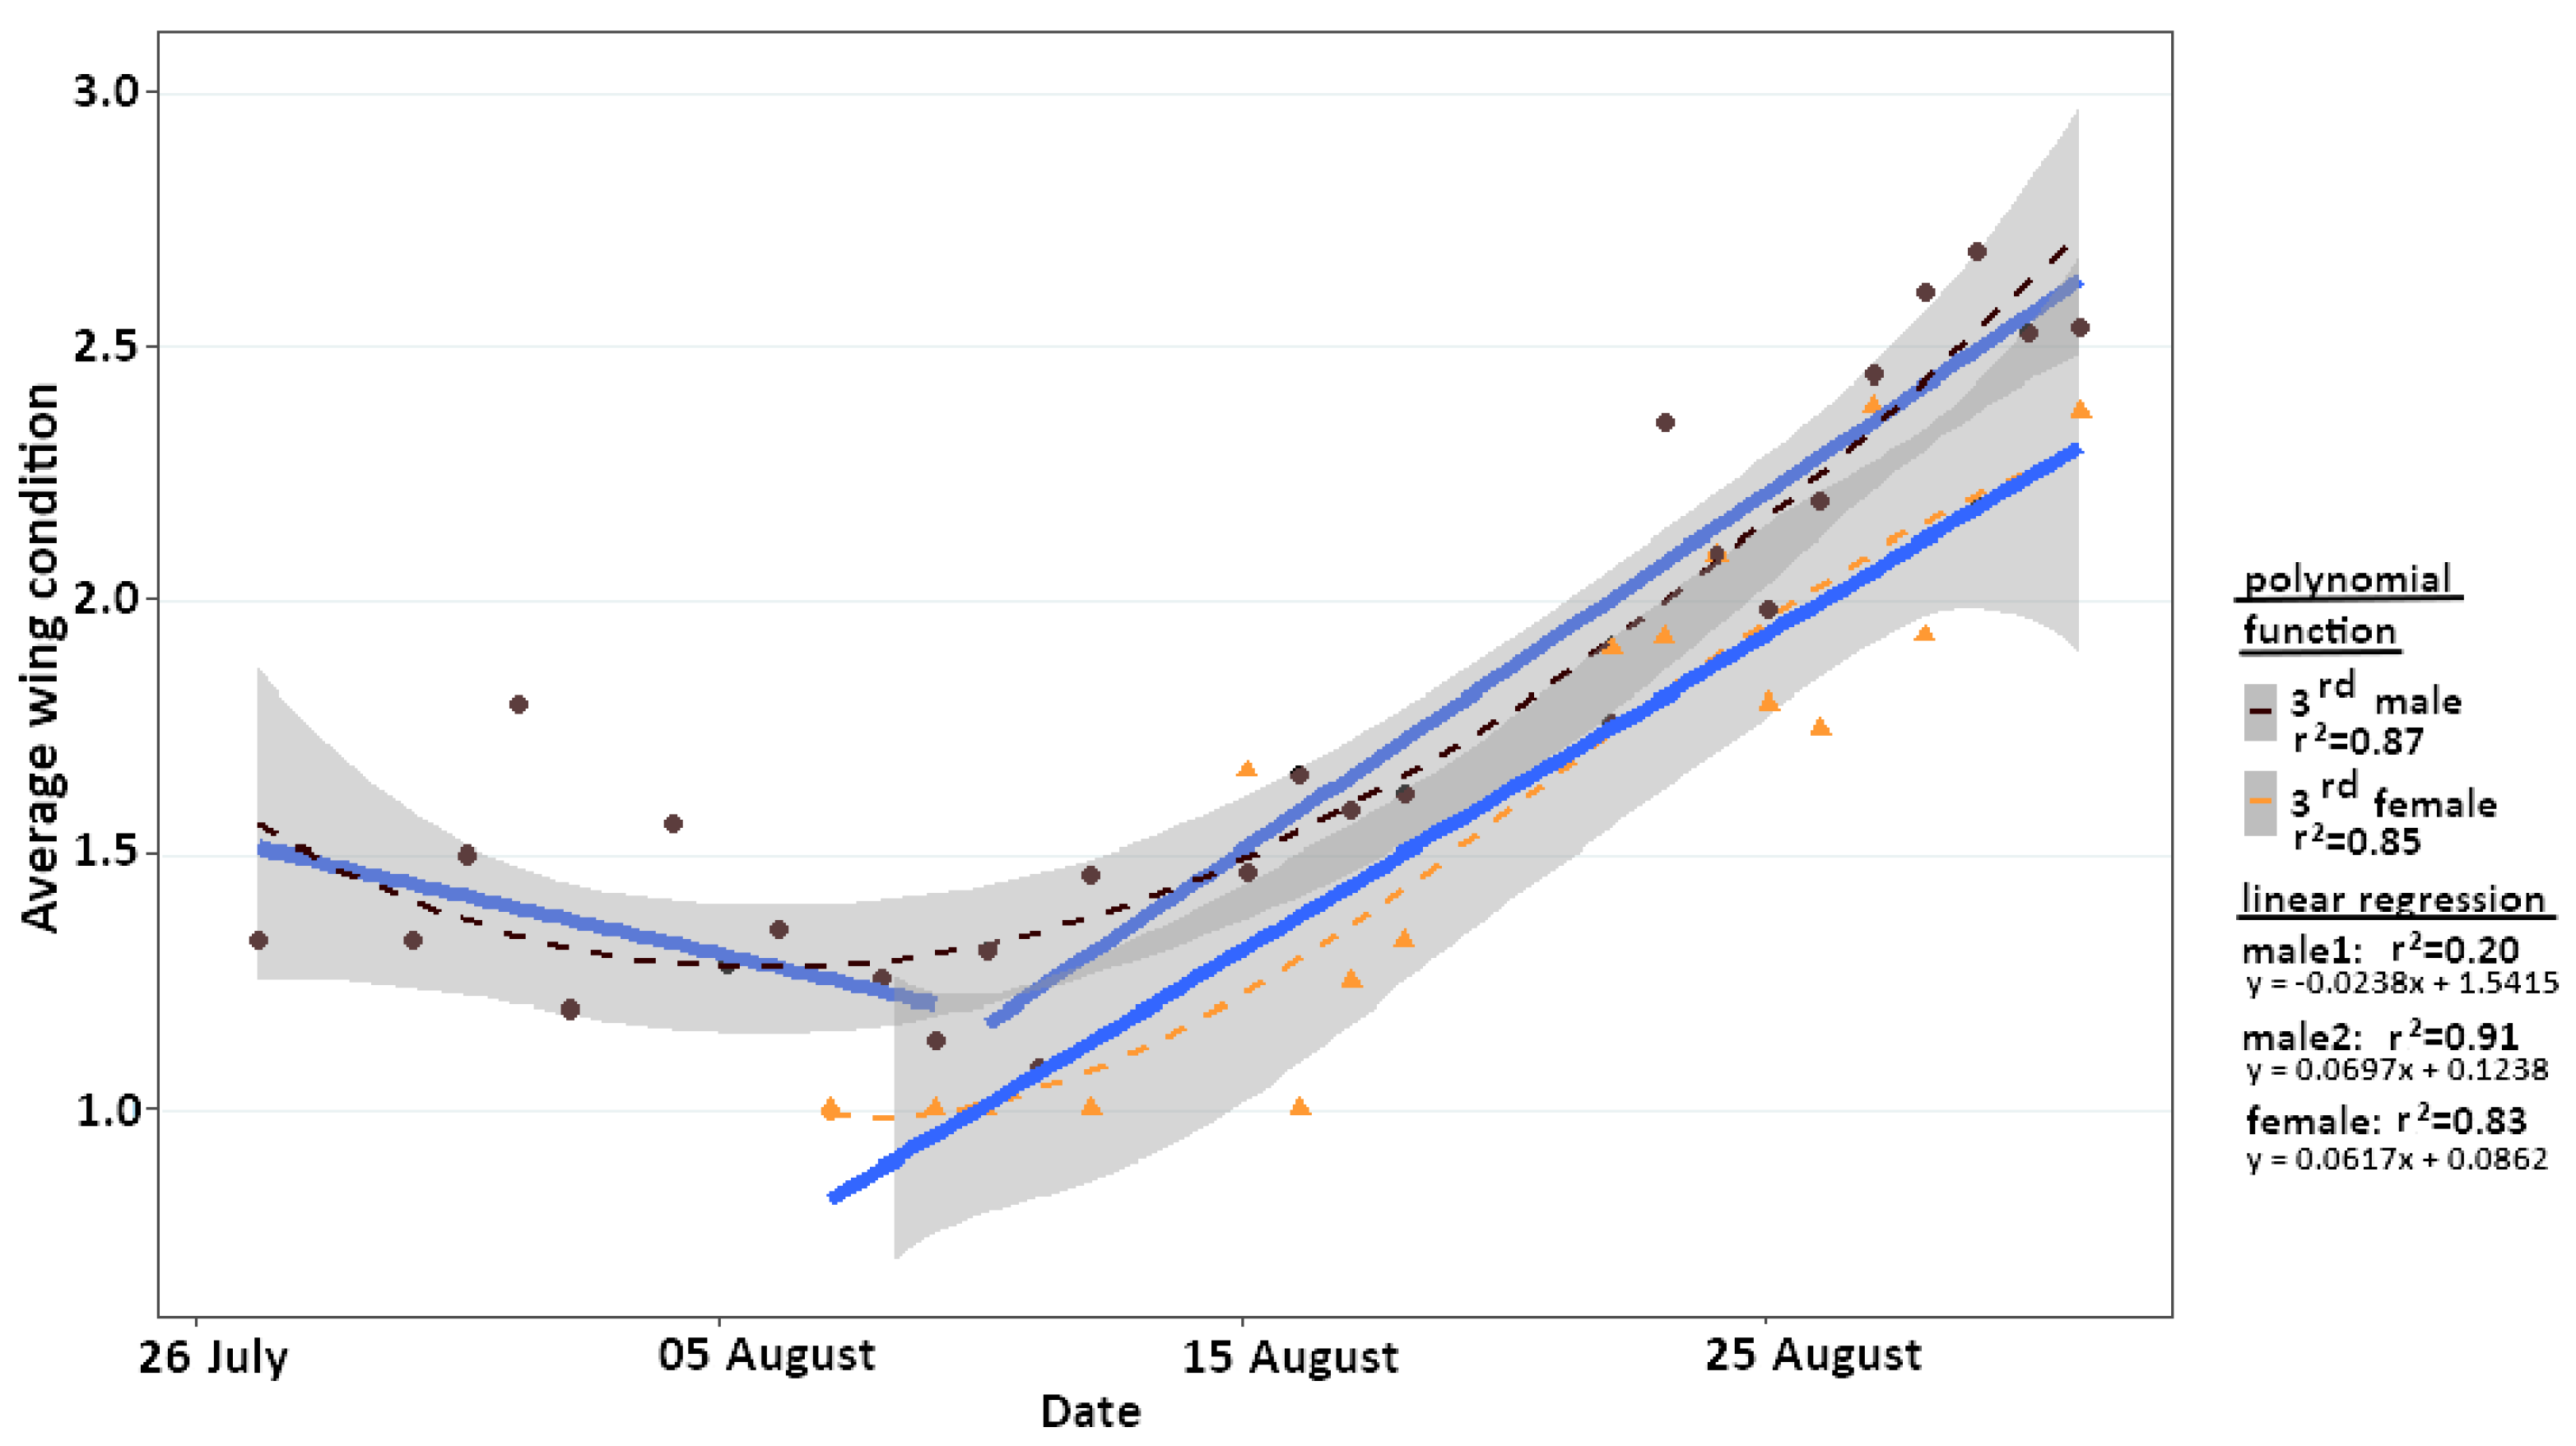
2.5. Wing Condition
2.6. Mobility Parameters
3. Results
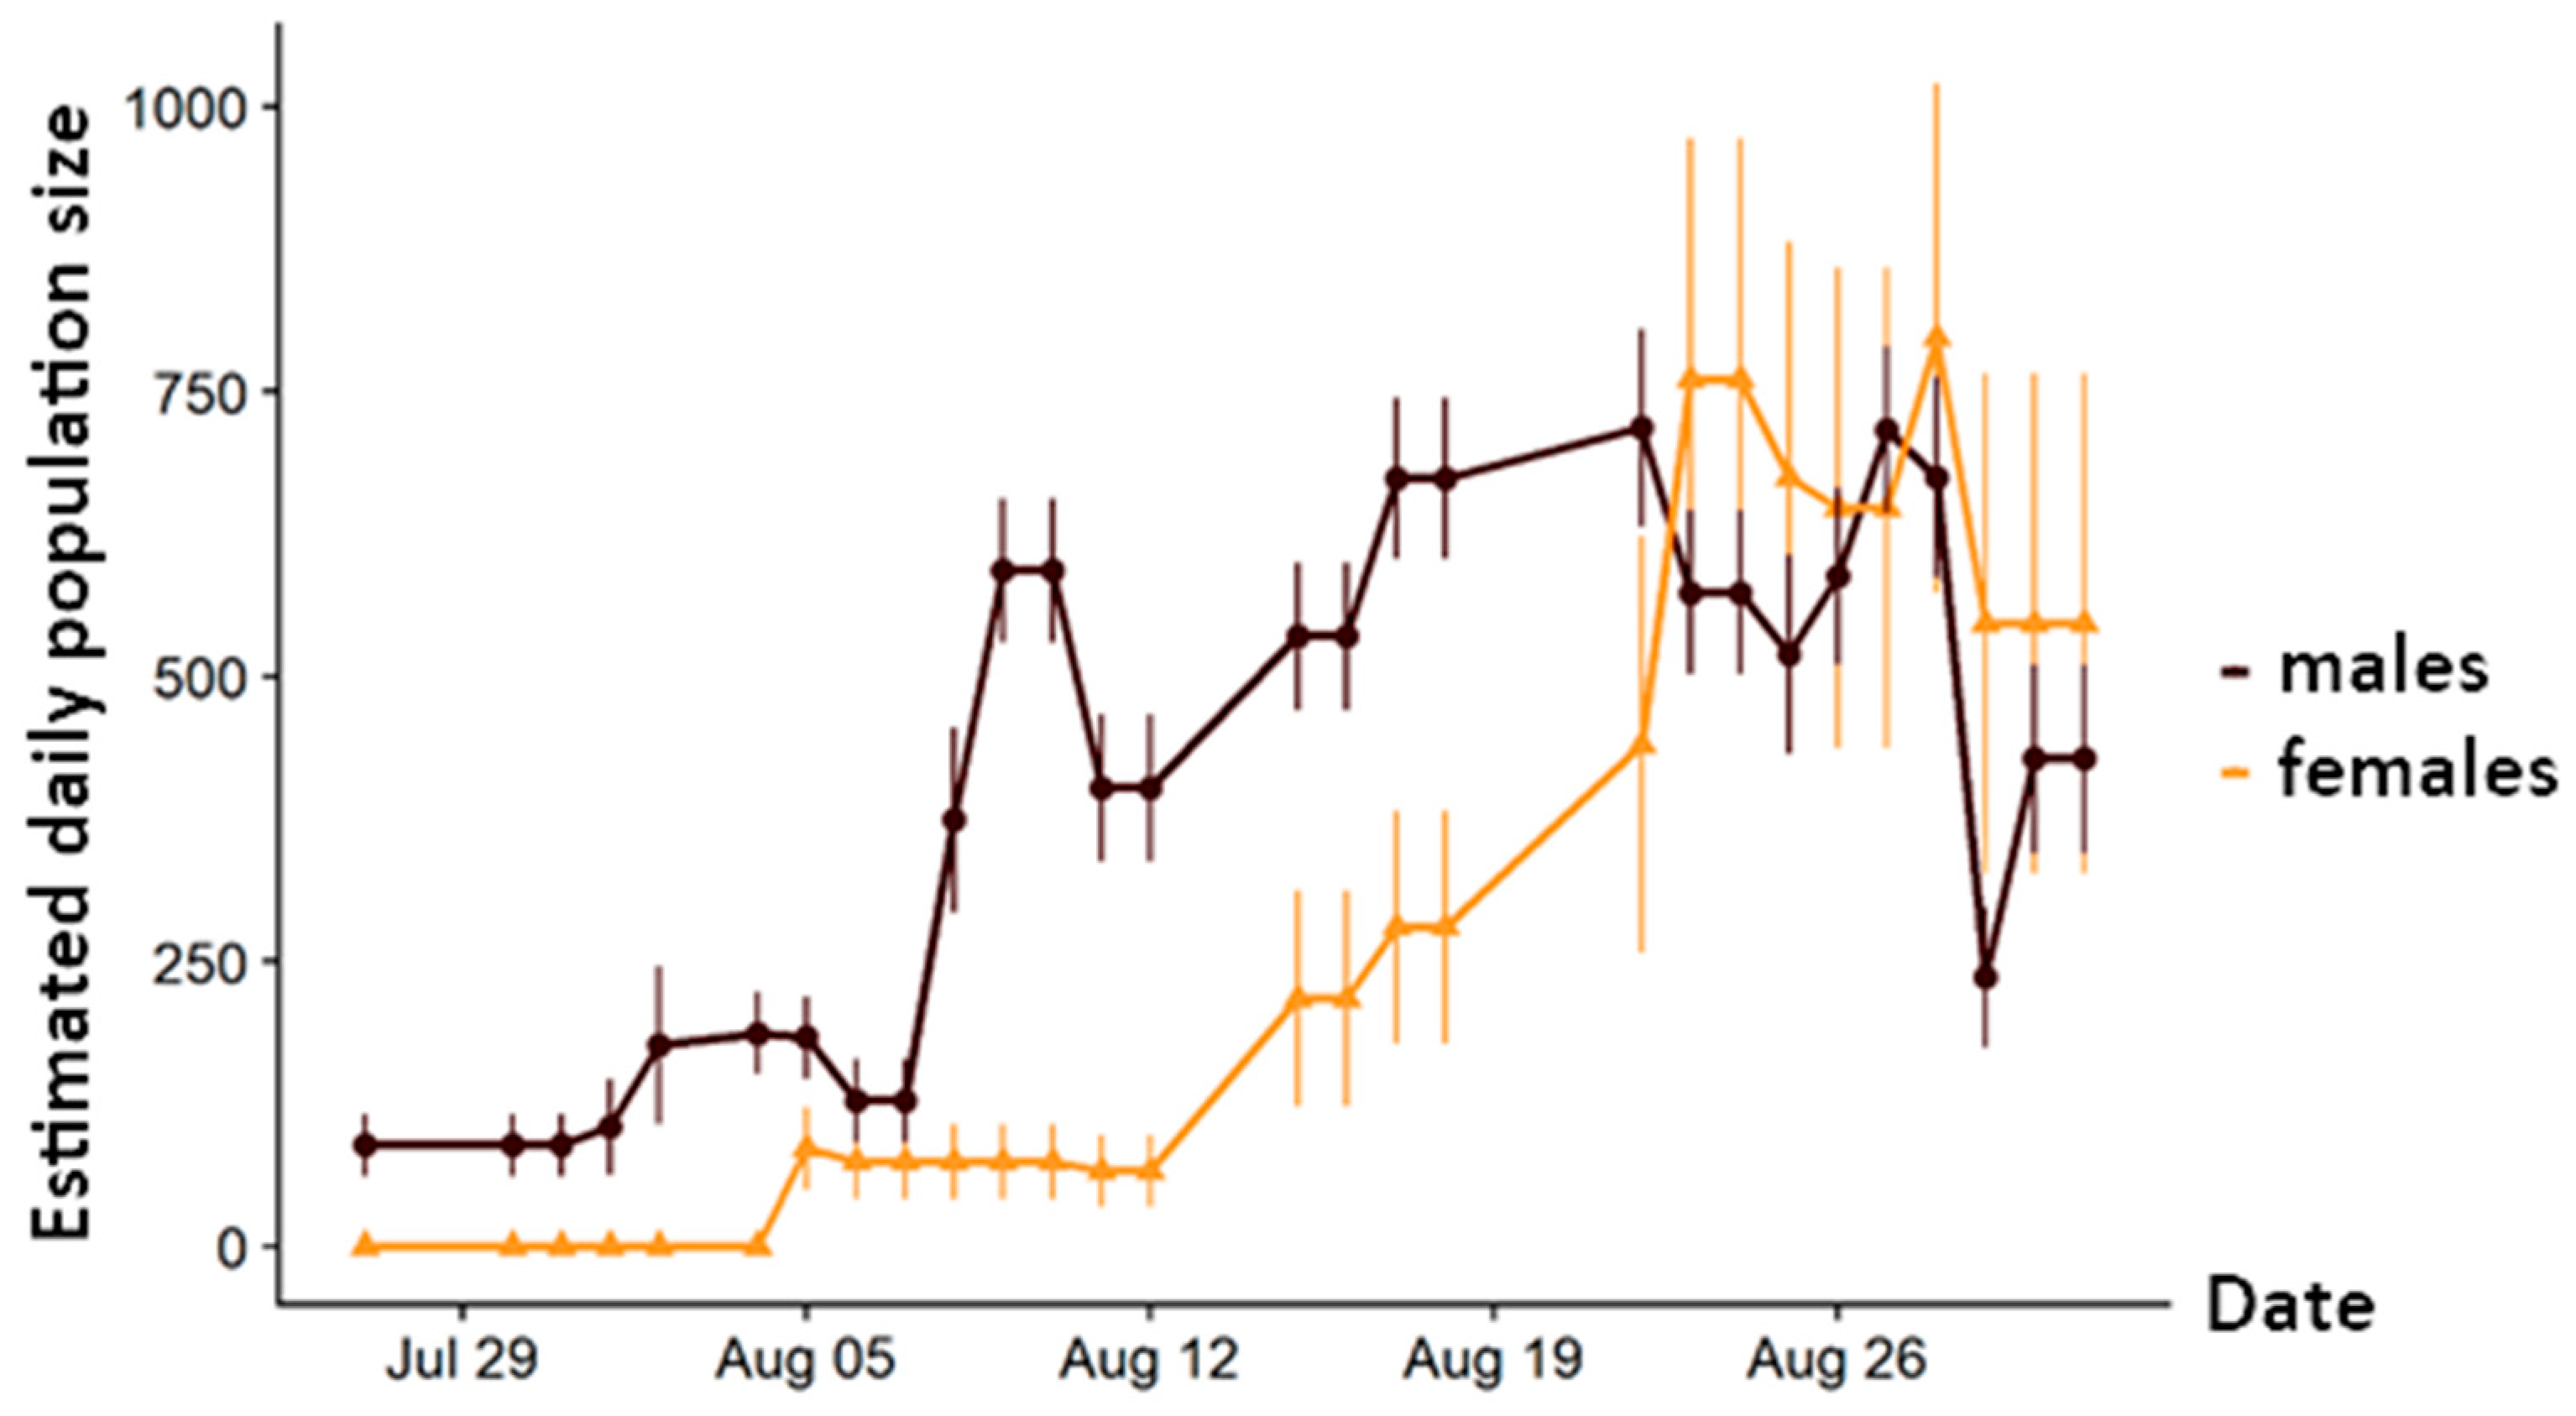
3.1. Demography
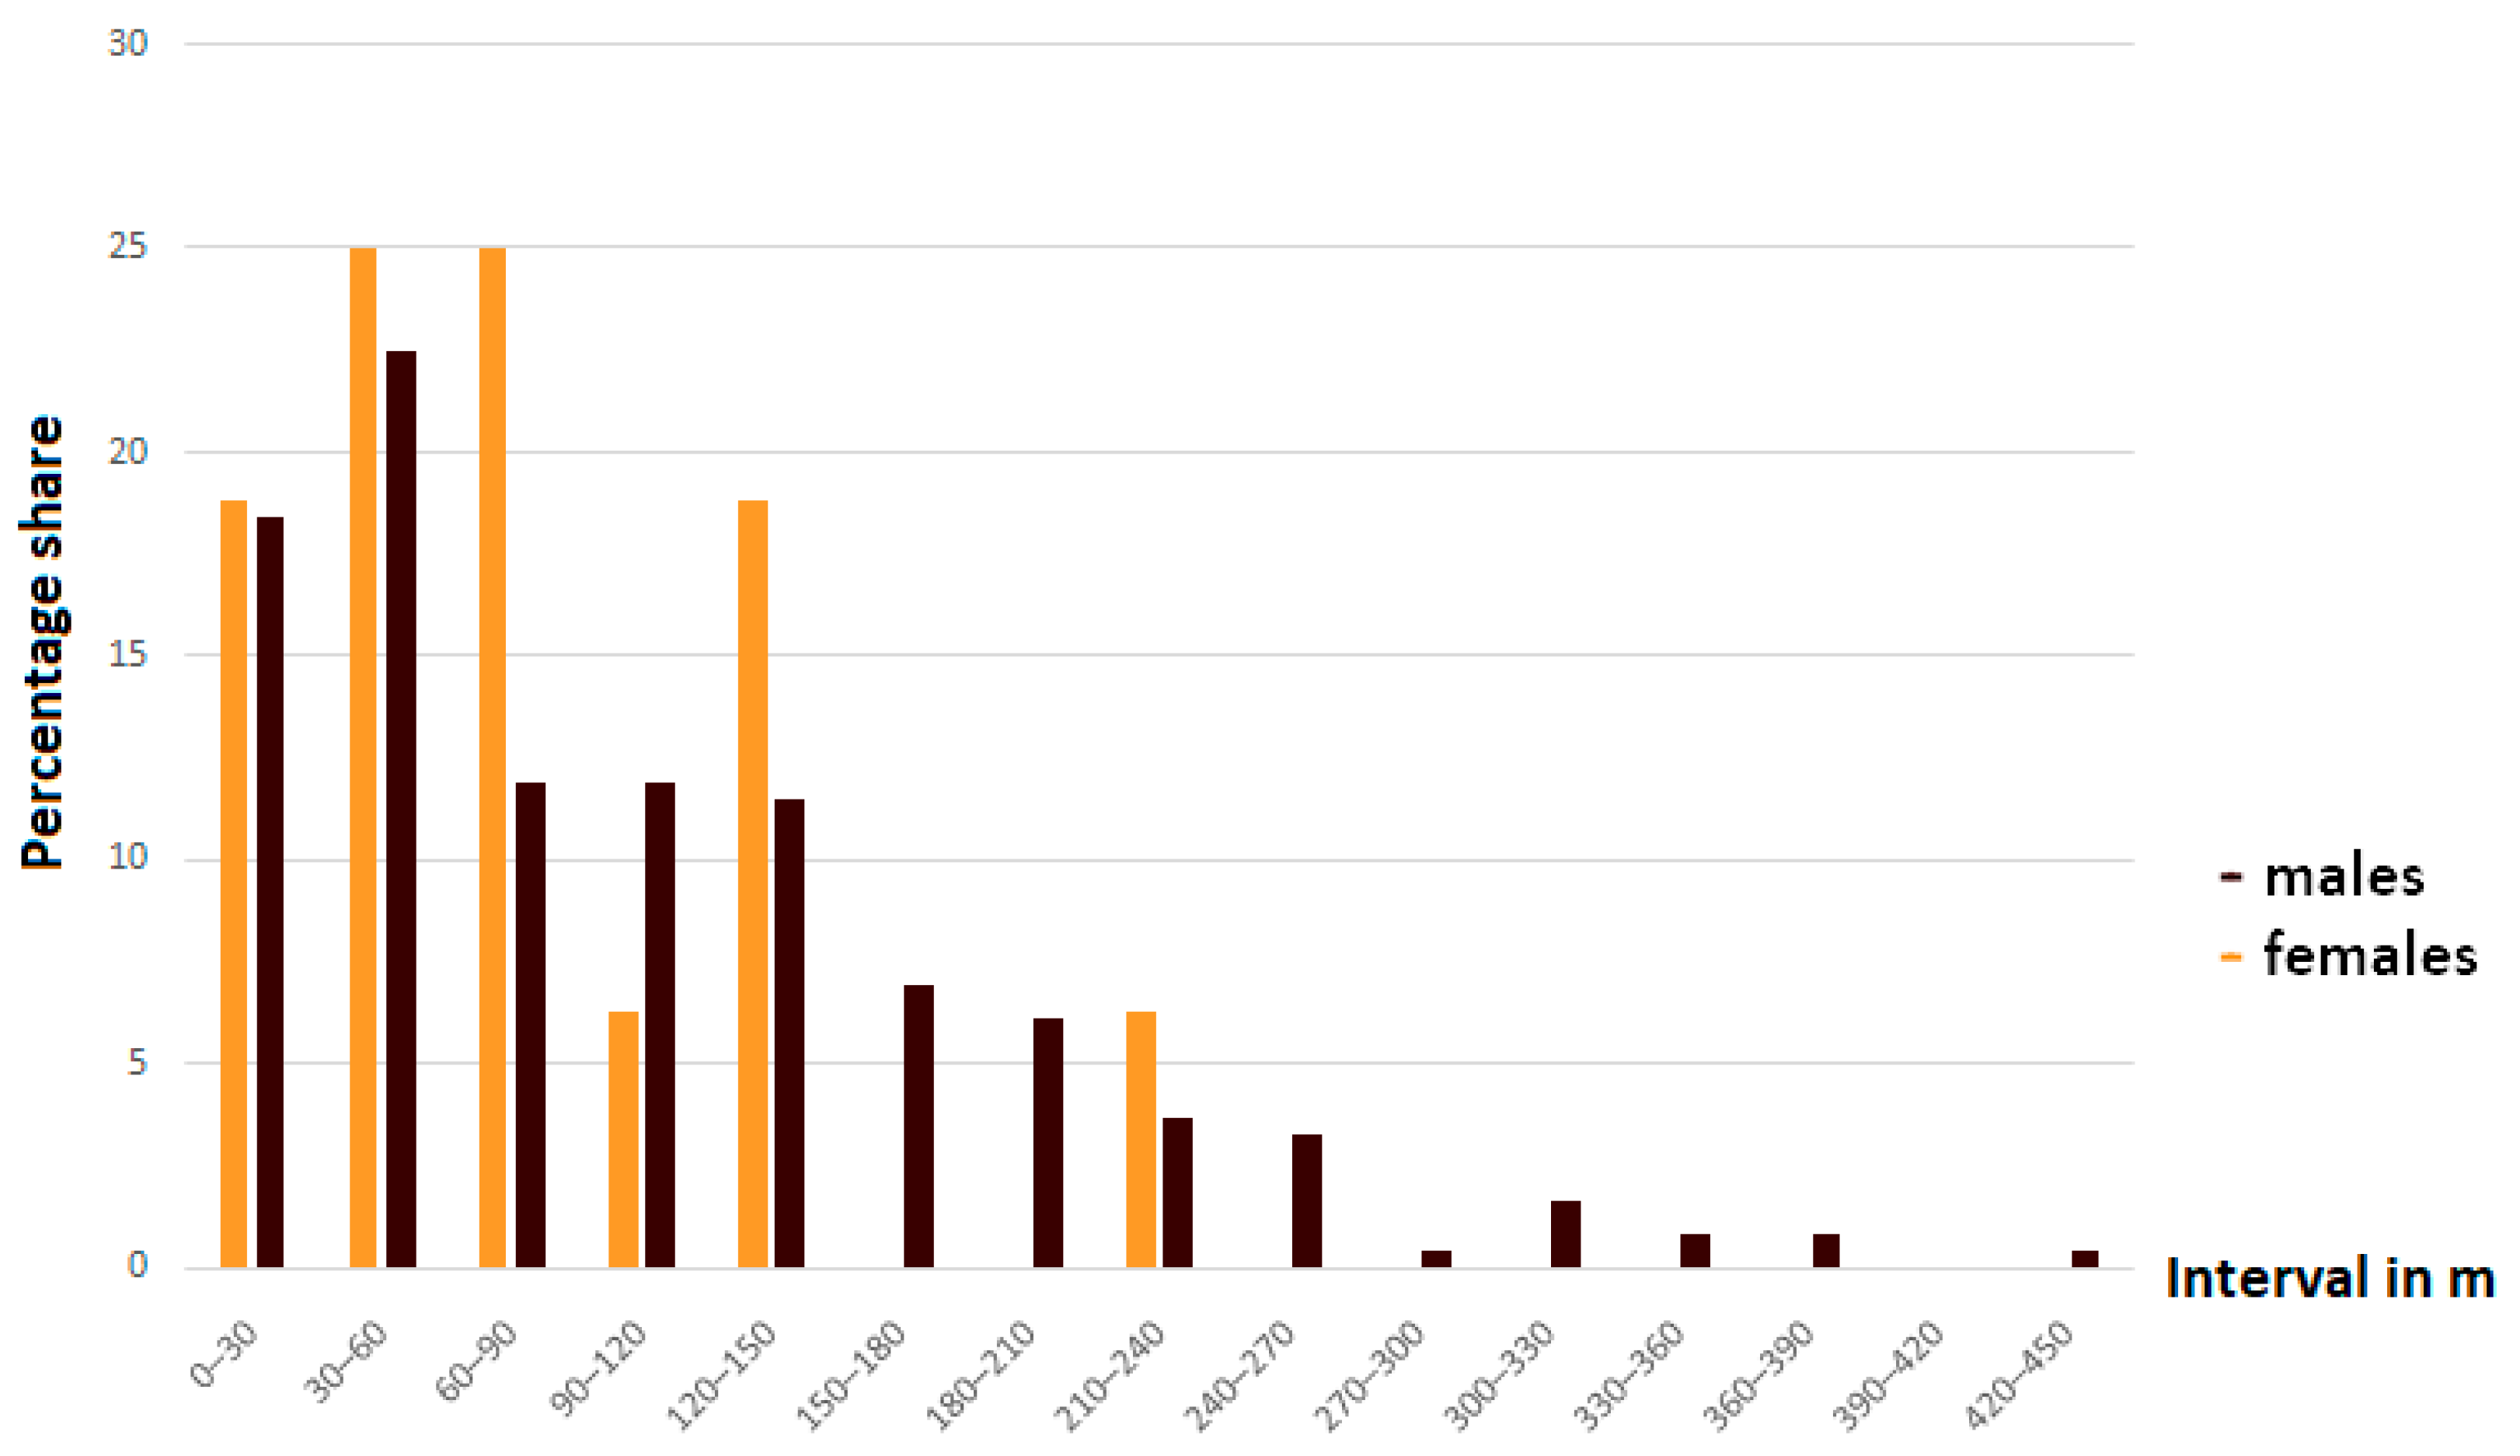
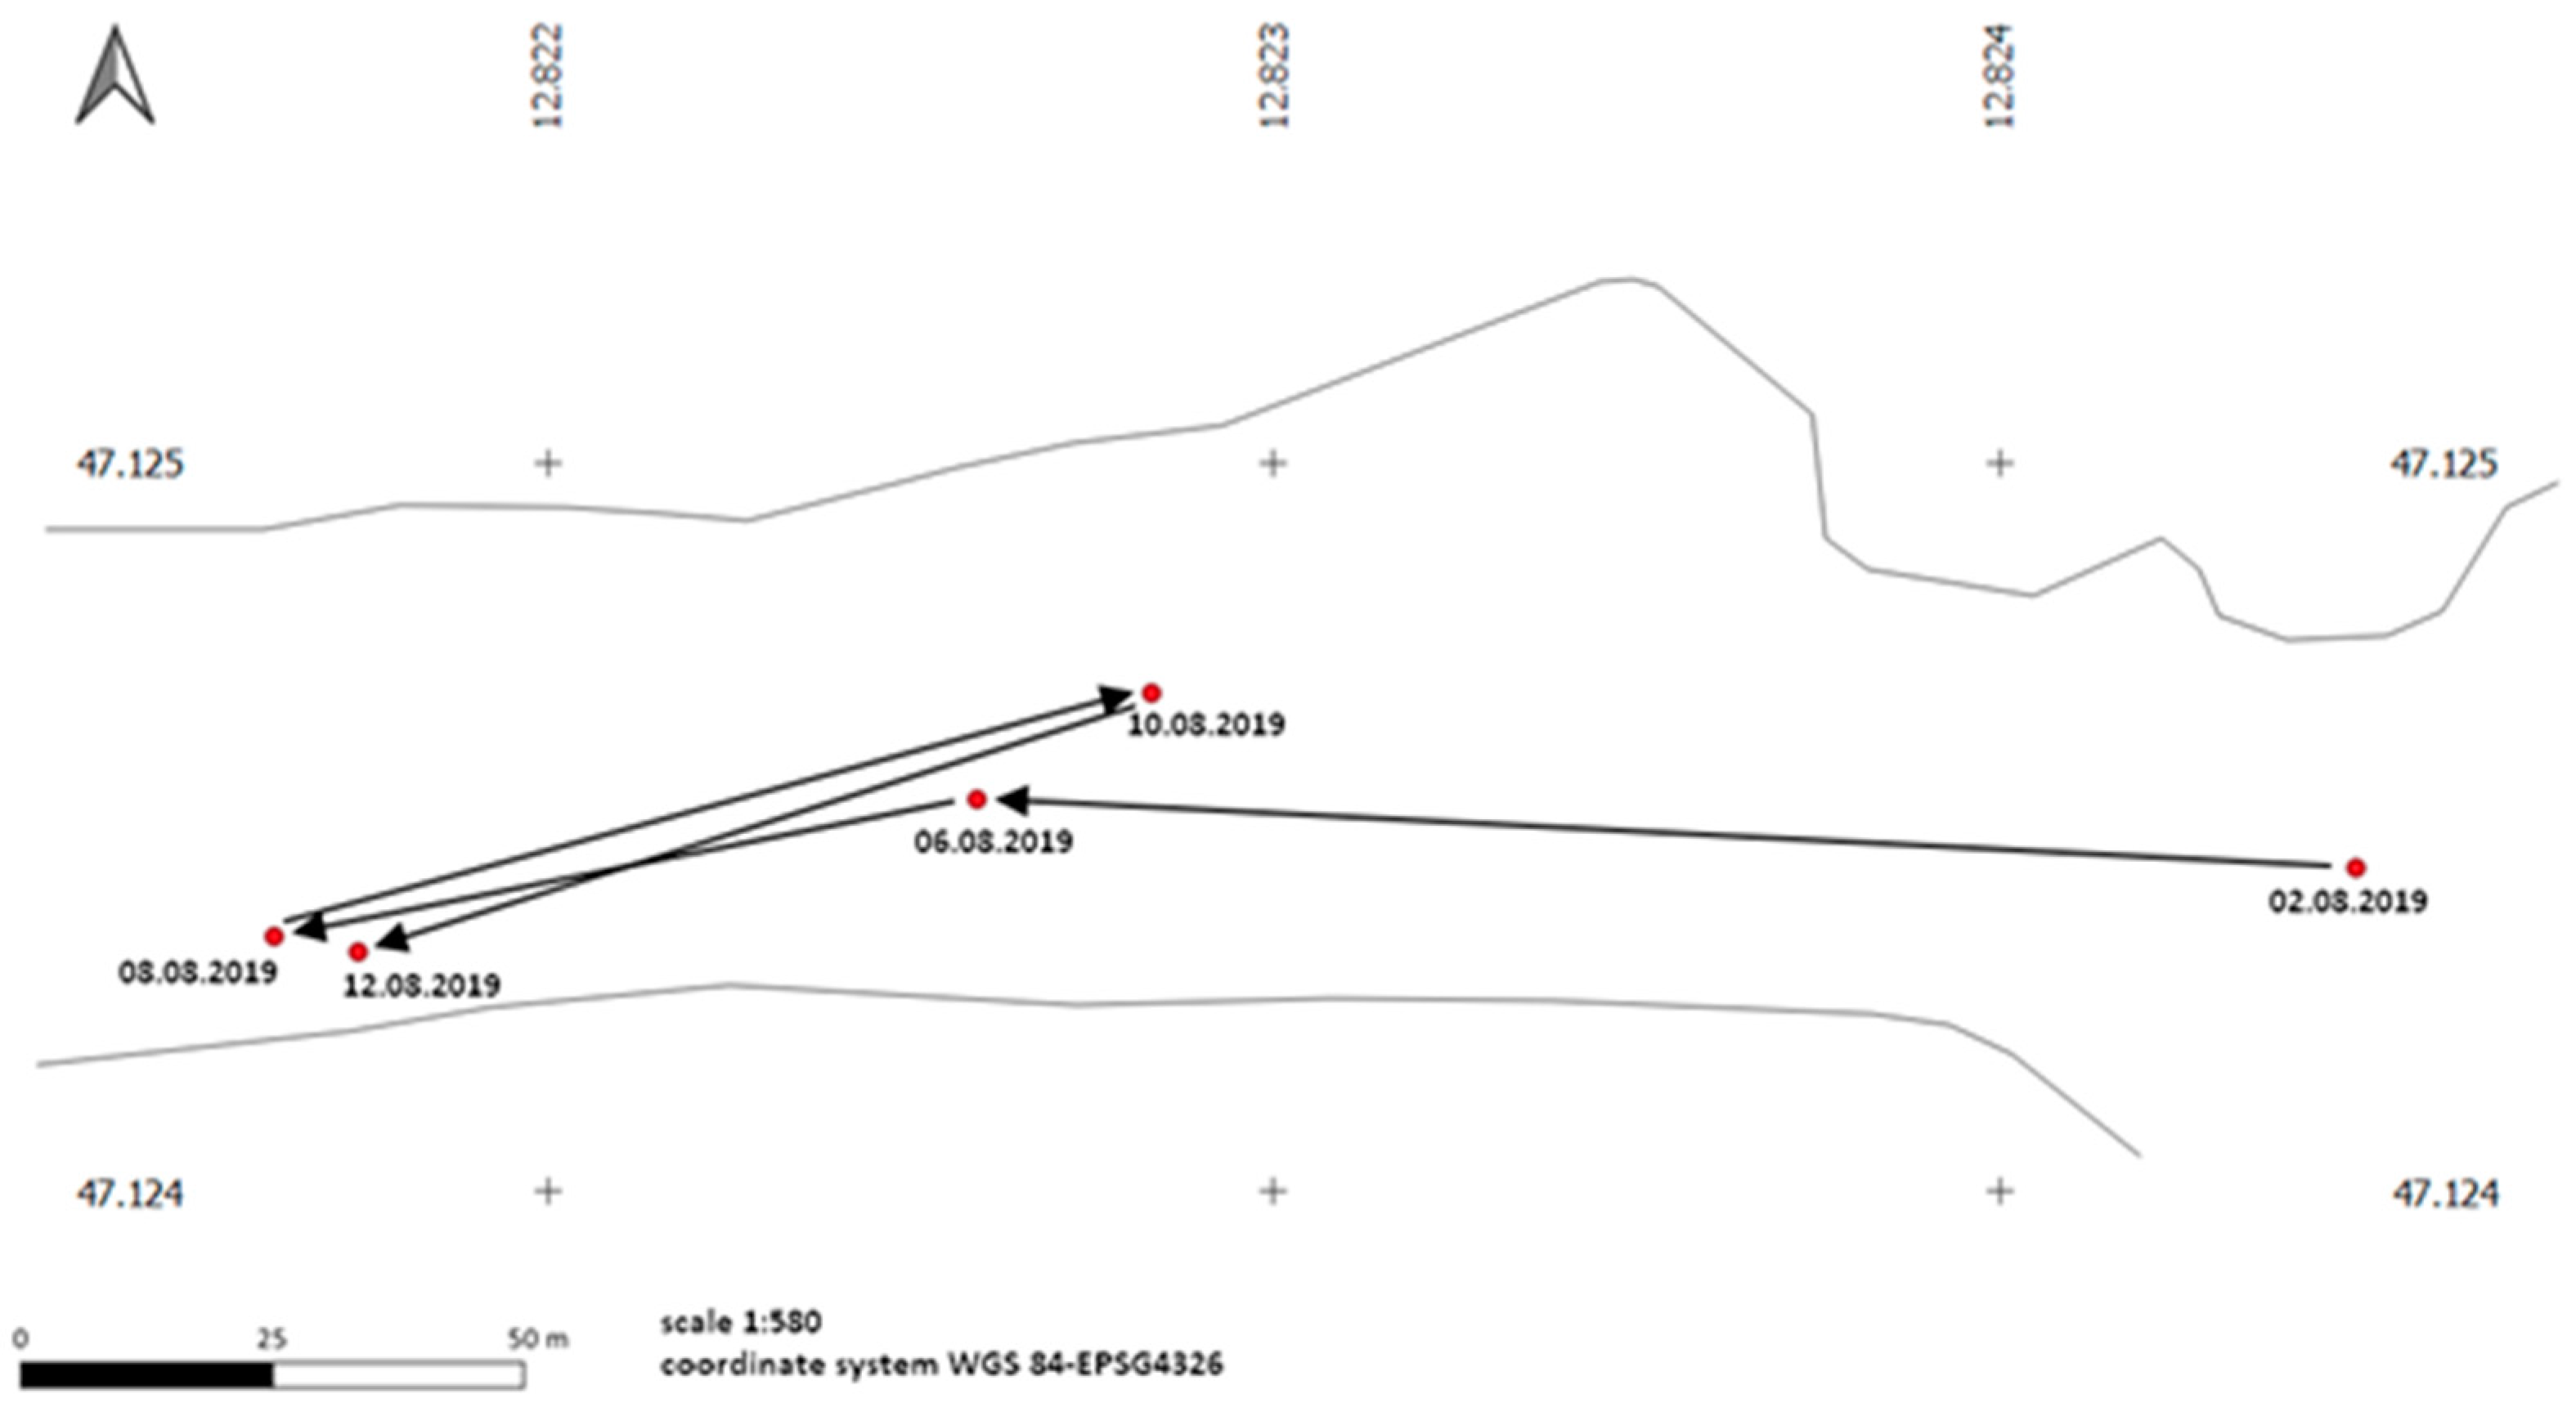
3.2. Mobility and Movement Patterns
3.3. Behavioural Differences between Sexes
3.4. Use of Nectar Plants
4. Discussion
4.1. Population Size and Structure
4.2. Adaptation to Extreme Conditions through Protandry and Serial Eclosion
4.3. Resource Use
4.4. Movement Patterns
5. Conclusions
Author Contributions
Funding
Institutional Review Board Statement
Data Availability Statement
Acknowledgments
Conflicts of Interest
References
- IPBES. The Assessment Report of the Intergovernmental Science-Policy Platform on Biodiversity and Ecosystem Services on Pollina-tors, Pollination and Food Production; Potts, S.G., Imperatriz-Fonseca, V.L., Ngo, H.T., Eds.; IPBES: Bonn, Germany, 2016; ISBN 978-92-807-3567-3. [Google Scholar]
- Thomas, J.A. Butterfly communities under threat. Science 2016, 353, 216–218. [Google Scholar] [CrossRef]
- Nagy, L.; Grabherr, G.; Körner, C.; Thompson, D. Alpine Biodiversity in Europe; Springer: Berlin, Germany, 2003. [Google Scholar]
- Schmitt, T. Biogeographical and evolutionary importance of the European high mountain systems. Front. Zool. 2009, 6, 9. [Google Scholar] [CrossRef] [Green Version]
- Sánchez-Bayo, F.; Wyckhuys, K.A.G. Worldwide decline of the entomofauna: A review of its drivers. Biol. Conserv. 2019, 232, 8–27. [Google Scholar] [CrossRef]
- Dover, J.; Settele, J. The influences of landscape structure on butterfly distribution and movement: A review. J. Insect Conserv. 2009, 13, 3–27. [Google Scholar] [CrossRef]
- Boggs, C.L.; Murphy, D.D. Community composition in mountain ecosystems: Climatic determinants of montane butterfly distributions. Glob. Ecol. Biogeogr. Lett. 1997, 6, 39–48. [Google Scholar] [CrossRef]
- Dengler, J. Which function describes the species-area relationship best? A review and empirical evaluation. J. Biogeogr. 2009, 36, 728–744. [Google Scholar] [CrossRef]
- Thomas, C.D.; Franco, A.M.A.; Hill, J.K. Range retractions and extinction in the face of climate warming. Trends Ecol. Evol. 2006, 21, 415–416. [Google Scholar] [CrossRef]
- Chen, I.C.; Hill, J.K.; Ohlemüller, R.; Roy, D.B.; Thomas, C.D. Rapid range shifts of species associated with high levels of climate warming. Science 2011, 333, 1024–1026. [Google Scholar] [CrossRef] [PubMed]
- Parmesan, C. Ecological and Evolutionary Responses to Recent Climate Change. Annu. Rev. Ecol. Evol. Syst. 2006, 37, 637–669. [Google Scholar] [CrossRef] [Green Version]
- Parmesan, C. Influences of species, latitudes and methodologies on estimates of phenological response to global warming. Glob. Chang. Biol. 2007, 13, 1860–1872. [Google Scholar] [CrossRef]
- Roland, J.; Keyghobadi, N.; Fownes, S. Alpine Parnassius Butterfly Dispersal: Effects of Landscape and Population Size. Ecology 2000, 81, 1642–1653. [Google Scholar] [CrossRef]
- Kadlec, T.; Vrba, P.; Kepka, P.; Schmitt, T.; Konvicka, M. Tracking the decline of the once-common butterfly: Delayed oviposition, demography and population genetics in the hermit Chazara briseis. Anim. Conserv. 2010, 13, 172–183. [Google Scholar] [CrossRef]
- Boggs, C.L.; Ross, C.L. The effect of adult food limitation on life history traits in Speyeria mormonia (Lepidoptera: Nymphalidae). Ecology 1993, 74, 433–441. [Google Scholar] [CrossRef]
- Baguette, M.; Néve, G. Adult movements between populations in the specialist butterfly Proclossiana eunomia (Lepidoptera, Nymphalidae). Ecol. Entomol. 1994, 19, 1–5. [Google Scholar] [CrossRef]
- Seibold, S.; Gossner, M.M.; Simons, N.K.; Blüthgen, N.; Müller, J.; Ambarlı, D.; Ammer, C.; Bauhus, J.; Fischer, M.; Habel, J.C.; et al. Arthropod decline in grasslands and forests is associated with landscape-level drivers. Nature 2019, 574, 671–674. [Google Scholar] [CrossRef]
- Viljur, M.L.; Teder, T. Disperse or die: Colonisation of transient open habitats in production forests is only weakly dispersal-limited in butterflies. Biol. Conserv. 2018, 218, 32–40. [Google Scholar] [CrossRef]
- Maes, D.; Van Dyck, H. Habitat quality and biodiversity indicator performances of a threatened butterfly versus a multispecies group for wet heathlands in Belgium. Biol. Conserv. 2005, 123, 177–187. [Google Scholar] [CrossRef]
- Tshikolovets, V.V. Butterflies of Europe and the Mediterranean Area, Tshikolovets Publications, 2011.
- van Swaay, C.A.M.; Warren, M.S. Prime Butterfly Areas of Europe: An initial selection of priority sites for conservation. J. Insect Conserv. 2006, 10, 5–11. [Google Scholar] [CrossRef]
- Ehl, S.; Dalstein, V.; Tull, F.; Gros, P.; Schmitt, T. Specialized or opportunistic—How does the high mountain endemic butterfly Erebia nivalis survive in its extreme habitats? Insect. Sci. 2018, 25, 161–171. [Google Scholar] [CrossRef] [PubMed]
- Junker, M.; Wagner, S.; Gros, P.; Schmitt, T. Changing demography and dispersal behaviour: Ecological adaptations in an alpine butterfly. Oecologia 2010, 164, 971–980. [Google Scholar] [CrossRef]
- Huemer, P. Biodiversität von Schmetterlingen (Lepidoptera) im Gebiet des Naturparks Schlern. Gredleriana 2007, 7, 233–306. [Google Scholar]
- Tolman, T.; Lewington, R. Schmetterlinge Europas Und Nordwestafrikas, 2nd ed.; Kosmos: Stuttgart, Germany, 2012. [Google Scholar]
- Sonderegger, P. Die Erebien der Schweiz (Lepidoptera: Satyrinae, Genus Erebia); Biel: Shenzhen, China, 2005. [Google Scholar]
- Hickel, C.; Gereben-Krenn, B.-A.; Zweimüller, I.; Krenn, H.W. Wetterbedingungen für die Erfassung von Tagfaltern (Lepidoptera: Papilionoidea) in alpinen Lebensräumen in Österreich C. Entomol. Austriaca 2016, 23, 7–18. [Google Scholar]
- Zimmermann, K.; Fric, Z.; Filipová, L.; Konvička, M. Adult demography, dispersal and behaviour of Brenthis ino (Lepidoptera: Nymphalidae): How to be a successful wetland butterfly. Eur. J. Entomol. 2005, 102, 699–706. [Google Scholar] [CrossRef] [Green Version]
- Gall, L.F. The effects of capturing and marking on subsequent activity in Boloria acrocnema (Lepidoptera: Nymphalidae), with a comparison of different numerical models that estimate population size. Biol. Conserv. 1984, 28, 139–154. [Google Scholar] [CrossRef]
- Cooch, E.G.; White, G.C. Using Program MARK: A Gentle Introduction. Available online: http://www.phidot.org/software/mark/docs/book/ (accessed on 10 November 2019).
- White, G.C.; Burnham, K.P. Program mark: Survival estimation from populations of marked animals. Bird Study 1999, 46, S120–S139. [Google Scholar] [CrossRef]
- Sugiura, N. Further analysts of the data by akaike’ s information criterion and the finite corrections. Commun. Stat.-Theory Methods 2007, 7, 13–26. [Google Scholar] [CrossRef]
- Burnham, K.; Anderson, D. Model Selection and Multimodel Inference: A Practical Information-Theoretic Approach; Springer: New York, NY, USA, 2002. [Google Scholar]
- QGIS Development Team Quantum Geographic Information System (QGIS), version 3.83; Available online: https://www.qgis.org/en/site/forusers/download.html (accessed on 28 September 2019).
- R Core Team. R: A Language and Environment for Statistical Computing; R Foundation for Statistical Computing: Vienna, Austria, 2016. [Google Scholar]
- Kuras, T.; Benes, J.; Fric, Z.; Konvicka, M. Dispersal patterns of endemic alpine butterflies with contrasting population structures: Erebia epiphron and E. sudetica. Popul. Ecol. 2003, 45, 115–123. [Google Scholar] [CrossRef]
- Serbus, L.R.; Casper-Lindley, C.; Landmann, F.; Sullivan, W. The genetics and cell biology of Wolbachia-host interactions. Annu. Rev. Genet. 2008, 42, 683–707. [Google Scholar] [CrossRef] [PubMed] [Green Version]
- Engelstädter, J.; Hurst, G.D.D. The ecology and evolution of microbes that manipulate host reproduction. Annu. Rev. Ecol. Evol. Syst. 2009, 40, 127–149. [Google Scholar] [CrossRef]
- Nowicki, P.; Witek, M.; Skórka, P.; Settele, J.; Woyciechowski, M. Population ecology of the endangered butterflies Maculinea teleius and M. nausithous and the implications for conservation. Popul. Ecol. 2005, 47, 193–202. [Google Scholar] [CrossRef]
- Timus, N.; Czekes, Z.; Rákosy, L.; Nowicki, P. Conservation implications of source-sink dynamics within populations of endangered Maculinea butterflies. J. Insect Conserv. 2017, 21, 369–378. [Google Scholar] [CrossRef] [Green Version]
- Plazio, E.; Bubová, T.; Vrabec, V.; Nowicki, P. Sex-biased topography effects on butterfly dispersal. Mov. Ecol. 2020, 8, 50. [Google Scholar] [CrossRef] [PubMed]
- Bowers, D.M.; Schmitt, J. Overcrowding leads to lethal oviposition mistakes in the Baltimore checkerspot, Euphydryas phaeton drury (Nymphalidae). J. Lepid. Soc. 2013, 67, 227–229. [Google Scholar] [CrossRef]
- Evans, L.C.; Sibly, R.M.; Thorbek, P.; Sims, I.; Oliver, T.H.; Walters, R.J. The importance of including habitat—Specific behaviour in models of butterfly movement. Oecologia 2020, 193, 249–259. [Google Scholar] [CrossRef] [Green Version]
- Stevens, G.C. The elevational gradient in altitudinal range: An extension of Rapoport’s latitudinal rule to altitude. Am. Nat. 1992, 140, 893–911. [Google Scholar] [CrossRef]
- Schweiger, O.; Settele, J.; Kudrna, O.; Klotz, S.; Kühn, I. Climate change can cause spatial mismatch of trophically interacting species. Ecology 2008, 89, 3472–3479. [Google Scholar] [CrossRef]
- Kőrösi, Á.; Örvössy, N.; Batáry, P.; Kövér, S.; Peregovits, L. Restricted within-habitat movement and time-constrained egg laying of female Maculinea rebeli butterflies. Oecologia 2008, 156, 455–464. [Google Scholar] [CrossRef]
- Mennechez, G.; Schtickzelle, N.; Baguette, M. Metapopulation dynamics of the bog fritillary butterfly: Comparison of demographic parameters and dispersal between a continuous and a highly fragmented landscape. Landsc. Ecol. 2003, 18, 279–291. [Google Scholar] [CrossRef]
- Creel, S. Social organization and effective population size in carnivores. In Behavioral Ecology and Conservation Biology; Oxford University Press: Oxford, UK, 1998; pp. 246–265. [Google Scholar]


| Model Nr. | Model | AICC | Parameters |
|---|---|---|---|
| 1 | {Phi(g + t) p(g + hours) pent(g × t) N(g × t)} | 2404.7462 | 34 |
| 2 | {Phi(g × t) p(g × hours) pent(g + t) N(g × t)} | 2408.9191 | 64 |
| 3 | {Phi(g + t) p(g + hours) pent(g + t) N(g × t)} | 2414.2151 | 18 |
| 4 | {Phi(g + t) p(g × hours) pent(g × t) N(g × t)} | 2416.0908 | 29 |
| 5 | {Phi(g × t) p(g × hours) pent(g × t) N(g × t)} | 2417.6189 | 30 |
| 20 m Intervals | 30 m Intervals | 50 m Intervals | ||||
|---|---|---|---|---|---|---|
| IPF | NEF | IPF | NEF | IPF | NEF | |
| Males | 0.76 | 0.97 | 0.79 | 0.98 | 0.81 | 0.96 |
| Females | 0.79 | 0.94 | 0.83 | 0.93 | 0.80 | 0.93 |
| Distance | IPF Males | IPF Females | NEF Males | NEF Females |
|---|---|---|---|---|
| 1 km | 0.29 | 0.82 | 0.0003 | 3.50 × 10⁻⁵ |
| 2 km | 0.07 | 0.29 | 4.27 × 10⁻¹⁰ | 6.50 × 10⁻¹² |
| 3 km | 0.03 | 0.15 | 5.86 × 10⁻¹⁶ | 1.21 × 10⁻¹⁸ |
| 5 km | 0.01 | 0.07 | 1.10 × 10⁻²⁷ | 4.15 × 10⁻³² |
| Flying | Resting | Feeding | Mating | |
|---|---|---|---|---|
| Males | 57.7 | 33.2 | 8.9 | 0.2 |
| Females | 11.9 | 75.6 | 11.3 | 1.2 |
Publisher’s Note: MDPI stays neutral with regard to jurisdictional claims in published maps and institutional affiliations. |
© 2021 by the authors. Licensee MDPI, Basel, Switzerland. This article is an open access article distributed under the terms and conditions of the Creative Commons Attribution (CC BY) license (https://creativecommons.org/licenses/by/4.0/).
Share and Cite
Wendt, M.; Senftleben, N.; Gros, P.; Schmitt, T. Coping with Environmental Extremes: Population Ecology and Behavioural Adaptation of Erebia pronoe, an Alpine Butterfly Species. Insects 2021, 12, 896. https://doi.org/10.3390/insects12100896
Wendt M, Senftleben N, Gros P, Schmitt T. Coping with Environmental Extremes: Population Ecology and Behavioural Adaptation of Erebia pronoe, an Alpine Butterfly Species. Insects. 2021; 12(10):896. https://doi.org/10.3390/insects12100896
Chicago/Turabian StyleWendt, Martin, Nele Senftleben, Patrick Gros, and Thomas Schmitt. 2021. "Coping with Environmental Extremes: Population Ecology and Behavioural Adaptation of Erebia pronoe, an Alpine Butterfly Species" Insects 12, no. 10: 896. https://doi.org/10.3390/insects12100896
APA StyleWendt, M., Senftleben, N., Gros, P., & Schmitt, T. (2021). Coping with Environmental Extremes: Population Ecology and Behavioural Adaptation of Erebia pronoe, an Alpine Butterfly Species. Insects, 12(10), 896. https://doi.org/10.3390/insects12100896