De Novo Transcriptomic and Metabolomic Analyses Reveal the Ecological Adaptation of High-Altitude Bombus pyrosoma

 and
and
Simple Summary
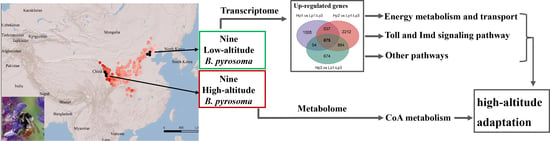
Abstract
1. Introduction
2. Materials and Methods
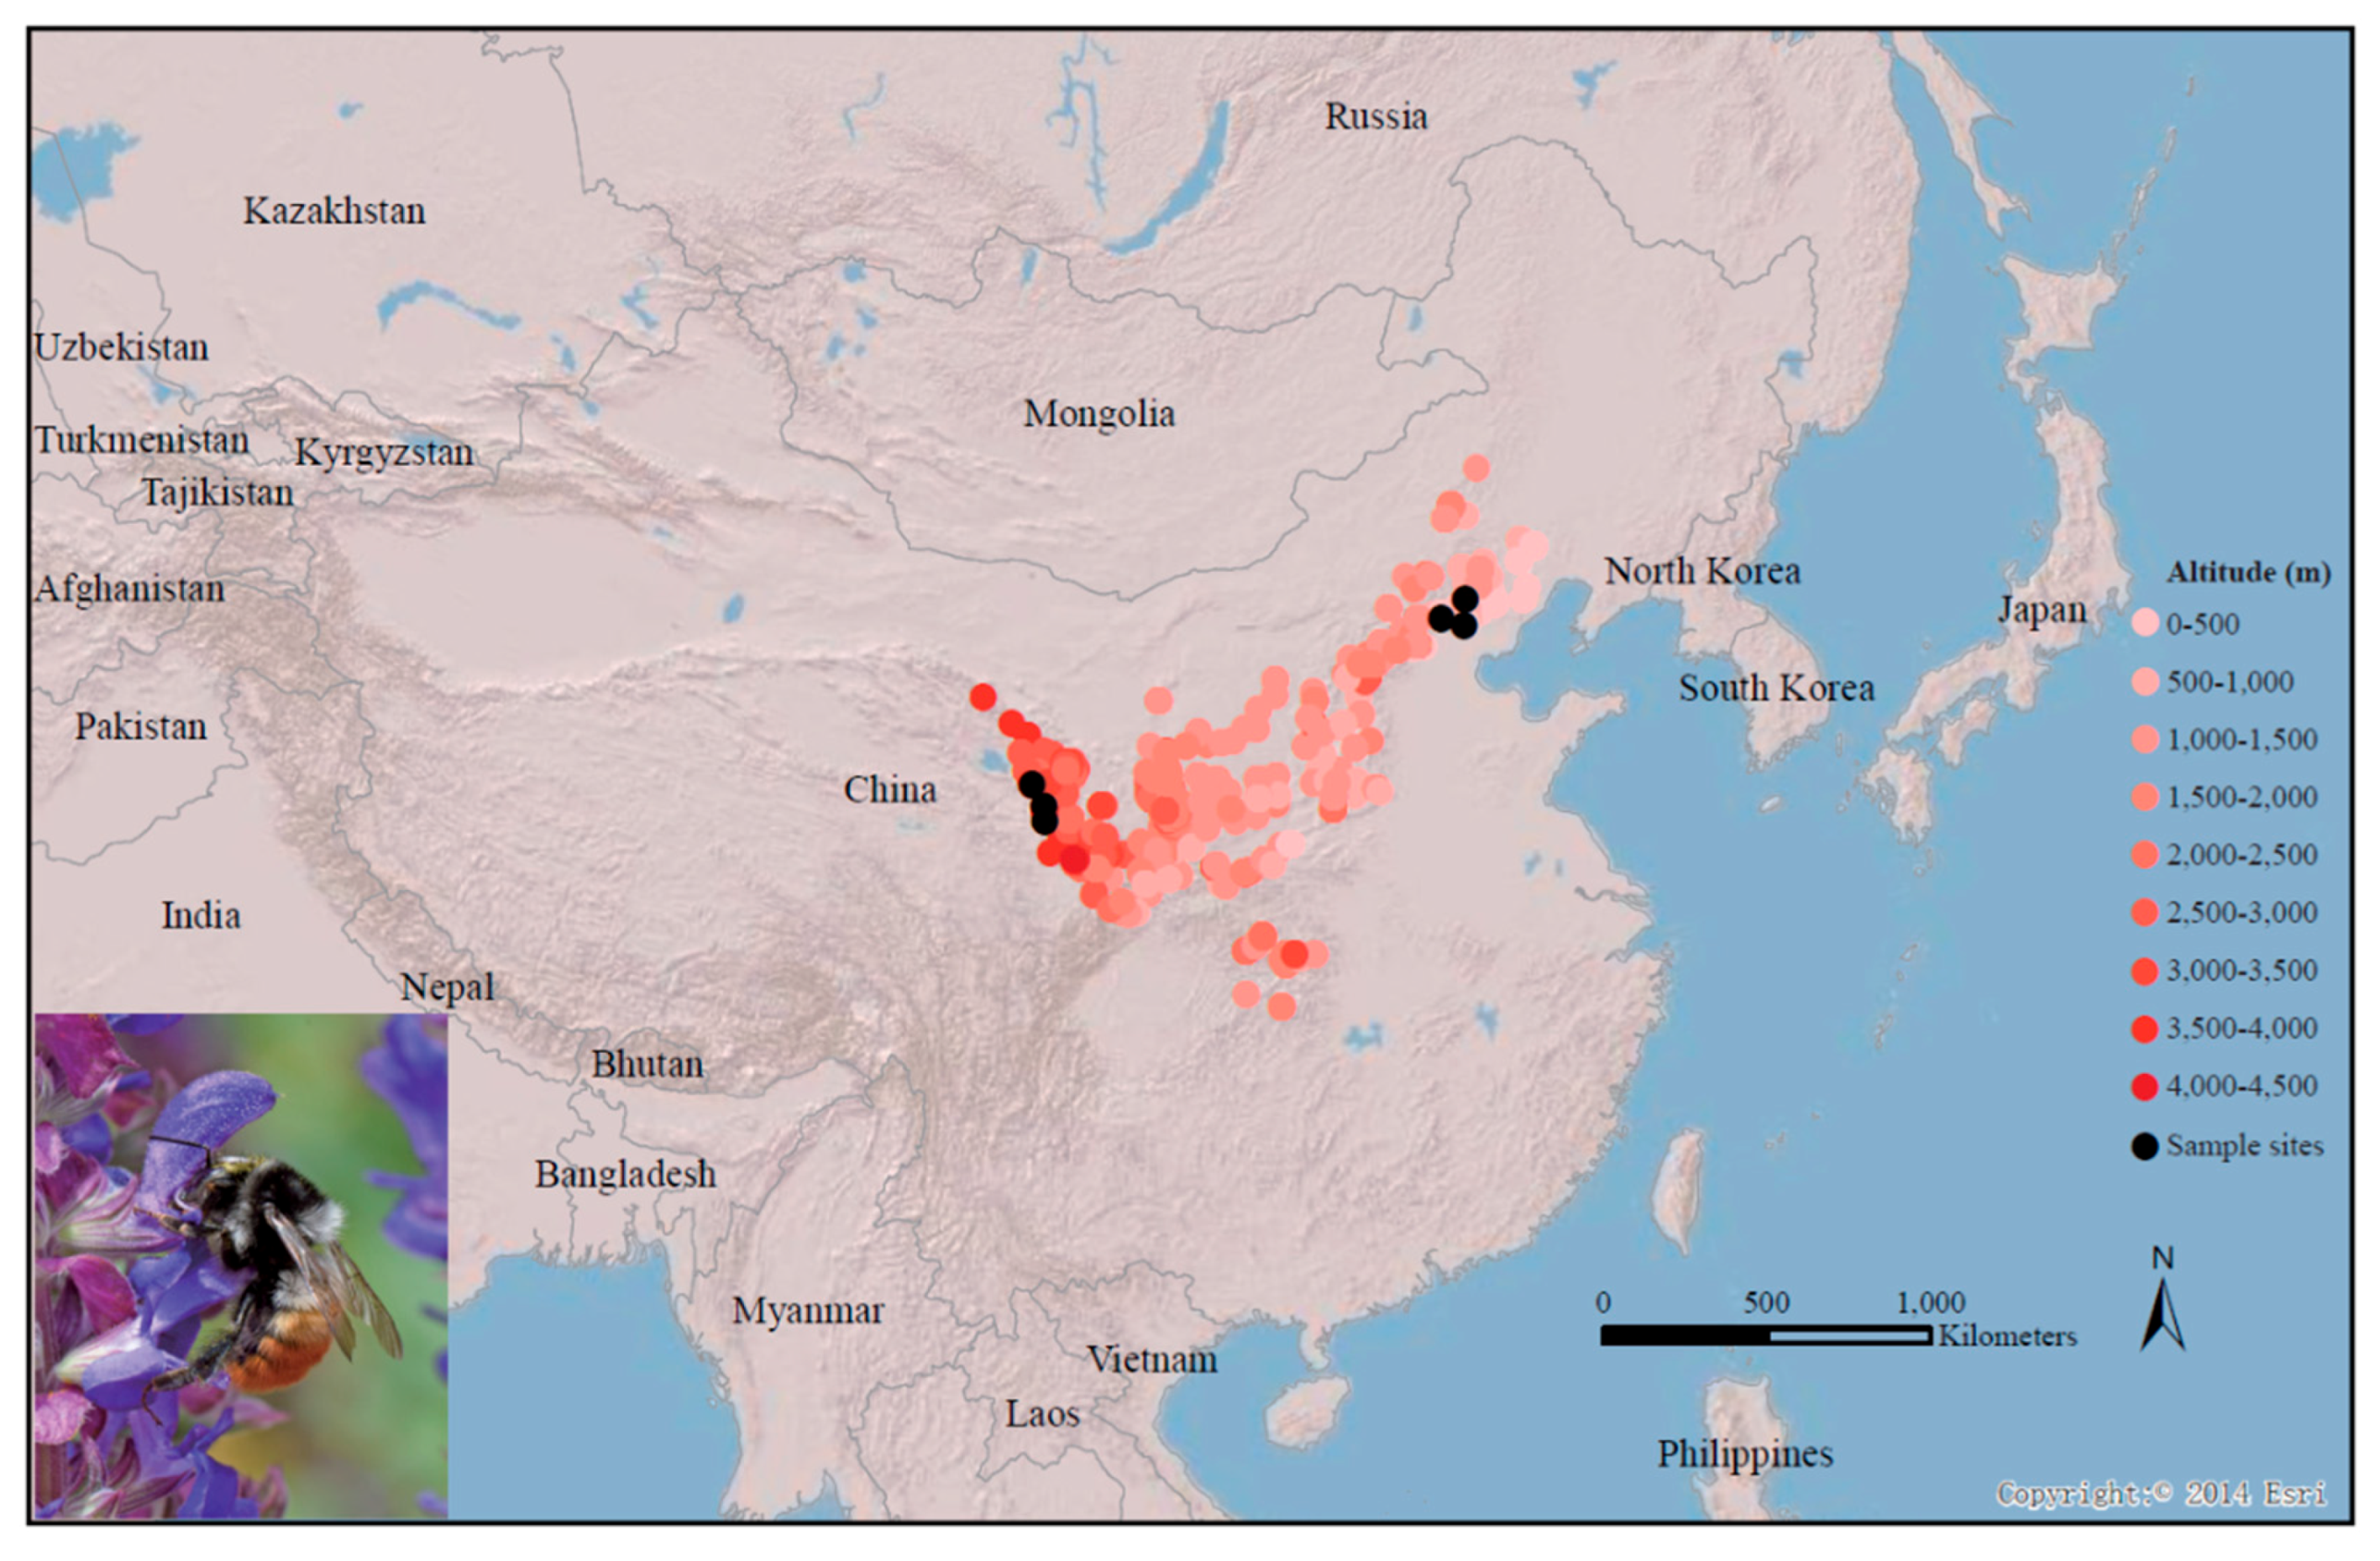
2.1. B. pyrosoma Sample Collection and RNA-Seq
2.2. Transcriptome Assembly and Annotation
2.3. Differentially Expressed Gene Analysis
2.4. GO Enrichment and KEGG Enrichment of Common Differentially Expressed Genes
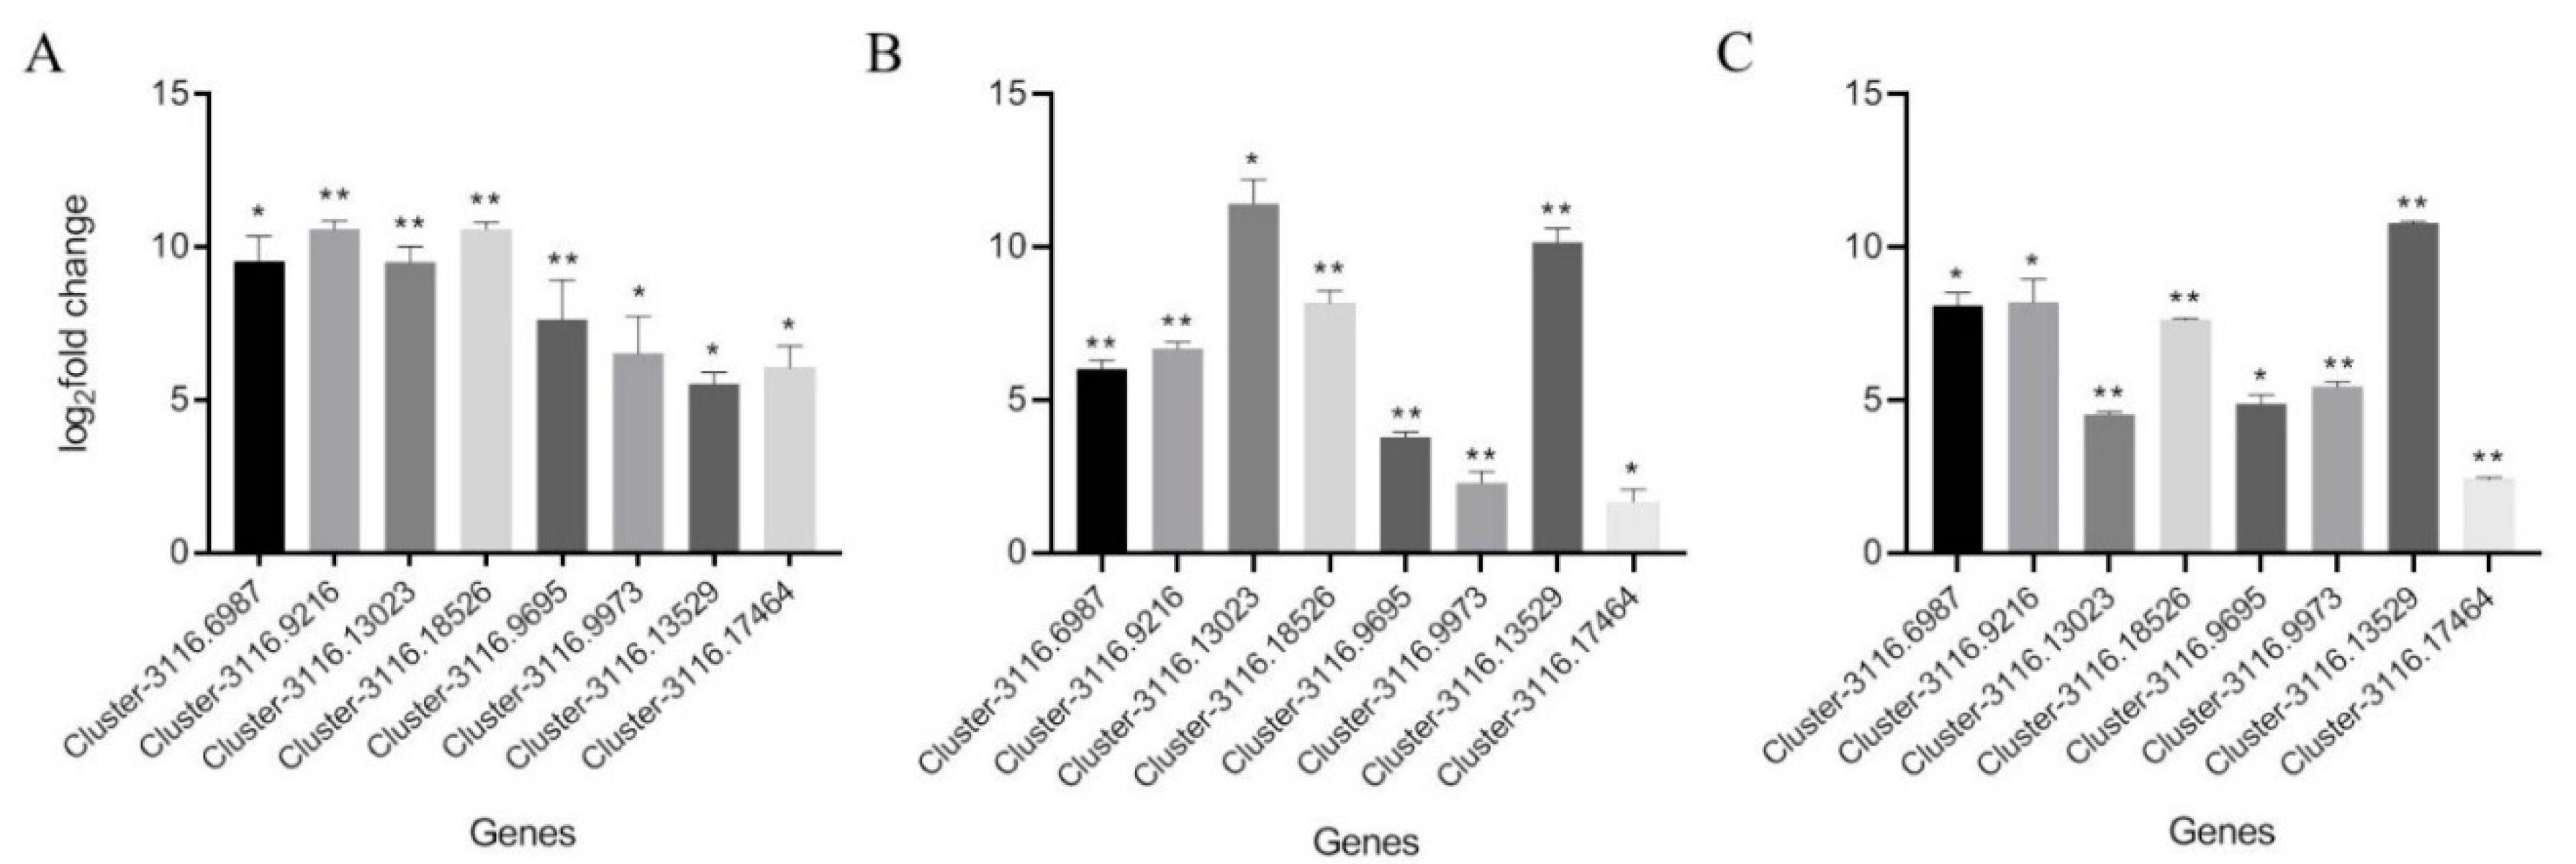
2.5. Real-Time Relative Quantitative PCR Verification of Common Differentially Expressed Genes
2.6. Metabolite Extraction and Metabolomic Analysis of B. pyrosoma Workers
3. Results
3.1. RNA-Seq and De Novo Transcriptomic Annotation of B. pyrosoma
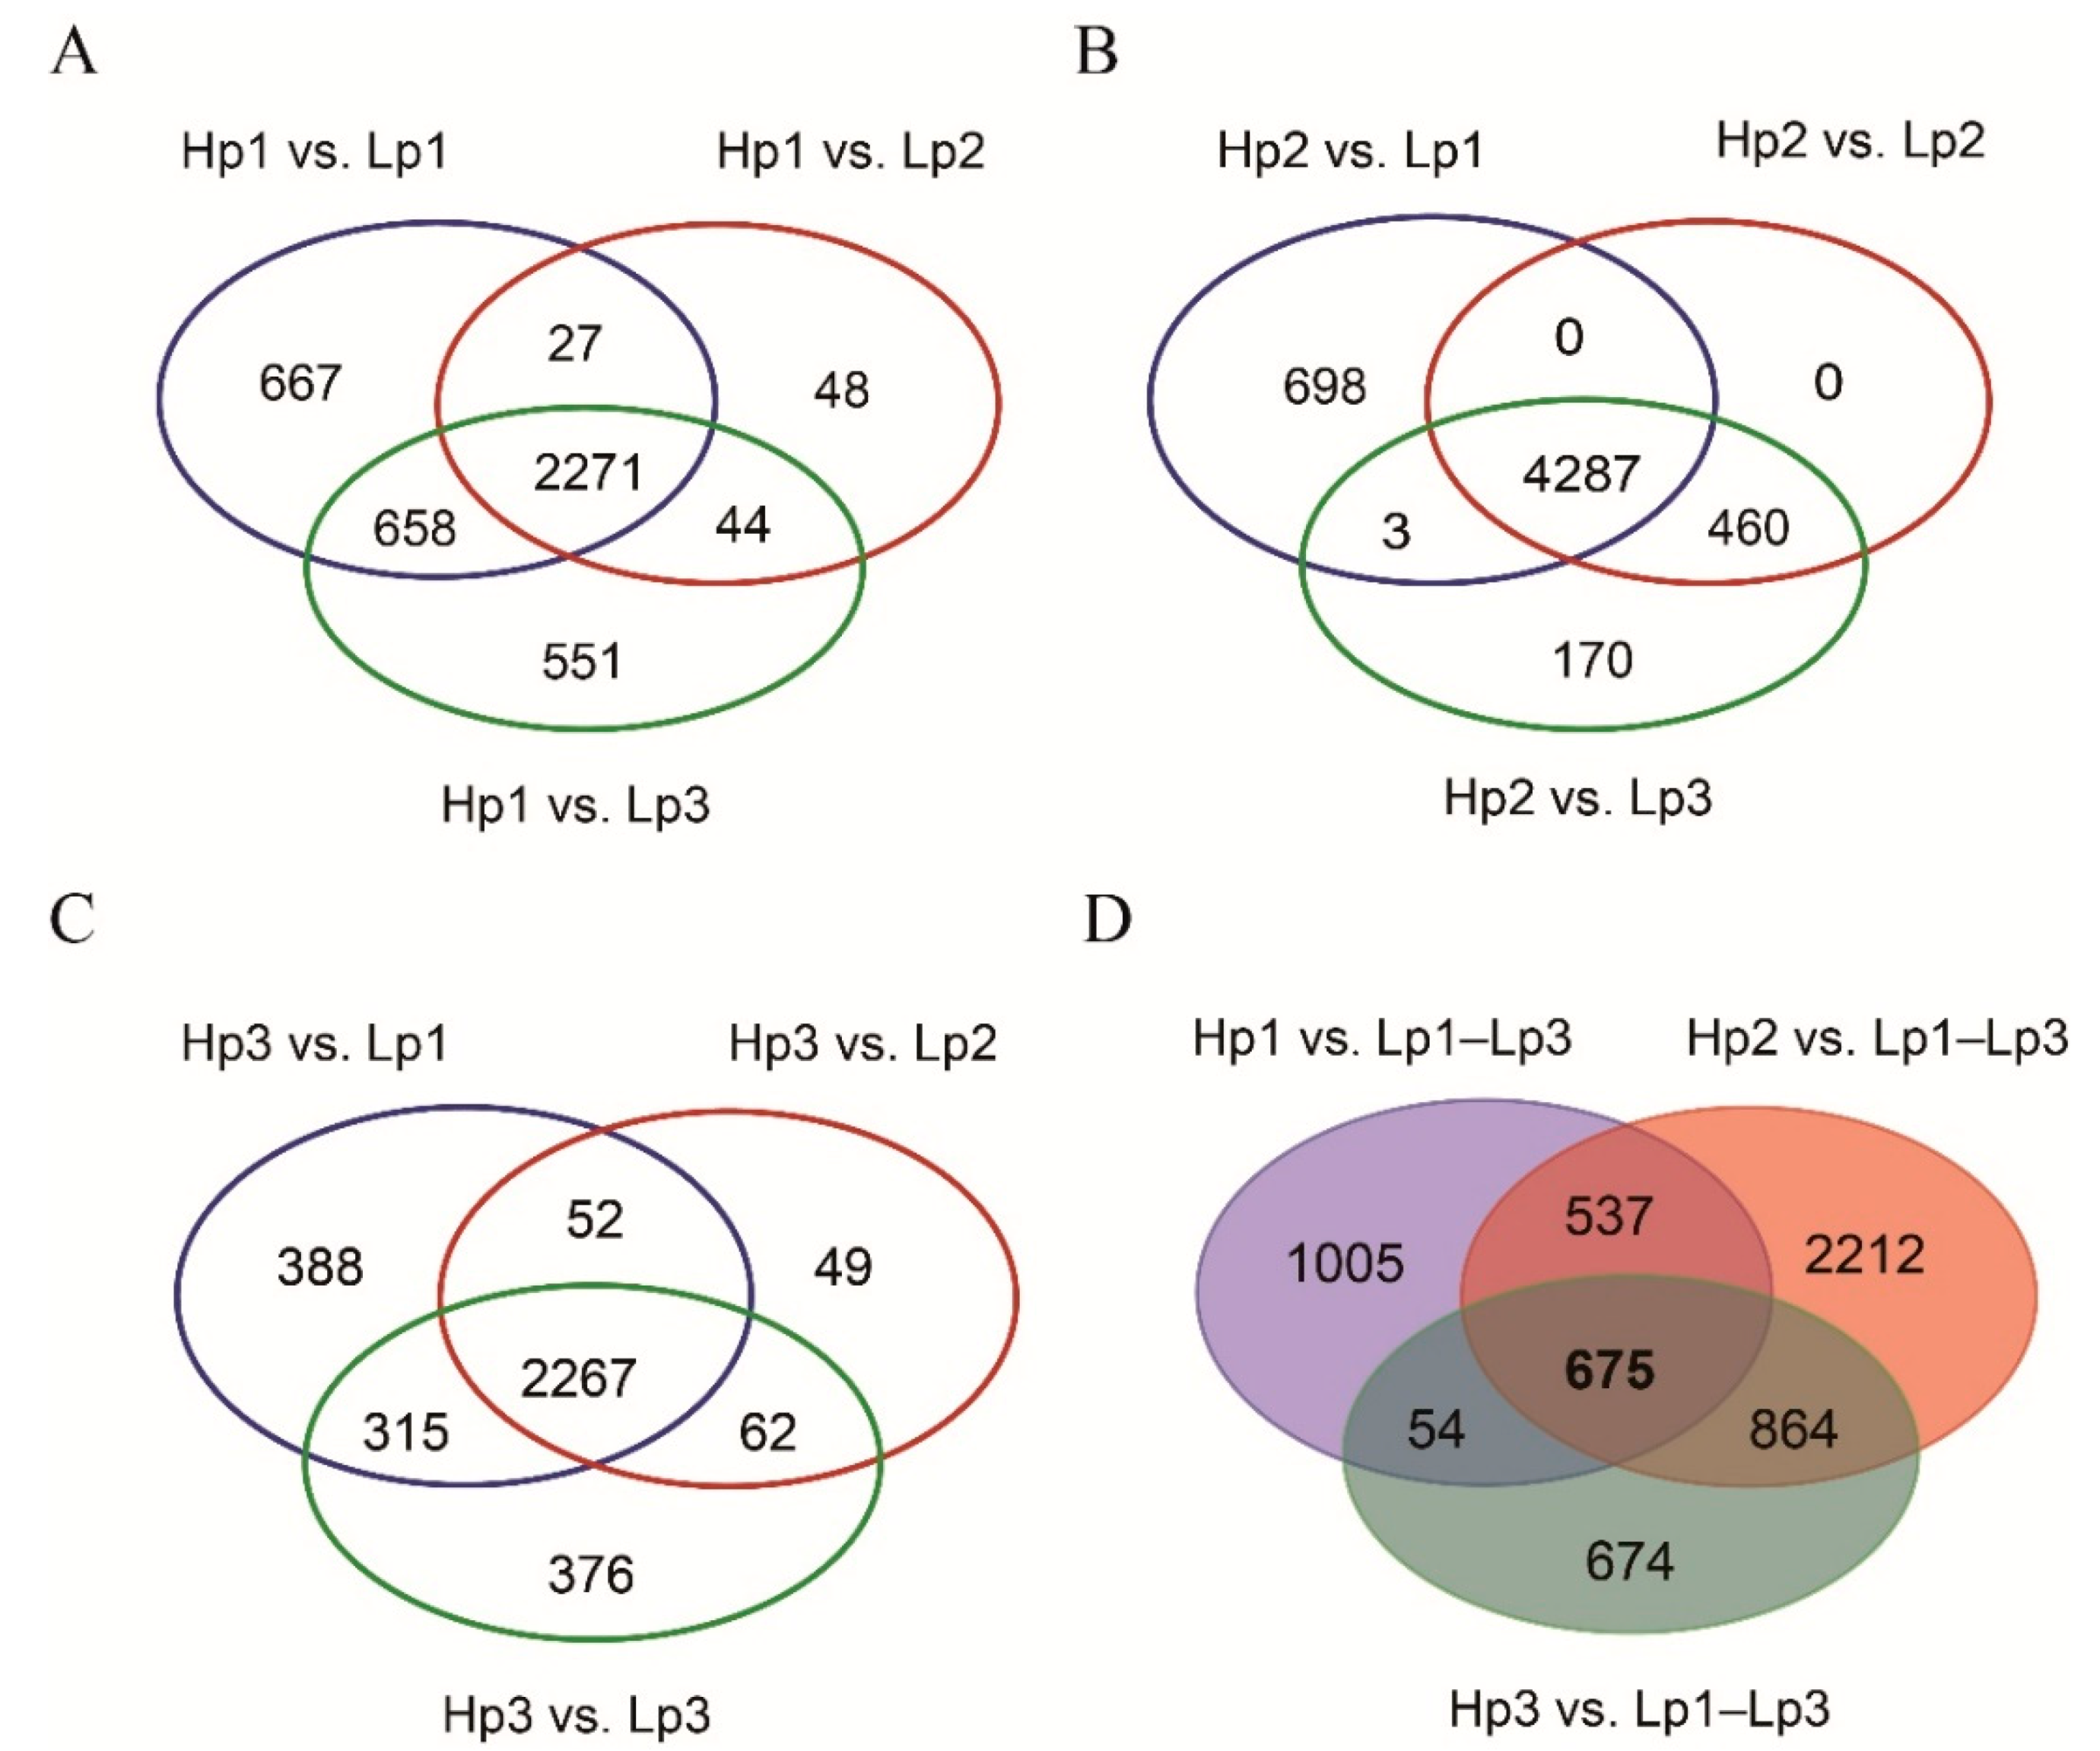
3.2. A Total of 675 Common Upregulated Genes Were Involved in the Adaptation of the High-Altitude B. pyrosoma
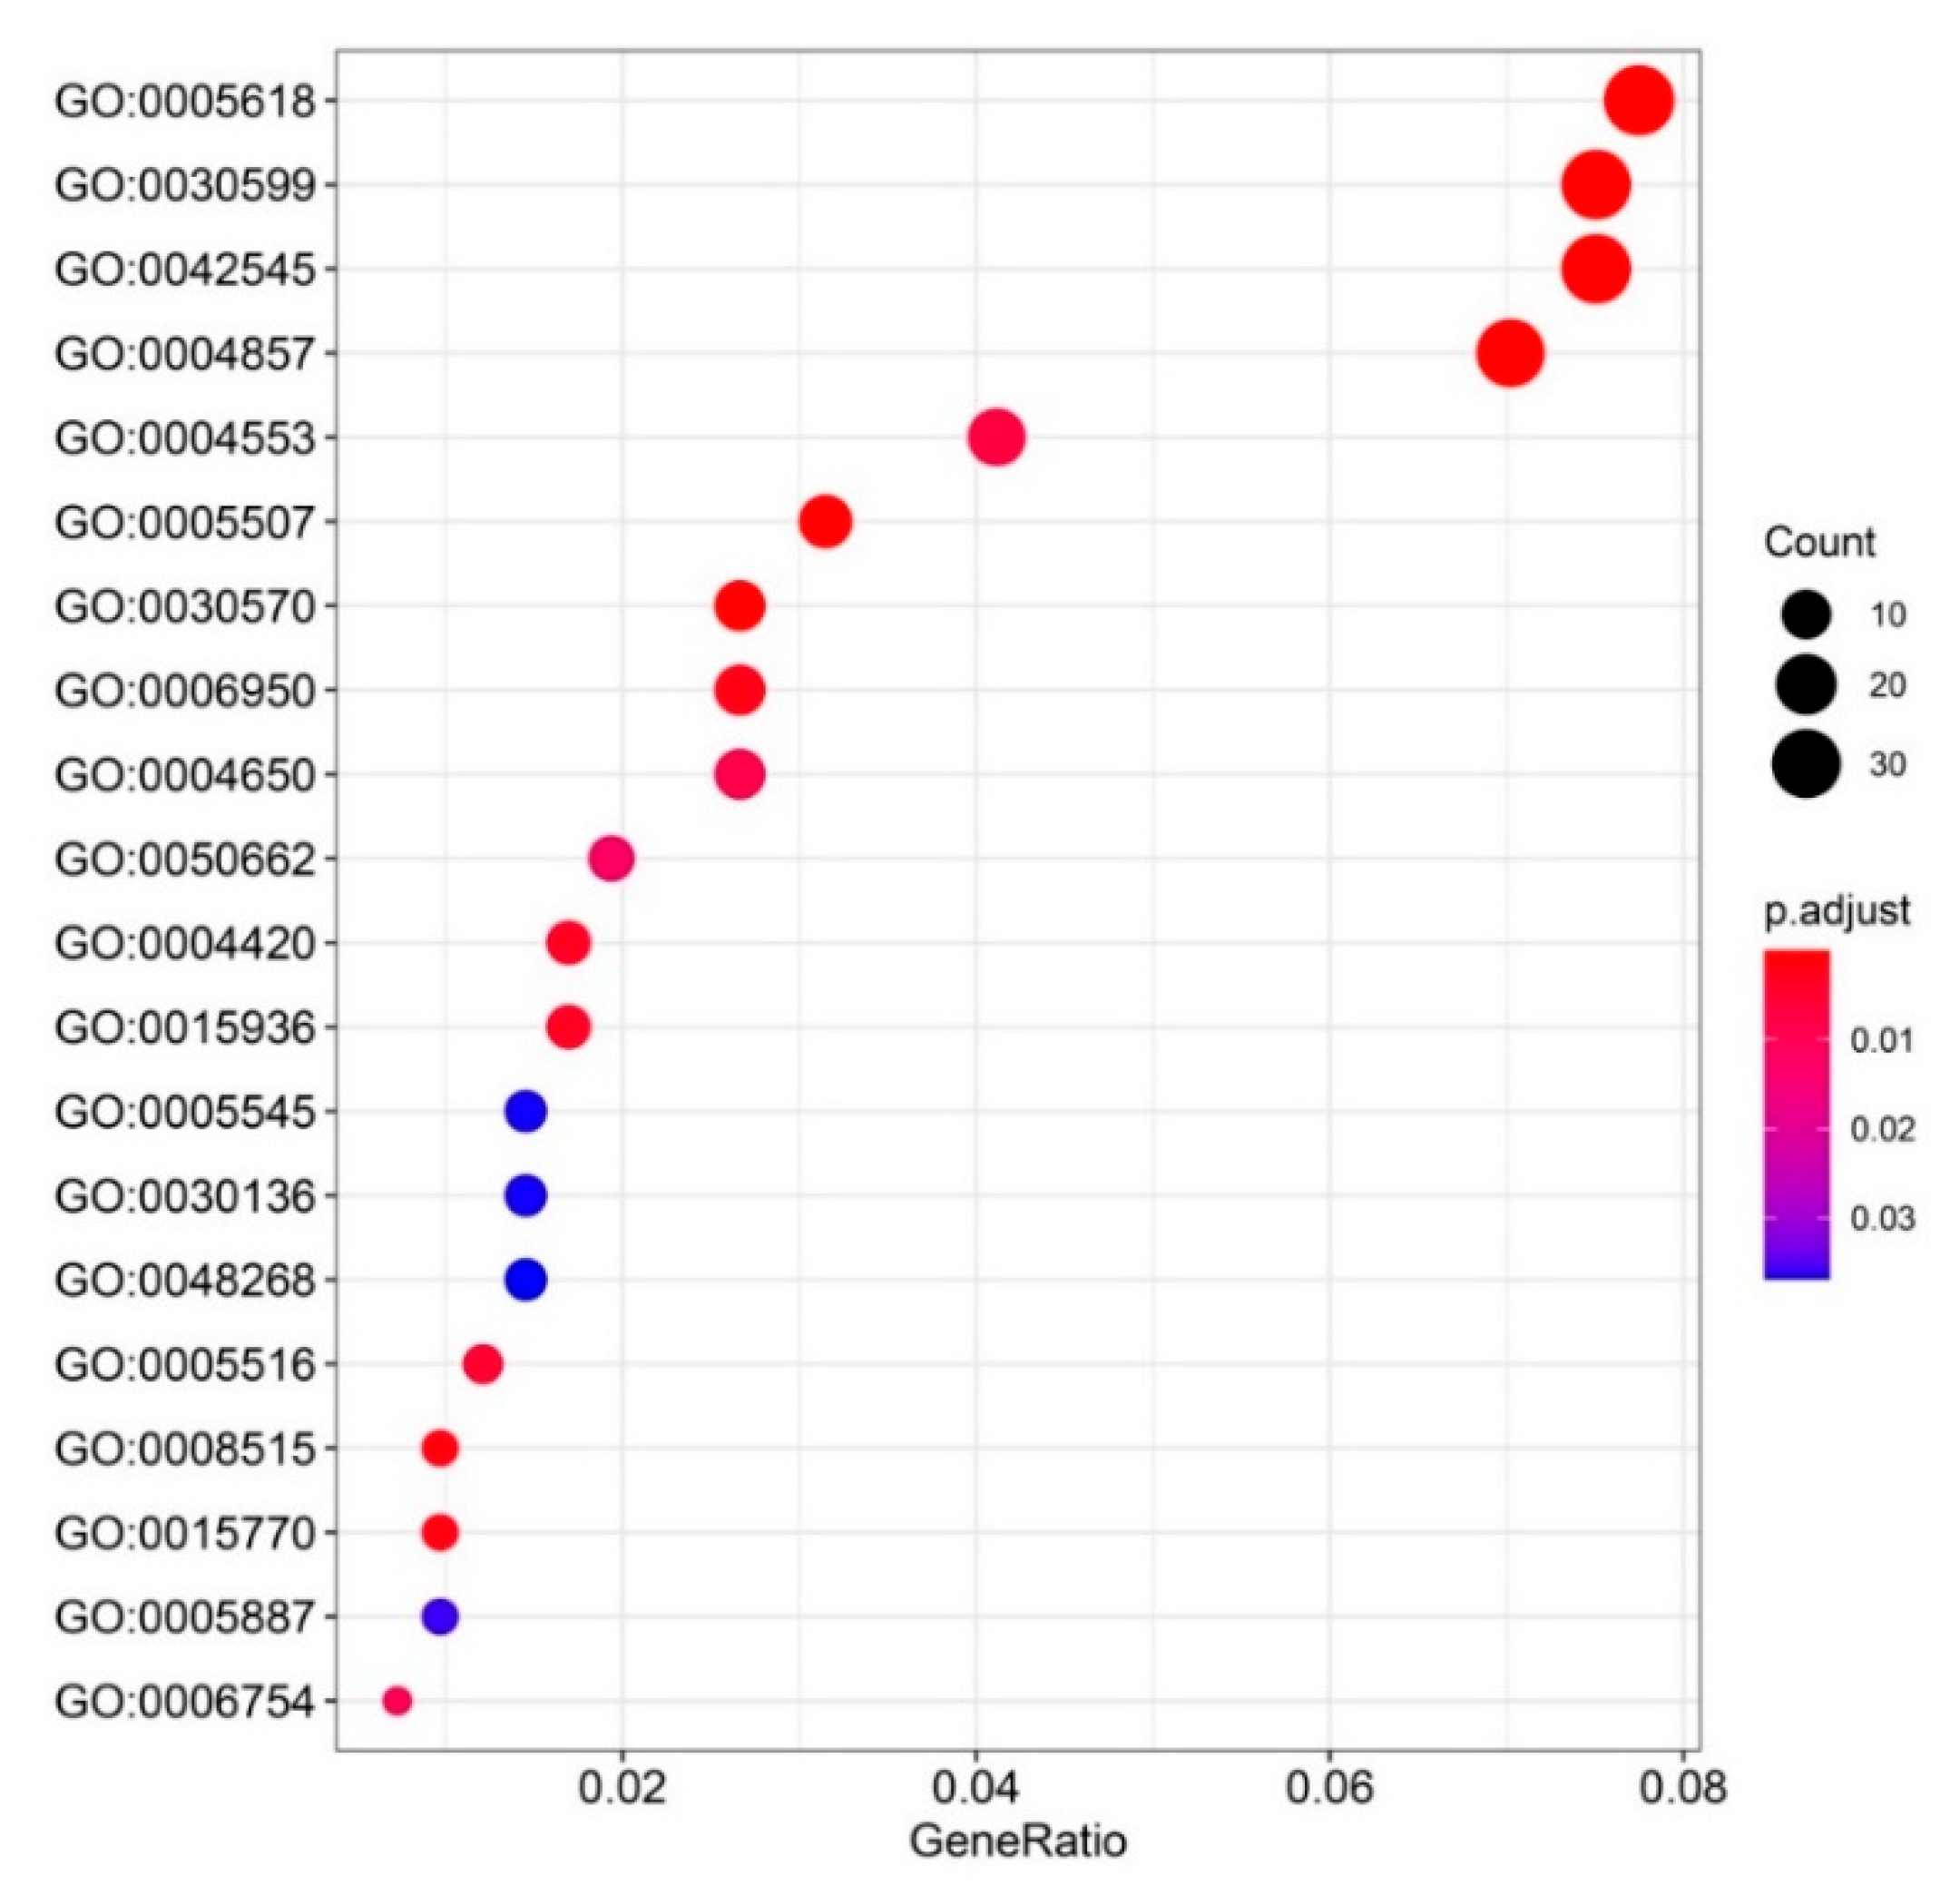
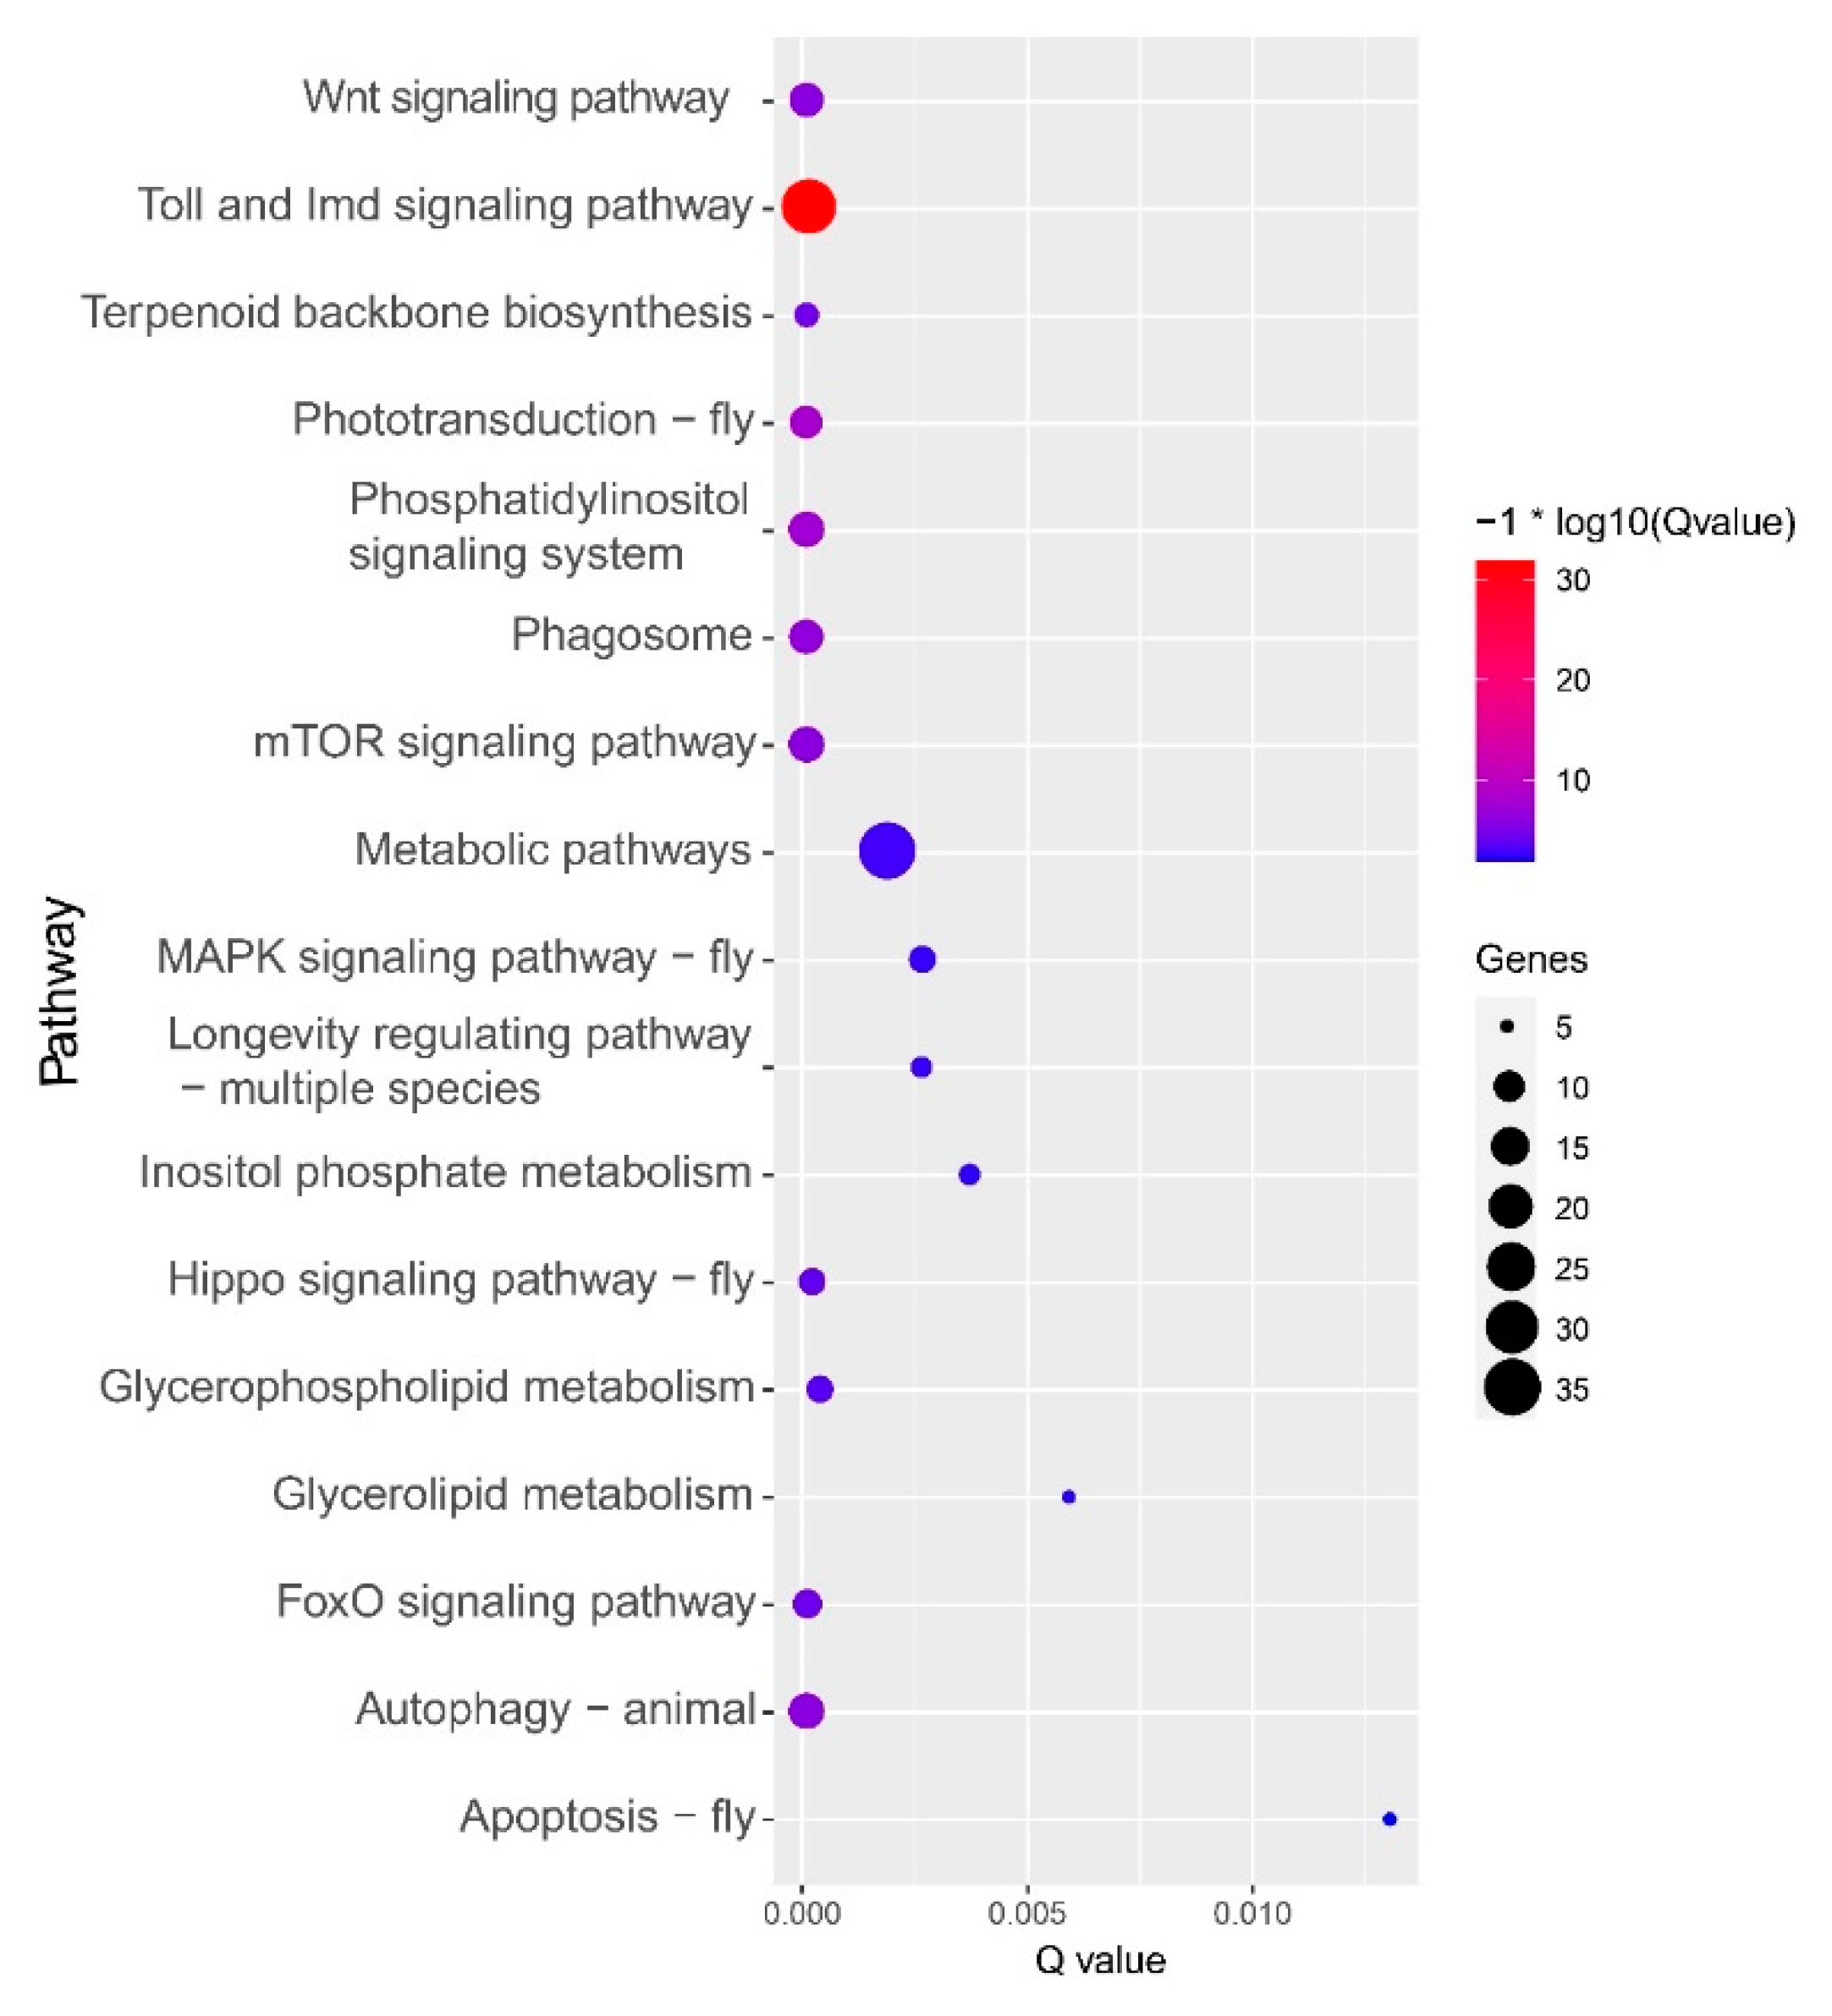
3.3. GO and KEGG Enrichment of the Common Upregulated Genes
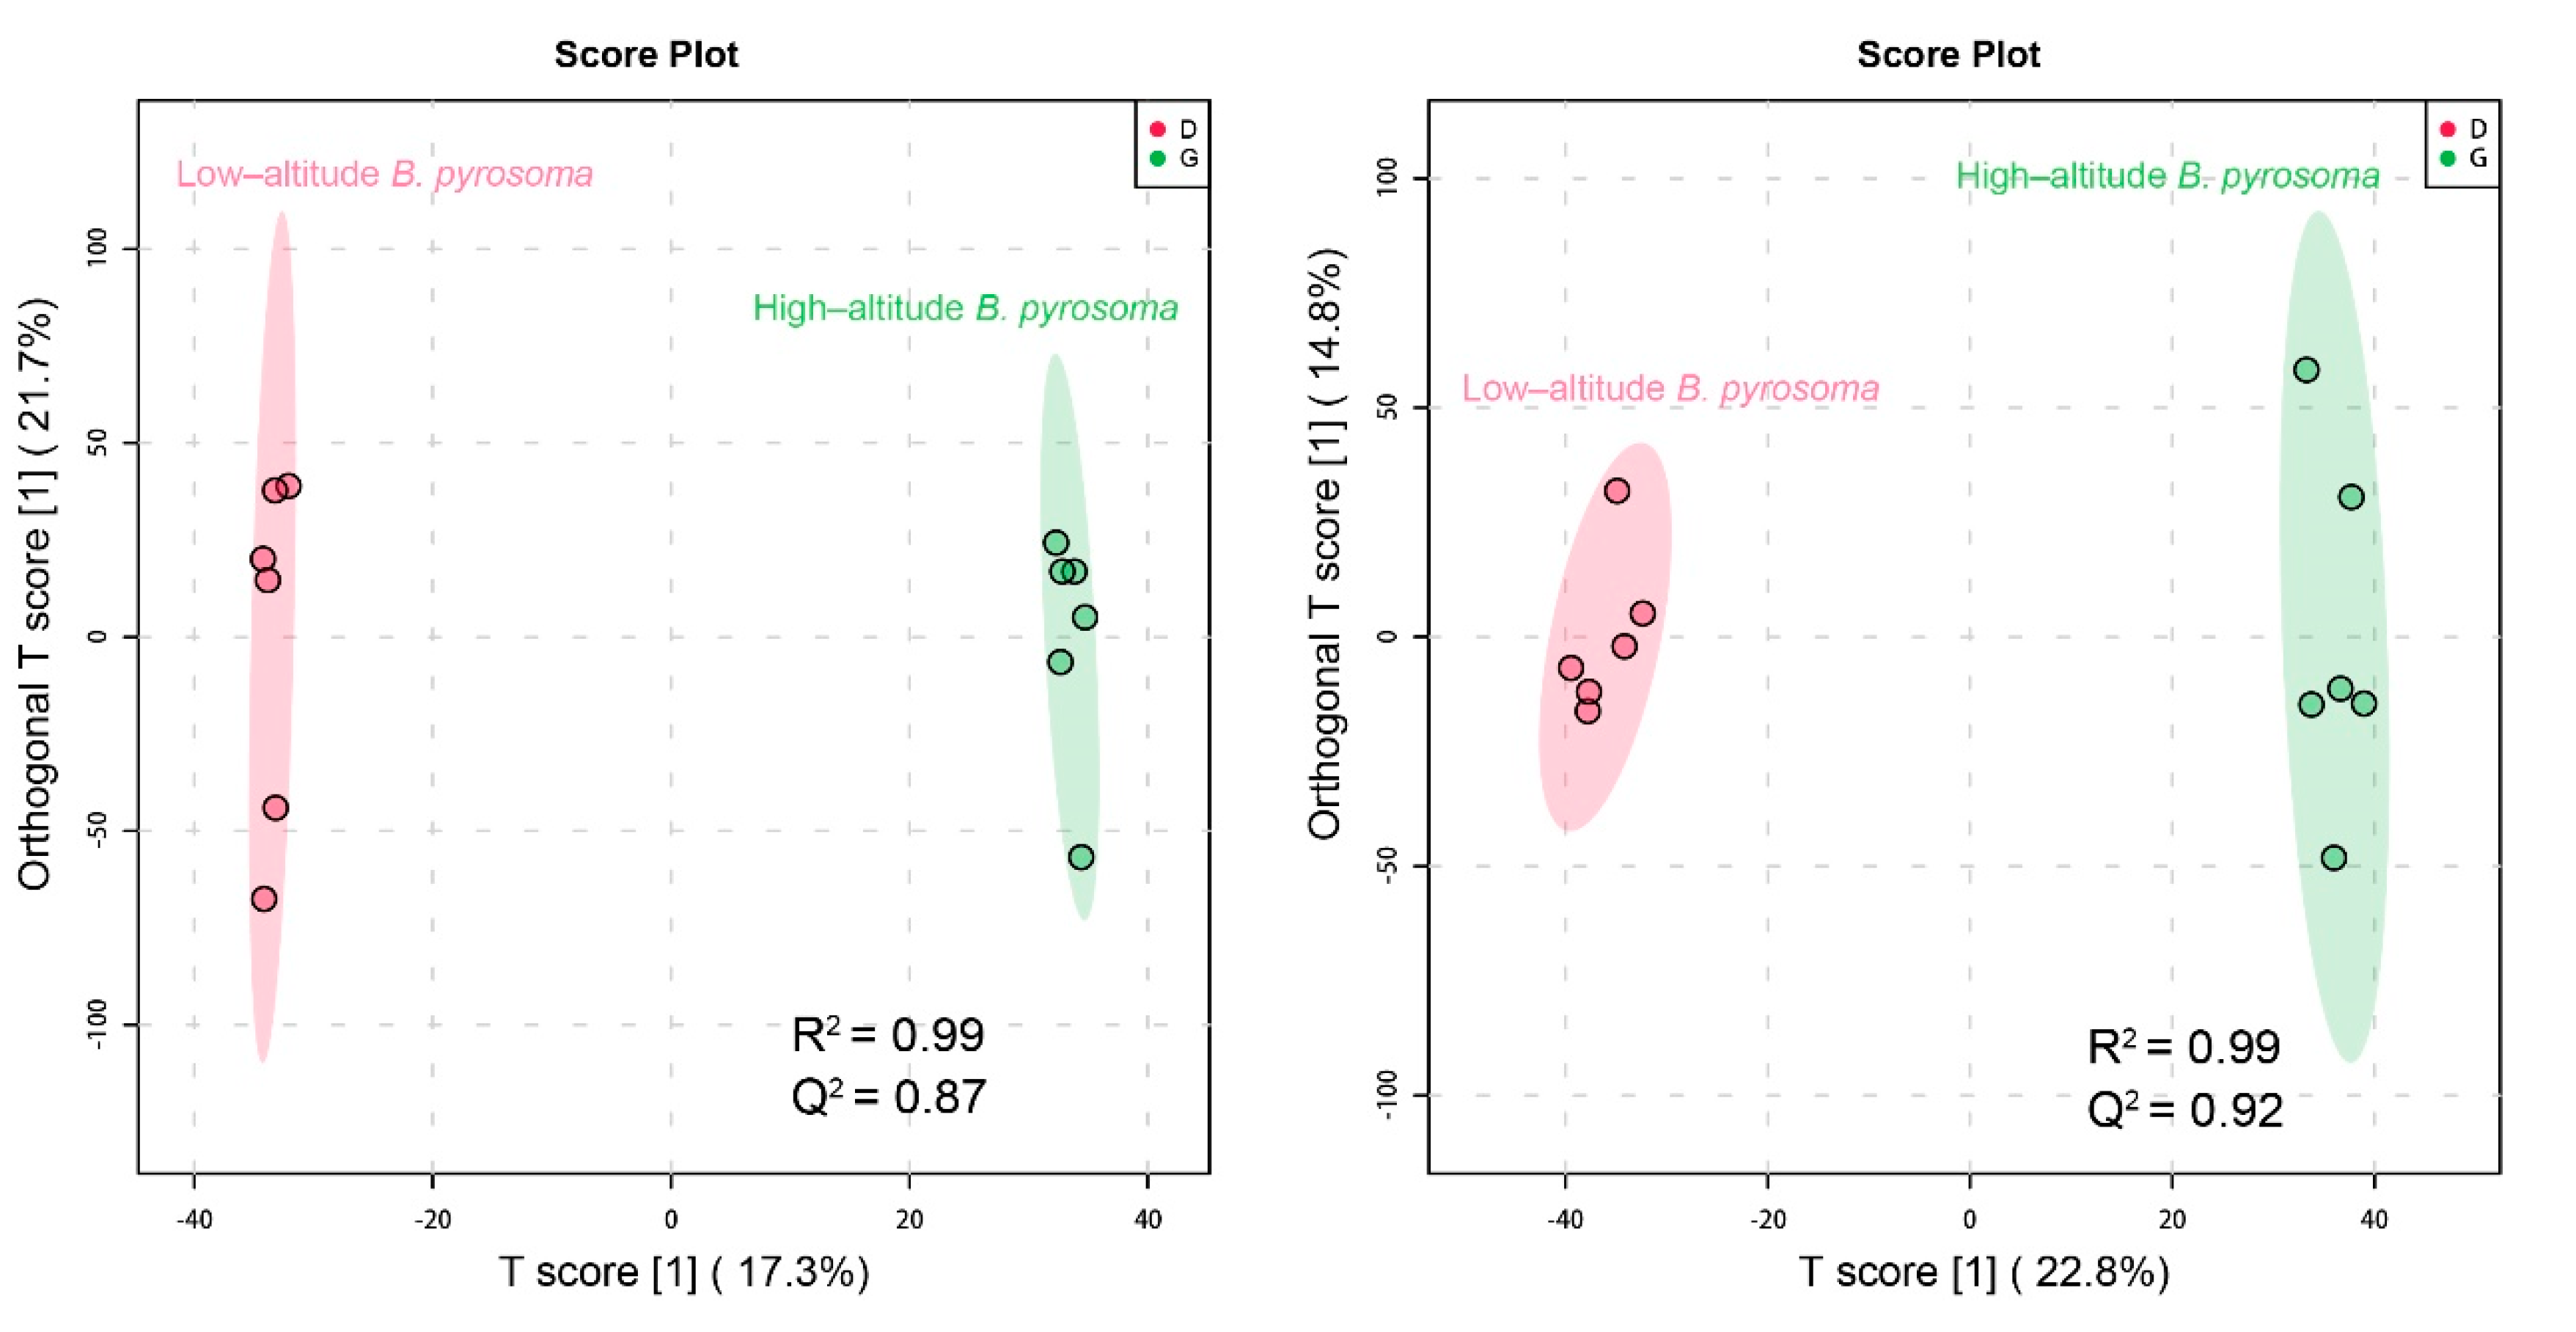
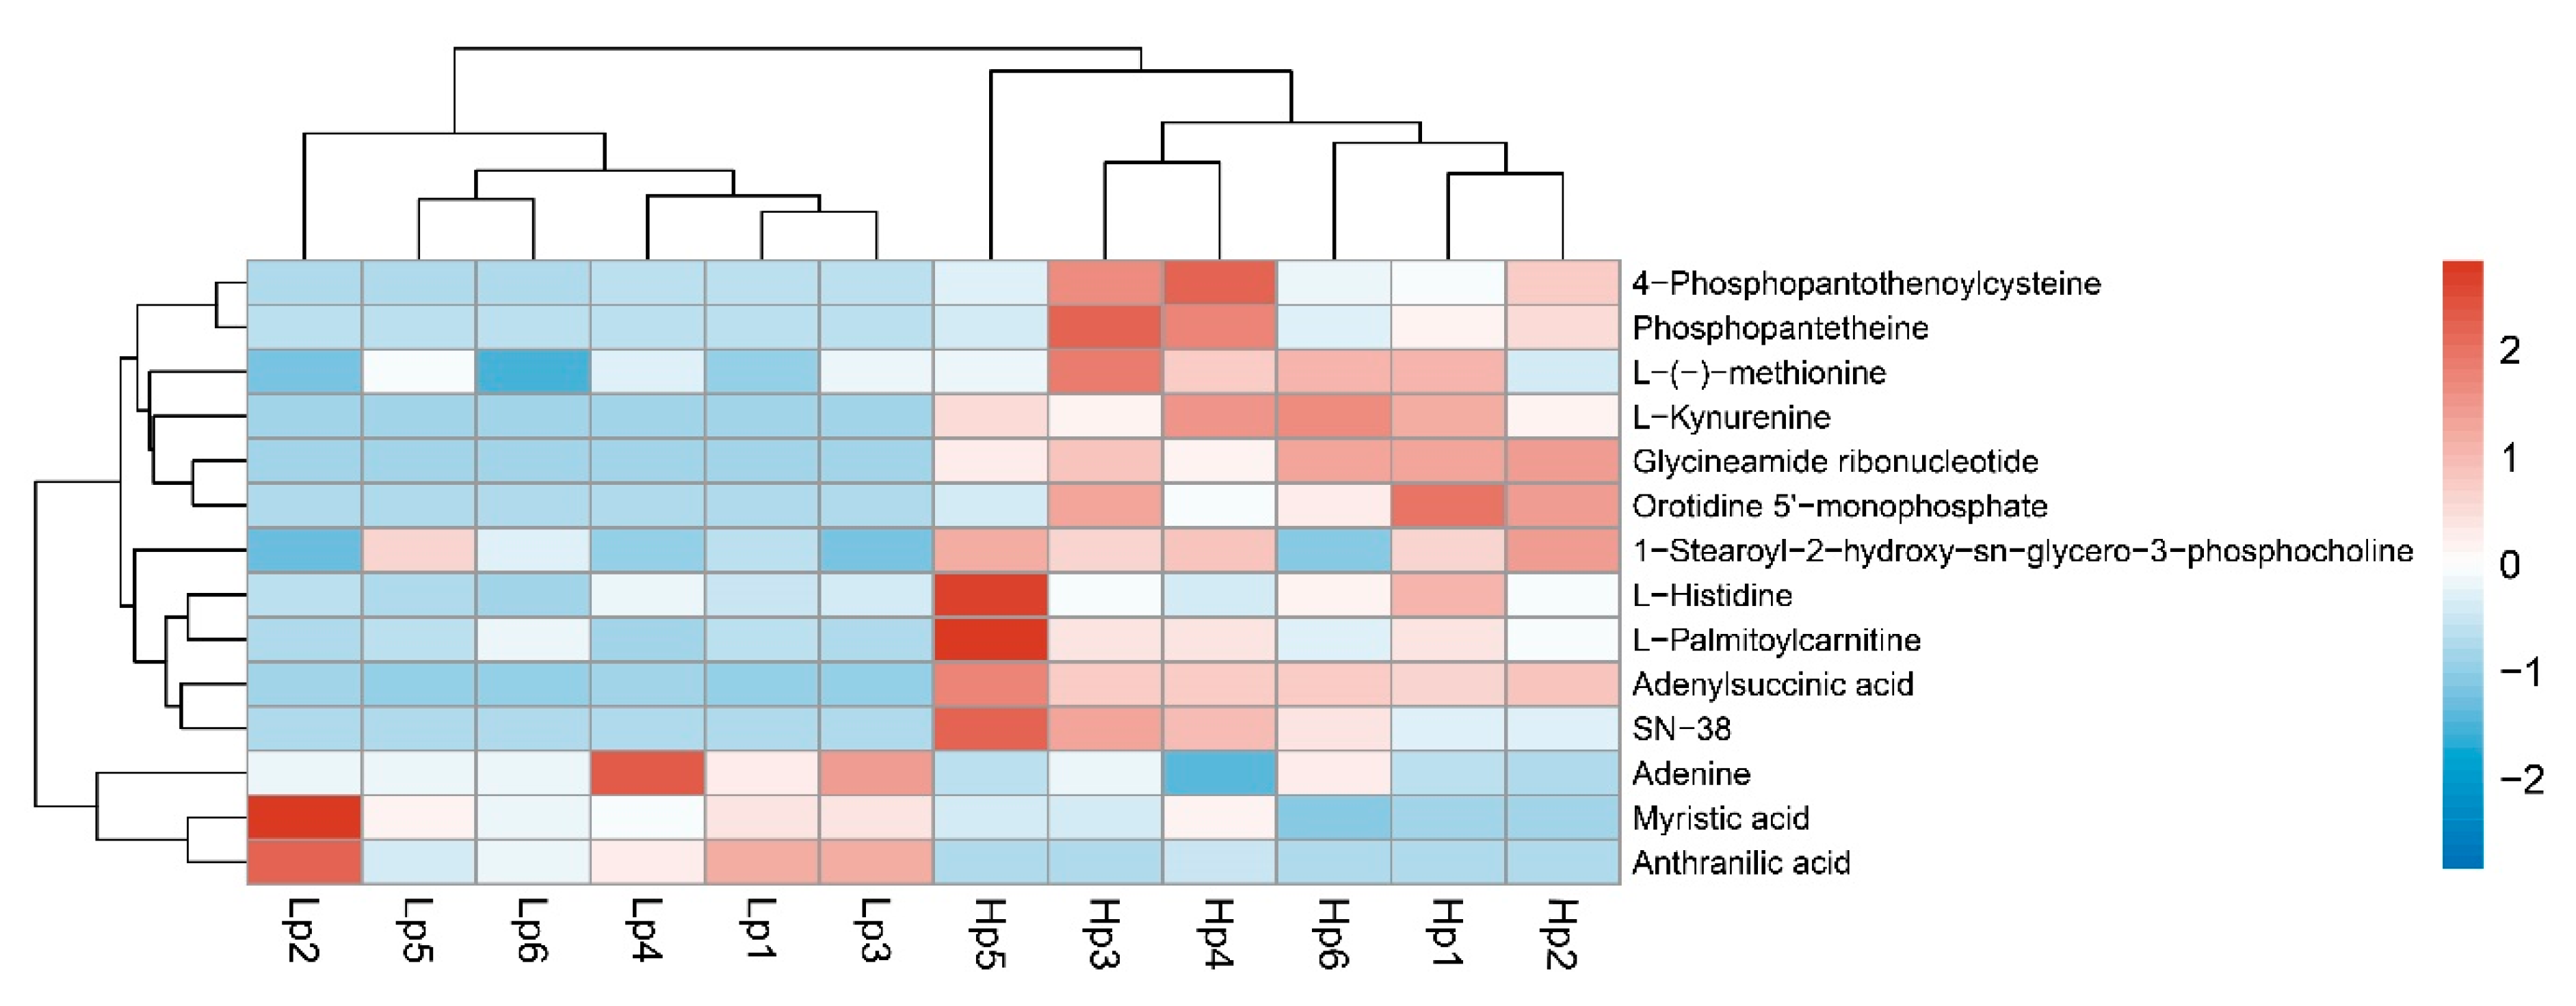
3.4. Metabolic Differences between High- and Low-Altitude B. pyrosoma
4. Discussion
5. Conclusions
Supplementary Materials
Author Contributions
Funding
Acknowledgments
Conflicts of Interest
Abbreviations
| Lg | Low-altitude group |
| Hg | High-altitude group |
References
- Ramirez, J.M.; Folkow, L.P.; Blix, A.S. Hypoxia tolerance in mammals and birds: From the wilderness to the clinic. Annu. Rev. Physiol. 2007, 69, 113–143. [Google Scholar] [CrossRef]
- Bickler, P.E.; Buck, L.T. Hypoxia tolerance in reptiles, amphibians, and fishes: Life with variable oxygen availability. Annu. Rev. Physiol. 2007, 69, 145–170. [Google Scholar] [CrossRef]
- Nilsson, G.E.; Renshaw, G.M. Hypoxic survival strategies in two fishes: Extreme anoxia tolerance in the North European crucian carp and natural hypoxic preconditioning in a coral-reef shark. J. Exp. Biol. 2004, 207, 3131–3139. [Google Scholar] [CrossRef]
- Su, B.; Xiao, C.; Deka, R.; Seielstad, M.T.; Kangwanpong, D.; Xiao, J.; Lu, D.; Underhill, P.; Cavalli-Sforza, L.; Chakraborty, R.; et al. Y chromosome haplotypes reveal prehistorical migrations to the Himalayas. Hum. Genet. 2000, 107, 582–590. [Google Scholar] [CrossRef]
- Azad, P.; Stobdan, T.; Zhou, D.; Hartley, I.; Akbari, A.; Bafna, V.; Haddad, G.G. High-altitude adaptation in humans: From genomics to integrative physiology. J. Mol. Med. 2017, 95, 1269–1282. [Google Scholar] [CrossRef]
- Simonson, T.S.; Yang, Y.; Huff, C.D.; Yun, H.; Qin, G.; Witherspoon, D.J.; Bai, Z.; Lorenzo, F.R.; Xing, J.; Jorde, L.B.; et al. Genetic evidence for high-altitude adaptation in Tibet. Science 2010, 329, 72–75. [Google Scholar] [CrossRef]
- Bigham, A.W. Genetics of human origin and evolution: High-altitude adaptations. Curr. Opin. Genet. Dev. 2016, 41, 8–13. [Google Scholar] [CrossRef]
- Jha, A.R.; Zhou, D.; Brown, C.D.; Kreitman, M.; Haddad, G.G.; White, K.P. Shared genetic signals of hypoxia adaptation in Drosophila and in high-altitude human populations. Mol. Biol. Evol. 2016, 33, 501–517. [Google Scholar] [CrossRef]
- Yu, L.; Wang, G.D.; Ruan, J.; Chen, Y.B.; Yang, C.P.; Cao, X.; Wu, H.; Liu, Y.H.; Du, Z.L.; Wang, X.P.; et al. Genomic analysis of snub-nosed monkeys (Rhinopithecus) identifies genes and processes related to high-altitude adaptation. Nat. Genet. 2016, 48, 947–952. [Google Scholar] [CrossRef]
- Tufts, D.M.; Natarajan, C.; Revsbech, I.G.; Projecto-Garcia, J.; Hoffmann, F.G.; Weber, R.E.; Fago, A.; Moriyama, H.; Storz, J.F. Epistasis constrains mutational pathways of hemoglobin adaptation in high-altitude pikas. Mol. Biol. Evol. 2015, 32, 287–298. [Google Scholar] [CrossRef]
- Wang, M.S.; Li, Y.; Peng, M.S.; Zhong, L.; Wang, Z.J.; Li, Q.Y.; Tu, X.L.; Dong, Y.; Zhu, C.L.; Wang, L.; et al. Genomic analyses reveal potential independent adaptation to high altitude in Tibetan chickens. Mol. Biol. Evol. 2015, 32, 1880–1889. [Google Scholar] [CrossRef]
- Gou, X.; Wang, Z.; Li, N.; Qiu, F.; Xu, Z.; Yan, D.; Yang, S.; Jia, J.; Kong, X.; Wei, Z.; et al. Whole-genome sequencing of six dog breeds from continuous altitudes reveals adaptation to high-altitude hypoxia. Genome Res. 2014, 24, 1308–1315. [Google Scholar] [CrossRef]
- Liu, X.; Yanli, Z.; Yefang, L.; Jianfei, P.; Dandan, W.; Weihuang, C.; Zhuqing, Z.; Xiaohong, H.; Qianjun, Z.; Yabin, P. EPAS1 gain-of-function mutation contributes to high-altitude adaptation in Tibetan horses. Mol. Biol. Evol. 2019, 11, 2591–2603. [Google Scholar] [CrossRef]
- Qiu, Q.; Zhang, G.; Ma, T.; Qian, W.; Wang, J.; Ye, Z.; Cao, C.; Hu, Q.; Kim, J.; Larkin, D.M.; et al. The yak genome and adaptation to life at high altitude. Nat. Genet. 2012, 44, 946–949. [Google Scholar] [CrossRef]
- Huang, J.; An, J. Species diversity, pollination application and strategy for conservation of the bumblebees of China. Biodivers. Sci. 2018, 26, 486–497. [Google Scholar] [CrossRef]
- Dillon, M.E.; Dudley, R. Surpassing Mt. Everest: Extreme flight performance of alpine bumble-bees. Biol. Lett. 2014, 10, 20130922. [Google Scholar] [CrossRef]
- Williams, P.H.; Ito, M.; Matsumura, T.; Kudo, I. The bumblebees of the Nepal Himalaya (Hymenoptera: Apidae). Insecta Matsumurana 2010, 66, 115–151. [Google Scholar]
- Williams, P.H.; Huang, J.X.; Rasmont, P.; An, J.D. Early-diverging bumblebees from across the roof of the world: The high-mountain subgenus Mendacibombus revised from species’ gene coalescents and morphology (Hymenoptera, Apidae). Zootaxa 2016, 4204. [Google Scholar] [CrossRef]
- An, J.; Huang, J.; Shao, Y.; Zhang, S.; Wang, B.; Liu, X.; Wu, J.; Williams, P.H. The bumblebees of North China (Apidae, Bombus latreille). Zootaxa 2014, 3830, 1–89. [Google Scholar] [CrossRef]
- Hodkinson, I.D. Terrestrial insects along elevation gradients: Species and community responses to altitude. Biol. Rev. Camb. Philos. Soc. 2005, 80, 489–513. [Google Scholar] [CrossRef]
- Grabherr, M.G.; Haas, B.J.; Yassour, M.; Levin, J.Z.; Thompson, D.A.; Amit, I.; Adiconis, X.; Fan, L.; Raychowdhury, R.; Zeng, Q.; et al. Full-length transcriptome assembly from RNA-Seq data without a reference genome. Nat. Biotechnol. 2011, 29, 644–652. [Google Scholar] [CrossRef]
- Trapnell, C.; Williams, B.A.; Pertea, G.; Mortazavi, A.; Kwan, G.; van Baren, M.J.; Salzberg, S.L.; Wold, B.J.; Pachter, L. Transcript assembly and quantification by RNA-Seq reveals unannotated transcripts and isoform switching during cell differentiation. Nat. Biotechnol. 2010, 28, 511–515. [Google Scholar] [CrossRef]
- Anders, S.; Huber, W. Differential expression analysis for sequence count data. Genome. Biol. 2010, 11, R106. [Google Scholar] [CrossRef]
- Benjamini, Y.; Hochberg, Y. Controlling the false discovery rate—A practical and powerful approach to multiple testing. J. R. Stat. Soc. Ser. B. Met. 1995, 57, 289–300. [Google Scholar] [CrossRef]
- Kanehisa, M.; Araki, M.; Goto, S.; Hattori, M.; Hirakawa, M.; Itoh, M.; Katayama, T.; Kawashima, S.; Okuda, S.; Tokimatsu, T. KEGG for linking genomes to life and the environment. Nucleic Acids Res. 2007, 36, 480–484. [Google Scholar] [CrossRef]
- Quevillon, E.; Silventoinen, V.; Pillai, S.; Harte, N.; Mulder, N.; Apweiler, R.; Lopez, R. InterProScan: Protein domains identifier. Nucleic Acids Res. 2005, 33, W116–W120. [Google Scholar] [CrossRef]
- Xie, C.; Mao, X.; Huang, J.; Ding, Y.; Wu, J.; Dong, S.; Kong, L.; Gao, G.; Li, C.; Wei, L. KOBAS 2.0: A web server for annotation and identification of enriched pathways and diseases. Nucleic Acids Res. 2011, 39, 316–322. [Google Scholar] [CrossRef]
- Schmittgen, T.D.; Livak, K.J. Analyzing real-time PCR data by the comparative C(T) method. Nat. Protoc. 2008, 3, 1101–1108. [Google Scholar] [CrossRef]
- Peng, Y.; Cui, C.; He, Y.; Ouzhuluobu; Zhang, H.; Yang, D.; Zhang, Q.; Bianbazhuoma; Yang, L.; He, Y.; et al. Down-regulation of EPAS1 transcription and genetic adaptation of Tibetans to high-altitude hypoxia. Mol. Biol. Evol. 2017, 34, 818–830. [Google Scholar]
- Zhang, W.; Fan, Z.; Han, E.; Hou, R.; Zhang, L.; Galaverni, M.; Huang, J.; Liu, H.; Silva, P.; Li, P.; et al. Hypoxia adaptations in the grey wolf (Canis lupus chanco) from Qinghai-Tibet Plateau. PLoS Genet. 2014, 10, e1004466. [Google Scholar] [CrossRef]
- Suarez, R.K.; Darveau, C.A.; Welch, K.C., Jr.; O’Brien, D.M.; Roubik, D.W.; Hochachka, P.W. Energy metabolism in orchid bee flight muscles: Carbohydrate fuels all. J. Exp. Biol. 2005, 208, 3573–3579. [Google Scholar] [CrossRef]
- Roy, R.; Schmitt, A.J.; Thomas, J.B.; Carter, C.J. Review: Nectar biology: From molecules to ecosystems. Plant. Sci. Int. J. Exp. Plant. Biol. 2017, 262, 148–164. [Google Scholar] [CrossRef]
- Davaapil, H.; Tsuchiya, Y.; Gout, I. Signalling functions of coenzyme A and its derivatives in mammalian cells. Biochem. Soc. Trans. 2014, 42, 1056–1062. [Google Scholar] [CrossRef]
- Gout, I. Coenzyme A, protein CoAlation and redox regulation in mammalian cells. Biochem. Soc. Trans. 2018, 46, 721–728. [Google Scholar] [CrossRef]
- Dillon, M.E.; Frazier, M.R.; Dudley, R. Into thin air: Physiology and evolution of alpine insects. Integr. Comp. Biol. 2006, 46, 49–61. [Google Scholar] [CrossRef]
- Ghabrial, A.; Luschnig, S.; Metzstein, M.M.; Krasnow, M.A. Branching morphogenesis of the Drosophila tracheal system. Annu. Rev. Cell Dev. Biol. 2003, 19, 623–647. [Google Scholar] [CrossRef]
- Harrison, J.F.; Roberts, S.P. Flight respiration and energetics. Annu. Rev. Physiol. 2000, 62, 179–205. [Google Scholar] [CrossRef]
- Mizushima, N. Autophagy: Process and function. Genes Dev. 2007, 21, 2861–2873. [Google Scholar] [CrossRef]
- Laplante, M.; Sabatini, D.M. mTOR signaling in growth control and disease. Cell 2012, 149, 274–293. [Google Scholar] [CrossRef]
- Juhasz, G.; Erdi, B.; Sass, M.; Neufeld, T.P. Atg7-dependent autophagy promotes neuronal health, stress tolerance, and longevity but is dispensable for metamorphosis in Drosophila. Genes Dev. 2007, 21, 3061–3066. [Google Scholar] [CrossRef]
- Scott, R.C.; Schuldiner, O.; Neufeld, T.P. Role and regulation of starvation-induced autophagy in the Drosophila fat body. Dev. Cell 2004, 7, 167–178. [Google Scholar] [CrossRef]
- Arrese, E.L.; Soulages, J.L. Insect fat body: Energy, metabolism, and regulation. Annu. Rev. Entomol. 2010, 55, 207–225. [Google Scholar] [CrossRef]
- Kim, J.; Kundu, M.; Viollet, B.; Guan, K.L. AMPK and mTOR regulate autophagy through direct phosphorylation of Ulk1. Nat. Cell Biol. 2011, 13, 132–141. [Google Scholar] [CrossRef]
- De Gregorio, E.; Spellman, P.T.; Tzou, P.; Rubin, G.M.; Lemaitre, B. The Toll and Imd pathways are the major regulators of the immune response in Drosophila. EMBO J. 2002, 21, 2568–2579. [Google Scholar] [CrossRef]
- Xu, J.; James, R.R. Temperature stress affects the expression of immune response genes in the alfalfa leafcutting bee, Megachile rotundata. Insect Mol. Biol. 2012, 21, 269–280. [Google Scholar] [CrossRef]
- Zhang, J.; Marshall, K.E.; Westwood, J.T.; Clark, M.S.; Sinclair, B.J. Divergent transcriptomic responses to repeated and single cold exposures in Drosophila melanogaster. J. Exp. Biol. 2011, 214, 4021–4029. [Google Scholar] [CrossRef]
- Bandarra, D.; Biddlestone, J.; Mudie, S.; Muller, H.A.; Rocha, S. Hypoxia activates IKK-NF-κB and the immune response in Drosophila melanogaster. Biosci. Rep. 2014, 34, e00127. [Google Scholar] [CrossRef]
- Hetru, C.; Hoffmann, J.A. NF-κB in the immune response of Drosophila. Cold Spring Harb. Perspect. Biol. 2009, 1, a000232. [Google Scholar] [CrossRef]


| Samples | Raw Reads | Clean Reads | Clean Bases | Error Rate | Q20 | Q30 | GC (%) |
|---|---|---|---|---|---|---|---|
| Hg1_1 | 49,658,386 | 48,916,486 | 7.34G | 0.03 | 97.12 | 92.05 | 41.9 |
| Hg1_2 | 60,422,470 | 59,299,792 | 8.89G | 0.03 | 97.44 | 92.75 | 42.01 |
| Hg1_3 | 54,353,120 | 53,521,080 | 8.03G | 0.03 | 97.54 | 92.95 | 42.42 |
| Hg2_1 | 58,759,526 | 57,894,918 | 8.68G | 0.03 | 97.62 | 93.15 | 40.92 |
| Hg2_2 | 66,679,540 | 65,591,808 | 9.84G | 0.03 | 97.41 | 92.67 | 40.95 |
| Hg2_3 | 70,088,970 | 69,086,256 | 10.36G | 0.03 | 97.37 | 92.62 | 40.56 |
| Hg3_1 | 68,686,072 | 67,882,044 | 10.18G | 0.03 | 97.3 | 92.39 | 41.03 |
| Hg3_2 | 59,035,522 | 58,092,164 | 8.71G | 0.03 | 97.58 | 93.06 | 42.19 |
| Hg3_3 | 77600512 | 76,318,148 | 11.45G | 0.03 | 97.45 | 92.72 | 41.66 |
| Lg1_1 | 50,739,698 | 49,722,722 | 7.46G | 0.03 | 97.68 | 93.25 | 42.08 |
| Lg1_2 | 65,200,928 | 64,057,478 | 9.61G | 0.03 | 97.42 | 92.67 | 40.53 |
| Lg1_3 | 48,444,610 | 47,478,420 | 7.12G | 0.03 | 97.52 | 92.93 | 41.1 |
| Lg2_1 | 55,991,666 | 54,658,022 | 8.2G | 0.03 | 96.89 | 91.44 | 41.03 |
| Lg2_2 | 62,258,242 | 61,271,324 | 9.19G | 0.03 | 97.55 | 92.97 | 41.48 |
| Lg2_3 | 58,823,612 | 57,827,336 | 8.67G | 0.03 | 97.67 | 93.18 | 41.03 |
| Lg3_1 | 59,367,598 | 58,397,304 | 8.76G | 0.03 | 97.53 | 92.89 | 42.24 |
| Lg3_2 | 55,118,938 | 54,163,008 | 8.12G | 0.03 | 97.5 | 92.85 | 41.18 |
| Lg3_3 | 62,453,414 | 61,003,738 | 9.15G | 0.03 | 97.54 | 92.93 | 42.44 |
| KEGG Pathways | Total | Hits | p-Value | Impact | Metabolites |
|---|---|---|---|---|---|
| Pantothenate and CoA biosynthesis | 18 | 2 | 0.33422 | 0.47223 | Phosphopantetheine; 4-Phosphopantothenoylcysteine |
| Histidine metabolism | 9 | 1 | 0.45929 | 0.4 | l-Histidine |
| Tryptophan metabolism | 30 | 2 | 0.5996 | 0.12451 | Anthranilic acid; l-Kynurenine |
| β-alanine metabolism | 14 | 1 | 0.61666 | 0 | l-Histidine |
| Pyrimidine metabolism | 40 | 2 | 0.75488 | 0.08308 | Orotidine 5′-monophosphate; 2′-deoxy-5-hydroxymethyl-CDP |
| Aminoacyl-tRNA biosynthesis | 48 | 2 | 0.83941 | 0 | l-Histidine; l-(-)-methionine |
| Cysteine and methionine metabolism | 32 | 1 | 0.89043 | 0.13814 | l-(-)-methionine |
| Fatty acid degradation | 38 | 1 | 0.92819 | 0 | l-Palmitoylcarnitine |
| Purine metabolism | 63 | 2 | 0.93117 | 0.04192 | Glycineamide ribonucleotide; Adenine |
| Fatty acid biosynthesis | 43 | 1 | 0.9496 | 0 | Myristic acid |
| Alanine, aspartate and glutamate metabolism | 23 | 1 | 0.77956 | 0.02027 | Adenylsuccinic acid |
| Drug metabolism (other enzymes) | 31 | 1 | 0.87077 | 0.02273 | SN-38 |
| Glycerophospholipid metabolism | 32 | 1 | 0.87916 | 0.04362 | 1-Stearoyl-2-hydroxy-sn-glycero-3-phosphocholine |
© 2020 by the authors. Licensee MDPI, Basel, Switzerland. This article is an open access article distributed under the terms and conditions of the Creative Commons Attribution (CC BY) license (http://creativecommons.org/licenses/by/4.0/).
Share and Cite
Liu, Y.; Zhao, H.; Luo, Q.; Yang, Y.; Zhang, G.; Zhou, Z.; Naeem, M.; An, J. De Novo Transcriptomic and Metabolomic Analyses Reveal the Ecological Adaptation of High-Altitude Bombus pyrosoma. Insects 2020, 11, 631. https://doi.org/10.3390/insects11090631
Liu Y, Zhao H, Luo Q, Yang Y, Zhang G, Zhou Z, Naeem M, An J. De Novo Transcriptomic and Metabolomic Analyses Reveal the Ecological Adaptation of High-Altitude Bombus pyrosoma. Insects. 2020; 11(9):631. https://doi.org/10.3390/insects11090631
Chicago/Turabian StyleLiu, Yanjie, Huiyue Zhao, Qihua Luo, Yadong Yang, Guangshuo Zhang, Zhiyong Zhou, Muhammad Naeem, and Jiandong An. 2020. "De Novo Transcriptomic and Metabolomic Analyses Reveal the Ecological Adaptation of High-Altitude Bombus pyrosoma" Insects 11, no. 9: 631. https://doi.org/10.3390/insects11090631
APA StyleLiu, Y., Zhao, H., Luo, Q., Yang, Y., Zhang, G., Zhou, Z., Naeem, M., & An, J. (2020). De Novo Transcriptomic and Metabolomic Analyses Reveal the Ecological Adaptation of High-Altitude Bombus pyrosoma. Insects, 11(9), 631. https://doi.org/10.3390/insects11090631