Abstract
Spodoptera frugiperda is a serious agricultural pest native to tropical and subtropical areas of the Americas. It has a broad host suitability range, disperses rapidly, and has now invaded nearly 100 countries around the world by quickly establishing in the novel ecologies. Based on the native occurrence records and environmental variables, we predicted the potential geographic distribution of S. frugiperda in Central Asia using the MaxEnt model and the ArcGIS. Irrigation is considered to be the main factor for the maize crop production in the Central Asia; therefore, we sought to map the potential spread of S. frugiperda using two modeling approaches together with adjusted rainfall indices and environmental data from this region. The results showed that both approaches (MCP and Obs) could predict the potential distribution of S. frugiperda. The Observation points (Obs) approach gave predicted more conservative projections compared with the Minimum Convex Polygon (MCP) approach. Areas of potential distribution that were consistently identified by the two modeling approaches included Western Afghanistan, Southern Kazakhstan and Southern Turkmenistan. The Receiver Operating Characteristic (ROC) curve test presented herein provided reliable evidence that the MaxEnt model has a high degree of accuracy in predicting the invasion of S. frugiperda in Central Asia.
1. Introduction
The fall armyworm, Spodoptera frugiperda (J.E. Smith) (Lepidoptera: Noctuidae), is native to tropical and subtropical regions of the Americas. It is a serious global agricultural pest insect [1] which has caused substantial maize yield losses in many countries [2]. A recent study has shown that the losses are more severe in countries with poor economies and lack of funds for pest control, such as Honduras and Argentina, where damage caused by S. frugiperda in maize production might reach 40% [3]. As strong migration ability and proliferation the potential for proliferation are the two important factors responsible for the worldwide spread of S. frugiperda [4]. S. frugiperda was first reported in January 2016 in West Africa [5] from where and it rapidly spread to 44 African countries within two years [3]. It has subsequently been introduced into the Indian state of Karnataka in India in July 2018 [6] and recently caused serious damages in Myanmar, Thailand and other Asian countries [7]. In January 2019, it invaded China’s Yunnan province and quickly spread to many maize producing provinces within ten months, posing a serious threat to China’s agriculture and food production systems.
Central Asia encompasses the countries from east Caspian Sea to China at about 40° N with strong solar radiation, high temperatures and vigorous evaporation. It includes the countries of Kazakhstan, Uzbekistan, Kyrgyzstan, Tajikistan, Turkmenistan and Afghanistan. The Central Asian countries have much sunlight as tropical areas with average midsummer temperatures generally between 26 °C to 32 °C. Annual precipitation varies between regions; near Aral Sea and Turkmenistan desert averages 75–100 mm; in comparison, annual precipitation of mountain areas average 1000 mm, and can reach approximately 2000 mm in the southwest of the Ferghana Mountains. Some regions receive less rain in the mountains than in the desert (Pamir’s annual precipitation is only 60 mm). Among the Central Asian countries, Afghanistan’s annual maize crop covers about 379,100 hectares, that of Kazakhstan’s corn planting covers about 140,000 hectares, Turkmenistan about 150,000 hectares, Kyrgyzstan’s corn accounts about 80,000 hectares, Uzbekistan accounts about 60,000 hectares and Tajikistan about 20,000 hectares. The spread of S. frugiperda depends on favorable climatic conditions, irrigation and host plants growth and vigor. Therefore, exploring the potential distribution of S. frugiperda in Central Asia could establish early risk warning systems in order to prepare and control measures for its potential invasion.
Ecological Niche Modeling (ENM) seeks to characterize ecological requirements of species using environmental variables associated with occurrence data to identify where suitable environmental conditions are found [8]. ENM has been used widely in biological invasion, conservation biology, biological responses to climate change, and various aspects of ecological and evolutionary biological research [9,10,11]. ENM is usually constructed from the native distribution of a species and then projected to the possible invasion site to calculate the possibility of potential distribution. This study is based on native data for S. frugiperda and environmental data using two modeling approaches (MCP and Obs) to project its potential distribution in the Central Asia. The specific objectives of this study were: (i) to define areas of potential invasion distribution and assess the distribution risk to provide support for early warning systems, (ii) to explore what are the main environmental factors that affect the establishment of S. frugiperda, and (iii) to evaluate the effects of two different buffer models on the potential distribution of the S. frugiperda.
2. Materials and Methods
2.1. Occurrence Data
Occurrence records of S. frugiperda were obtained from GBIF databases (Global Biodiversity Information Facility, https://www.gbif.org/), CPC databases (Crop Protection Compendium, https://www.cabi.org/cpc/) and related reports. We used a total of 1314 records (native range included South and Central America: 499) that reflected S. frugiperda’s present-day distribution. Records lacking geographic coordinates were georeferenced in Google Maps. Sampling deviation would lead to the over-fitting and thus reducing the reliability of the niche model, so we subsampled points at a 2.5 arc grid to reduce sampling bias and evaluation to minimize possible effects of spatial autocorrelation [12].
2.2. Environmental Variables
The environmental variables that would characterize the ecological requirements of the S. frugiperda were obtained from WorldClim (http://www.worldclim.org) [13]. Variables combining extreme temperature and extreme precipitation were excluded because they affected the accuracy of the modeling process [14,15]. Then we selected six variables by considering their ecological relevance and spatial correlation (Pearson < 0.9). These six variables were Mean Diurnal Range (BIO2), Isothermality (BIO3), Max Temperature of Warmest Month (BIO5), Precipitation of Wettest Month (BIO13), Precipitation Seasonality (BIO15) and Precipitation of Driest Quarter (BIO17). Considering the irrigation conditions of Central Asia, we doubled the precipitation at a 2.5 arc grid for model calibration in this study.
2.3. Model Calibration
Among the several model algorithms were available for modeling species’ geographic distribution, MaxEnt (version 3.4.1) is the most often used popular model and follows the principle of maximum entropy [16]. In this study, we used default software conditions (convergence threshold = 10−5, maximum number of iterations = 500) based on two modeling approaches. The cloglog outputs with suitability values ranging from 0 (unsuitable habitat) to 1 (optimal habitat). The MaxEnt model usually calculates by selecting pseudo-absence points that exist in the model construction region for establishing the model. Therefore, the model construction region has great influence on the model prediction. According to the background selection function of model construction in SDMToolbox packages, the sample by buffered MCP and the sample by distance from obs. pts. (Obs) were used to define the model construction range (Figure 1). The predictive value presented herein traces out the high suitability value of above 0.75, and the low suitability value of below 0.25. Different colors that presented in the potential distribution map correspond to different fitting indexes.

Figure 1.
Geographic distribution of Spodoptera frugiperda in native range. The black dots represent the native points. MCP and Obs represent two different buffers to define the accessible areas used for niche modeling.
2.4. Model Evaluation
Native models were fitted using the two approaches and then applied to Central Asian maps to predict the potential distributions of S. frugiperda in Central Asia separately. Seventy percent of native-range points were used to fit the model; the remaining 30% were used for model evaluations based on the Receiver Operating Characteristic (ROC). The Area Under Curve (AUC) is a commonly used and effective method to analyze the niche model performance [17,18]. In this study, we used the ROC curve combined with 10 times of cross validation to test the prediction results [19]. The principle of cross-validation is that it can regroup the original data into two sets (training set and test set). Hence, it not only can reduce over-fitting, but can also produce more effective information from limited data. We could then obtain a response curve with a standard deviation error bar. The AUC value was used to evaluate the model performance at a value between 0 and 1; when the AUC value was higher than 0.8, the current model was found to be superior to the random model [20].
3. Results
3.1. Model Predictions
The areas of potential distributions were identified from the two models of world distribution from the Americas, Europe, Central Africa, Southern Asia and Central Australia (Figure 2). The results showed that both models could well predict the potential distribution of S. frugiperda in Central Asia (Figure 3). The Obs approach gave conservative predictions for the invasion of Central Asia compared to the MCP approach. Areas of potential high suitability distribution that were consistently identified by the two modeling approaches were Western Afghanistan, Southern Kazakhstan and Southern Turkmenistan (Figure 3). Predictions of mean model showed that the suitable areas were similarly concentrated in Southeast Kazakhstan, Western Kyrgyzstan and Central Tajikistan (Figure 3). The irrigated agricultural areas of Central Asia are mainly distributed in the two countries of Kyrgyzstan and Tajikistan. Predicted results obtained from adjusted precipitation values also showed that the potential distribution area of the S. frugiperda was located in Western Kyrgyzstan and Central Tajikistan was consistent with the actual distribution. Abundant surface irrigation water from the upper reaches of the Syr River and Amu River provide convenient conditions for local maize cultivation. Maize grown in three countries of Uzbekistan, Kazakhstan and Turkmenistan, is mostly distributed in the form of island-shaped, block-like or strip-shaped along with irrigation belts, which is located in arid and desert areas where the agricultural and animal husbandry production is more developed and the population is concentrated (Figure 4).
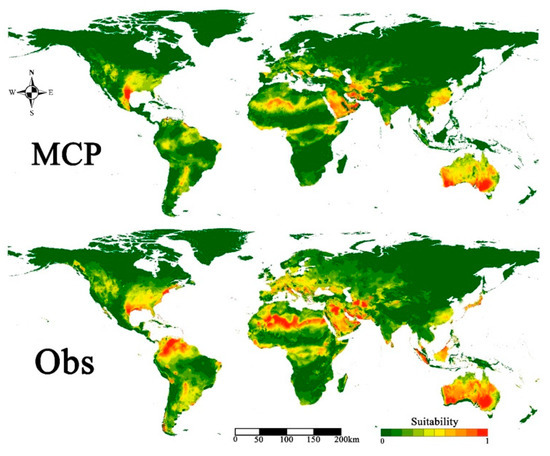
Figure 2.
Potential habitat distribution of Spodoptera frugiperda in the world.
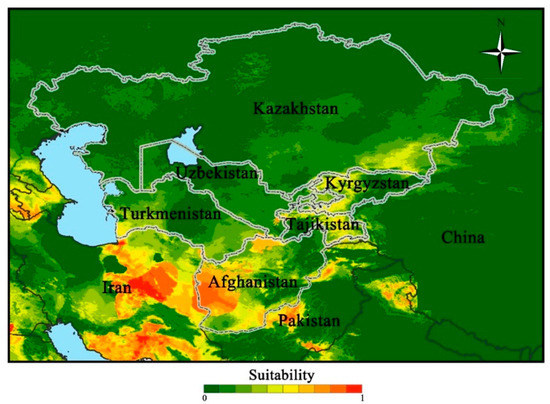
Figure 3.
Predicted potential distribution of Spodoptera frugiperda in Central Asia based on the mean model.
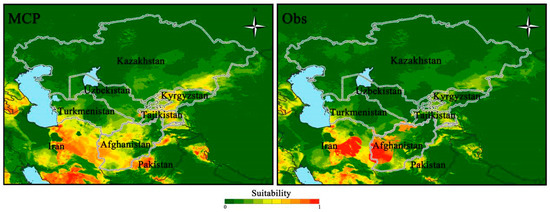
Figure 4.
Predicted potential distribution of Spodoptera frugiperda in the Central Asia MCP and Obs models.
3.2. Effects of Environmental Variables
This study tested the effect of various environmental variables by considering their ecological relevance in predicting the potential distribution of S. frugiperda. Response curves of the environment variables are shown in Figure 5. In terms of temperature factors, the suitability for S. frugiperda was decreased with the Mean Diurnal Range (Figure 5A). The suitability of the S. frugiperda also has been decreased when the value of Isothermality value reached 40 °C (Figure 5B). When the Max Temperature of Warmest Month was lower than 35 °C, the suitability of S. frugiperda increased with increasing temperature and stabilized when the temperature exceeds 30 °C (Figure 5C). The suitability probability of S. frugiperda increased linearly with the increase in precipitation where the Precipitation of Wettest Month was less than 100 mm (Figure 5D); however, the suitability of S. frugiperda decreased when the precipitation increases in area where the Precipitation of Wettest Month was greater than 100 mm (Figure 5D). The suitability of S. frugiperda fell below 43% in areas where the Precipitation Seasonality was lower than 15 and reached at 83% in areas where this value was between 15 and 95; however, the suitability of S. frugiperda decreased gradually after the value exceeded 95 (Figure 5E). The maximum degree of suitability was 50% in some areas with the Precipitation of Driest Quarter below 150 mm; it then decreased slowly in areas where the Precipitation of Driest Quarter was greater than 150 mm (Figure 5F). Overall, the results showed that the maximum suitability of S. frugiperda occurred when the Diurnal Range was 6 °C, the Isothermality was 33, the Max Temperature of Warmest Month was 35 °C, the Precipitation of Wettest Month was 45 mm, the Precipitation Seasonality was 0, and the Precipitation of Driest Quarter was 180 mm.
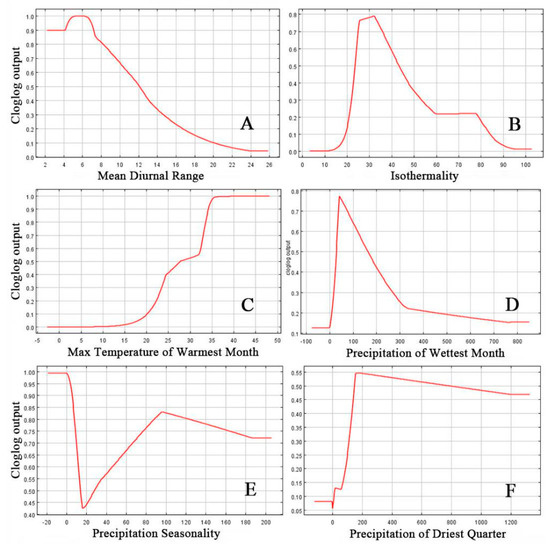
Figure 5.
Variable response curve of Mean Diurnal Range (A), Isothermality (B), Maximum Temperature of the Warmest Month (C), Precipitation of the Wettest Month (D), Precipitation Seasonality (E) and Precipitation of Driest Quarter (F).
3.3. Model Performance
Cross-validated ROC curve results showed some differences in the MCP and Obs approaches to potential distribution of S. frugiperda (Figure 6). The AUC values obtained by the two models were significantly larger than their respective random prediction models (AUC = 0.5). This suggests that two predictions of the potential distribution of the S. frugiperda in Central Asia are reliable and the results were not random. The MCP model with a higher AUC value showed a better model performance than Obs model (MCP: AUC = 0.865, Obs: AUC = 0.834).
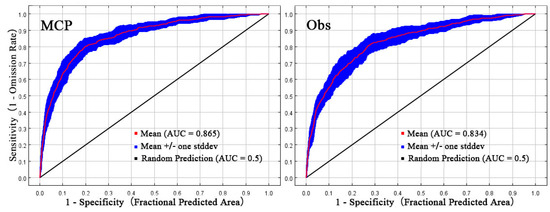
Figure 6.
ROC curve verification of the predicted potential habitat for Spodoptera frugiperda by MaxEnt.
4. Discussion
The study provides a reliable basis for risk analysis combined with the ecological demand and potential distribution of the species [21]. The MaxEnt model adopted mechanical algorithms by using species’ existing and non-existing distribution points to simulate the response relationship between species and environmental factors. The MaxEnt model could avoid commission errors in predicting species distribution [11]. It showed a better predictive performance than other niche models especially when the sample points are limited [10,22]. There are differences between the models constructed for two geographical regions (MCP and Obs): The MCP approach uses the minimum polygon of species distribution point to define a minimum convex polygon for model construction, while the Obs approach mainly defines the selection of background points by buffering each species distribution point over a certain distance. The mean model approach with weighted average could improve the accuracy of prediction. Indeed, TSS combines the characteristics of sensitivity and specificity: TSS = (sensitivity + specificity − 1). However, it is susceptible to the influence of threshold, this means that different thresholds will get different results. In this study, at the threshold value of 0.5, the TSS in MPC model and Obs model projected 0.8 and 0.6, respectively. The value of 0.5 is often mentioned in the literatures. Model evaluation using AUC can be misleading although it is considered independent of threshold(s) based on the AUC combined sensitivity and specificity. The shape of ROC curve was more important than AUC value. In this study, the ROC curves of the two models show similar trends and their AUC values are not significantly different. Hence, we believe that AUC could be a sensible method to be used in assessing the accuracy of ENM.
It is apparent that the environmental dataset plays an important role in model construction, and may have a profound impact on its transferability [23]. Temperature and humidity are the main environmental factors that affect the growth, development and distribution of insects. Also, insects’ reproduction is greatly affected by the external temperature, so that reproduction is reduced whenever the temperature is too high or too low. A study by Feldmann et al. found that there is no diapause phenomenon in S. frugiperda, so its generation time is closely related to the external temperature [3]. Low temperature tends to decrease the birth rate and increase the death rate of the S. frugiperda and the adult lifespan depends on external temperature and food. Within a certain temperature range, the reproductive capacity of the female moth increases with temperatures increase [24]. However, environmental factors such as variations in higher and lower ranges of temperature, relative humidity and precipitation could be used to infer the potential distribution of species [25]. For example, the high mountains of Southeast and Central Asia block the warm and humid air from the Indian Ocean and the Pacific Oceans, thus forming a typical continental climatic regions are mountainous with a general lack of rain, extremely dry climate, and average annual precipitation below 300 mm below, and mostly in the mountains. All the six countries in Central Asia are water-deficient, which restrict planting. Under the condition that irrigation is the major need for maize production in Central Asian countries, we sought to map the potential spread of S. frugiperda adjusting the rainfall index. The response curve is an important result of the model output and indicates the relationship between species and environment. Moreover, it provides a check on the model results [26]. Jackknife test of variable importance generated using MaxEnt model is appropriate to examine the importance of a single environment variable in prediction process [14].
Generally speaking, the distribution of S. frugiperda is mostly influenced by the distribution of its host plants such as maize. The climate conditions in the major maize producing areas are mostly suitable for the occurrence and reproduction of S. frugiperda. Among the Central Asian countries, Afghanistan has the largest agricultural acreage and thus vulnerable to pests. Kazakhstan’s agriculture is mainly distributed in the central and southern regions with a good rainfall condition. Especially in the Southern Almaty and Chimkent, where maize is the staple crop, are high risk areas for S. frugiperda. The two largest states of Turkmenistan, Barkan and Ahar, are the major grain producing areas in the south. These are also the high-risk areas for the predicted results shown for the S. frugiperda in this study. Gizak State in eastern Uzbekistan is a major area for agricultural production and provides a suitable environment for the S. frugiperda. To prevent further introductions and expansions, agricultural imports and management efforts should be focused on increased genetic diversity and suitable ecological areas.
Spodoptera frugiperda pose a serious threat to maize production due to its invasion and feeding habits from low to high latitudes during the spring and summer and returning in the fall. The overwintering areas where pupae can survive provide an appropriate environmental conditions to ensure its successful development and reproduction. The species can overwinter from the northern Kazakhstan to the southern Turkmenistan in Central Asia, ranging from (latitudes 57° N to 35° N, which showing the transition from the Frigid-Temperate Zone to the Sub-Tropical Zone. A recent study has shown that development starts at 12.2 °C [27]. When the temperatures start to rise, S. frugiperda will again develop, produce larvae and invade new areas (20−30 °C).
5. Conclusions
Spodoptera frugiperda is a serious pest insect of maize and other commercial crops in Central Asia. The species tends to migrate over the winter and find areas with higher temperatures where it may develop and harm economical crops. This study confirms that both approaches tested (MCP and Obs) predict the potential distribution of S. frugiperda. The Observation points approach (OBs) gave more conservative projections for its Central Asia compared to the Minimum Convex Polygon (MCP) approach. Areas of potential distribution that were consistently identified by the two modeling approaches included Western Afghanistan, Southern Kazakhstan and Southern Turkmenistan. The ROC (Receiver Operating Characteristic) curve test presented herein provided reliable evidence that the MaxEnt model has a high degree of accuracy in predicting invasion of S. frugiperda in Central Asia. The potential distribution of the S. frugiperda shown in the niche models does not fully represent its current distribution due to the impact on local crops cultivation. In addition, the development and reproduction of the S. frugiperda is not only related to the external temperature and humidity, but also affected by light, nutrition and other factors. For example, human activities and the lack of effective biological control agents are also likely to facilitate their further invasion into novel ecologies. To prevent further pest invasions, regular pest monitoring and surveillance in the neighboring countries of Central Asia is essential.
Author Contributions
Conceptualization, R.Z. and M.H. software & original draft, M.N.B. and J.F. formal analysis & methodology, J.F. review & editing, R.Z. and M.H. All authors have read and agreed to the published version of the manuscript.
Funding
This research was supported by the Strategic Priority Research Program of the Chinese Academy of Sciences (Grant No. XDA19050204) and CAS-TWAS presidential scholarship support to the first author.
Acknowledgments
We wish to thank Pengxiang Wu, Jing Xu and Ning Liu for their assistance in data collections. Also, we are grateful to Janice Peters, Benjamin Legaspi, Tianqi Tian, Zailing Wang, Pengcheng, Wang, Yizhe Li, Qilin Ren and Jingliang Ren for their valuable reviews and suggestions for the improvement of earlier version of this article.
Conflicts of Interest
The authors declare no conflicts of interest.
References
- Todd, E.L.; Poole, R.W. Keys and illustrations for the armyworm moths of the noctuid genus Spodoptera Guenee from the Western Hemisphere. Ann. Entomol. Soc. Am. 1980, 73, 722–738. [Google Scholar] [CrossRef]
- Early, R.; Gonzalez-Moreno, P.; Murphy, S.T.; Day, R. Forecasting the global extent of invasion of the cereal pest Spodoptera frugiperda, the fall armyworm. NeoBiota 2018, 40, 25–50. [Google Scholar] [CrossRef]
- Feldmann, F.; Rieckmann, U.; Winter, S. The spread of the fall armyworm Spodoptera frugiperda in Africa—What should be done next? J. Plant Dis. Protect. 2019, 126, 97–101. [Google Scholar] [CrossRef]
- Deshmukh, S.; Kalleshwaraswamy, C.M.; Asokan, R.; Swamy, H.M.M.; Maruthi, M.S.; Pavithra, H.B.; Hegde, K.; Navi, S.; Parbhu, S.T.; Goergen, G. First report of the fall armyworm, Spodoptera frugiperda (J.E. Smith) (Lepidoptera: Noctuidae), an alien invasive pest on maize in India. Pest Manag. Hort. Ecol. 2018, 24, 23–29. [Google Scholar]
- Goergen, G.; Kumar, P.L.; Sankung, S.B.; Togola, A.; Tamò, M. First report of outbreaks of the fall armyworm Spodoptera frugiperda (J E Smith) (Lepidoptera, Noctuidae), a new alien invasive pest in west and central Africa. PLoS ONE 2016, 11, e165632. [Google Scholar] [CrossRef]
- Nakweya, G. Global Actions Needed to Combat Fall Armyworm. Available online: https://www.scidev.net/sub-saharan-africa/farming/news/global-actions-combat-fall-armyworm.Html (accessed on 1 February 2020).
- FAO. First Detection of Fall Army Worm on the Border of Thailand; FAO of the United Nations: Rome, Italy, 2018. [Google Scholar]
- Dormann, C.F.; Elith, J.; Bacher, S.; Buchmann, C.; Carl, G.; Carre, G.; Marquez, J.R.G.; Gruber, B.; Lafourcade, B.; Leitão, P.J.; et al. Collinearity: A review of methods to deal with it and a simulation study evaluating their performance. Ecography 2013, 36, 27–46. [Google Scholar] [CrossRef]
- Ganeshaiah, K.N.; Barve, N.; Nath, N.; Chandrashekara, K.; Swamy, M.; Shaanker, R. Predicting the potential geographical distribution of the sugarcane woolly aphid Using GARP and DIVA-GIS. Curr. Sci. India 2003, 85, 1526–1528. [Google Scholar]
- Elith, J.; Graham, H.C.; Anderson, P.R.; Dudik, M.; Ferrier, S.; Guisan, A.; Hijmans, J.R.; Huettmann, F.; Leathwick, R.J.; Lehmann, A.; et al. Novel methods improve prediction of species’ distributions from occurrence data. Ecography 2006, 29, 129–151. [Google Scholar] [CrossRef]
- Peterson, A.T.; Papeş, M.; Eaton, M. Transferability and model evaluation in ecological niche modelling: A comparison of GARP and Maxent. Ecography 2007, 30, 550–560. [Google Scholar] [CrossRef]
- Verbruggen, H.; Tyberghein, L.; Belton, G.S.; Mineur, F.; Jueterbock, A.; Hoarau, G.; Gurgel, C.F.; Clerk, O.D. Improving transferability of introduced species’ distribution models: New tools to forecast the spread of a highly invasive seaweed. PLoS ONE 2013, 8, e63337. [Google Scholar] [CrossRef]
- Hijmans, R.J.; Cameron, S.E.; Parra, J.L.; Jones, P.G.; Jarvis, A. Very high resolution interpolated climate surfaces for global land areas. Int. J. Climatol. 2005, 25, 1965–1978. [Google Scholar] [CrossRef]
- Sun, P.S.; Jiang, F.; Zhang, X.L.; Zhang, J.Q.; Pan, X.B.; Li, Z.H. Invasion risk assessment of the Mediterranean fruit fly Ceratitis capitata into China. Plant Dis Protect. 2017, 44, 436–444. [Google Scholar]
- Escobar, L.E.; Lira-Noriega, A.; Medina-Vogel, G.; Peterson, A.T. Potential for spread of the white-nose fungus (Pseudogymnoascus destructans) in the Americas: Use of MaxEnt and NicheA to assure strict model transference. Geosp. Health 2014, 9, 221–229. [Google Scholar] [CrossRef] [PubMed]
- Philips, S.J.; Dudik, M.; Schapire, R.E. Maxent Software for Modeling Species Niches and Distributions (Version 3.4.1). Available online: http://biodiversityinformatics.amnh.org/open_source/maxent/ (accessed on 24 February 2020).
- Lobo, J.M.; Alberto, J.V.; Real, R. AUC: A misleading measure of the performance of predictive distribution models. Glob. Ecol. Biogeogr. 2008, 17, 145–151. [Google Scholar] [CrossRef]
- Babar, S.; Amarnath, G.; Reddy, C.S.; Jentsch, A.; Sudhakar, S. Species distribution models: Ecological explanation and prediction of an endemic and endangered plant species (Pterocarpus santalinus L.f.). Curr. Sci. 2012, 102, 1157–1165. [Google Scholar]
- Manel, S.; Williams, H.C.; Ormerod, S.J. Evaluating presence-absence models in ecology: The need to account for prevalence. J. Appl. Ecol. 2001, 38, 92–931. [Google Scholar] [CrossRef]
- Swets, J.A. Measuring the accuracy of diagnostic systems. Science 1988, 240, 1285–1293. [Google Scholar] [CrossRef]
- Peterson, A.T.; Soberón, J. Species distribution modeling and ecological niche modeling: Getting the concepts right. Nat. Conservação 2012, 10, 1–6. [Google Scholar] [CrossRef]
- Hernandez, P.A.; Franke, I.; Herzog, S.K.; Pacheco, V.; Paniagua, L.; Quintana, H.L.; Soto, A.; Swenson, J.J.; Tovar, C.; Valqui, T.H.; et al. Predicting species distributions in poorly-studied landscapes. Biodivers. Conserv. 2008, 17, 1353–1366. [Google Scholar] [CrossRef]
- Fan, J.Y.; Zhao, N.X.; Li, M.; Wang, M.L.; Zhu, G.P. What are the best predictors for invasive potential of weeds? Transferability evaluations of model predictions based on diverse environmental data sets for Flaveria bidentis. Weed Res. 2018, 58, 141–149. [Google Scholar] [CrossRef]
- Schlemmer, M. Effect of Temperature on Development and Reproduction of Spodoptera frugiperda (Lepidop: Noctuidae); North-West University: Evanston, IL, USA, 2018; pp. 1–103. [Google Scholar]
- Phillips, S.J.; Dudik, M.; Schapire, R.E. A maximum entropy approach to species distribution modeling. In Proceedings of the 21st International Conference on Machine Learning, Banff, AB, Canada, 4–8 July 2004; Greiner, R., Schuurmans, D., Eds.; AMC Press: New York, NY, USA, 2004; pp. 655–662. [Google Scholar]
- Padalia, H.; Srivastava, V.; Kushwaha, S.P.S. Modeling potential invasion range of alien invasive species, Hyptis suaveolens (L.) Poit. in India: Comparison of MaxEnt and GARP. Ecol. Inform. 2014, 22, 36–43. [Google Scholar] [CrossRef]
- He, L.M.; Ge, S.S.; Chen, Y.C.; Wu, Q.L.; Jiang, Y.Y.; Wu, K.G. The developmental threshold temperature, effective accumulated temperature and prediction model of developmental duration of fall armyworm, Spodoptera frugiperda. Plant Prot. 2019, 5, 5. [Google Scholar] [CrossRef]
© 2020 by the authors. Licensee MDPI, Basel, Switzerland. This article is an open access article distributed under the terms and conditions of the Creative Commons Attribution (CC BY) license (http://creativecommons.org/licenses/by/4.0/).