Article

Transcriptome Profiling Revealed Potentially Critical Roles for Digestion and Defense-Related Genes in Insects’ Use of Resistant Host Plants: A Case Study with Sitobion Avenae

1
State Key Laboratory of Crop Stress Biology for Arid Areas, Northwest A&F University, Yangling 712100, China
2
College of Plant Protection, Northwest A&F University, Yangling 712100, China
3
Department of Foreign Languages, Northwest A&F University, Yangling 712100, China
*
Author to whom correspondence should be addressed.
Both authors contributed equally to this work.
Insects 2020, 11(2), 90; https://doi.org/10.3390/insects11020090
Submission received: 20 December 2019 / Revised: 22 January 2020 / Accepted: 22 January 2020 / Published: 30 January 2020

Abstract

:
Using host plant resistance (HPR) in management of insect pests is often environmentally friendly and suitable for sustainable development of agricultural industries. However, this strategy can be limited by rapid evolution of insect populations that overcome HPR, for which the underlying molecular factors and mechanisms are not well understood. To address this issue, we analyzed transcriptomes of two distinct biotypes of the grain aphid, Sitobion avenae (Fabricius), on wheat and barley. This analysis revealed a large number of differentially expressed genes (DEGs) between biotypes 1 and 3 on wheat and barley. The majority of them were common DEGs occurring on both wheat and barley. GO and KEGG enrichment analyses for these common DEGs demonstrated significant expression divergence between both biotypes in genes associated with digestion and defense. Top defense-related common DEGs with the most significant expression changes included three peroxidases, two UGTs (UDP-glycosyltransferase), two cuticle proteins, one glutathione S-transferases (GST), one superoxide dismutase, and one esterase, suggesting their potentially critical roles in the divergence of S. avenae biotypes. A relatively high number of specific DEGs on wheat were identified for peroxidases (9) and P450s (8), indicating that phenolic compounds and hydroxamic acids may play key roles in resistance of wheat against S. avenae. Enrichment of specific DEGs on barley for P450s and ABC transporters suggested their key roles in this aphid’s detoxification against secondary metabolites (e.g., alkaloids) in barley. Our results can provide insights into the molecular factors and functions that explain biotype adaptation in insects and their use of resistant plants. This study also has significant implications for developing new resistant cultivars, developing strategies that limit rapid development of insect biotypes, and extending resistant crop cultivars’ durability and sustainability in integrated management programs.

1. Introduction

In the constantly changing agricultural landscape, effective management of various insect pests often presents huge challenges. Many pest management tactics, such as cultural, biological and chemical tactics, have been developed to meet these challenges. Among different strategies, deployment of host plant resistance can provide many benefits, such as economic savings, promotions of natural and biological control, and a decrease in potentially hazardous insecticide applications [1,2]. Thus, this pest management strategy developed from naturally evolved plant defenses is often environmentally friendly and suitable for sustainable development of agricultural industries, and it can be very valuable in the integrated management of insect pests for various agricultural crops [1,3]. However, some factors, such as efficacy, lack of resistant varieties and rapid evolution of insect populations, can limit the utilization of host plant resistance in insect pest management [2,4]. One of the most serious challenges to the use of resistant crops against various insect pests is the rapid development of new biotypes [5]. For example, a new biotype of the soybean aphid has developed in North America within 5 years after invasion, despite the genetic bottleneck during the invasion process [2]. Multiple biotypes have been constantly found in many phytophagous insects in response to different levels of host plant resistance, such as the rice brown plant hopper (Nilaparvata lugens), Hessian fly (Mayetiola destructor), and soybean aphid (Aphis glycines) [6,7,8].
In the context of host plant resistance, insect biotypes are defined as populations that are able to survive, reproduce on, and cause injury to a cultivated plant resistant to other populations of the same species [2,4]. So, biotypes can be determined by their unique response profiles (i.e., differential survival or fitness) on different plants [2,4]. Particularly, aphids are prone to adapt and overcome host plant resistance and develop different biotypes on variable plants. For example, fifteen sympatric biotypes of the pea aphid have been found on different host species, and they present gradual levels of genetic divergence [9,10]. A study has found at least 17 aphid species with multiple biotypes evolved [11]. This is probably because differential levels of resistance in variable plants present a huge pressure of natural selection that favors host-associated ecological divergence of various aphid populations [12,13]. Increasing evidence has shown that the differential levels of plant resistance to aphids can be attributed to plant secondary chemistry. For example, different levels of hydroxamic acids in cereal crops (e.g., wheat) can play a key role in resistance of crops against a wide range of insects, including aphids [14,15]. Facing harmful effects of plant secondary compounds, aphids have developed a diversity of detoxification systems, such as cytochrome P450 monooxygenases (P450s), glutathione S-transferases (GSTs) and esterases (ESTs) [16,17,18,19]. There are at least two possible means by which detoxification can lead to differential plant resistance and aphid biotype adaptation: (1) detoxification enzymes can be produced in differential ratios and amounts on different resistant plants; (2) gene mutations can occur in the catalytic sites of detoxification enzymes enabling a much more efficient and effective process of detoxification [2]. Activities of the above-mentioned defense-related enzymes in aphids have been extensively studied, but the underlying molecular variation has received little attention [20,21,22,23]. Since host plant-associated differentiation may often involve genes targeted by selection, identification of elevated levels of molecular differentiation between biotypes (or host-associated populations) is an important step towards fully understanding adaptive divergence, as well as the underlying mechanisms of host plant resistance [24]. Research in this respect can not only expand our understanding of insect–plant interactions, but also help to improve the efficacy, durability, and sustainability for the use of host plant resistance in management of insect pests [2]. So far, such research is still scarce, and molecular factors and functions underlying the use of resistant plants by different aphid biotypes (differential adaptation to different resistant plants) are not well understood.
The English grain aphid, Sitobion avenae (Fabricius) (Hemiptera: Aphididae), is a good model to address this issue. This aphid can feed and survive on many species of the Poaceae, including cereal crops and pasture grasses [3,25,26,27]. These host plants exhibit a wide range of concentrations for secondary metabolites (e.g., phenolic compounds, hydroxamic acids and alkaloids), which are chemical defenses involved in resistance against aphids [28,29]. Our previous studies did find some genetic variation among S. avenae populations from different cultivated hosts and geographic areas, which could serve as a possible genetic reservoir for adaptation to differential host plant resistance [30,31,32,33]. In addition, based on their unique performance profiles on resistant wheat and barley cultivars, multiple S. avenae biotypes were identified [4]. Significant genetic differentiation was detected among these biotypes (e.g., biotype 1 vs. biotype 3, FST = 0.157) based on microsatellite data [33]. Despite this, molecular factors and functions underlying the divergence of biotypes in S. avenae are still little understood. In this study, molecular variation in two distinct S. avenae biotypes (i.e., biotypes 1 and 3) feeding on resistant host plants is determined by using high-throughput sequencing techniques. The objectives are to: (1) examine potential molecular factors underlying the adaptive divergence of S. avenae biotypes; (2) identify functions and genes involved in the use of resistant plants (i.e., adaptation to specific plants) by different S. avenae biotypes.

2. Materials and Methods

2.1. Aphid Sample Collection and Colony Establishment

In our previous study on the identification of S. avenae biotypes [4], we found that biotype 3 was characterized by an ability to overcome the resistance of barley (Hordeum vulgare L.) cultivars (e.g., Xiyin No.2), but not wheat (Triticum aestivum L.) cultivars (e.g., Aikang 58). On the contrary, biotype 1 was able to overcome the resistance of wheat cultivars (e.g., Aikang 58), but not barley cultivars (e.g., Xiyin No.2). In 2016, clones of biotypes 1 and 3 were sampled on wheat and barley, respectively [4]. The two biotypes of S. avenae were reared on the plant of origin (i.e., wheat or barley) under a temperature of 22 ± 1 °C, a relative humidity of 65 ± 5%, and a photoperiod of 16:8 (L:D) h. Prior to the following experiments, all aphid clones were maintained under common laboratory conditions for at least three generations for the purpose of minimizing confounding environmental effects.

2.2. Fitness Bioassays of Both S. Avenae Biotypes on Wheat and Barley

In order to determine their fitness on wheat and barley, new-born first instar nymphs of both S. avenae biotypes were transferred onto single two-leaf stage seedlings (one nymph per seedling) of Aikang 58 (i.e., wheat) and Xiyin No.2 (i.e., barley) planted in 200 mL plastic pots [6 cm in diameter, containing turfy soil mixed with vermiculite and perlite (4:3:1, v/v/v)]. Each plastic pot was well enclosed with a transparent plastic cylinder (6 cm in diameter, 15 cm in height) which had a terylene mesh top for ventilation. Test aphid individuals on both plants, they were kept in growth chambers with the above-mentioned conditions and monitored for molting and reproductive events daily. New-born aphid individuals were counted and then removed from the plant each day. This experiment was terminated on day 10 after the initiation of reproduction for each test aphid individual. Thirty replicates were conducted for each S. avenae biotype on each plant (i.e., wheat or barley). The 10 d fecundities (offspring accumulated in 10 days since the initiation of reproduction) for each biotype on both plants were tabulated and analyzed by using one-way ANOVA in SAS [34]. Post-hoc comparisons between treatments were conducted by using Tukey tests at α = 0.05 following significant ANOVA.

2.3. RNA Sampling and Sequencing

New-born individuals of biotypes 1 and 3 were transferred onto Aikang 58 and Xiyin No.2 seedlings (one nymph per seedling) at the two-leaf stage. They were kept under the aforementioned laboratory conditions until reaching the adult stage. After that, they were allowed to feed for additional 24 h, and sampled for RNA sequencing. Ten wingless aphid individuals were collected and put into a 1.5 mL RNase-free tube each time. All RNA-seq aphid samples were frozen immediately in liquid nitrogen and stored in a freezer at –80 °C until use in RNA extraction. There were three biological replications for each S. avenae biotype on each plant. The total RNA of each sample was extracted with the MiniBEST Universal RNA Extraction Kit (Takara Bio Inc., Dalian, China), and RNase-free DNase I (Takara Bio Inc., Dalian, China) was used to remove the potential genomic DNA contamination of samples. Following the manufacturers’ instructions, the quality and quantity of RNA samples were estimated with a Bioanalyzer 2100 instrument (Agilent Technologies, CA, US) and NanoPhotometer® spectrophotometer (IMPLEN, CA, US).
The cDNA libraries for RNA samples were generated with the NEBNext® UltraTM RNA Library Prep Kit for Illumina (NEB, Beverly, MA, US). The Agilent Bioanalyzer 2100 system (Agilent Technologies, CA, US) was used to check the quality of these cDNA libraries. The paired-end DNA sequencing of all samples was conducted on an Illumina HiSeq 2500 platform (Illumina Inc., San Diego, CA) of Ovidson Gene Technology Co., Ltd., Beijing, China. Raw datasets of the above-mentioned RNA-seq samples have been submitted to the Sequence Read Archive (SRA) database of NCBI (National Center for Biotechnology Information) (NCBI accession ID: PRJNA575173).

2.4. Transcriptome Assembly and Annotation

Through filtering out low quality reads (more than 50% of nucleotides with Qphred ≤ 20), and reads with adapters and ambiguous “N” nucleotides >10% in raw datasets, clean datasets were obtained. At the same time, Q20, Q30 and GC-content of these clean datasets were calculated. We pooled clean reads of all samples and conducted the transcriptome assembly in TRINITY (v2.1.1) with default parameters (for details, see [35]). In order to minimize the redundancy effects, the software CD-HIT (v4.6.7) was used to process transcripts with 95% similarity [36]. The longest transcript of each gene was defined as a ‘unigene’ for functional annotation. Seven databases were used to annotate all unigenes: NR (NCBI non-redundant proteins, NCBI BLAST (basic local alignment search tool) 2.2.28+, e-value ≤ 1.0 × 10⁻⁵), NT (NCBI non-redundant nucleotides, NCBI BLAST 2.2.28+, e-value ≤ 1.0 × 10⁻⁵), Pfam (protein families, HMMER 3.0 package, hmmscan, e-value ≤ 0.01), KOG (eukaryotic orthologous groups, NCBI Blast 2.2.28+, e-value ≤ 0.001) and Swiss-Prot (a manually annotated and reviewed protein sequence database, NCBI BLAST 2.2.28+, e-value ≤ 1.0 × 10⁻⁵). Further orthology analyses for unigenes were performed to determine their molecular functions by using the KEGG (Kyoto Encyclopedia of Gene and Genomes) automatic annotation server (KAAS, KEGG Automatic Annotation Server, e-value ≤ 1.0 × 10⁻¹⁰) [1], and the resulting KO (KEGG Orthologs) terms were compared between the two biotypes. Gene ontology (GO) terms for each unigene were further processed in Blast2GO v2.5 with a threshold e-value of ≤ 1.0 × 10⁻⁵ [37].

2.5. Analysis of Gene Expression Patterns

The expression levels of each unigene were determined by RSEM v 1.2.3 (bowtie2 default parameters, mismatch = 0) through mapping each clean read to the assembled transcriptome [38]. Based on the obtained matrix of raw counts for each unigene in each sample, the differential expression of genes (DEGs) between two S. avenae biotypes on each plant (i.e., wheat or barley) was analyzed with DESeq2 (v 1.10.1) by using default parameters [39]. We identified 3392 and 2246 DEGs between biotypes 1 and 3 on wheat and barley, respectively. DEGs co-existed in aphids feeding on wheat and barley were considered to be common DEGs (i.e., 1528)—otherwise, they were considered wheat-specific DEGs (i.e., 1864) or barley-specific DEGs (i.e., 718). The significance of enrichment of differential expression genes in KEGG pathways was tested by using the KOBAS software [40]. GO term enrichment analysis for these DEGs were analyzed and visualized by using the online tools of GO analysis (https://www.omicshare.com/tools/Home/Soft/gogsea).

2.6. Quantitative Real-Time PCR (qRT-PCR)

In order to verify the results of the above-mentioned RNA-seq analysis, the expression of 12 selected genes was examined by using the qRT-PCR (quantitative reverse transcription-polymerase chain reaction) method. The gene NADH (nicotinamide adenine dinucleotide dehydrogenase, c93747_g4) was chosen as the reference gene because of its consistent expression in our study [M (stability measure value) = 0.177, SV (stability value) = 0.039]. Gene-specific primers were designed by using Beacon Designer version 8.0 (Premier Biosoft, Palo Alto, CA). All the primers used are listed in Table S1. PCR reactions were prepared with the SYBR Premix Ex Taq™ Kit (Takara, Dalian, China) according to the manufacturer’s instructions. All qRT-PCR reactions were performed on the Roche LightCycler® 480 II system (Roche Diagnostics Ltd., Rotkreuz, Switzerland), with three biological replicates and two technical replicates for each gene. The qPCR cycling parameters were as follows: 95 °C for 5 min, followed by 40 cycles of 95 °C for 10 s and 60 °C for 30 s. To confirm the homogeneity of the PCR products, reaction stages for establishment of melt curves (95 °C for 5 s, 65 °C for 1min, and 95 °C for 5 s) were also included. The relative expression level of each gene was calculated by using the 2−ΔΔCt method [41]. The relative expression levels and FPKM values of each gene were compared between the two biotypes by using the student t test in the software SPSS Statistics 23 (IBM SPSS Statistics Inc., Chicago, IL, USA).

3. Results

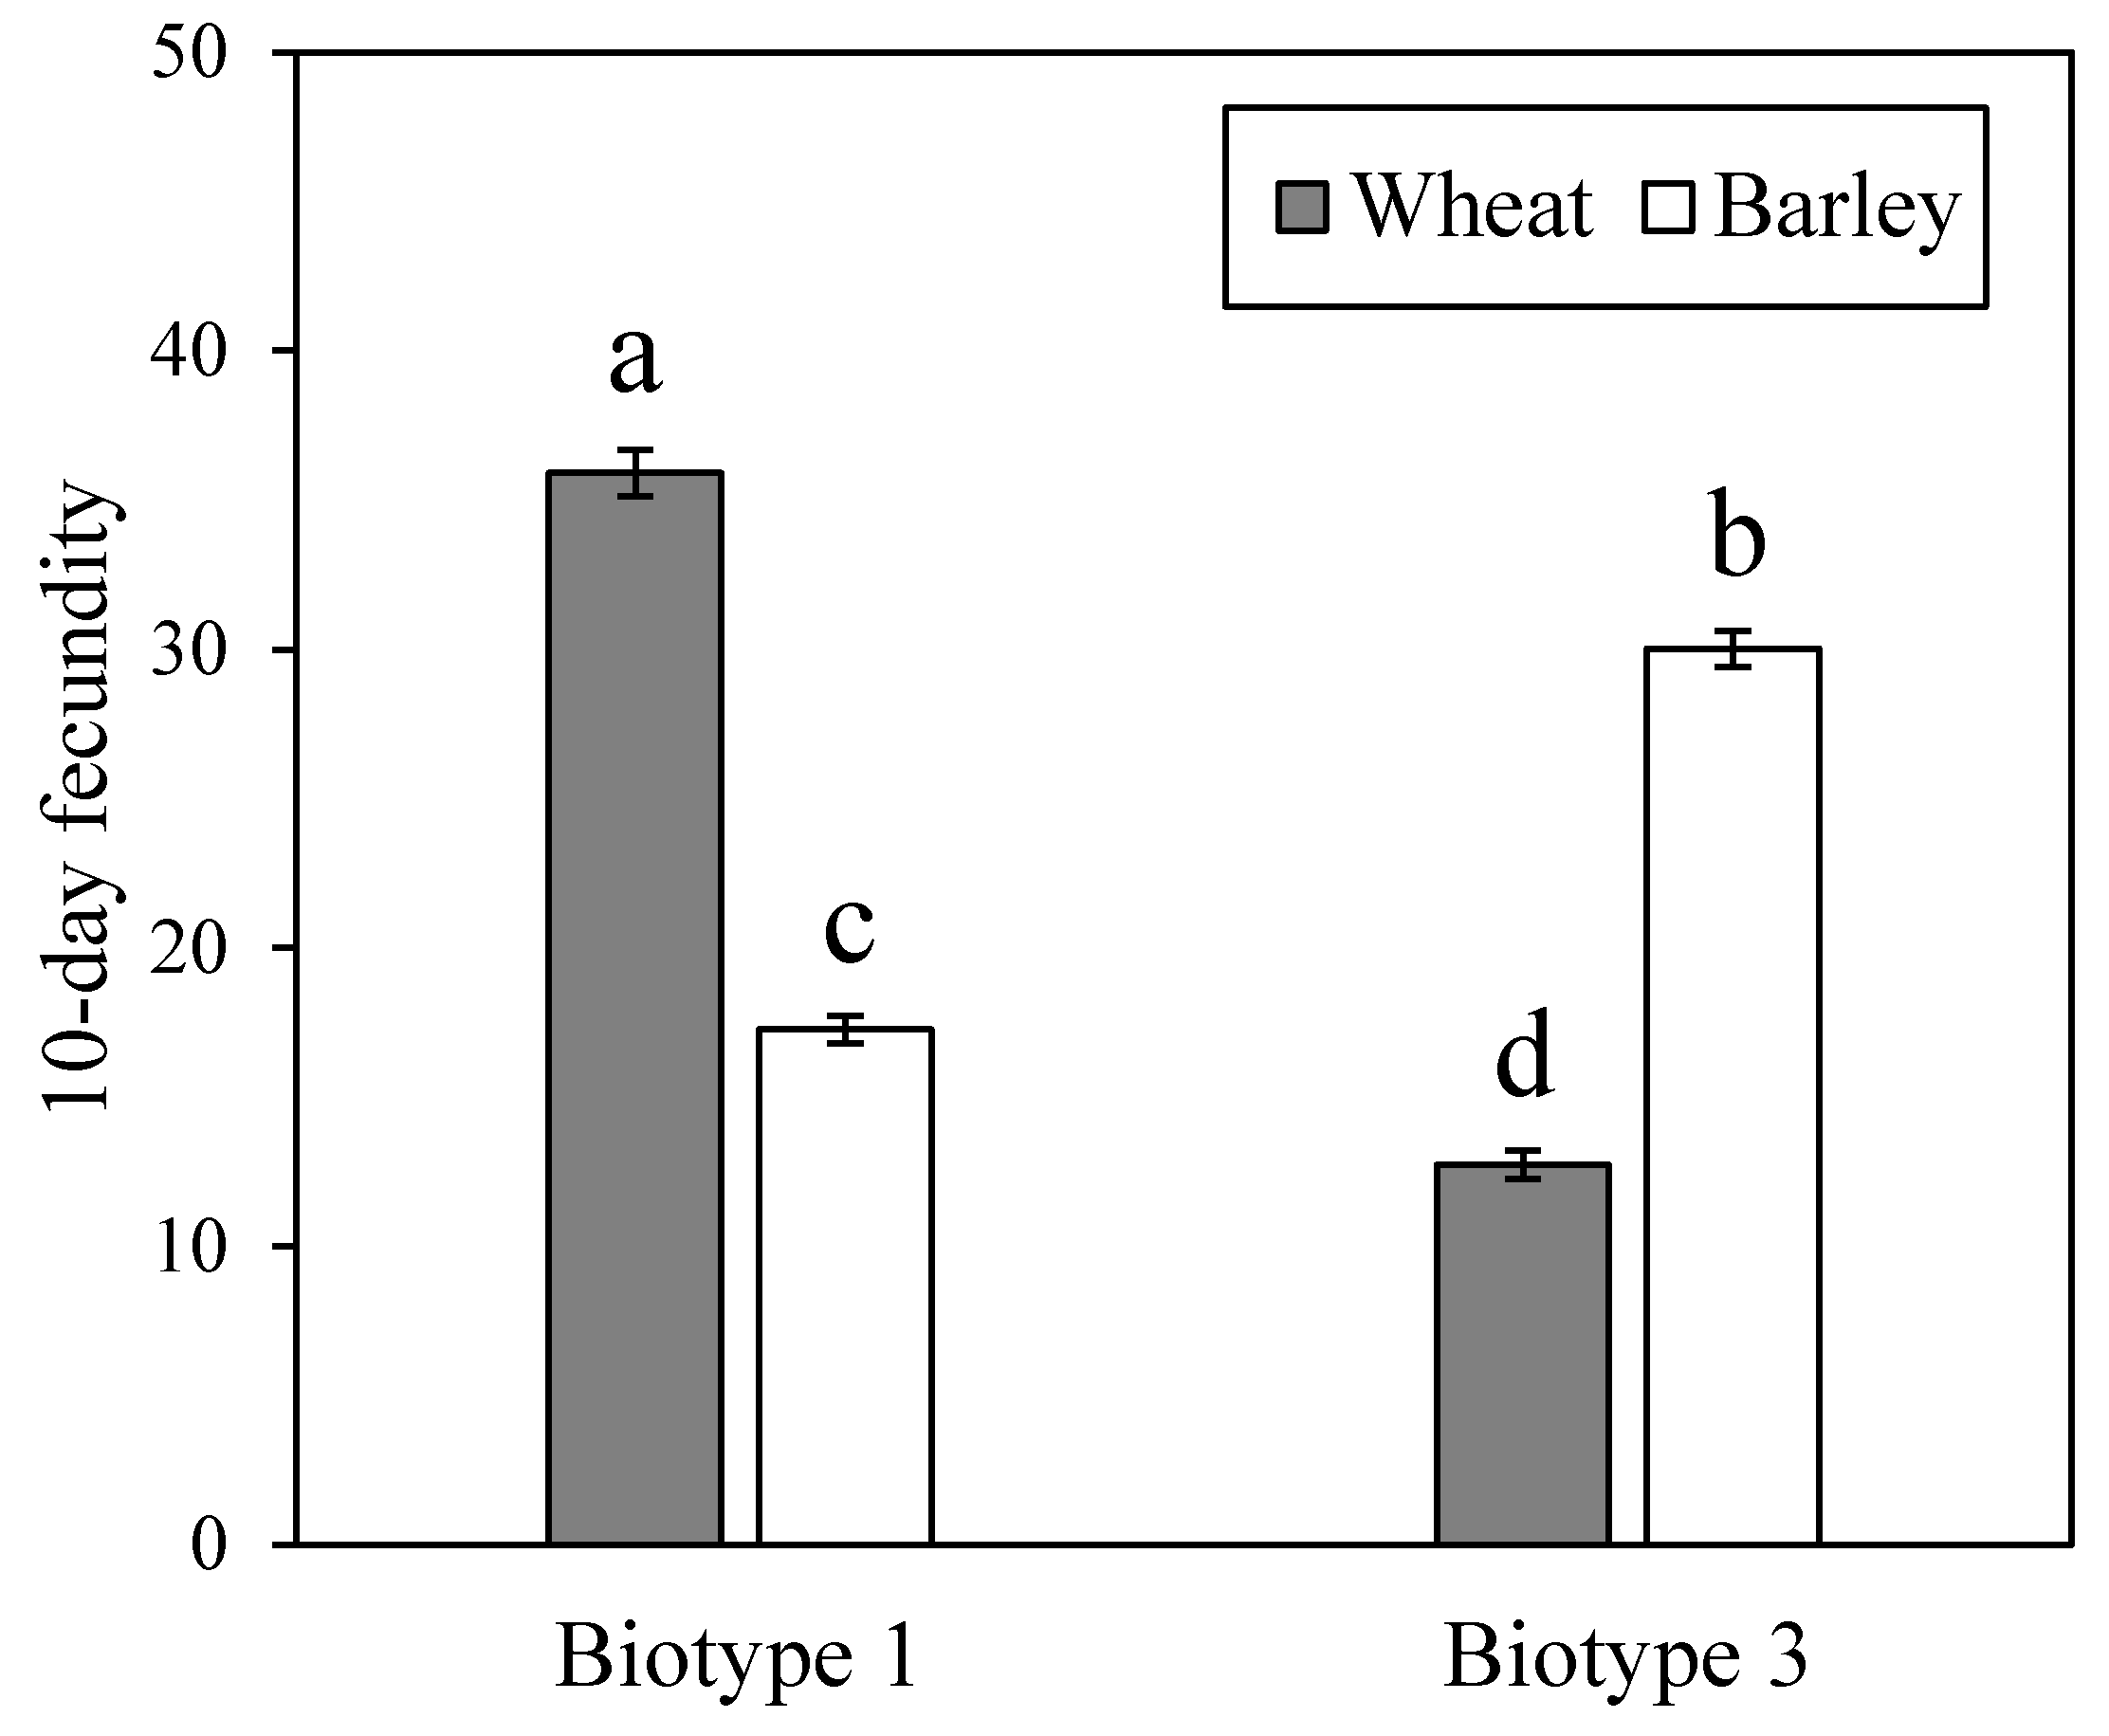
3.1. Fitness Performance of Two S. Avenae Biotypes on Wheat and Barley

The 10 d fecundity of S. avenae biotype 1 on Aikang 58 (i.e., wheat) (35.9 ± 0.8) was higher than that on Xiyin No.2 (i.e., barley) (17.3 ± 0.5) (Figure 1; F = 332.13; df = 3, 116; p < 0.001), and biotype 3 showed lower fecundity on wheat (12.7 ± 0.5) than on barley (30.0 ± 0.6). In addition, on wheat, the 10 d fecundity of biotype 1 was higher than that of biotype 3. In contrast, on barley, biotype 3 showed higher fecundity compared with biotype 1. Thus, the differential performance of the two biotypes on wheat and barley clearly suggests their adaptive divergence on both plants.

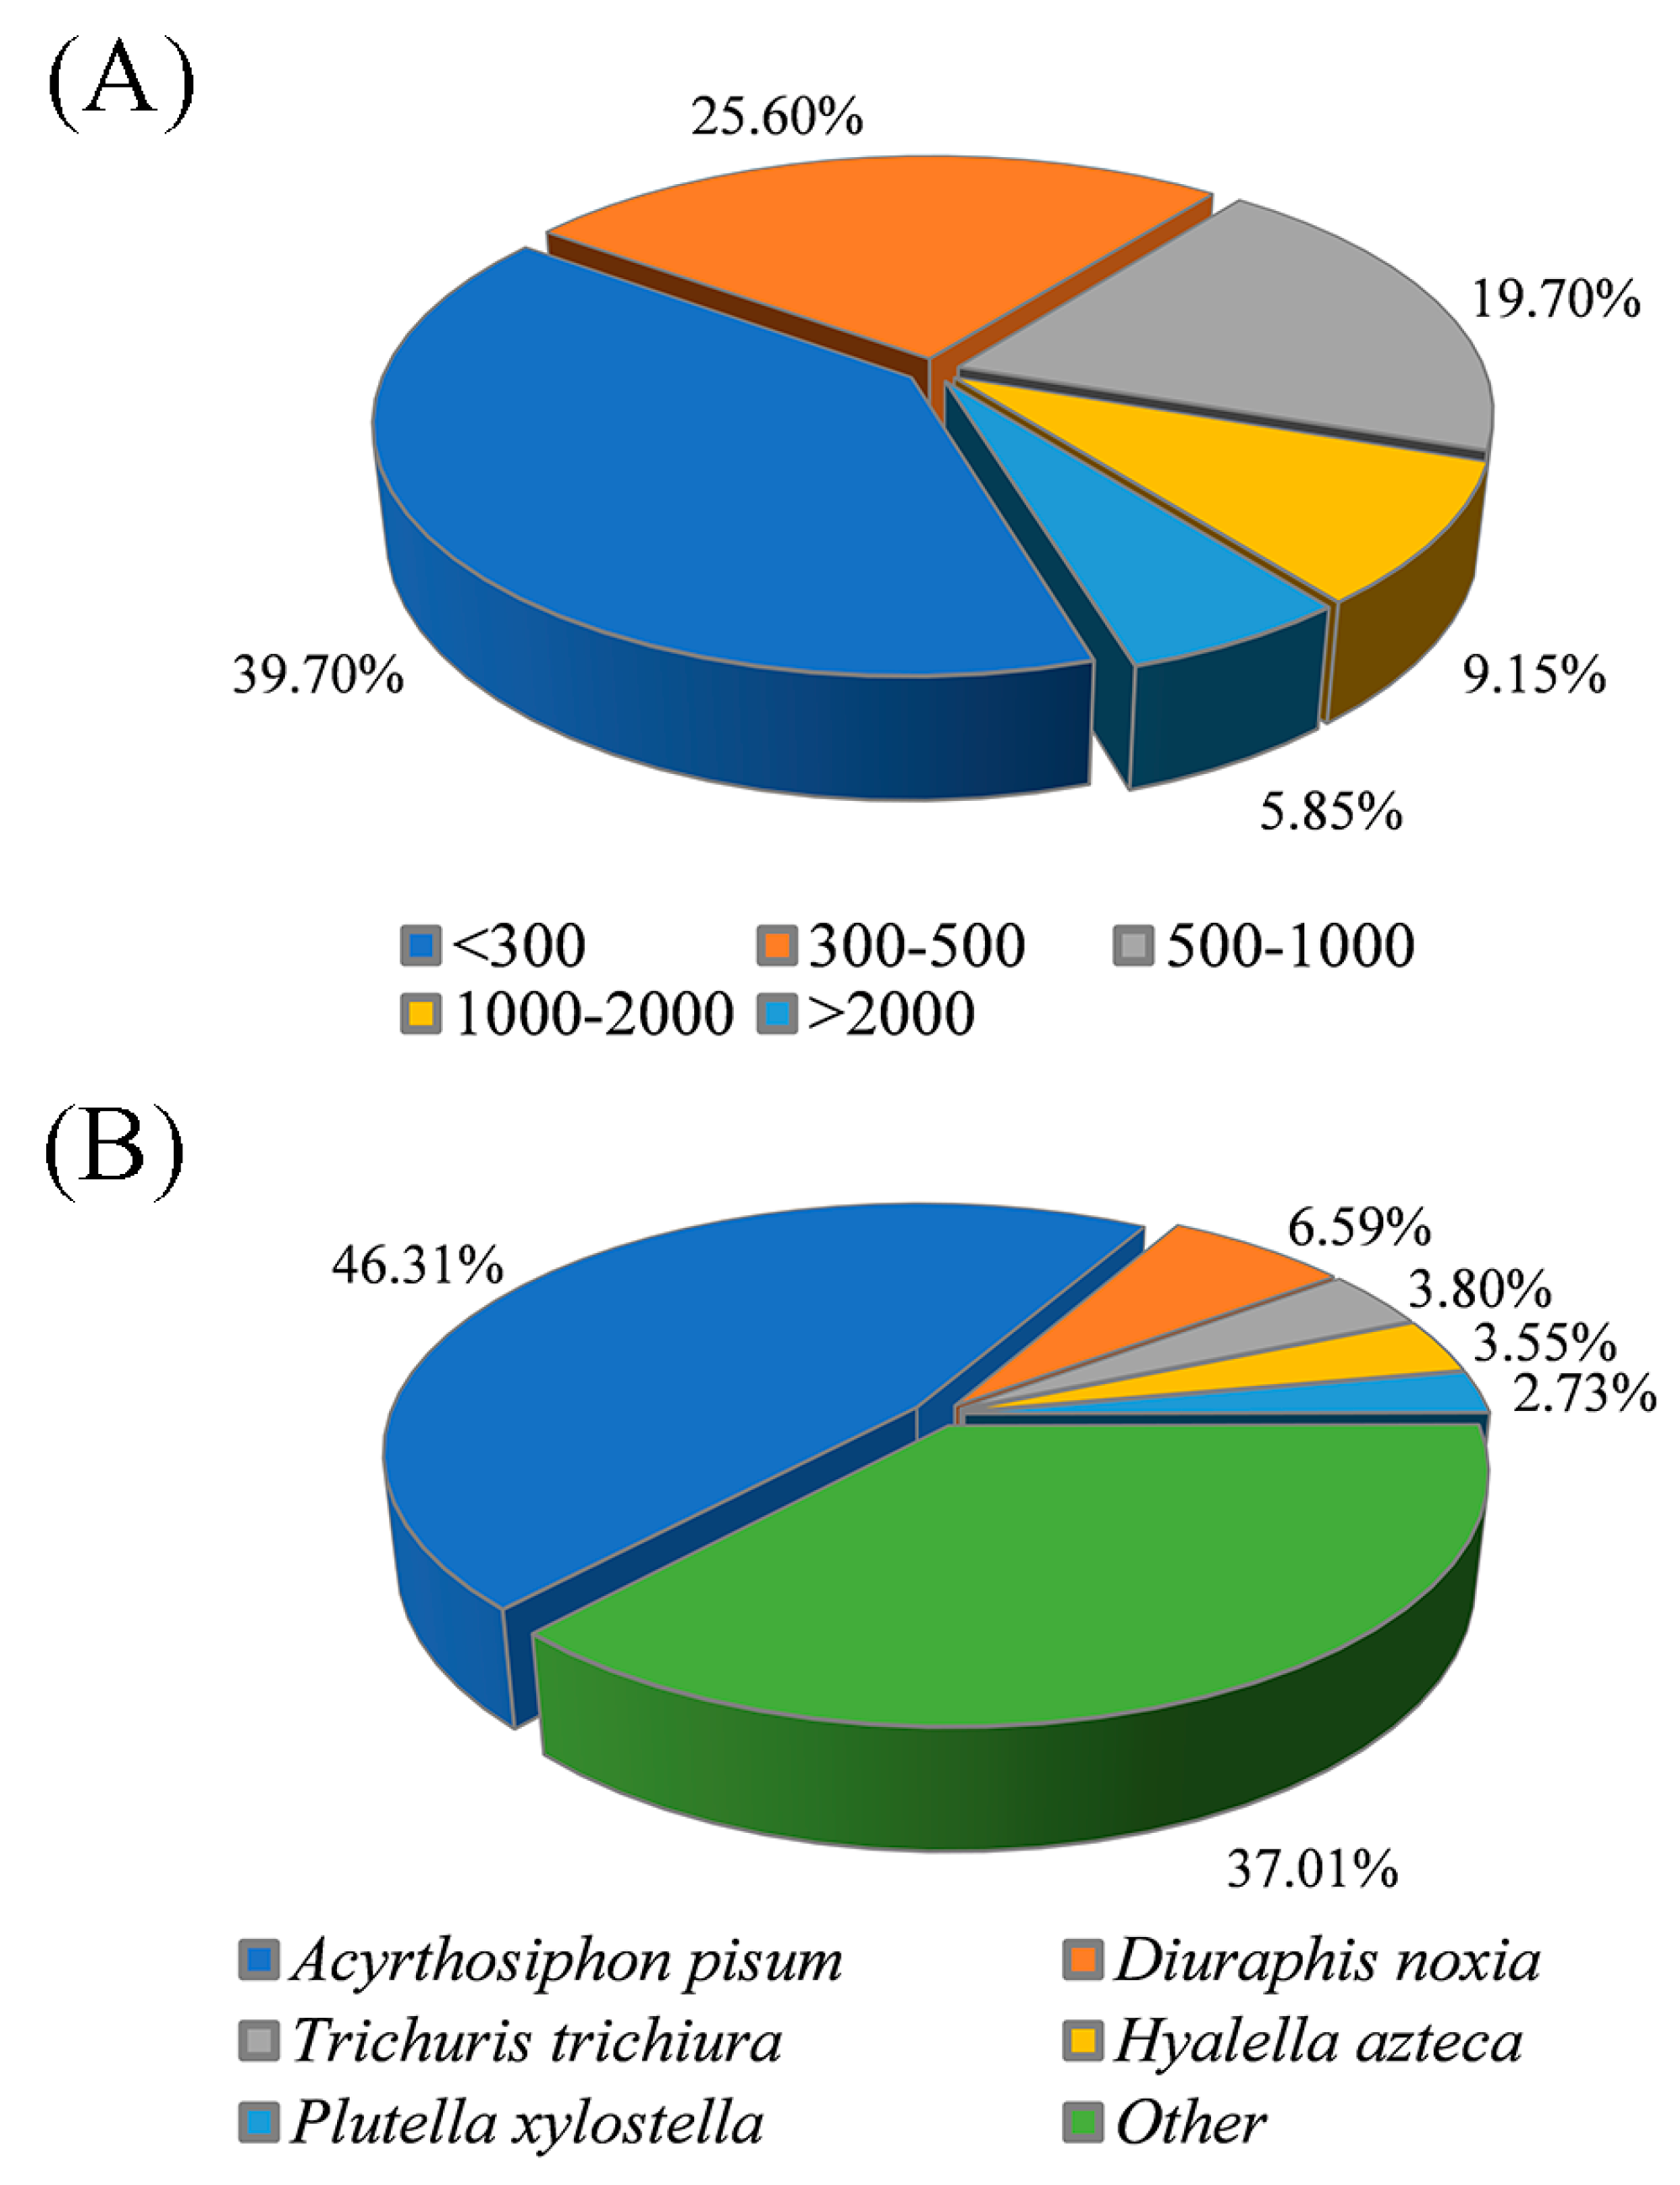
3.2. De Novo Assembly and Transcriptome Annotation

In total, 343,816,452 raw reads and 337,188,919 clean reads were obtained in this study (Table 1). The Q20 of all samples was >98.66%, and the Q30 was >96.18%, showing the high quality of the RNA-Seq analysis. Each sample library was mapped back to the full assembly, with overall alignment rates of 71.67%–73.23%. The de novo assembly yielded 143,058 unigenes. The median length of these unigenes was 358 bp, with a N50 (length N for which 50% of all bases in the assembly are located in a unigene of length < N) of 1012 bp. As shown in Figure 2A, the unigenes of length < 300 bp and >500 bp accounted for 39.70% and 34.70% of the total, respectively, whereas 25.60% of all the unigenes fell between 300 and 500 bp.
For functional annotation, 40.52% (57,961) of all the unigenes matched entries in databases of NR, NT, KO, Swiss-Prot, PFAM, GO or KOG (Table S2). In total, 8420 (5.89%) unigenes had matches in all seven databases. In total, 35,636 (24.91%) and 44,988 (31.45%) unigenes showed hits in the databases NR and NT, respectively. The highest percentage of S. avenae unigenes were matched with sequences for Acyrthosiphon pisum (46.31%), followed by Diuraphis noxia (6.59%), Trichuris trichiura (3.80%), Hyalella azteca (3.55%), and Plutella xylostella (2.73%) (Figure 2B).

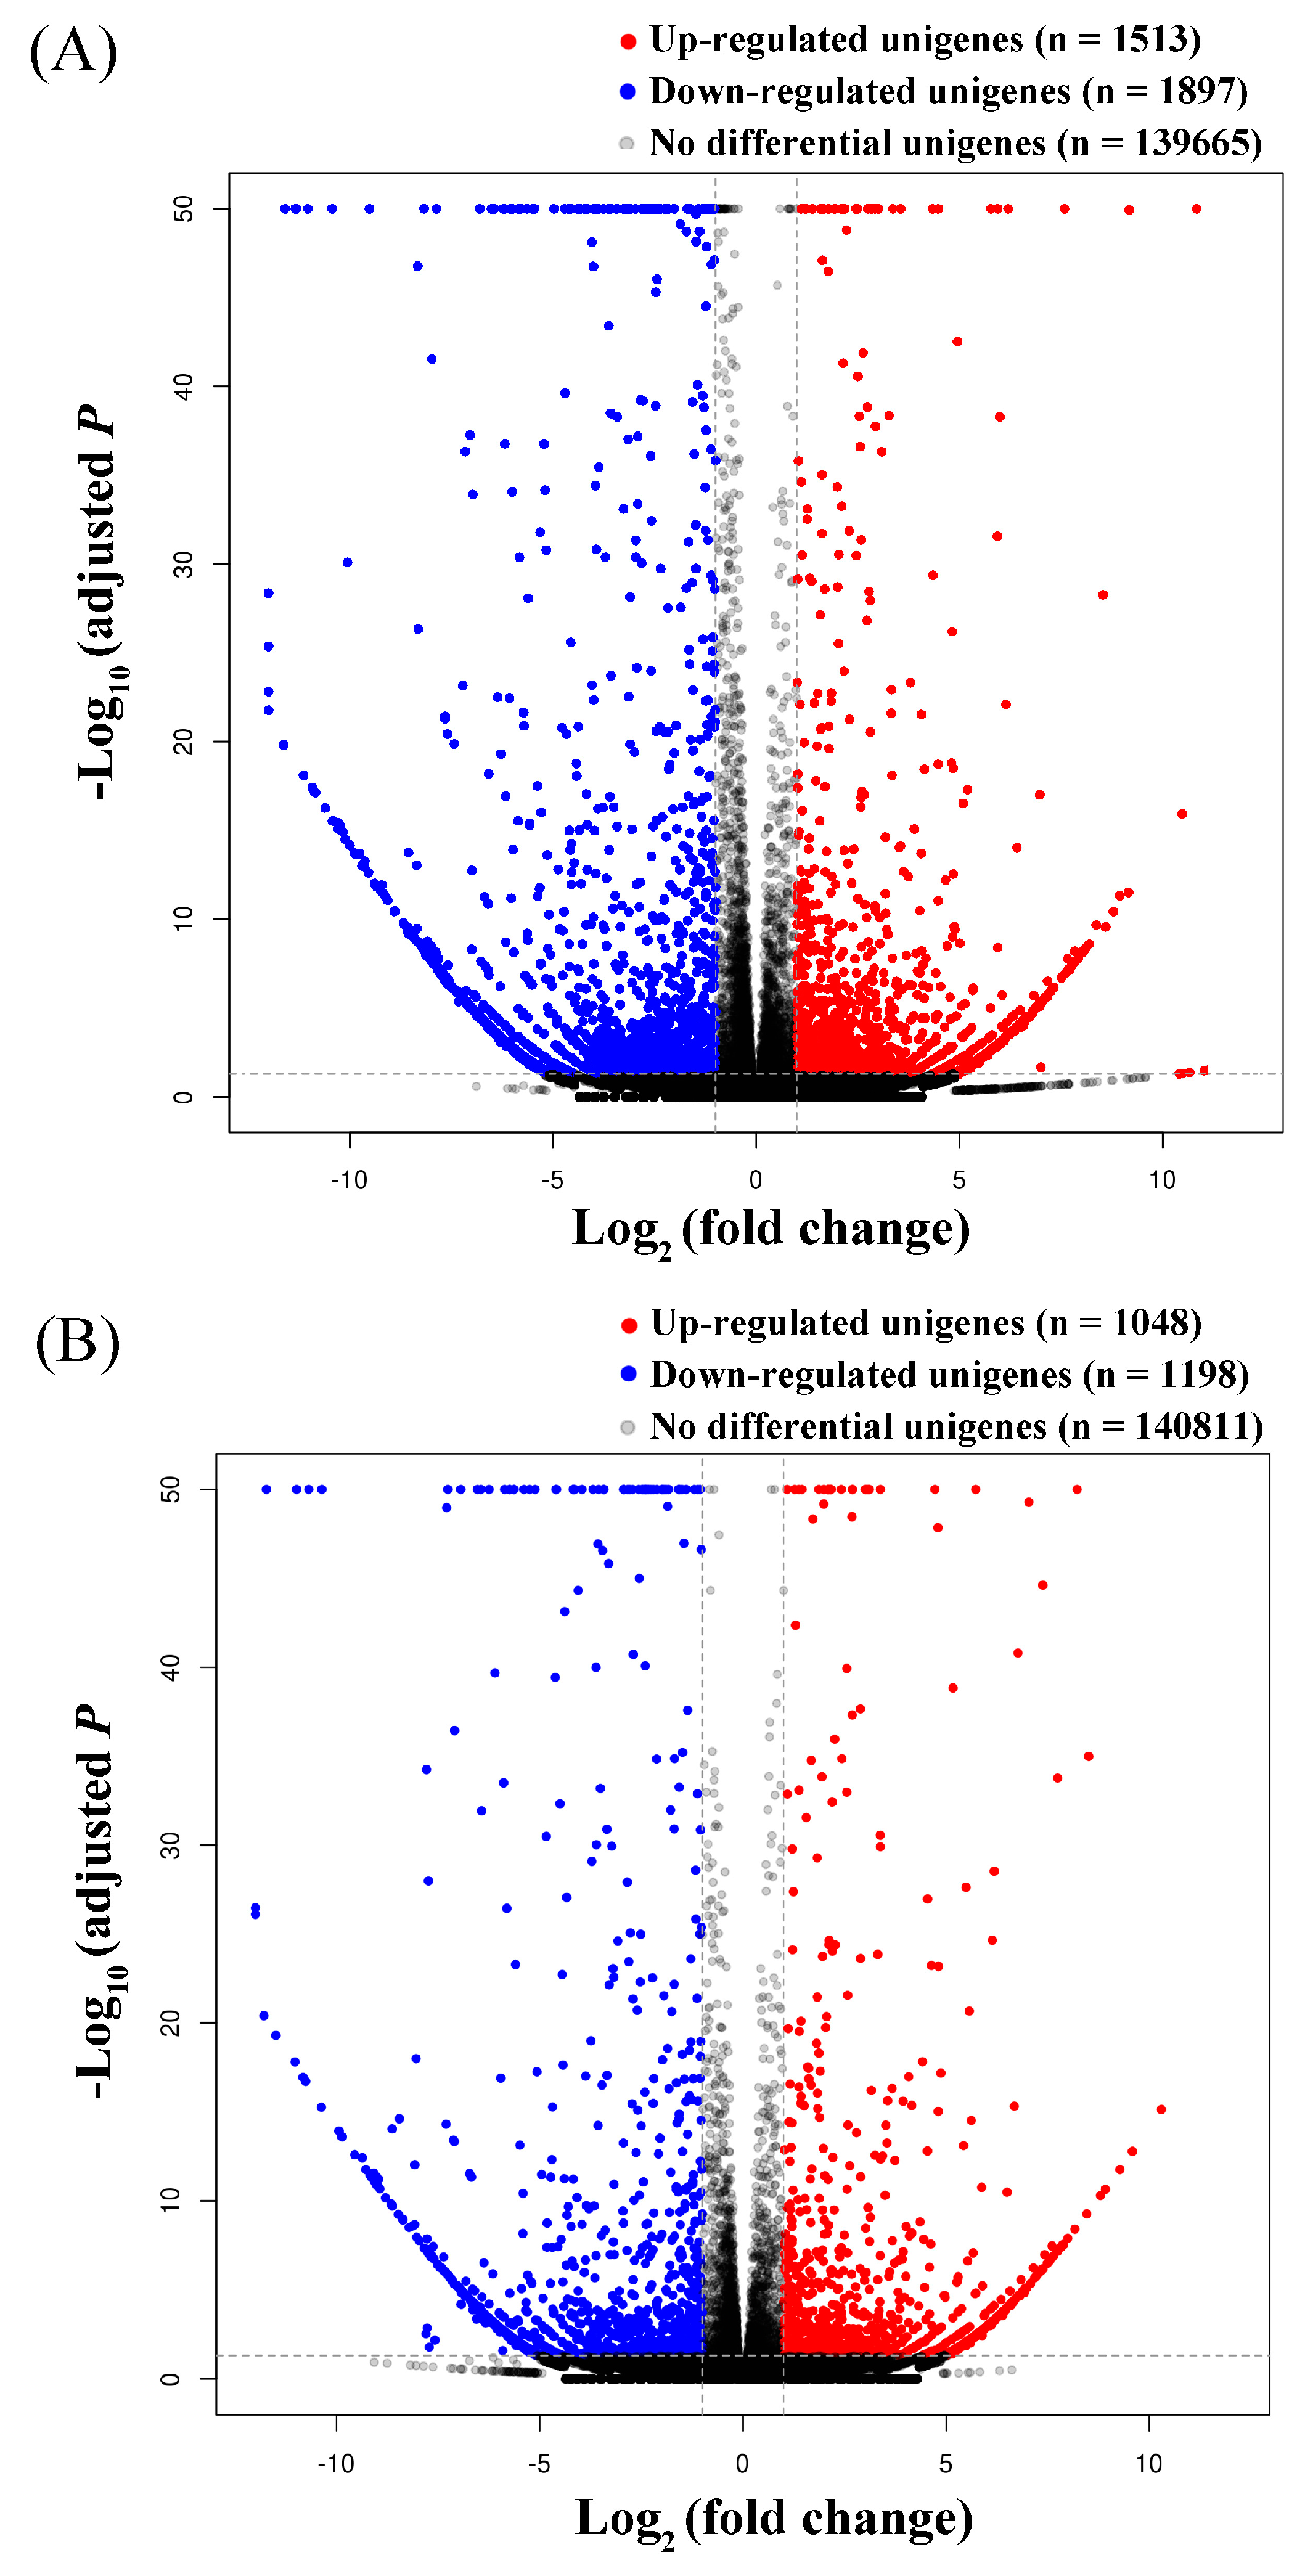
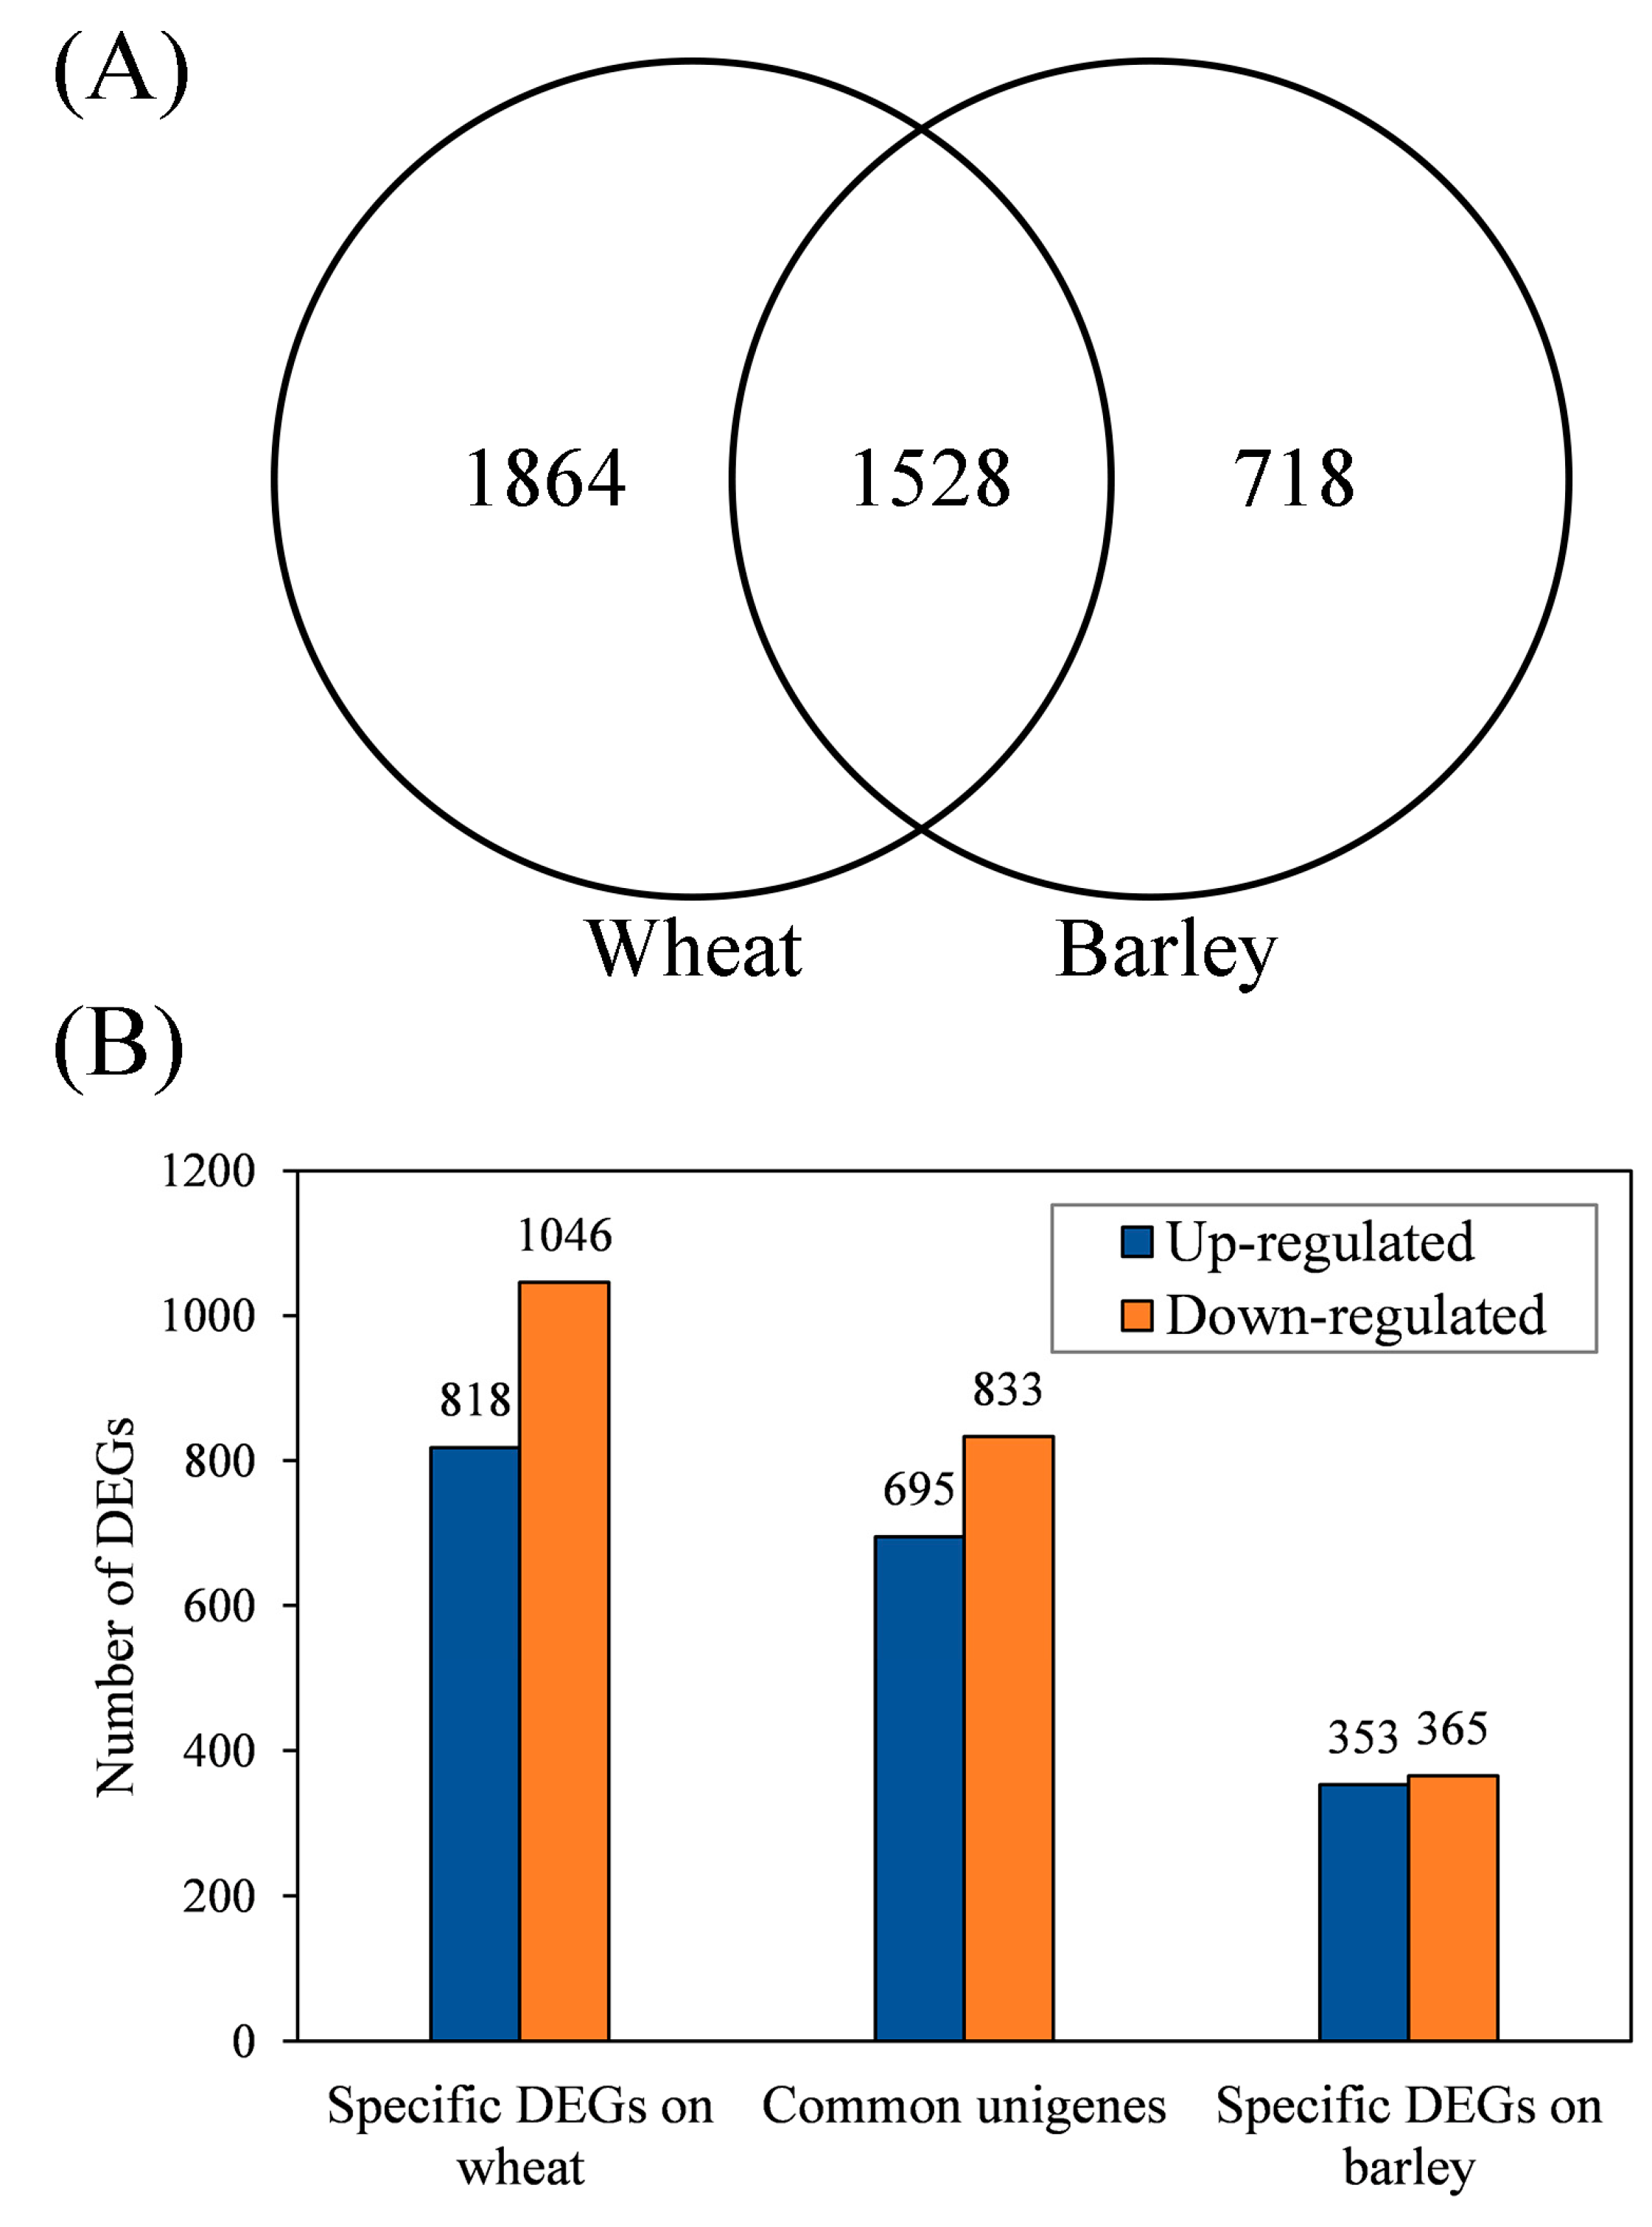
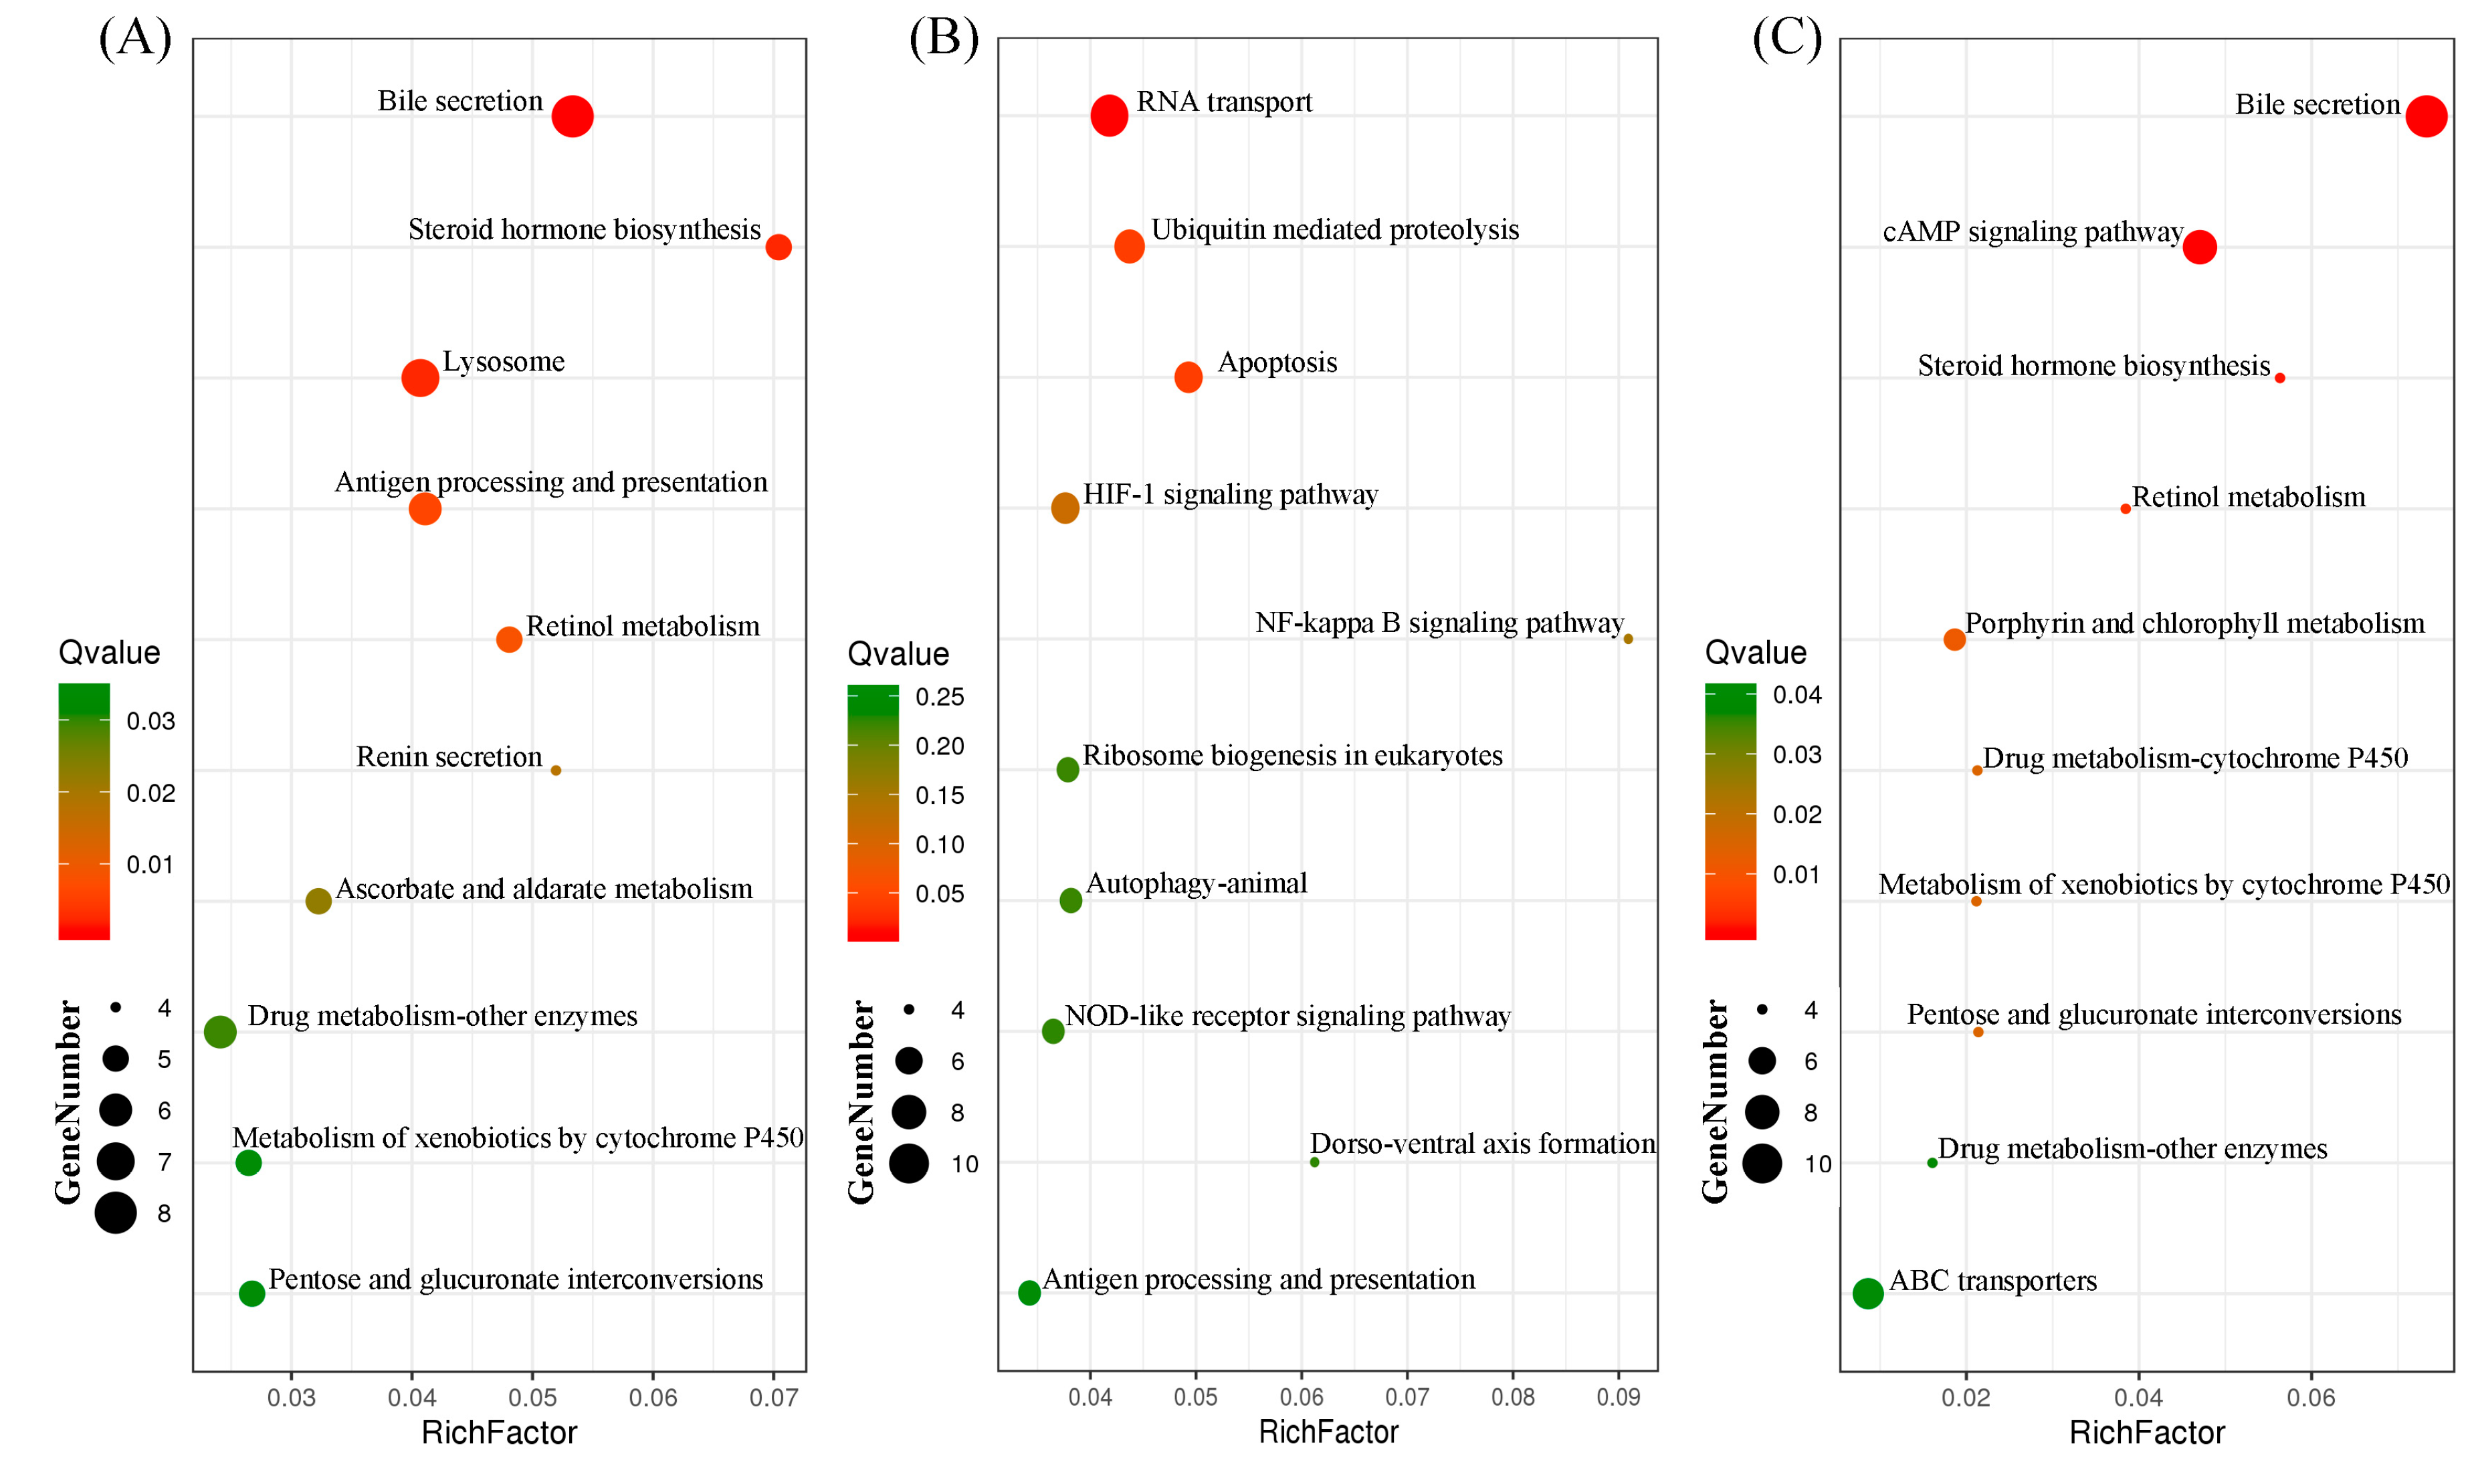
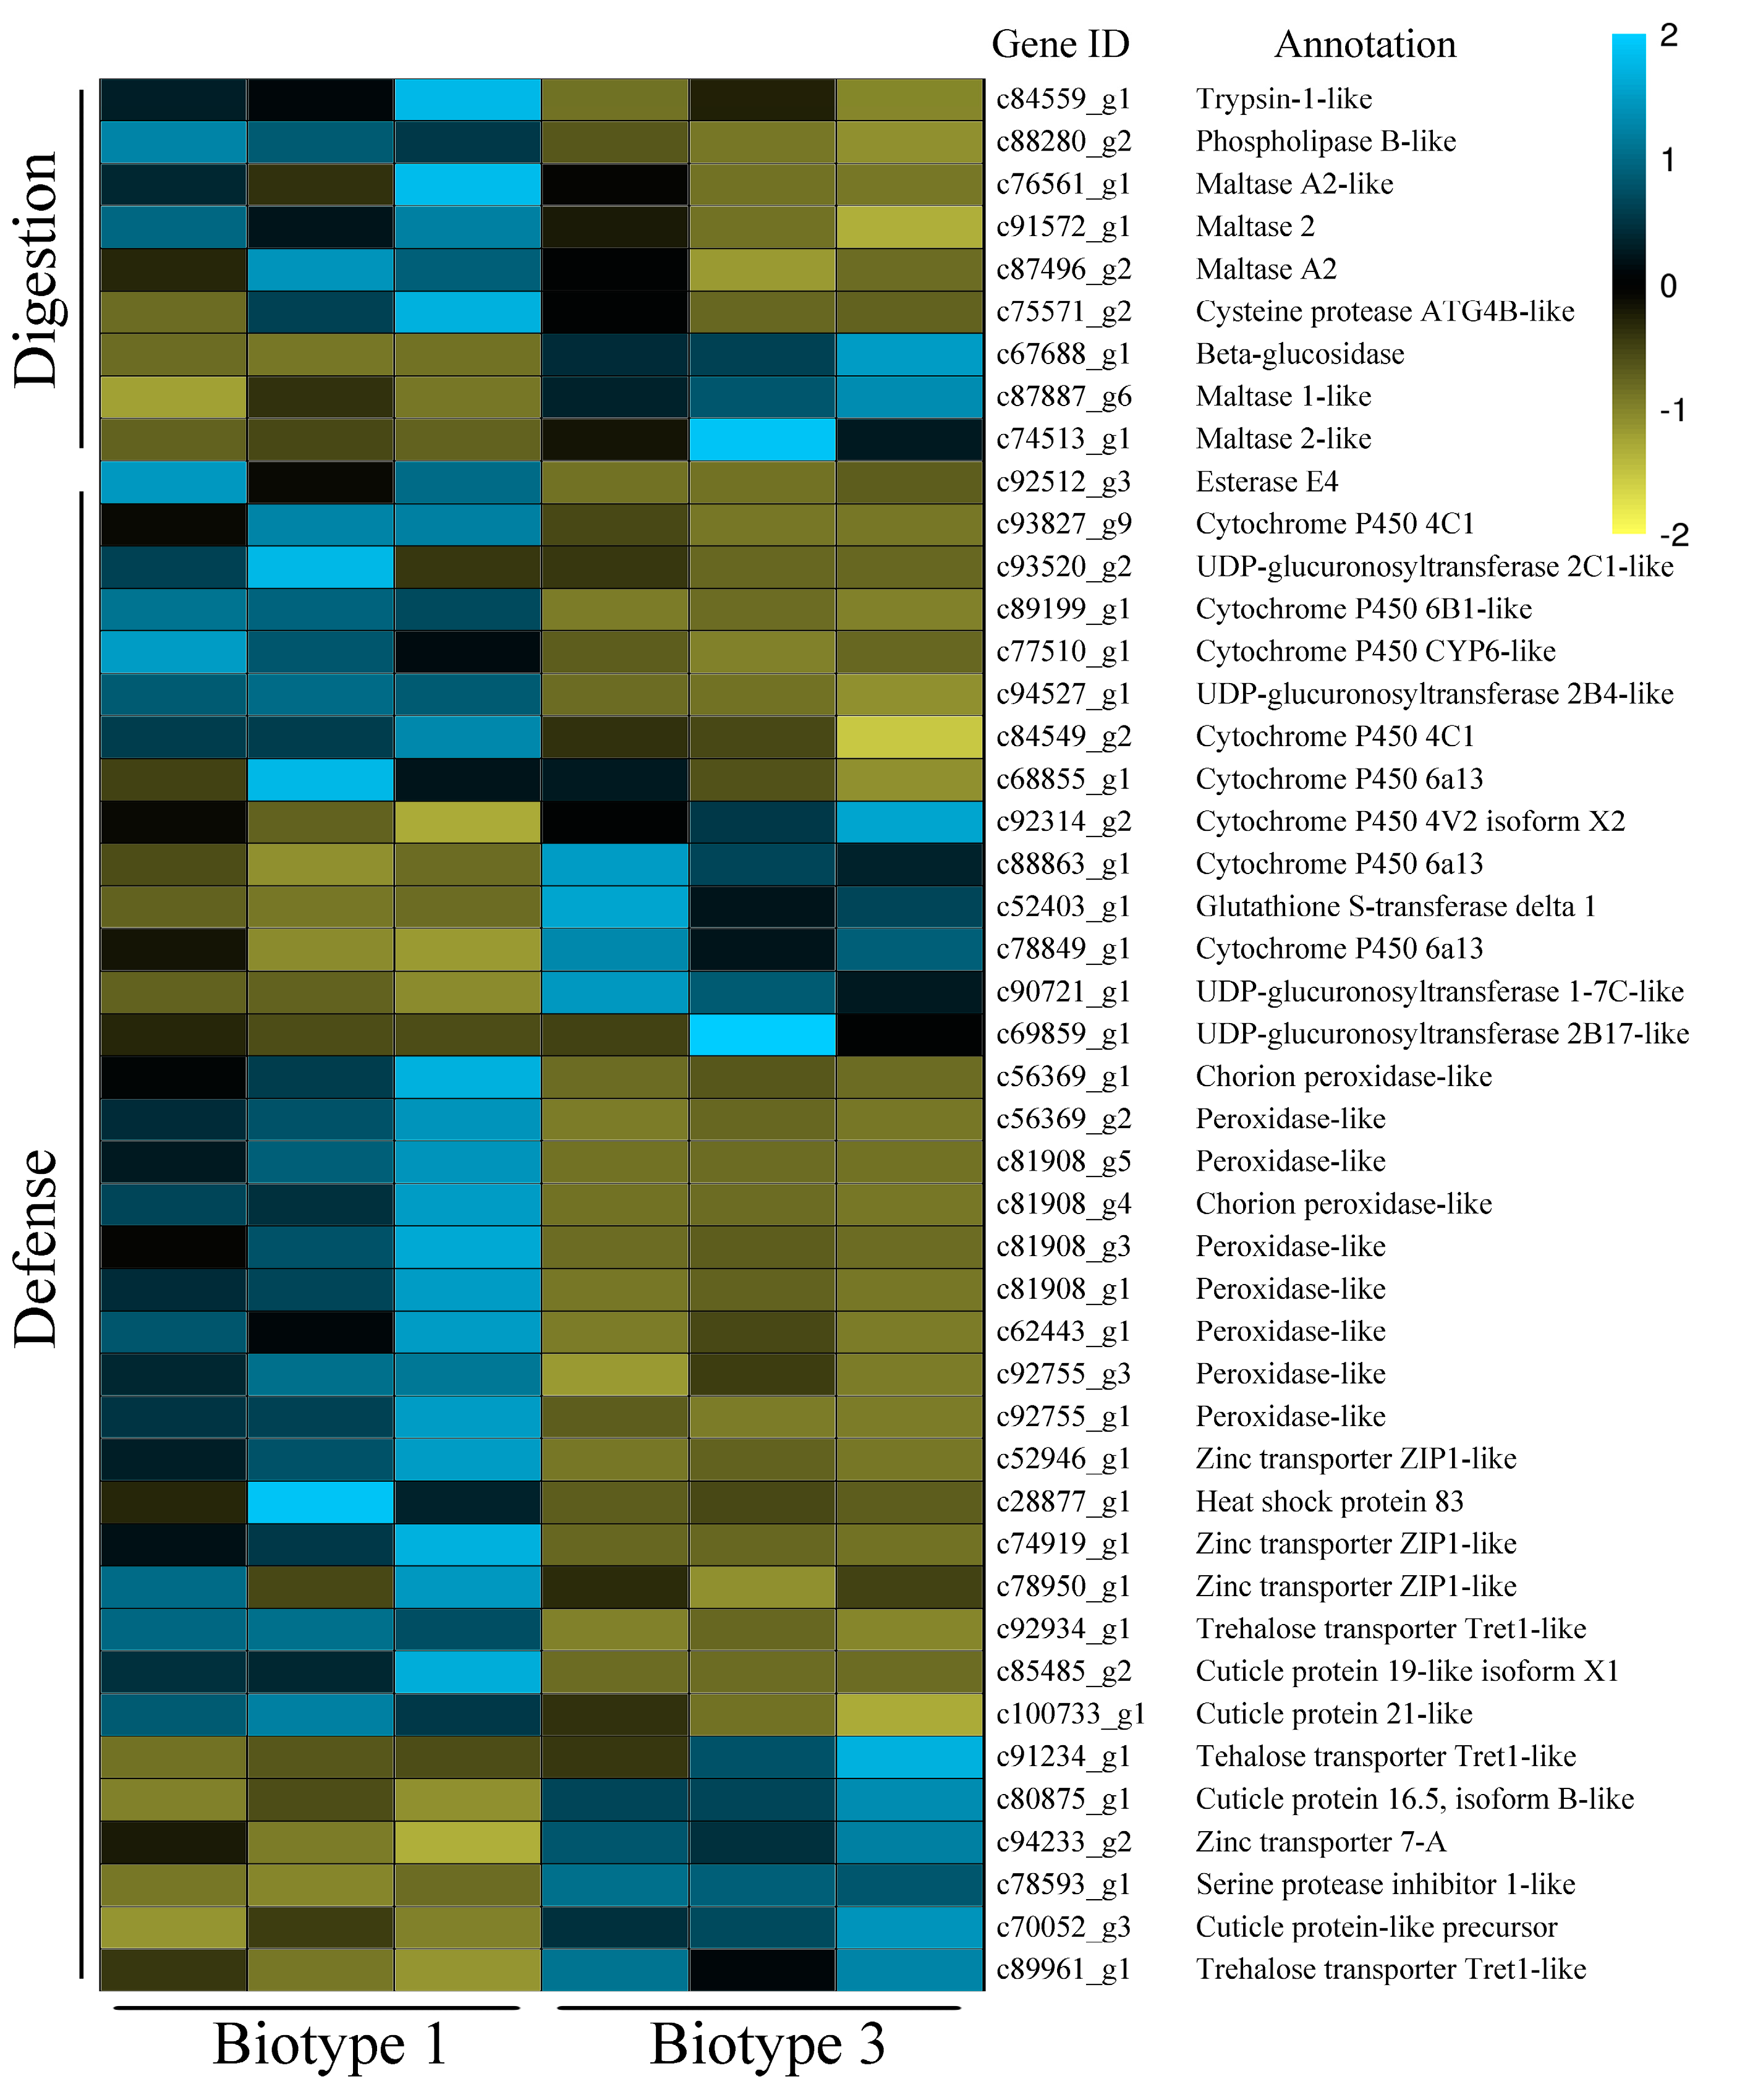
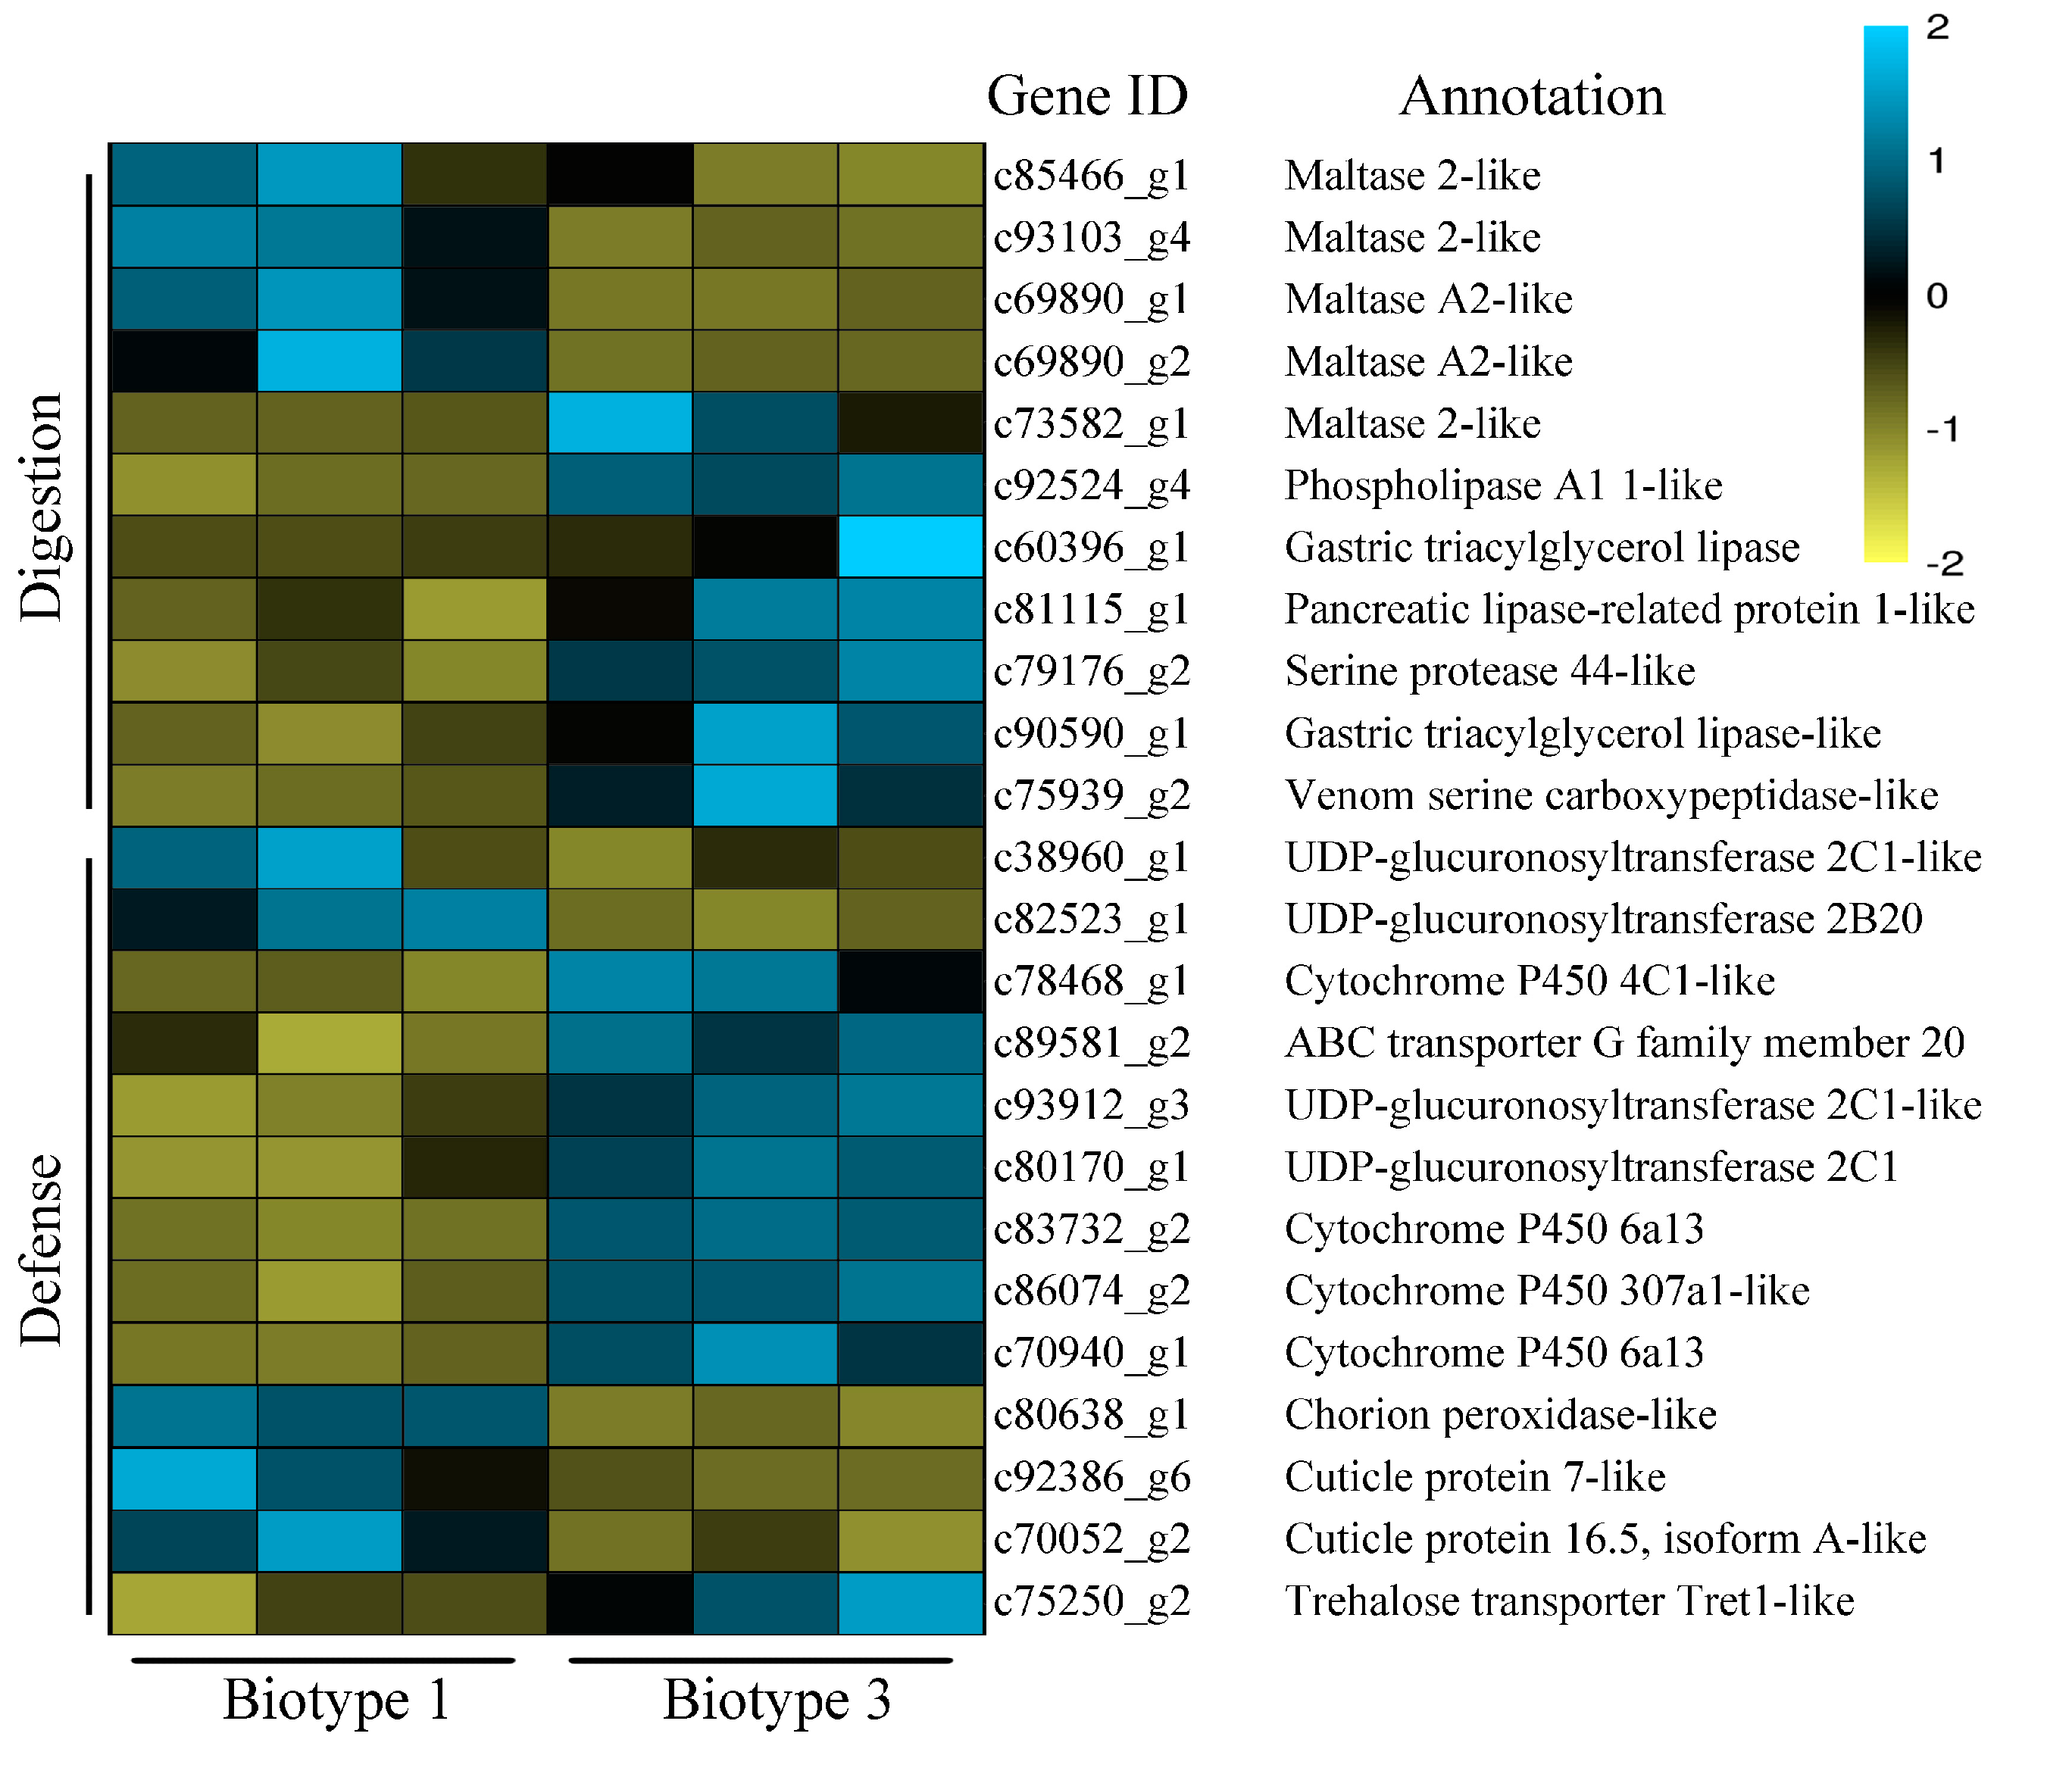
3.3. Identification of Common and Specific DEGs (Differentially Expressed Genes) and Enrichment Analyses

On wheat, 3392 DEGs (adjusted p values <0.05, fold change values >2) were detected between S. avenae biotypes 1 and 3 (Figure 3). For these DEGs, 1513 of them were up-regulated, and 1879 were down-regulated in biotype 3 compared to biotype 1 (biotype 3 vs. biotype 1). On barley, 1048 up- and 1198 down-regulated genes (2246 DEGs in total) were detected between the two biotypes (biotype 3 vs. biotype 1). In addition, 1528 DEGs (referred to as common DEGs hereafter) occurred in the two biotypes feeding on both wheat and barley (Figure 4A), and they included 695 up-regulated genes and 833 down-regulated genes (biotype 3 vs. biotype 1, Figure 4B). One thousand eight hundred sixty-four and 718 DEGs (referred to as specific DEGs hereafter) occurred only in the two biotypes feeding on wheat and barley, respectively (Figure 4A). Of the 1864 specific DEGs on wheat, 818 and 1046 genes were up-regulated and down-regulated, respectively (biotype 3 vs. biotype 1) (Figure 4B). Of the 718 specific DEGs on barley, 353 and 365 genes were up-regulated and down-regulated, respectively (biotype 3 vs. biotype 1) (Figure 4B).
Common DEGs were significantly enriched (FDR < 0.05) for GO terms related to activities of proteolysis, peptidase, glucuronosyltransferase, serine-type peptidase, serine hydrolase, glucuronosyltransferase, UDP-glycosyltransferase, and etc. (Table 2). A KEGG pathway enrichment analysis of these common DEGs (Figure 5A) showed that the top 10 enriched pathways were associated with bile secretion (ko04976), steroid hormone biosynthesis (ko00140), lysosome (ko04142), antigen processing and presentation (ko04612), retinol metabolism (ko00830), renin secretion (ko04924), ascorbate and aldarate metabolism (ko00053), drug metabolism-other enzymes (ko00983), pentose and glucuronate interconversions (ko00040), and metabolism of xenobiotics by cytochrome P450 (ko00980). For specific DEGs on wheat, significantly enriched GO terms included regulation of cell proliferation, response to oxidative stress, detoxification, response to toxic substance, response to stress, protein acylation, cysteine-type peptidase activity, peroxidase activity, oxidoreductase activity, and etc (Table 3). In the KEGG analysis of specific DEGs on wheat (Figure 5B), the top 10 enriched pathway categories were RNA transport (ko03013), ubiquitin mediated proteolysis (ko04120), apoptosis (ko04210), HIF-1 signaling pathway (ko04066), NF-kappa b signaling pathway (ko04064), autophagy-animal (ko04140), ribosome biogenesis in eukaryotes (ko03008), NOD-like receptor signaling pathway (ko04621), dorso-ventral axis formation (ko04320), and antigen processing and presentation (ko04612). For specific DEGs on barley, GO terms were significantly enriched (FDR < 0.10) for activities of lipid translocation, phospholipid transport, phospholipid transporter, gamma-glutamyltransferase, lipid transporter, transferase, lysine-tRNA ligase, oxidoreductase, and etc. (Table 4). The top 10 enriched pathway categories of KEGG analysis for specific DEGs on barley (Figure 5C) were bile secretion (ko04976), cAMP signaling pathway (ko04024), steroid hormone biosynthesis (ko00140), retinol metabolism (ko00830), porphyrin and chlorophyll metabolism (ko00860), pentose and glucuronate interconversions (ko00040), drug metabolism-cytochrome P450 (ko00982), metabolism of xenobiotics by cytochrome P450 (ko00980), drug metabolism-other enzymes (ko00983), and ABC transporters (ko02010).
Based on the results of the above-mentioned enrichment analyses, transcriptional changes associated with defense and digestion were further explored. For common DEGs, 16 genes related to digestion were identified, including three serine proteases, five lipases, three phospholipases, two carbohydrases, one maltase, one galactosidase, and one mannosidase (Table 5). Of them, two phospholipases [log2(fold change): 8.35–8.99] and one lipase [log2(fold change): 1.97–2.46] were up-regulated in biotype 1 compared with biotype 3. Forty common DEGs related to defense were also identified, including eight cytochrome P450 monooxygenases (P450s), six UDP-glycosyltransferases (UGTs), three glutathione S-transferases (GSTs), four esterases (ESTs), six peroxidases (PODs), two cuticle proteins (CPs), one heat shock protein (HSP), one superoxide dismutase (SOD), and etc. Among these defense-related DEGs, 13 genes (i.e., four P450s, one GST, two UGTs, the ABC transporter, two alkaline phosphatases, two ESTs and one CP) were up-regulated in biotype 3 compared with biotype 1, whereas the other genes showed higher expression in biotype 1. Among these, the top defense-related common DEGs (biotype 3 vs. biotype 1) with the most significant changes included three PODs [log2(fold change) for c81908_g2: −8.48 to −12.42; for c58802_g1: −5.56 to −5.86; for c86869_g1: −3.57 to −3.63], two CPs [log2(fold change) for c65501_g1: −6.57 to −6.68; for c81826_g1: 4.8 to 5.94], one SOD [log2(fold change): −4.71 to −5.12], one EST [log2(fold change): 3.21 to 4.02], one HSP [log2(fold change): −2.38 to −4.76], two UGTs [log2(fold change) for c91399_g1: −2.18 to −3.32; for c89981_g3: −2.41 to −3.11], and one GST [log2(fold change): 2.84–3.01].
For specific DEGs on wheat, nine genes were annotated to digestion, including five maltases, one β-glucosidase, one trypsin, one cysteine protease, and one phospholipase (Figure 6). Except for the two maltases and the phospholipase, all these digestion related DEGs were up-regulated in biotype 1 compared with biotype 3. Thirty-six specific DEGs on wheat were annotated to defense, including eight P450s, four UGTs, one GST, one EST, nine PODs, four CPs, four zinc transporters (ZIPs), one serine protease inhibitor, one HSP, and three trehalose transporters. Among these, five P450s, two UGTs, nine PODs, the EST, three ZIPs, two CPs, one serine protease inhibitor, and one HSP were up-regulated in biotype 1 compared with biotype 3. Among these, the top defense-related specific DEGs (biotype 3 vs. biotype 1) on wheat with the most significant changes included eight PODs [i.e., c81908_g5, c81908_g4, c81908_g1, c81908_g3, c62443_g1, c56369_g1, c56369_g2, c92755_g1; log2 (fold change) values ranged from −6.03 to −11.13] and two UGTs [i.e., c93520_g2 and c69859_g1 with log2 (fold change) values being −5.76 and 6.49, respectively].
For specific DEGs on barley, 11 genes related to digestion were identified, including one serine protease, three lipases, one phospholipase, five maltases, and one serine carboxypeptidase (Figure 7). Among them, all three lipases, one maltase, the serine protease and the serine carboxypeptidase were up-regulated in biotype 3 compared with biotype 1. Thirteen defense-related specific DEGs on barley were also identified, including four P450s, four UGTs, one ABC transporter, one POD, two CPs, and one trehalose transporter. Of them, all four P450s, two UGTs, the ABC transporter, and one trehalose transporter were up-regulated in biotype 3 compared with biotype 1. Among these, the top defense-related specific DEGs (biotype 3 vs. biotype 1) on barley with the most significant changes included two UGTs [i.e., c80170_g1 and c82523_g1 with log2(fold change) values being 5.39 and −1.53, respectively], two P450s [i.e., c70940_g1 and c78468_g1 with log2(fold change) values being 2.71 and 1.58, respectively], and one CP [i.e., c92386_g6, log2(fold change): 2.12].

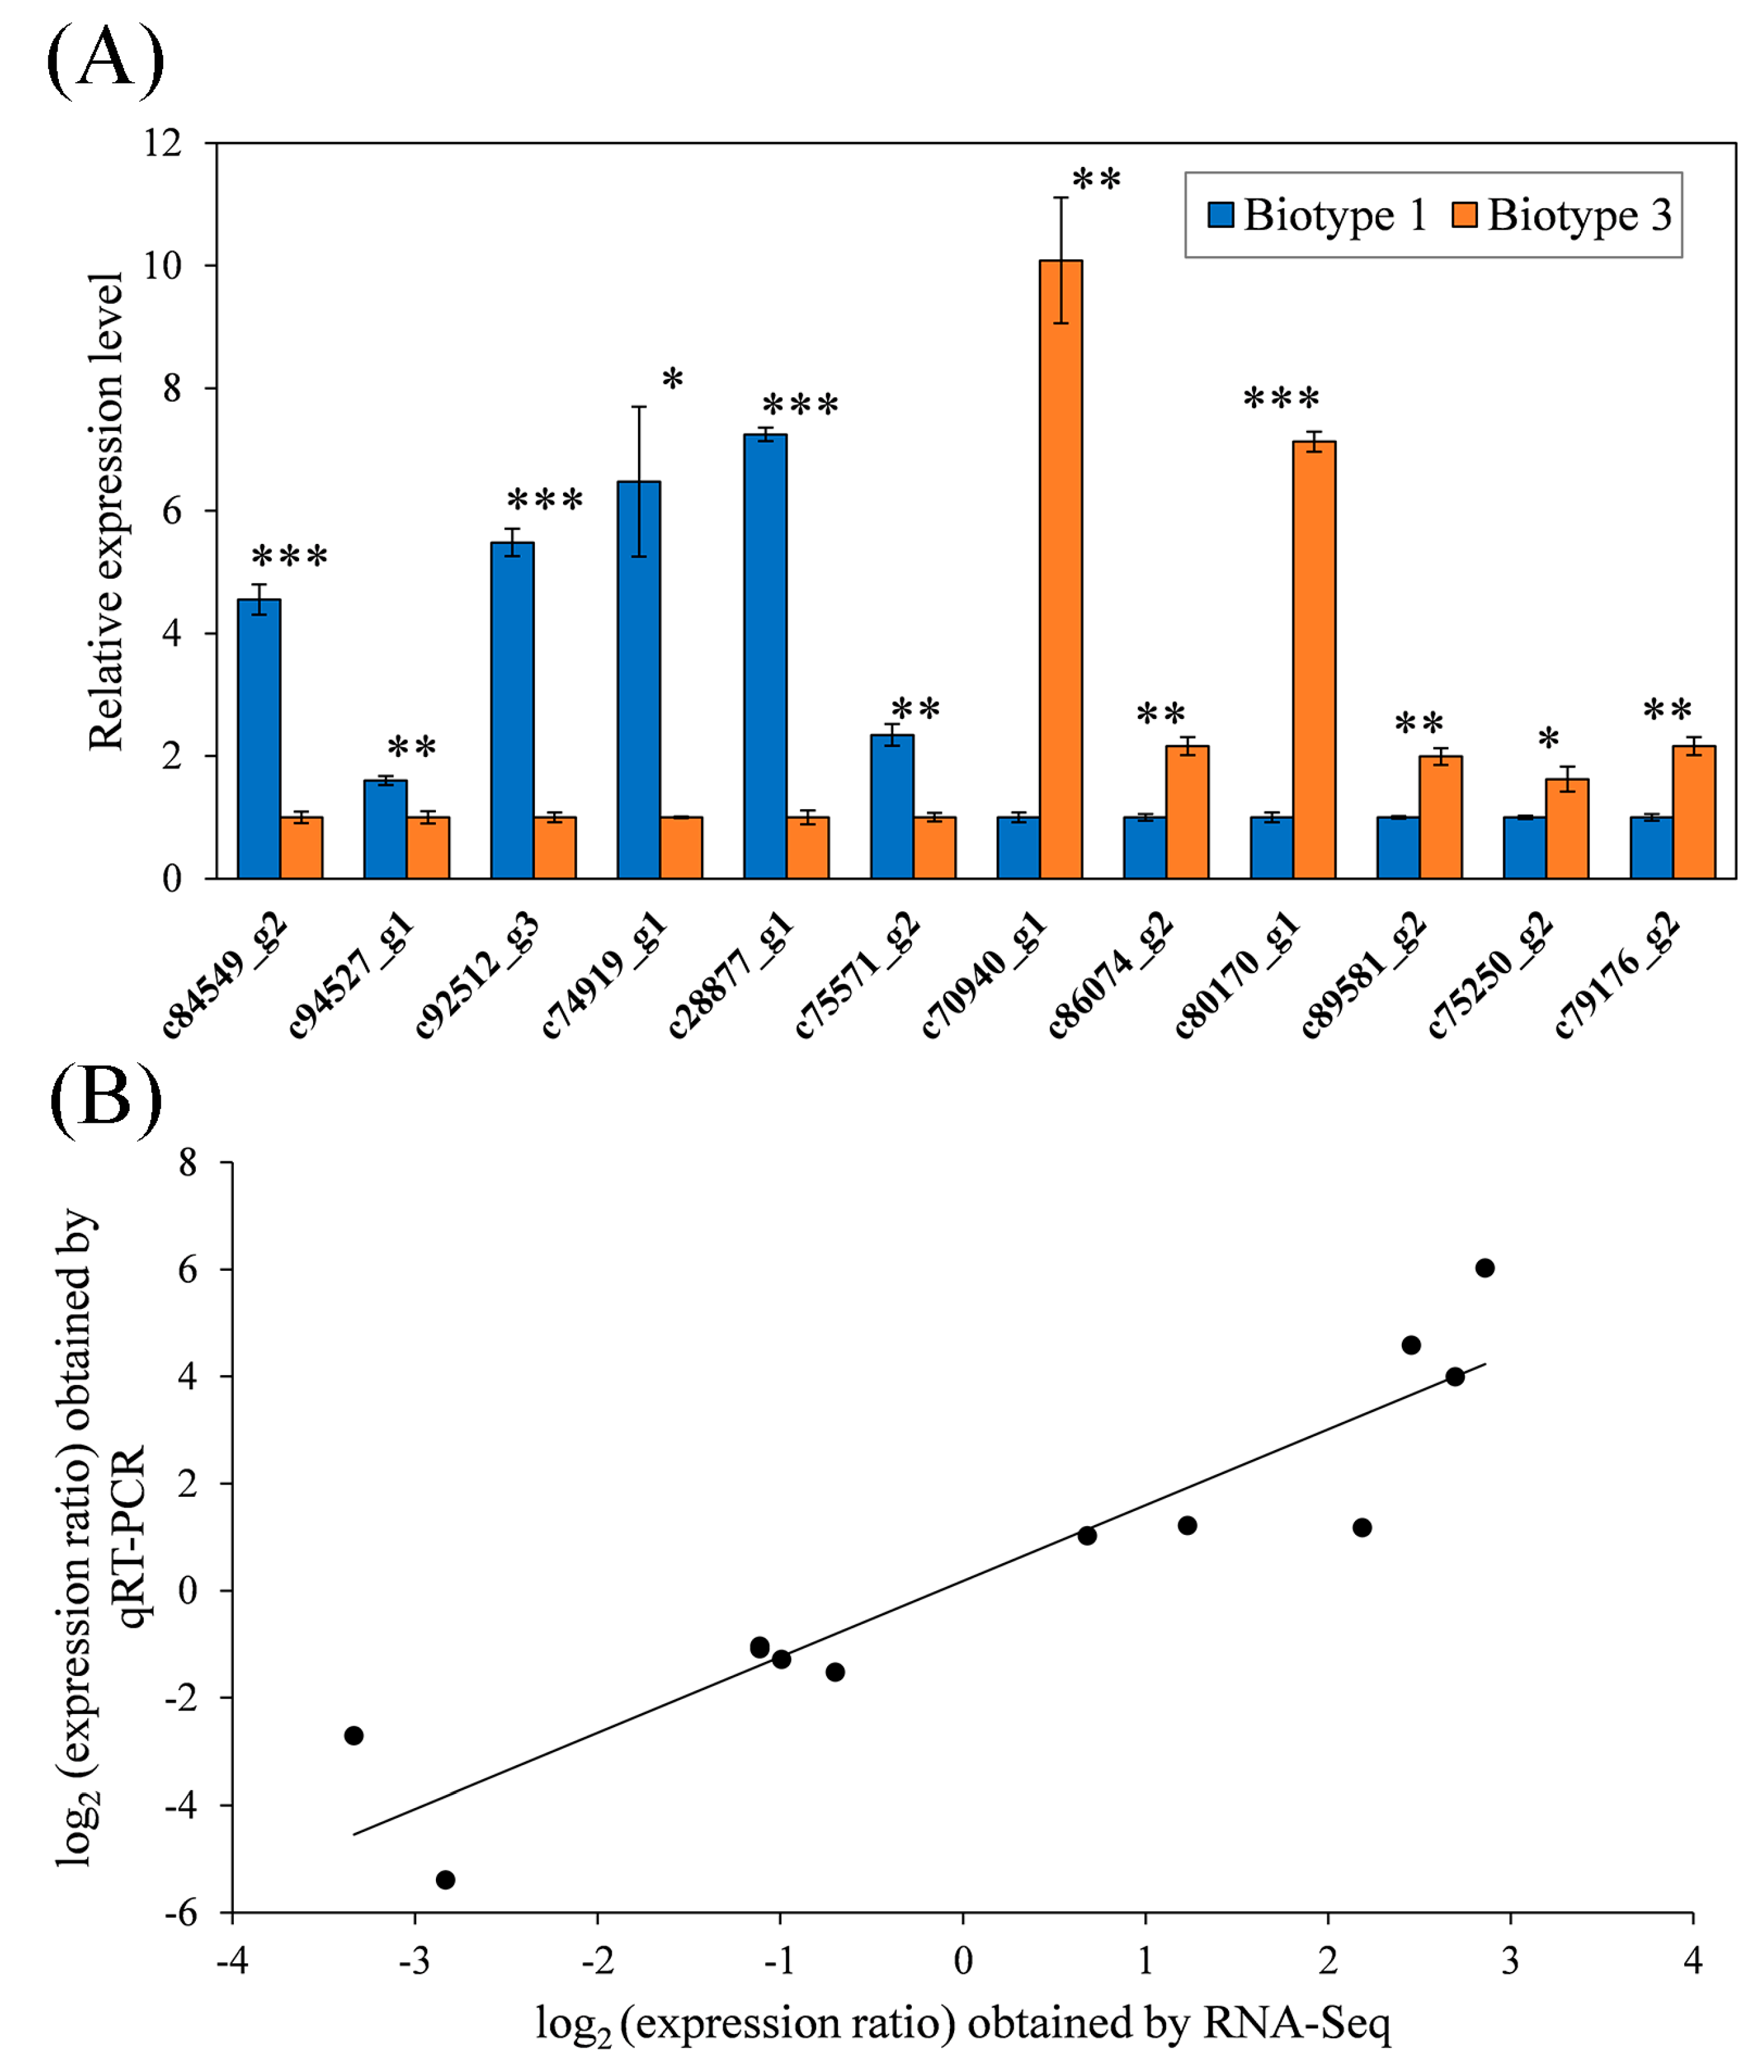
3.4. Validation of RNA-Seq Data by qRT-PCR

To validate the RNA-seq analysis, the relative expression levels of 12 selected genes were analyzed with RT-qPCR, including six specific DEGs on wheat (i.e., c84549_g2, cytochrome P450 4C1; c94527_g1, UDP-glucuronosyltransferase 2B7; c92512_g3, esterase E4; c74919_g1, zinc transporter ZIP1-like; c28877_g1,→ heat shock protein 83; c75571_g2, cysteine protease ATG4B; c70940_g1) and six specific DEGs on barley (i.e., cytochrome P450 6a13; c86074_g2, cytochrome P450 307a1-like; c80170_g1, UDP-glucuronosyltransferase 2C1; c89581_g2, ABC transporter G family member 20; c75250_g2, trehalose transporter Tret1-like; c79176_g2,→serine protease 44-like). All the selected DEGs showed significant differences in expression between the two S. avenae biotypes (Figure 8A). Based on the 12 selected DEGs, the nucleotide differences showed a low genetic divergence between the two biotypes (p-distance = 0.006). In addition, a significant correlation (r = 0.932; p < 0.001) was found between datasets of RNA-Seq and qRT-PCR, showing consistency of both analyses (Figure 8B).

4. Discussion

4.1. Divergence of Aphid Biotypes

Host plant resistance has been used in many integrated management programs for insect pests. However, its use is often limited by the rapid development of various insect biotypes. Molecular researches involving insect biotypes may provide insights into the underlying molecular factors and mechanisms for evolution of biotypes [13,42]. In this study, we used the English grain aphid (Sitobion avenae) as a model to address these issues. This aphid was found to have evolved multiple biotypes [4,43]. Among them, biotypes 1 and 3 were showed to have developed a certain degree of specialization on wheat and barley, respectively [4]. The two S. avenae biotypes showed differential performance on wheat (Aikang 58) and barley (Xinyin No.2) in this study, confirming their adaptive divergence on wheat and barley reported in our previous study [4]. This is also consistent with the finding that some S. avenae clones showed different degrees of specialization on barley and wheat in previous studies [3,30]. We further tested the two S. avenae biotypes on both wheat and barley by using transcriptome profiling techniques. A large number of DEGs were identified between the two biotypes when feeding on wheat (i.e., 3392) or barley (i.e., 2246). Interestingly, the majority of them (i.e., 1528) were common DEGs (occurring on both wheat and barley). The enriched GO terms for these common DEGs demonstrated that there had been expression divergence between both biotypes in genes associated with digestion (e.g., peptidase, serine-type peptidase, and serine hydrolase) and defense (e.g., UDP-glycosyltransferase). Similarly, in KEGG enrichment analyses, some digestion-related (e.g., bile secretion) and detoxification-related pathways (e.g., drug and xenobiotics metabolism) were also significantly enriched. Based on these analyses, we identified 16 common DEGs related to digestion, and 40 to defense that could be involved in the biotype divergence process in S. avenae.
The digestion-related common DEGs encoded five lipases, three phospholipases, two carbohydrases, one maltase, one galactosidase, one mannosidase, and three serine proteases. It makes sense since many of them (e.g., maltase, galactosidase, mannosidase, lipase and phospholipase) are essential digestive enzymes for glycolysis or esterlysis, and critical to the development and reproduction of insects [44,45,46,47,48,49]. Differential expression of a significant number of digestion-related genes was also identified among different biotypes in the whitefly Bemisia tabaci and fruit fly Drosophila patchea [50,51]. Thus, the differential expression of these digestive enzymes may have significant implications in the adaptation of insect biotypes on different host plants with significant nutritional variation [52,53,54,55]. In addition to their nutritional implications, some proteases, such as the above-mentioned serine proteases, may also be involved in defensive adaptation against proteinase inhibitors of host plants for insects [56,57]. Indeed, proteinase inhibitors of wheat have been proved to have anti-metabolic effects on S. avenae midgut proteases [58].
In addition to serine proteases, 40 other defense-related common DEGs were also identified between the two S. avenae biotypes. Among these, the top defense-related common DEGs (biotype 3 vs. biotype 1) with the most significant changes included three peroxidases (PODs), two UDP-glycosyltransferases (UGTs), two cuticle proteins (CPs), one glutathione S-transferase (GST), one superoxide dismutase (SOD), and one esterase (EST) (Table 5). Previous studies have shown that defensive enzymes can be involved in the differentiation of pea aphid biotypes [13,55]. In addition, differences in the expression of genes related to detoxification were also detected between Subpsaltria yangi populations specialized on different host plants with variable compositions and concentrations of secondary plant compounds [59,60]. Therefore, all the above-mentioned defense-related common DEGs may play important roles in the divergence of S. avenae biotypes. Based on the 12 selected DEGs (Figure 8), nucleotide differences (p-distance = 0.006) showed little genetic divergence between the two biotypes. However, significant genetic differentiation between the two biotypes was detected based on microsatellite data in our previous study [33]. This makes sense since microsatellites are usually located in neutral regions, and the 12 selected DEGs can occur in conservative regions. In addition, in this study, the 12 selected DEGs showed large differences in expression between the two biotypes, indicating the importance of gene expression and regulatory components in the divergence of S. avenae biotypes. Further studies on specific functional roles of these defense-related DEGs and their regulatory components in S. avenae will increase our understanding of the phenomenon that biotype 1 had much higher proportions and much wider geographic distributions than biotypes 3 [4], as well as the process of biotype evolution in this aphid.

4.2. Molecular Factors Underlying Aphids’ Use of Resistant Host Plants

Understanding the molecular differences among these apparently specialized aphid populations can have significant implications for deployment of host plant resistance in management of various pest aphids. In this study, S. avenae biotype 1 showed higher fecundity on wheat than on barley, and the opposite was true for biotype 3, suggesting that biotypes 1 and 3 could overcome the resistance of wheat and barley, respectively. We compared the transcriptomes of both S. avenae biotypes on the two plants and found that 1864 and 718 DEGs between both biotypes occurred only on wheat and barley, respectively (referred to as specific DEGs). The enriched GO terms for specific DEGs demonstrated that there were significant expression differences in genes associated with defense on wheat (e.g., those for activities of peroxidases, detoxification, and responses to toxic substance) and on barley (e.g., activities of oxidoreductases and gamma-glutamyltransferases). Similarly, in KEGG enrichment analyses of specific DEGs on barley, detoxification-related pathways (e.g., drug metabolism-cytochrome P450, metabolism of xenobiotics by cytochrome P450, drug metabolism-other enzymes, and ABC transporters) were also significantly enriched.
Our further screening analyses for defensive genes revealed 36 specific DEGs on wheat. Among them, a relatively high number of DEGs were identified for PODs (9), P450s (8), UGTs (4), and CPs (4). On barley, only 13 defensive DEGs were found to be specific, and they included four P450s, four UGTs, two CPs, one ABC transporter, one POD, and etc. Thus, wheat and barley with different levels of resistance to either test biotype induced specific expression of many defensive genes in S. avenae. For example, wheat induced expression changes for nine specific PODs, whereas only one POD was specifically induced by barley. The specific expression of defense-related genes in the two S. avenae biotypes may reflect differential compositions and contents of secondary metabolites (e.g., hydroxamic acids, alkaloids, phenolic compounds, and proteinase inhibitors) between wheat and barley reported in past studies [61,62,63,64,65,66,67]. Indeed, POD activities in S. avenae were found to be positively correlated with concentrations of diet phenolic compounds (e.g., flavonoids and tanins) [16,23]. In this study, three DEGs of PODs did show the most significant upregulation [log2 (fold change) for c81908_g5: 11.13; for c81908_g4: 9.34; for c81908_g1: 9.32] in S. avenae biotype 1 on wheat compared to biotype 3. The activity of P450s in S. avenae was associated with the concentration of plant hydroxamic acids [21,68,69]. High number of specific DEGs on wheat for PODs and P450s, as well as their high expression changes, may indicate that phenolic compounds and hydroxamic acids play critical roles in resistance of wheat against S. avenae. For barley, high concentrations of indole alkaloids (e.g., gramine) have often been found to be associated with host plant resistance to aphids [70,71,72,73,74]. In this study, GO and KEGG enrichment analyses showed that P450s and ABC transporters could be critical in defense of S. avenae on barley. Thus, P450s and ABC transporters can be key specific DEGs in metabolism of alkaloids in S. avenae on barley.
In addition to conventional detoxification DEGs, some digestive DEGs may also be important in S. avenae’s use of resistant plants. For example, as one of the critical digestive enzymes responsible for cellulose degradation and glucose production, β-glucosidase was also found to be involved in aphids’ metabolism of the plant secondary metabolite DIMBOA, which occurred frequently in wheat, instead of barley [75,76,77,78,79]. This explains the finding that the expression changes of β-glucosidase were specifically induced in S. avenae feeding on wheat in our study. Some proteases, like serine proteases and cysteine proteases, have both digestive and defensive functions in insects [56,57]. In this study, some cysteine proteases showed specific expression in S. avene on wheat, whereas some serine proteases were found to be specifically induced by barley. This suggests that serine and cysteine protease inhibitors can play important roles in resistance to aphids on barley and wheat, respectively. Further studies are needed to determine and verify the functional roles of all the putative key specific DEGs (digestive and/or defensive) in S. avenae against corresponding secondary compounds in wheat and barley.

5. Conclusions

In summary, this RNA-seq analysis provided a solid foundation toward improving our understanding of the molecular factors and functions underlying S. avenae’s adaptation to different resistant host plants and its use of resistant hosts. Our study revealed a large number of digestive and defensive DEGs between S. avenae biotypes on both wheat and barley, suggesting that digestive and defensive enzymes could facilitate adaptations of S. avenae populations to changes in host plant chemistry. Different numbers of defensive DEGs were specifically induced by wheat and barley, reflecting differential compositions and contents of secondary metabolites (e.g., hydroxamic acids, alkaloids, phenolic compounds, and proteinase inhibitors) between both plants. A number of key defensive DEGs in S. avenae were found to be potentially involved in the metabolism of the above-mentioned plant secondary metabolites, and they can play a critical role in S. avenae’s use of resistant host plants. Detailed studies are needed to determine the specific differences in the secondary metabolism of test plants, and exact functional roles of the putative key defensive DEGs in aphids’ successful use of resistant plants. In addition, some salivary and odorant-binding proteins (c62817_g1 and c71932_g1) were also detected in common DEGs between the two S. avenae biotypes, suggesting the significance of these proteins in the differentiation of biotypes in aphids [13,24,42,55]. Further research with these putative key genes will help us to understand the molecular factors and mechanisms that explain virulence and biotype adaptation in insects. It is also a critical step in developing strategies that limit rapid development of insect biotypes and extending resistant crop cultivars’ durability and sustainability in integrated management programs.

Supplementary Materials

The following are available online at https://www.mdpi.com/2075-4450/11/2/90/s1, Table S1: Primer sequences for selected genes in qRT-PCR, Table S2: Summary statistics of gene annotation in seven databases.

Author Contributions

Designed research, D.L. and D.W.; performed research, D.W., X.S.; writing—review and editing, D.W., X.S., D.L., Z.S., and Y.Y. All authors have read and agreed to the published version of the manuscript.

Funding

This work was funded by the National Natural Science Foundation of China (31572002), and the State Key Laboratory of Integrated Management of Pest Insects and Rodents (Grant No. IPM1909).

Acknowledgments

We are indebted to Ying-Ting Zhai (Northwest A&F University) for her laboratory and field assistance. This work was funded by the National Natural Science Foundation of China (31572002).

Conflicts of Interest

The authors declare no conflict of interest.

References

  1. McCarville, M.T.; O’Neal, M.E. Measuring the benefit of biological control for single gene and pyramided host plant resistance for Aphis glycines (Hemiptera: Aphididae) management. J. Econ. Entomol. 2012, 105, 1835–1843. [Google Scholar] [CrossRef] [PubMed] [Green Version]
  2. Bansal, R.; Michel, A. Molecular Adaptations of Aphid Biotypes in Overcoming Host-Plant Resistance. In Short Views on Insect Genomics and Proteomics; Springer: Berlin/Heidelberg, Germany, 2015; pp. 75–93. [Google Scholar]
  3. Gao, S.; Liu, D. Differential performance of Sitobion avenae (Hemiptera: Aphididae) clones from wheat and barley with implications for its management through alternative cultural practices. J. Econ. Entomol. 2013, 106, 1294–1301. [Google Scholar] [CrossRef] [PubMed]
  4. Wang, D.; Zhai, Y.; Liu, D.; Zhang, N.; Li, C.; Shi, X. Identification and Genetic Differentiation of Sitobion avenae (Hemiptera: Aphididae) Biotypes in China. J. Econ. Entomol. 2019. [Google Scholar] [CrossRef] [PubMed]
  5. Michel, A.P.; Mittapalli, O.; Mian, M.R. Evolution of Soybean Aphid Biotypes: Understanding and Managing Virulence to Host-Plant Resistance. In Soybean-Molecular Aspects of Breeding; IntechOpen: London, UK, 2011. [Google Scholar]
  6. Sōgawa, K. The rice brown planthopper: Feeding physiology and host plant interactions. Annu. Rev. Entomol. 1982, 27, 49–73. [Google Scholar] [CrossRef]
  7. Ratcliffe, R.H.; Cambron, S.E.; Flanders, K.L.; Bosque-Perez, N.A.; Clement, S.L.; Ohm, H.W. Biotype composition of Hessian fly (Diptera: Cecidomyiidae) populations from the southeastern, midwestern, and northwestern United States and virulence to resistance genes in wheat. J. Econ. Entomol. 2000, 93, 1319–1328. [Google Scholar] [CrossRef]
  8. Kim, K.-S.; Hill, C.B.; Hartman, G.L.; Mian, M.; Diers, B.W. Discovery of soybean aphid biotypes. Crop Sci. 2008, 48, 923–928. [Google Scholar] [CrossRef]
  9. Peccoud, J.; Ollivier, A.; Plantegenest, M.; Simon, J.-C. A continuum of genetic divergence from sympatric host races to species in the pea aphid complex. Proc. Natl. Acad. Sci. USA 2009, 106, 7495–7500. [Google Scholar] [CrossRef] [Green Version]
  10. Peccoud, J.; Mahéo, F.; de La Huerta, M.; Laurence, C.; Simon, J.C. Genetic characterisation of new host-specialised biotypes and novel associations with bacterial symbionts in the pea aphid complex. Insect Conserv. Divers. 2015, 8, 484–492. [Google Scholar] [CrossRef]
  11. Smith, C.M.; Chuang, W.P. Plant resistance to aphid feeding: Behavioral, physiological, genetic and molecular cues regulate aphid host selection and feeding. Pest Manag. Sci. 2014, 70, 528–540. [Google Scholar] [CrossRef]
  12. Mullen, S.P.; Shaw, K.L. Insect speciation rules: Unifying concepts in speciation research. Annu. Rev. Entomol 2014, 59, 339–361. [Google Scholar] [CrossRef] [Green Version]
  13. Nouhaud, P.; Gautier, M.; Gouin, A.; Jaquiéry, J.; Peccoud, J.; Legeai, F.; Mieuzet, L.; Smadja, C.M.; Lemaitre, C.; Vitalis, R. Identifying genomic hotspots of differentiation and candidate genes involved in the adaptive divergence of pea aphid host races. Mol. Ecol. 2018, 27, 3287–3300. [Google Scholar] [CrossRef] [PubMed]
  14. Osbourn, A.E.; Qi, X.; Townsend, B.; Qin, B. Dissecting plant secondary metabolism-constitutive chemical defences in cereals. New Phytol. 2003, 159, 101–108. [Google Scholar] [CrossRef]
  15. Sicker, D.; Schulz, M. Benzoxazinones in Plants: Occurrence, Synthetic Access, and Biological Activity. In Studies in Natural Products Chemistry; Elsevier: Amsterdam, The Netherlands, 2002; Volume 27, pp. 185–232. [Google Scholar]
  16. Zhang, M.; Fang, T.; Pu, G.; Sun, X.; Zhou, X.; Cai, Q. Xenobiotic metabolism of plant secondary compounds in the English grain aphid, Sitobion avenae (F.)(Hemiptera: Aphididae). Pestic. Biochem. Physiol. 2013, 107, 44–49. [Google Scholar] [CrossRef] [PubMed]
  17. Sun, X.-Q.; Zhang, M.-X.; Yu, J.-Y.; Jin, Y.; Ling, B.; Du, J.-P.; Li, G.-H.; Qin, Q.-M.; Cai, Q.-N. Glutathione S-transferase of brown planthoppers (Nilaparvata lugens) is essential for their adaptation to gramine-containing host plants. PLoS ONE 2013, 8, e64026. [Google Scholar] [CrossRef] [Green Version]
  18. Birnbaum, S.S.; Rinker, D.C.; Gerardo, N.M.; Abbot, P. Transcriptional profile and differential fitness in a specialist milkweed insect across host plants varying in toxicity. Mol. Ecol. 2017, 26, 6742–6761. [Google Scholar] [CrossRef]
  19. Huang, X.; Liu, D.; Zhang, R.; Shi, X. Transcriptional Responses in Defense-Related Genes of Sitobion avenae (Hemiptera: Aphididae) Feeding on Wheat and Barley. J. Econ. Entomol. 2018, 112, 382–395. [Google Scholar] [CrossRef]
  20. Cai, Q.-N.; Han, Y.; Cao, Y.-Z.; Hu, Y.; Zhao, X.; Bi, J.-L. Detoxification of gramine by the cereal aphid Sitobion avenae. J. Chem. Ecol. 2009, 35, 320–325. [Google Scholar] [CrossRef] [Green Version]
  21. Loayza-Muro, R.; Figueroa, C.C.; Niemeyer, H.M. Effect of Two Wheat Cultivars Differing in Hydroxamic Acid Concentration on Detoxification Metabolism in the Aphid Sitobion avenae. J. Chem. Ecol. 2000, 26, 2725–2736. [Google Scholar] [CrossRef]
  22. Ni, X.; Quisenberry, S.S. Possible roles of esterase, glutathione S-transferase, and superoxide dismutase activities in understanding aphid-cereal interactions. Entomol. Exp. Appl. 2003, 108, 187–195. [Google Scholar] [CrossRef]
  23. Chrzanowski, G.; Leszczyński, B.; Czerniewicz, P.; Sytykiewicz, H.; Matok, H.; Krzyżanowski, R.; Sempruch, C. Effect of phenolic acids from black currant, sour cherry and walnut on grain aphid (Sitobion avenae F.) development. Crop. Prot. 2012, 35, 71–77. [Google Scholar] [CrossRef]
  24. Nouhaud, P.; Peccoud, J.; Mahéo, F.; Mieuzet, L.; Jaquiéry, J.; Simon, J.C. Genomic regions repeatedly involved in divergence among plant-specialized pea aphid biotypes. J. Evol. Biol 2014, 27, 2013–2020. [Google Scholar] [CrossRef]
  25. Blackman, R.L.; Eastop, V.F. Aphids on the World’s Crops: An Identification and Information Guide; John Wiley & Sons Ltd.: Hoboken, NJ, USA, 2000. [Google Scholar]
  26. Fekih, I.B.; Jensen, A.B.; Boukhris-Bouhachem, S.; Pozsgai, G.; Rezgui, S.; Rensing, C.; Eilenberg, J. Virulence of Two Entomophthoralean Fungi, Pandora neoaphidis and Entomophthora planchoniana, to Their Conspecific (Sitobion avenae) and Heterospecific (Rhopalosiphum padi) Aphid Hosts. Insects 2019, 10, 54. [Google Scholar] [CrossRef] [Green Version]
  27. Yang, Y.; Kloos, S.; Mora-Ramírez, I.; Romeis, J.; Brunner, S.; Li, Y.; Meissle, M. Transgenic Winter Wheat Expressing the Sucrose Transporter HvSUT1 from Barley does not Affect Aphid Performance. Insects 2019, 10, 388. [Google Scholar] [CrossRef] [Green Version]
  28. Corcuera, L.; Argandona, V.; Pena, G.; Perez, F.; Niemeyer, H. Effect of a Benzoxazinone from Wheat on Aphids. In Proceedings of the 5th International Symposium on Insect-Plant Relationships, Wageningen, The Netherlands, 1–4 March 1982; pp. 33–39. [Google Scholar]
  29. Niemeyer, H.M. Hydroxamic acids derived from 2-hydroxy-2 H-1, 4-benzoxazin-3 (4 H)-one: Key defense chemicals of cereals. J. Agric. Food Chem. 2009, 57, 1677–1696. [Google Scholar] [CrossRef]
  30. Gao, S.X.; Liu, D.G.; Chen, H.; Meng, X.X. Fitness traits and underlying genetic variation related to host plant specialization in the aphid Sitobion avenae. Insect Sci. 2014, 21, 352–362. [Google Scholar] [CrossRef]
  31. Huang, X.; Liu, D.; Wang, D.; Shi, X.; Simon, J.-C. Molecular and quantitative genetic differentiation in Sitobion avenae populations from both sides of the Qinling Mountains. PLoS ONE 2015, 10, e0122343. [Google Scholar] [CrossRef] [PubMed] [Green Version]
  32. Wang, D.; Shi, X.; Dai, P.; Liu, D.; Dai, X.; Shang, Z.; Ge, Z.; Meng, X. Comparison of fitness traits and their plasticity on multiple plants for Sitobion avenae infected and cured of a secondary endosymbiont. Sci. Rep. 2016, 6, 23177. [Google Scholar] [CrossRef] [Green Version]
  33. Wang, D.; Liu, D.; Zhai, Y.; Zhang, R.; Shi, X. Clonal Diversity and Genetic Differentiation of Sitobion avenae (Hemiptera: Aphididae) From Wheat and Barley in China. J. Econ. Entomol. 2019, 112, 1217–1226. [Google Scholar] [CrossRef] [PubMed]
  34. Institute, S. Base SAS 9.4 Procedures Guide: Statistical Procedures; SAS Institute Inc.: Cary, NC, USA, 2017. [Google Scholar]
  35. Grabherr, M.G.; Haas, B.J.; Yassour, M.; Levin, J.Z.; Thompson, D.A.; Amit, I.; Adiconis, X.; Fan, L.; Raychowdhury, R.; Zeng, Q. Trinity: Reconstructing a full-length transcriptome without a genome from RNA-Seq data. Nat. Biotechnol. 2011, 29, 644. [Google Scholar] [CrossRef] [Green Version]
  36. Li, W.; Godzik, A. Cd-hit: A fast program for clustering and comparing large sets of protein or nucleotide sequences. Bioinformatics 2006, 22, 1658–1659. [Google Scholar] [CrossRef] [Green Version]
  37. Conesa, A.; Götz, S.; García-Gómez, J.M.; Terol, J.; Talón, M.; Robles, M. Blast2GO: A universal tool for annotation, visualization and analysis in functional genomics research. Bioinformatics 2005, 21, 3674–3676. [Google Scholar] [CrossRef] [PubMed] [Green Version]
  38. Li, B.; Dewey, C.N. RSEM: Accurate transcript quantification from RNA-Seq data with or without a reference genome. BMC Bioinform. 2011, 12, 323. [Google Scholar] [CrossRef] [PubMed] [Green Version]
  39. Love, J.H.; Roper, S.; Vahter, P. Dynamic complementarities in innovation strategies. Res. Policy 2014, 43, 1774–1784. [Google Scholar] [CrossRef] [Green Version]
  40. Xie, C.; Mao, X.; Huang, J.; Ding, Y.; Wu, J.; Dong, S.; Kong, L.; Gao, G.; Li, C.-Y.; Wei, L. KOBAS 2.0: A web server for annotation and identification of enriched pathways and diseases. Nucleic Acids Res. 2011, 39 (suppl. 2), W316–W322. [Google Scholar] [CrossRef] [PubMed] [Green Version]
  41. Livak, K.J.; Schmittgen, T.D. Analysis of relative gene expression data using real-time quantitative PCR and the 2-ΔΔCT method. Methods 2001, 25, 402–408. [Google Scholar] [CrossRef] [PubMed]
  42. Eyres, I.; Jaquiéry, J.; Sugio, A.; Duvaux, L.; Gharbi, K.; Zhou, J.J.; Legeai, F.; Nelson, M.; Simon, J.C.; Smadja, C.M. Differential gene expression according to race and host plant in the pea aphid. Mol. Ecol. 2016, 25, 4197–4215. [Google Scholar] [CrossRef]
  43. Xu, Z.-H.; Chen, J.-L.; Cheng, D.-F.; Sun, J.-R.; Liu, Y.; Francis, F. Discovery of English grain aphid (Hemiptera: Aphididae) biotypes in China. J. Econ. Entomol. 2011, 104, 1080–1086. [Google Scholar] [CrossRef] [Green Version]
  44. Uvarov, B.P. Insect nutrition and metabolism: A summary of the literature. Trans. R. Entomol. Soc. Lond. 1929, 76, 255–343. [Google Scholar] [CrossRef]
  45. Terra, W.; Ferreira, C.; De Bianchi, A. Distribution of digestive enzymes among the endo-and ectoperitrophic spaces and midgut cells of Rhynchosciara and its physiological significance. J. Insect Physiol. 1979, 25, 487–494. [Google Scholar] [CrossRef]
  46. Silva, C.P.; Terra, W.R. α-galactosidase activity in ingested seeds and in the midgut of Dysdercus peruvianus (Hemiptera: Pyrrhocoridae). Arch. Insect Biochem. Physiol. 1997, 34, 443–460. [Google Scholar] [CrossRef]
  47. Mehrabadi, M.; Bandani, A.R.; Dastranj, M. Salivary digestive enzymes of the wheat bug, Eurygaster integriceps (Insecta: Hemiptera: Scutelleridae). Compt. R. Biol. 2014, 337, 373–382. [Google Scholar] [CrossRef] [PubMed]
  48. Terra, W.R.; Ferreira, C. Biochemistry and molecular biology of digestion. In Insect Molecular Biology and Biochemistry; Elsevier: Amsterdam, The Netherlands, 2012; pp. 365–418. [Google Scholar]
  49. Weidlich, S.; Hoffmann, K.H.; Woodring, J. Secretion of lipases in the digestive tract of the cricket Gryllus bimaculatus. Arch. Insect Biochem. 2015, 90, 209–217. [Google Scholar] [CrossRef] [PubMed]
  50. Ye, X.-D.; Su, Y.-L.; Zhao, Q.-Y.; Xia, W.-Q.; Liu, S.-S.; Wang, X.-W. Transcriptomic analyses reveal the adaptive features and biological differences of guts from two invasive whitefly species. BMC Genom. 2014, 15, 370. [Google Scholar] [CrossRef] [PubMed] [Green Version]
  51. Lang, M.; Murat, S.; Clark, A.G.; Gouppil, G.; Blais, C.; Matzkin, L.M.; Guittard, É.; Yoshiyama-Yanagawa, T.; Kataoka, H.; Niwa, R. Mutations in the neverland gene turned Drosophila pachea into an obligate specialist species. Science 2012, 337, 1658–1661. [Google Scholar] [CrossRef] [PubMed] [Green Version]
  52. Cooper, W.R.; Dillwith, J.W.; Puterka, G.J. Salivary proteins of Russian wheat aphid (Hemiptera: Aphididae). Environ. Entomol. 2010, 39, 223–231. [Google Scholar] [CrossRef] [PubMed] [Green Version]
  53. Nicholson, S.J.; Hartson, S.D.; Puterka, G.J. Proteomic analysis of secreted saliva from Russian Wheat Aphid (Diuraphis noxia Kurd.) biotypes that differ in virulence to wheat. J. Proteom. 2012, 75, 2252–2268. [Google Scholar] [CrossRef] [PubMed]
  54. Nicholson, S.J.; Puterka, G.J. Variation in the salivary proteomes of differentially virulent greenbug (Schizaphis graminum Rondani) biotypes. J. Proteom. 2014, 105, 186–203. [Google Scholar] [CrossRef]
  55. Simon, J.-C.; d’Alencon, E.; Guy, E.; Jacquin-Joly, E.; Jaquiery, J.; Nouhaud, P.; Peccoud, J.; Sugio, A.; Streiff, R. Genomics of adaptation to host-plants in herbivorous insects. Brief. Funct. Genom. 2015, 14, 413–423. [Google Scholar] [CrossRef]
  56. Broadway, R.M. Dietary regulation of serine proteinases that are resistant to serine proteinase inhibitors. J. Insect Physiol. 1997, 43, 855–874. [Google Scholar] [CrossRef]
  57. Losvik, A.; Beste, L.; Mehrabi, S.; Jonsson, L. The protease inhibitor CI2c gene induced by bird cherry-oat aphid in barley inhibits green peach aphid fecundity in transgenic Arabidopsis. Int. J. Mol. Sci. 2017, 18, 1317. [Google Scholar] [CrossRef] [Green Version]
  58. Pyati, P.; Bandani, A.R.; Fitches, E.; Gatehouse, J.A. Protein digestion in cereal aphids (Sitobion avenae) as a target for plant defence by endogenous proteinase inhibitors. J. Insect Physiol. 2011, 57, 881–891. [Google Scholar] [CrossRef] [PubMed]
  59. Hou, Z.; Wei, C. De novo comparative transcriptome analysis of a rare cicada, with identification of candidate genes related to adaptation to a novel host plant and drier habitats. BMC Genom. 2019, 20, 182. [Google Scholar] [CrossRef] [PubMed]
  60. Liu, Y.; Qi, M.; Dietrich, C.H.; He, Z.; Wei, C. Comparative sialotranscriptome analysis of the rare Chinese cicada Subpsaltria yangi, with identification of candidate genes related to host-plant adaptation. Int. J. Biol. Macromol. 2019, 130, 323–332. [Google Scholar] [CrossRef] [PubMed]
  61. Zúñiga, G.E.; Argandoña, V.H.; Niemeyer, H.M.; Corcuera, L.J. Hydroxamic acid content in wild and cultivated Gramineae. Phytochemistry 1983, 22, 2665–2668. [Google Scholar] [CrossRef]
  62. Argandoña, V.H.; Zuñiga, G.E.; Corcuera, L.J. Distribution of gramine and hydroxamic acids in barley and wheat leaves. Phytochemistry 1987, 26, 1917–1918. [Google Scholar] [CrossRef]
  63. Bollina, V.; Kushalappa, A.C.; Choo, T.M.; Dion, Y.; Rioux, S. Identification of metabolites related to mechanisms of resistance in barley against Fusarium graminearum, based on mass spectrometry. Plant Mol. Biol. 2011, 77, 355. [Google Scholar] [CrossRef] [PubMed]
  64. Frank, T.; Scholz, B.; Peter, S.; Engel, K.-H. Metabolite profiling of barley: Influence of the malting process. Food Chem. 2011, 124, 948–957. [Google Scholar] [CrossRef]
  65. Patterson, J.H.; Newbigin, E.; Tester, M.; Bacic, A.; Roessner, U. Metabolic responses to salt stress of barley (Hordeum vulgare L.) cultivars, Sahara and Clipper, which differ in salinity tolerance. J. Exp. Bot. 2009, 60, 4089–4103. [Google Scholar]
  66. Yu, J.; Vasanthan, T.; Temelli, F. Analysis of phenolic acids in barley by high-performance liquid chromatography. J. Agric. Food Chem. 2001, 49, 4352–4358. [Google Scholar] [CrossRef]
  67. Irmak, S.; Jonnala, R.S.; MacRitchie, F. Effect of genetic variation on phenolic acid and policosanol contents of Pegaso wheat lines. J. Cereal Sci. 2008, 48, 20–26. [Google Scholar] [CrossRef]
  68. Leszczynski, B.; Dixon, A. Resistance of cereals to aphids: The interaction between hydroxamic acids and glutathione S-transferases in the grain aphid Sitobion avenae (F.)(Hom., Aphididae). J. Appl. Entomol. 1992, 113, 61–67. [Google Scholar] [CrossRef]
  69. Leszczynski, B.; Matok, H.; Dixon, A. Resistance of cereals to aphids: The interaction between hydroxamic acids and UDP-glucose transferases in the aphid Sitobion avenae (Homoptera: Aphididae). J. Chem. Ecol. 1992, 18, 1189–1200. [Google Scholar] [CrossRef] [PubMed]
  70. Kawada, K.; Lohar, M.K. Effect of gramine on the fecundity, longevity and probing behaviour of the greenbug, Schizaphis graminum (Rondani). Berichte Ohara Instituts Fuer Landwirtsch. Biol. Okayama Univ. 1989, 19, 199–204. [Google Scholar]
  71. Salas, M.; Corcuera, L. Effect of environment on gramine content in barley leaves and susceptibility to the aphid Schizaphis graminum. Phytochemistry 1991, 30, 3237–3240. [Google Scholar] [CrossRef]
  72. Rustamani, M.A.; Kanehisa, K.; Tsumuki, H.; Shiraga, T. Additional observations on aphid densities and gramine contents in barley lines. Appl. Entomol. Zool. 1992, 27, 151–153. [Google Scholar] [CrossRef] [Green Version]
  73. Corcuera, L.J. Biochemical basis for the resistance of barley to aphids. Phytochemistry 1993, 33, 741–747. [Google Scholar] [CrossRef]
  74. Tuvesson, S.; Johansson, M. Does indole alkaloid gramine confer resistance in barley to aphid Rhopalosiphum padi? J. Chem. Ecol. 2000, 26, 233–255. [Google Scholar]
  75. Hofman, J.; Hofmanova, O. 1, 4-Benzoxazine Derivatives in Plants: Sephadex Fractionation and Identification of a New Glucoside. Eur. J. Biochem. 1969, 8, 109–112. [Google Scholar] [CrossRef]
  76. Niemeyer, H.M. Hydroxamic acids (4-hydroxy-1, 4-benzoxazin-3-ones), defence chemicals in the Gramineae. Phytochemistry 1988, 27, 3349–3358. [Google Scholar] [CrossRef]
  77. Cuevas, L.; Niemeyer, H.M.; Jonsson, L.M. Partial purification and characterization of a hydroxamic acid glucoside β-D-glucosidase from maize. Phytochemistry 1992, 31, 2609–2612. [Google Scholar] [CrossRef]
  78. Givovich, A.; Sandström, J.; Niemeyer, H.; Pettersson, J. Presence of a hydroxamic acid glucoside in wheat phloem sap, and its consequences for performance of Rhopalosiphum padi (L.)(Homoptera: Aphididae). J. Chem. Ecol. 1994, 20, 1923–1930. [Google Scholar] [CrossRef] [PubMed]
  79. Du Fall, L.A.; Solomon, P.S. Role of cereal secondary metabolites involved in mediating the outcome of plant-pathogen interactions. Metabolites 2011, 1, 64–78. [Google Scholar] [CrossRef] [PubMed] [Green Version]
Figure 1. Comparisons of 10 d fecundities for two Sitobion avenae biotypes on barley and wheat (different letters on bars indicate significant differences among treatments at α = 0.05, ANOVA followed by Tukey tests).
Insects 11 00090 g001
Figure 2. The length distribution of Sitobion avenae unigenes in the de novo assembly (A), and species distribution of top BLAST hits for the unigenes in the NR database (B).
Insects 11 00090 g002
Figure 3. Gene expression changes between two Sitobion avenae biotypes (biotype 3 vs. biotype 1) on wheat (A) and barley (B) (changes between biotypes were considered significantly different if adjusted p values < 0.05 and fold change values >2).
Insects 11 00090 g003
Figure 4. Counts of differentially expressed genes (DEGs; with adjusted p values <0.05 and fold change values >2) between Sitobion avenae biotypes 1 and 3 (biotype 3 vs. biotype 1) on two plants (A) total counts of DEGs; (B) the number of up- and down-regulated unigenes).
Insects 11 00090 g004
Figure 5. Top 10 enriched KEGG pathway categories for common DEGs (A), specific DEGs on wheat (B), and specific DEGs on barley (C) (bubble color indicates Q-value, bubble size indicates the gene number in KEGG pathways).
Insects 11 00090 g005
Figure 6. A heatmap of specific DEGs related to digestion and defense in two Sitobion avenae biotypes on wheat (genes with expression higher and lower than the mean are indicated by blue and yellow, respectively).
Insects 11 00090 g006
Figure 7. A heatmap of specific DEGs related to digestion and defense in two Sitobion avenae biotypes on barley (genes with expression higher and lower than the mean are indicated by blue and yellow, respectively).
Insects 11 00090 g007
Figure 8. Validation of RNA-Seq results with qRT-PCR of 12 unigenes (A), and Pearson’s correlation between fold changes from both qRT-PCR and RNA-Seq (B) (c84549_g2, cytochrome P450 4C1; c94527_g1, UDP-glucuronosyltransferase 2B7; c92512_g3, esterase E4; c74919_g1, zinc transporter ZIP1-like; c28877_g1, heat shock protein 83; c75571_g2, cysteine protease ATG4B; c70940_g1, cytochrome P450 6a13; c86074_g2, cytochrome P450 307a1-like; c80170_g1, UDP-glucuronosyltransferase 2C1; c89581_g2, ABC transporter G family member 20; c75250_g2, trehalose transporter Tret1-like; c79176_g2, serine protease 44-like; the first and last six genes were randomly selected from specific DEGs on wheat and barley, respectively; * p < 0.05; ** p < 0.01; *** p < 0.001).
Insects 11 00090 g008
Table 1. Statistics of RNA-Seq for two Sitobion avenae biotypes on wheat and barley.
ParametersWheatBarley
Biotype 1Biotype 3Biotype 1Biotype 3
Raw reads25,989,771–28,117,34526,056,761–28,490,61526,108,796–29,031,74728,413,038–40,153,204
Clean reads25,482,373–27,506,07825,567,593–27,982,22025,669,614–28,512,01727,900,884–39,420,648
Clean base pairs (Gb)3.85–4.284.19–5.913.82–4.133.84–4.2
Error (%)0.010.010.010.01
Q20 (%)98.76–98.8098.66–98.7998.72–98.8098.70–98.78
Q30 (%)96.49–96.5896.18–96.5896.32–96.5996.40–96.56
GC (%)40.04–40.9940.19–40.3440.38–40.4639.70–39.96
Total number of unigenes143,058
Total length of unigenes (nt)95,512,520
Mean length of unigenes (nt)358
N50 of unigenes1012
Mapped reads (%)71.67–72.4672.80–72.8472.46–73.2372.22–73.14
Note: Q20 and Q30, percentage of bases with quality over a Phred score of 20 (i.e., an error rate of 1%) and 30 (i.e., an error rate of 0.1%), respectively; GC, proportion of G and C bases; N50, length N for which 50% of all bases in the assembly are located in a unigene of length < N.
Table 2. Gene enrichment analysis of GO terms for common DEGs.
GOTerm Type aGo DescriptionDETotalp-ValueFDR
GO:0006259PDNA metabolic process321042<0.0010.001
GO:0006508PProteolysis27987<0.0010.039
GO:0015074PDNA integration17313<0.0010
GO:0005488FBinding17899290.0010.036
GO:0003676FNucleic acid binding954051<0.0010.001
GO:0008233FPeptidase activity30945<0.0010.017
GO:0070011FPeptidase activity, acting on L-amino acid peptides28847<0.0010.017
GO:0004175FEndopeptidase activity174620.0010.036
GO:0008236FSerine-type peptidase activity13279<0.0010.023
GO:0017171FSerine hydrolase activity13279<0.0010.023
GO:0015020FGlucuronosyltransferase activity781<0.0010.021
GO:0008194FUDP-glycosyltransferase activity71070.0010.044
GO:0004523FRNA-DNA hybrid ribonuclease activity5500.0010.036
Note: All terms significantly enriched with FDR < 0.05; a F, molecular function; P, biological process.
Table 3. Gene enrichment analysis of GO terms for specific DEGs on wheat.
GOTerm Type aGo DescriptionDETotalp-ValueFDR
GO:0006950PResponse to stress15553<0.0010.043
GO:0006979PResponse to oxidative stress8140<0.0010.02
GO:0018205PPeptidyl-lysine modification7121<0.0010.039
GO:0098754PDetoxification7136<0.0010.042
GO:0098869PCellular oxidant detoxification7136<0.0010.042
GO:1990748PCellular detoxification7136<0.0010.042
GO:0009636PResponse to toxic substance7137<0.0010.042
GO:0016573PHistone acetylation562<0.0010.042
GO:0006475PInternal protein amino acid acetylation571<0.0010.043
GO:0018393PInternal peptidyl-lysine acetylation571<0.0010.043
GO:0018394PPeptidyl-lysine acetylation571<0.0010.043
GO:0034655PNucleobase-containing compound catabolic process5740.0010.048
GO:0006473PProtein acetylation5750.0010.048
GO:0043543PProtein acylation5760.0010.048
GO:0008285PNegative regulation of cell proliferation413<0.0010.005
GO:0042127PRegulation of cell proliferation417<0.0010.008
GO:0008283PCell proliferation419<0.0010.009
GO:0003676FNucleic acid binding684051<0.0010.048
GO:0008234FCysteine-type peptidase activity10197<0.0010.032
GO:0004601FPeroxidase activity7118<0.0010.045
GO:0016684FOxidoreductase activity7130<0.0010.048
GO:0004197FCysteine-type endopeptidase activity555<0.0010.045
Note: All terms significantly enriched with FDR < 0.05; a F, molecular function; P, biological process.
Table 4. Gene enrichment analysis of GO terms for specific DEGs on barley.
GOTerm Type aGo DescriptionDETotalp-ValueFDR
GO:0034204PLipid translocation28<0.0010.039
GO:0045332PPhospholipid translocation28<0.0010.039
GO:0097035PRegulation of membrane lipid distribution28<0.0010.039
GO:0015748POrganophosphate ester transport212<0.0010.055
GO:0015914PPhospholipid transport212<0.0010.055
GO:0016705FOxidoreductase activity41710.007 0.078
GO:0005548FPhospholipid transporter activity280.002 0.030
GO:0003840FGamma-glutamyltransferase activity2140.003 0.065
GO:0005319FLipid transporter activity2200.003 0.078
GO:0016755FTransferase activity2210.003 0.078
GO:0004824FLysine-trna ligase activity2220.004 0.078
GO:0004012FPhospholipid-translocating atpase activity280.0010.03
Note: All terms significantly enriched with FDR < 0.10; a F, molecular function; P, biological process.
Table 5. Log2 (fold change) of common DEGs related to digestion and defense.
Gene IDAnnotationWheat aBarley bGene IDAnnotationWheat aBarley b
Log2 (Fold Change)Log2 (Fold Change)Log2 (Fold Change)Log2 (Fold Change)
c68224_g2Beta-galactosidase isoform X21.671.72c93888_g2Pancreatic lipase-related protein 1-like1.11.1
c4428_g1Alpha-mannosidase-like 24.065.49c70849_g1Pancreatic lipase-related protein 2-like−2.46−1.97
c86944_g1Serine protease K12H4.72.12.14c88297_g5Phospholipase YOR022C−8.35−8.97
c84329_g2Serine protease 44-like2.162.09c88297_g1Phospholipase YOR022C−8.35−8.99
c93201_g1Serine proteinase stubble-like isoform X11.021.24c92524_g1Phospholipase A1 1-like1.651.9
c90736_g1Hormone-sensitive lipase3.516.39c47889_g1Maltase A2-like4.847.38
c78349_g1Lipase 3-like3.342.58c75939_g1Carboxypeptidase CG4572_56.15.267.38
c91806_g1Pancreatic lipase-related protein 2-like1.62.02c91663_g1Venom serine carboxypeptidase-like3.364.54
c81636_g2Cytochrome P450 6a131.872.77c75860_g1Alkaline phosphatase 41.671.69
c84461_g2Cytochrome P450 4V2-like2.642.45c80317_g2Esterase E4-like−1.69−1.54
c94592_g2Cytochrome P450 4C1-like1.152.17c89160_g1Esterase FE4-like isoform X2−2.37−1.83
c85949_g2Cytochrome P450 6a13 isoform X21.851.42c73140_g3Esterase E4-like3.214.02
c82801_g1Cytochrome P450 4C1-like−1.85−1.24c92686_g1Esterase FE4-like2.223.04
c92410_g3Cytochrome P450 6k1−1.65−1.42c88468_g2Laccase-5−2.24−1.49
c81321_g1Cytochrome P450 6k1-like isoform X1−1.54−1.47c86869_g2Peroxidase-like−2.35−1.47
c92410_g2Cytochrome P450 6k1-like isoform X2−2.52−2.21c86704_g2Peroxidase-like−1.63−1.69
c94328_g3Venom carboxylesterase-6-like−1.44−1.04c91728_g2Peroxidase-like−1.34−1.73
c87374_g1Glutathione S-transferase-like−1.21−1.06c86869_g1Peroxidase-like isoform X2−3.63−3.57
c83325_g1Glutathione S-transferase omega-1-like−1.81−2.29c58802_g1Peroxidase−5.56−5.86
c89912_g1Glutathione S-transferase-like2.843.01c81908_g2Peroxidase-like−12.42−8.48
c89445_g1UDP-glucuronosyltransferase 2B22.012.15c87544_g2Superoxide dismutase−4.71−5.12
c91825_g1UDP-glucuronosyltransferase 2B7-like1.151.83c92840_g2Serine protease inhibitor 5−1.16−1.36
c91399_g1UDP-glucuronosyltransferase 2B4-like−3.32−2.18c65501_g1Cuticle protein 7-like−6.68−6.57
c89981_g2UDP-glucuronosyltransferase 2B20-like−2.65−2.32c81826_g1Cuticle protein 7-like5.944.8
c89981_g3UDP-glucuronosyltransferase 2B1-like−3.11−2.41c69395_g1Heat shock protein 68-like−4.76−2.38
c79169_g2UDP-glucuronosyltransferase 2B17-like−1.97−2.71c91730_g6Trehalose transporter Tret1-like−2.51−3.55
c72511_g1ABC transporter G family member 232.232.8c19378_g1Trehalose transporter Tret1−1.32−1.13
c93663_g1Alkaline phosphatase 41.622.1c87097_g1Trehalose transporter Tret1−1.81−1.44
a Fold change of gene expression between two biotypes (biotype 3 vs. biotype 1) on wheat; b Fold change of gene expression between two biotypes (biotype 3 vs. biotype 1) on barley.

