1. Introduction
Parasites are important players in shaping ecosystems [
1]. Pollinators, like any other species, harbor a range of parasites, which include both macro- and microparasites [
2,
3]. Several of the microparasites are reported to be pathogenic and are found worldwide in domesticated pollinator species like honey bees [
4,
5]. Most of these microparasites found in honey bees are also present in wild bees [
2,
3,
6,
7]. Information on intraspecies transmission is scarce, let alone information on interspecies transmission. For social pollinators, e.g., honey bees and bumblebees, these parasites can readily spread within colonies due to close contact between individuals within the colony [
8,
9]. However, direct interspecies contact between different Anthophilia pollinators is rare, with only a few documented events of nectar robbing, in which one species enters the nest of another species [
10]. Moreover, most of these multihost microparasites have an oral–fecal transmission route [
2], enabling indirect transmission via flowers. Shared flowers can act as transmission hubs containing infective particles (i.e., parasitic cells, spores, or oocysts capable of infecting a naïve host) deposited by infected hosts, either due to defecation while foraging or through direct contact with the flower, transferring infective particles from the bee’s body to the flower. Conceptually, the role of flowers in the intraspecies transmission of parasites has been recognized [
6,
7,
11,
12,
13,
14,
15]. However, only a few studies have been carried out in field conditions [
6,
7]. Understanding the role of the interaction between pollinators and flowers, i.e., the plant–pollinator network, in the spread of parasites is a key aspect when studying parasite epidemiology in the pollinator community as it provides information on the host–parasite transmission network [
7]. In contrast to a previous study by Figueroa et al. (2020), using plant–pollinator networks to study parasite transmission, we mainly focused on the site of transmission, i.e., the flowers, to study the transmission mechanism instead of the host species. This is to further elucidate the role of the plant–pollinator network and transmission mechanisms leading to the contamination of flowers with parasites.
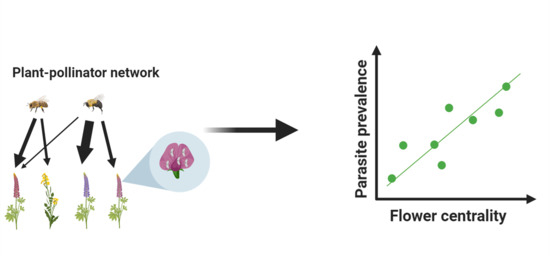
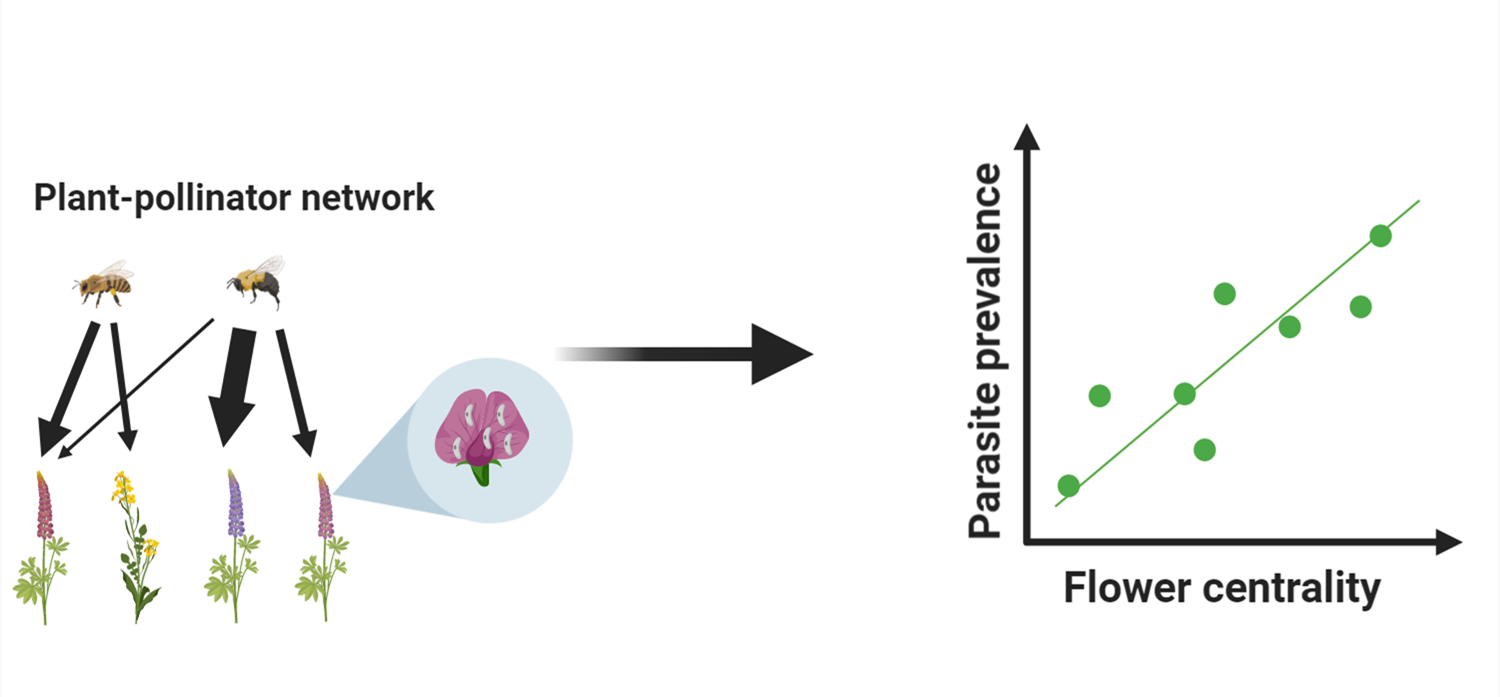
Flower visitation rates of potential hosts will most likely be an important parameter to describe the transmission via flowers. Here, one might expect that flowers that have a high visitation rate by different pollinators and the shortest total distance to all other nodes in the network are more likely to contain parasites. These flowers can be regarded as the most central flowers in a network weighted with visitation rates. Following this rationale, we pose the hypothesis that central flowers in a plant–pollinator network have a higher likelihood of carrying parasites. If the hypothesis is valid, it also further underlines the usefulness of plant–pollinator network characteristics in parasite transmission in a natural environment. We tested this hypothesis in three local plant–pollinator networks, mostly dominated by
Bombus spp., and looked at two groups of microparasites typically associated with bee pollinators, i.e., Trypanosomatidae and Neogregarinorida. Both have an oral–fecal transmission route and have a broad host range within the bee pollinator community [
3,
16]. To examine if external vectoring is a possible transmission route, we investigated the presence of microparasites on the exterior of the bees and looked if there was a link with parasite presence in the bees. Furthermore, external parasite loads were quantified to see if they could theoretically lead to an infection.
2. Materials and Methods
2.1. Study Area
The study was carried out at three separate study sites: two study sites were in a rural area and a third study site was located in an urban area (
Figure S1). All sampling and monitoring were performed at the beginning of June. Study Site 1 was sampled in 2016 in Zelzate, Belgium (N 51.2070, E 3.7913) in a road ditch next to a wheat field. The study site had a total size of 50 by 1.5 m. Study Site 2 was sampled in 2017 in Zelzate, Belgium (N 51.2052, E 3.8379) in a road ditch next to two wheat fields. The site had a size of 70 by 2.5 m. Study Site 3 was sampled in 2017 in Ghent, Belgium (N 51.0536, E 3.7060). Located in an urban area, the study site had a total size of 40 by 1.5 m. All flowers present in each plot were counted and determined to species level (
Table S1). A transect walk was performed by walking along the whole length of the study site twice; all flower-visiting pollinators were recorded through visual inspection to give an estimate on their presence and activity (
Table S2). This allowed us to set up a monitoring plan to measure visitation data per plant species generated from camera recording (see
Section 2.2 for network construction). Most flower-visiting pollinators were hymenopterans. However, in Study Site 1, there was also a high activity of dipteran species.
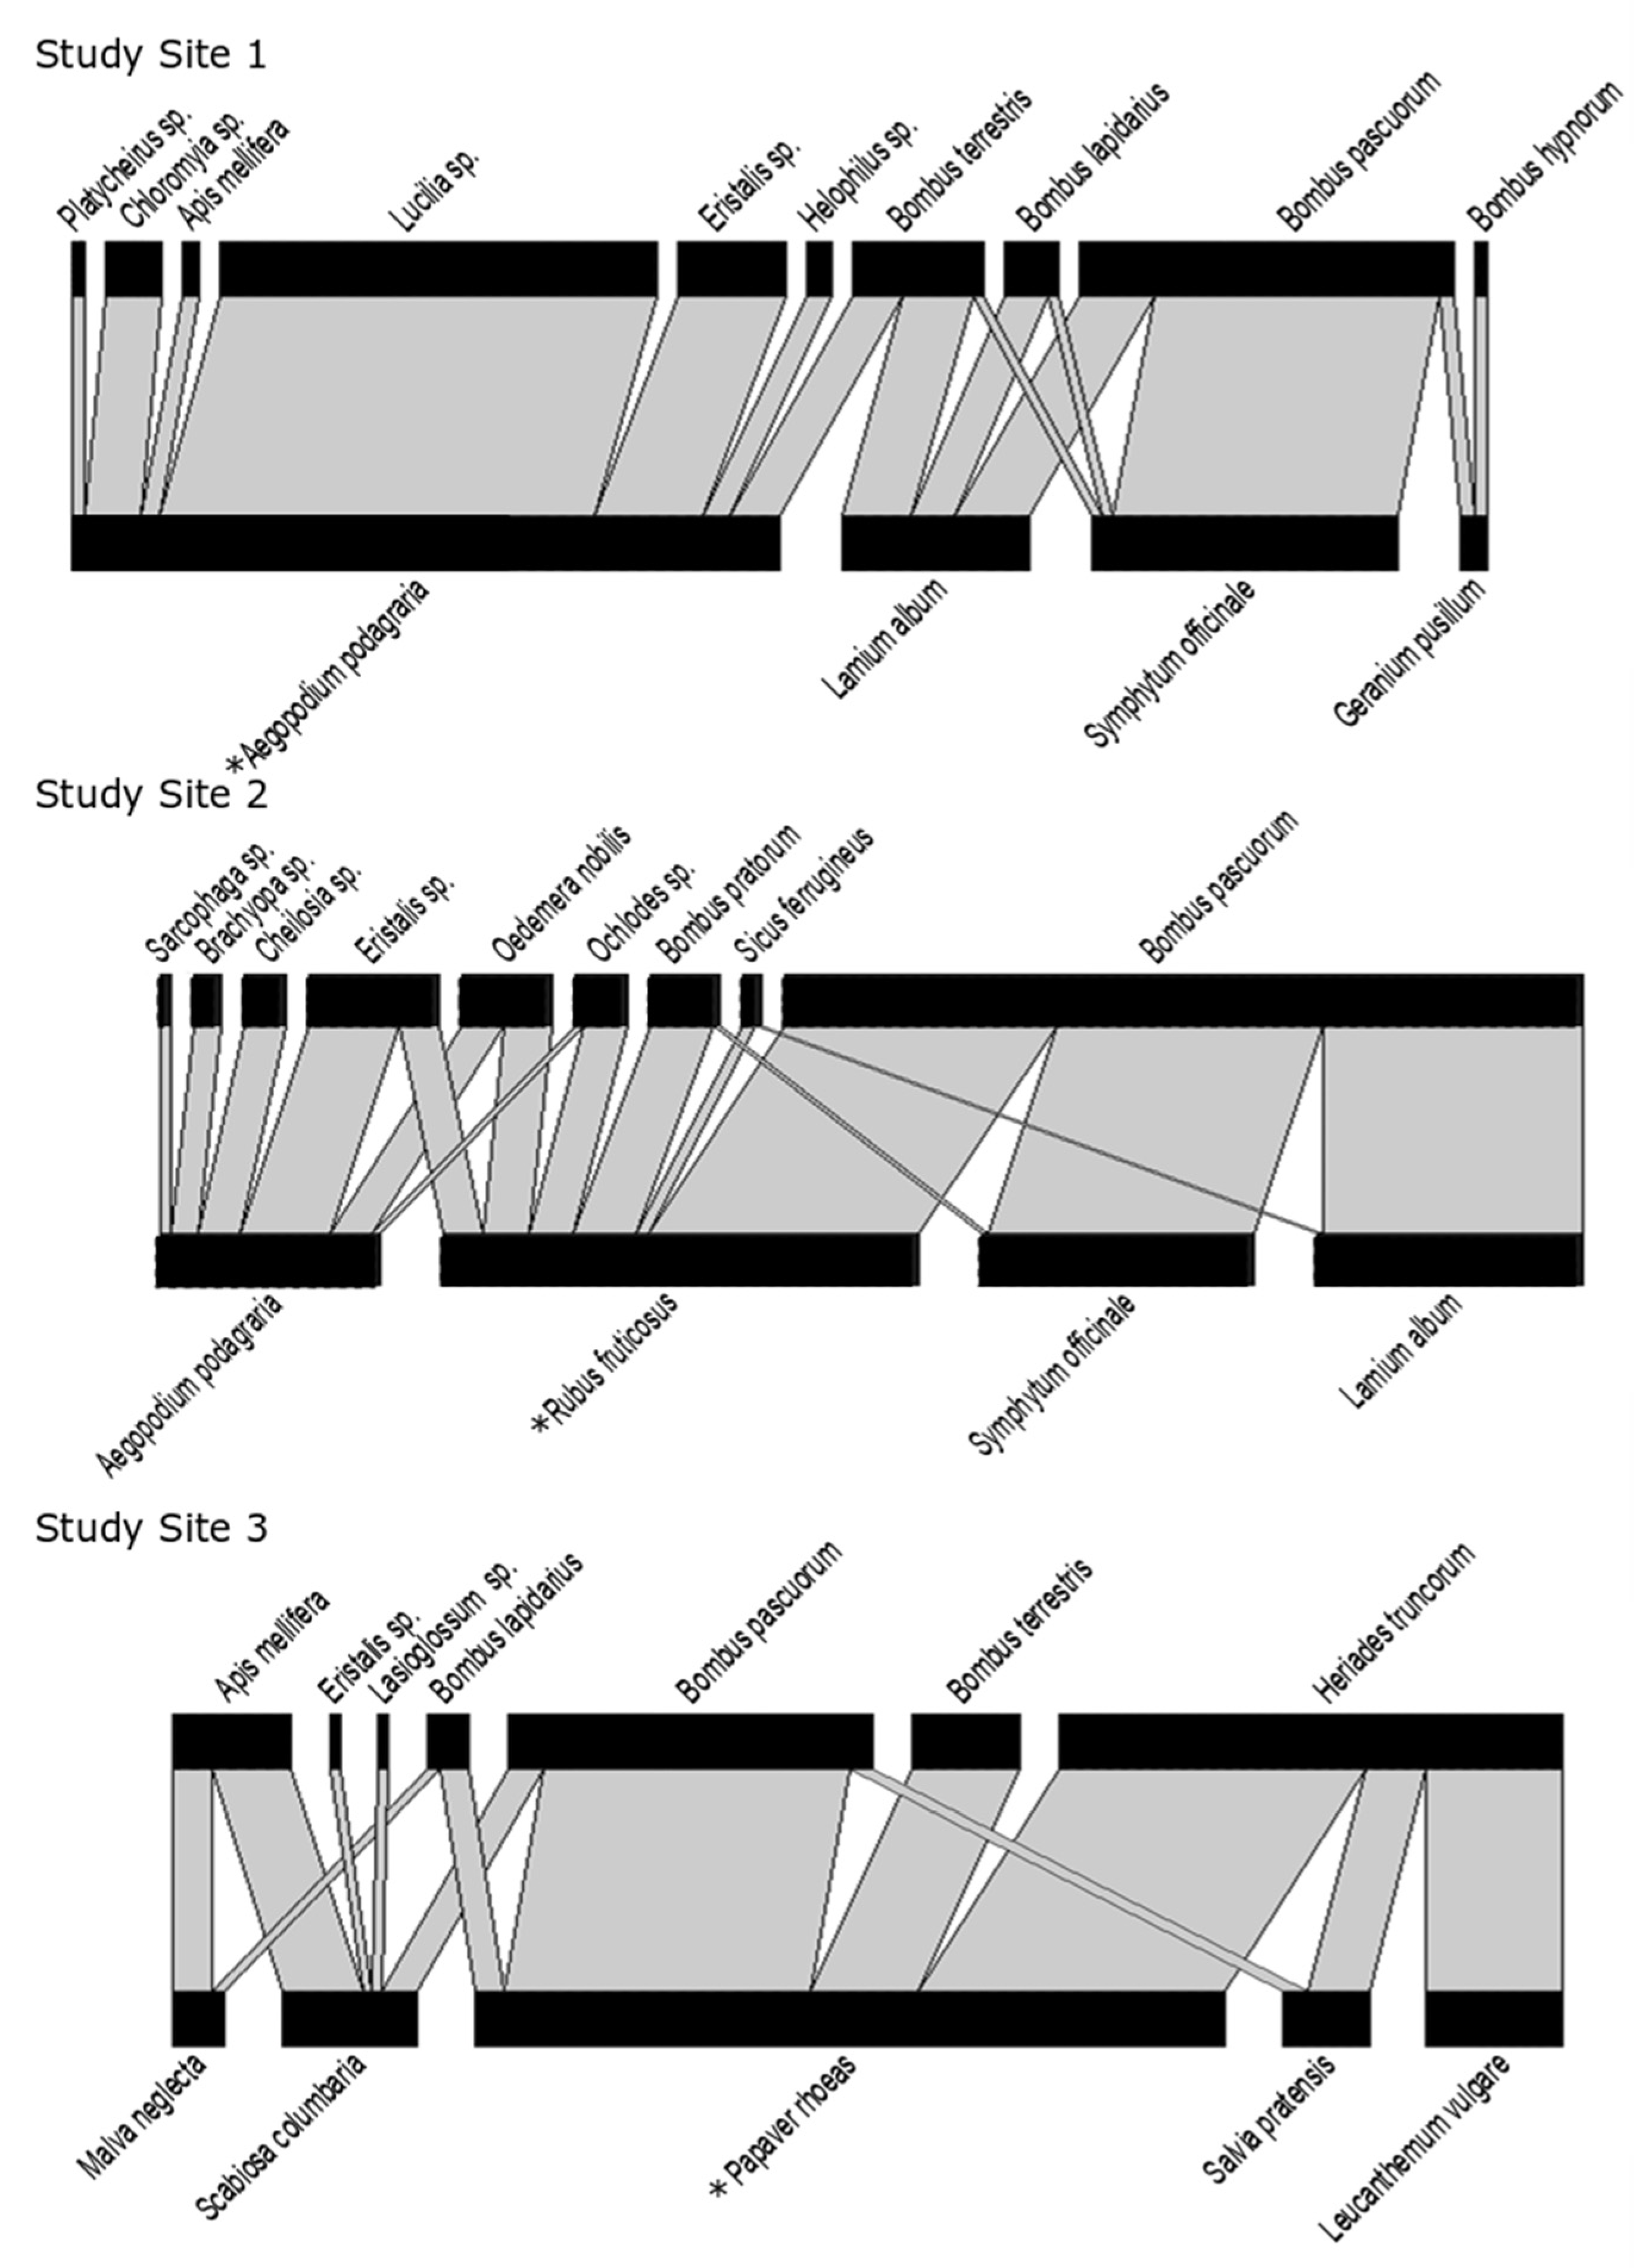
The network in Study Site 1 included four flower species (i.e.,
Symphytum officinale,
Lamium album,
Aegopodium podagraria, and
Geranium pusillum). In Study Site 2, the network also included four flower species (i.e.,
Symphytum officinale,
Lamium album, Aegopodium podagraria, and
Rubus fruticosus). In Study Site 3, the network consisted of five flower species (
Malva neglecta,
Scabiosa columbaria,
Papaver rhoeas,
Salvia pratensis, and
Leucanthemum vulgare). All plants were native to Belgium (see
Figure S2 for further information on plant species) [
17,
18].
2.2. Network Construction
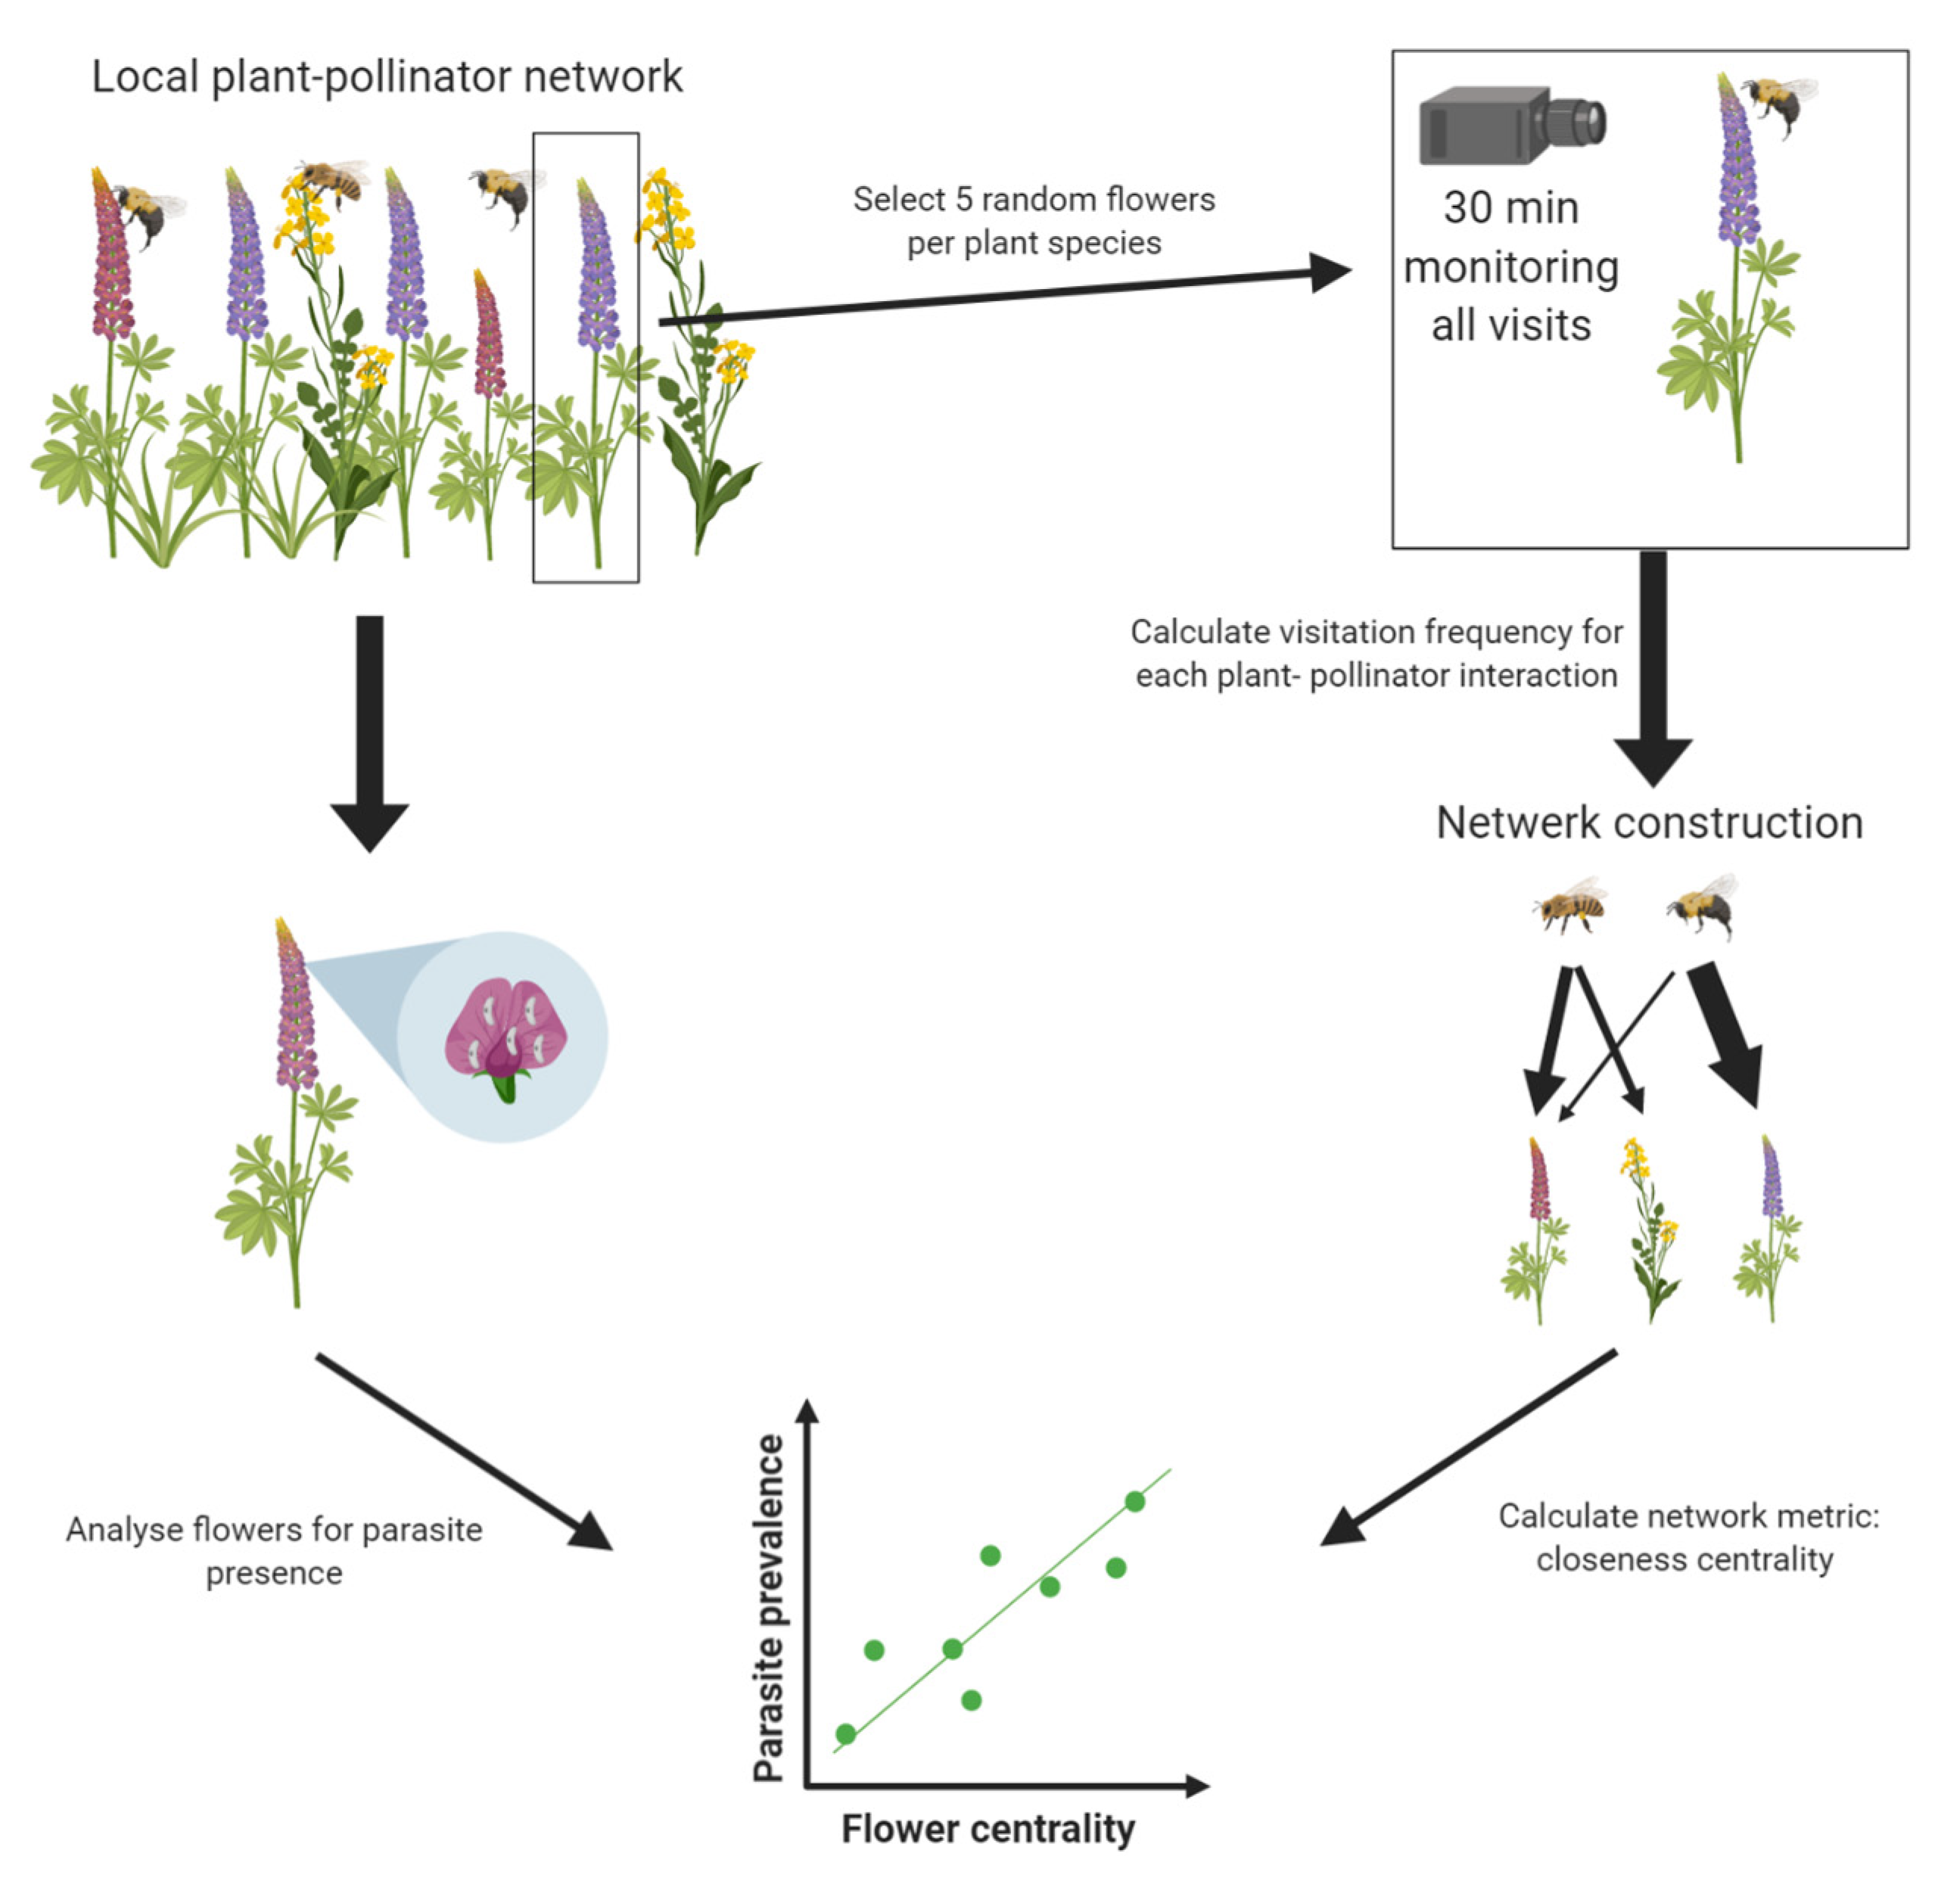
At each site, plant–pollinator networks were constructed using visitation data generated from camera recordings (see
Figure 1 for a schematic overview of network construction). At each site, five random flowers of different individual plants were selected for each plant species present at the site. Each selected flower was recorded for 30 min (±42 s). All recordings for one site were performed on the same day. Recordings were performed using two cameras (Nikon COOLPIX P510, Minato City, Tokyo, Japan and Panasonic DMC-TZ35, Kadoma, Osaka, Japan) on a tripod positioned in front or above each selected flower to provide a full and focused view of the recorded flowers. The video recording of each flower was analyzed afterward using Windows Media Player 12 (Windows 10, Microsoft, Redmond, WA, USA). For each flower, the number of visits was counted for each pollinator species. An average visitation frequency (visits/min) was calculated for each flower species–pollinator species interaction using the following equation:
Each network was weighted based on the average visitation frequency calculated for each plant–pollinator interaction, as described above. This resulted in three weighted bipartite plant–pollinator networks, one for each study site (see
Figure 2). For each network, the properties were calculated with the tnet package [
19] in R [
20]. As a measure of centrality in the plant–pollinator network, we used closeness, which is often used to approximate centrality in a network [
19,
21,
22]. The closeness centrality can be defined as the inverse of farness (farness is the sum of the distances to all other nodes in the network) [
19]. The closeness of each node was normalized by dividing it by the total number of nodes in the network minus one, resulting in normalized closeness (a value between 0 and 1). By using a parameter α of 0.5 in the tnet package, both the number of ties (i.e., edges) as well as the weights of the ties (determined by the average visitation frequency) were scored as positive in the calculation of normalized closeness [
19]. The normalized closeness of each plant species was used as a fixed factor for Model 2 (see below).
2.3. Sampling and Parasite Analysis
To determine parasite presence and load on the flowers in the network, the flowers of each species were cut off at the pedicel, just below the sepals, and put in separate tubes at the end of the experiment (i.e., after all the recordings needed to construct the network were finished). On average, 20 flowers per species were sampled, with a minimum of 10 flowers for
G. pusillum. For details on the sampling amount of each flower species at each site, see
Table S3. To get an estimate on parasite prevalence in the bee pollinators present at each site and to test if the parasites were present on the exterior of the bees, a minimum of 10 bees of the most abundant bee species was sampled at each location (see
Table S6 for detailed sampling amounts). Each bee was stored in a separate container for transport and sacrificed by freeze-killing in the lab. Bees and flowers were stored at −80 °C until further use.
Flowers were washed in 1 mL of RLT buffer (Qiagen, Venlo, The Netherlands) supplemented with 1% β-mercapto-ethanol. Washing was done by shaking in the Qiagen TissueLyser II for 2 min at 30 Hz, followed by 2 min at 20 Hz with 0.3 g of silica beads (0.1 mm; BioSpec Products, Bartlesville, OK, USA). After washing, the flower was removed, and the homogenate was centrifuged for 2 min at 2000× g; then, 200 µL of supernatant was used for DNA extraction.
If bees indeed transfer parasites via contact, one would expect the parasites to be present on the exterior of the bees. To test this, bees were washed with 1 mL of RLT buffer supplemented with 1% β-mercapto-ethanol by vortexing for 1 min. Prior to washing, the hind legs of the bees were removed for Bombus spp. to prevent contamination with corbicular pollen. For Heriades truncorum, pollen present on the abdomen was removed with a small paintbrush. We note here that the release of fecal droplets by the bee during vortexing cannot be excluded. Then, 200 µL of the wash solution was used for DNA extraction.
To detect the presence of parasites within the bees, the abdomen of the washed bees was cut off and homogenized in 800 µL of RLT buffer supplemented with 1% β-mercapto-ethanol for Bombus spp. or 400 µL of RLT buffer supplemented with 1% β-mercapto-ethanol for Heriades truncorum. Homogenization was performed with the Qiagen TissueLyser II for 2 min at 30 Hz, followed by 2 min at 20 Hz with one stainless steel bead of 5 mm and three stainless steel beads of 3 mm. The homogenate was centrifuged for 2 min at 2000× g, and 200 µL of supernatant was used for DNA extraction. DNA extraction was performed with the Invisorb Spin Tissue Mini Kit (Stratec Biomedical, Birkenfeld, Germany). Then, 200 µL homogenate, as described above, was added to 400 µL of lysis buffer G and 40 µL of proteinase S. Further extraction steps proceeded according to the manufacturer’s instructions (Protocol 1). DNA was stored at −20 °C until further use. Detection of Trypanosomatidae and Neogregarinorida was done with primers described by Meeus et al. (2009). All PCRs included positive, negative, and no-template controls. Several positive samples were sent for Sanger sequencing to confirm the identity of the detected parasites (LGC Genomics, Berlin, Germany). All parasites detected with the primers described by Meeus et al. (2009) were either Crithidia spp. (parasites belonging to the Trypanosomatidae family) or Apicystis bombi (a parasite belonging to the Neogregarinorida family).
2.4. Parasite Quantification
To enable the infection of a naïve host upon visitation of a parasite-contaminated flower, the number of infective particles present on the flower should surpass the minimal amount needed to induce an infection in a host. To quantify the parasite load of the detected parasites, the CFX 96 Touch Real-Time PCR Detection System (Bio-Rad, Hercules, CA, USA) was used. Each well contained 8 µL of the sample, 10 µL of GoTaq qPCR master mix (Promega, Madison, WI, USA), 1 µL (10 µM) of forward primer, and 1 µL (10 µM) of reverse primer [
23]. All samples were run in duplicate, and each plate included negative controls. Absolute quantification of the parasite load on the flowers and exterior of the bees was done based on the dilution curves of DNA extracts from a sample with a known number of infective particles. To generate a standard curve for quantification of Trypanosomatidae (E = 87.2%; R
2 = 0.991), we used an in vitro lab culture of
Crithidia mellificae. To generate a standard curve for quantification of Neogregarinorida, we used isolated oocysts of
A. bombi (E = 91.4%; R
2 = 0.992).
A. bombi was isolated from a highly infected wild-caught
B. pascuorum worker (this bee was caught in Ghent, Belgium, but was not part of the networks used in this study); fat body and gut tissue were ground in PBS solution. Oocysts of
A. bombi were purified by 90 min centrifugation at 3450×
g over a gradient consisting of 1 mL of each layer of 30%, 50%, 70%, and 90% Percoll (Sigma-Aldrich, Overijse, Belgium). The interface between the 70% and 90% Percoll was collected and diluted with 2 mL of PBS and centrifuged at 870×
g for 15 min; this was repeated 3 times to replace the Percoll with PBS in order to obtain purified
A. bombi oocysts in PBS solution.
A subset of both the
C. mellificae cells (from the in vitro culture) and the
A. bombi oocysts (isolated from a
B. pascuorum worker, as described above) was taken, and the cells/oocysts were counted with a hemocytometer (Bürker chamber) before DNA extraction. By using a standard curve based on an extraction of a known number of infective particles, we compensate for DNA extraction efficiency. However, we cannot compensate for the efficiency of the wash steps of both the flowers and the bees. Therefore, the obtained number of infective particles is indicative of the minimal amount present on both the flowers and the exterior of the bees. The parasite load in the bumblebees was quantified relatively (relative to the lowest parasite load) since absolute quantification here is not appropriate. As the host replication stages of the parasites may be present for Neogregarinorida [
24], this could result in an overestimation of the number of parasites present.
2.5. Statistical Analysis
To explain the parasite presence on the flowers, we compared two generalized linear mixed models (GLMMs) using the lme4 package [
25]. For these models, the presence or absence of parasites (i.e., either Trypanosomatidae or Neogregarinorida) served as a binomial response variable for which the link function log of the odds ratio (logit) was used. Site and flower species served as random variables, where flower species was nested within the site. In the first model (M1), we used the average visitation frequency (of all pollinators combined) per plant species as a fixed factor (Equation (2)).
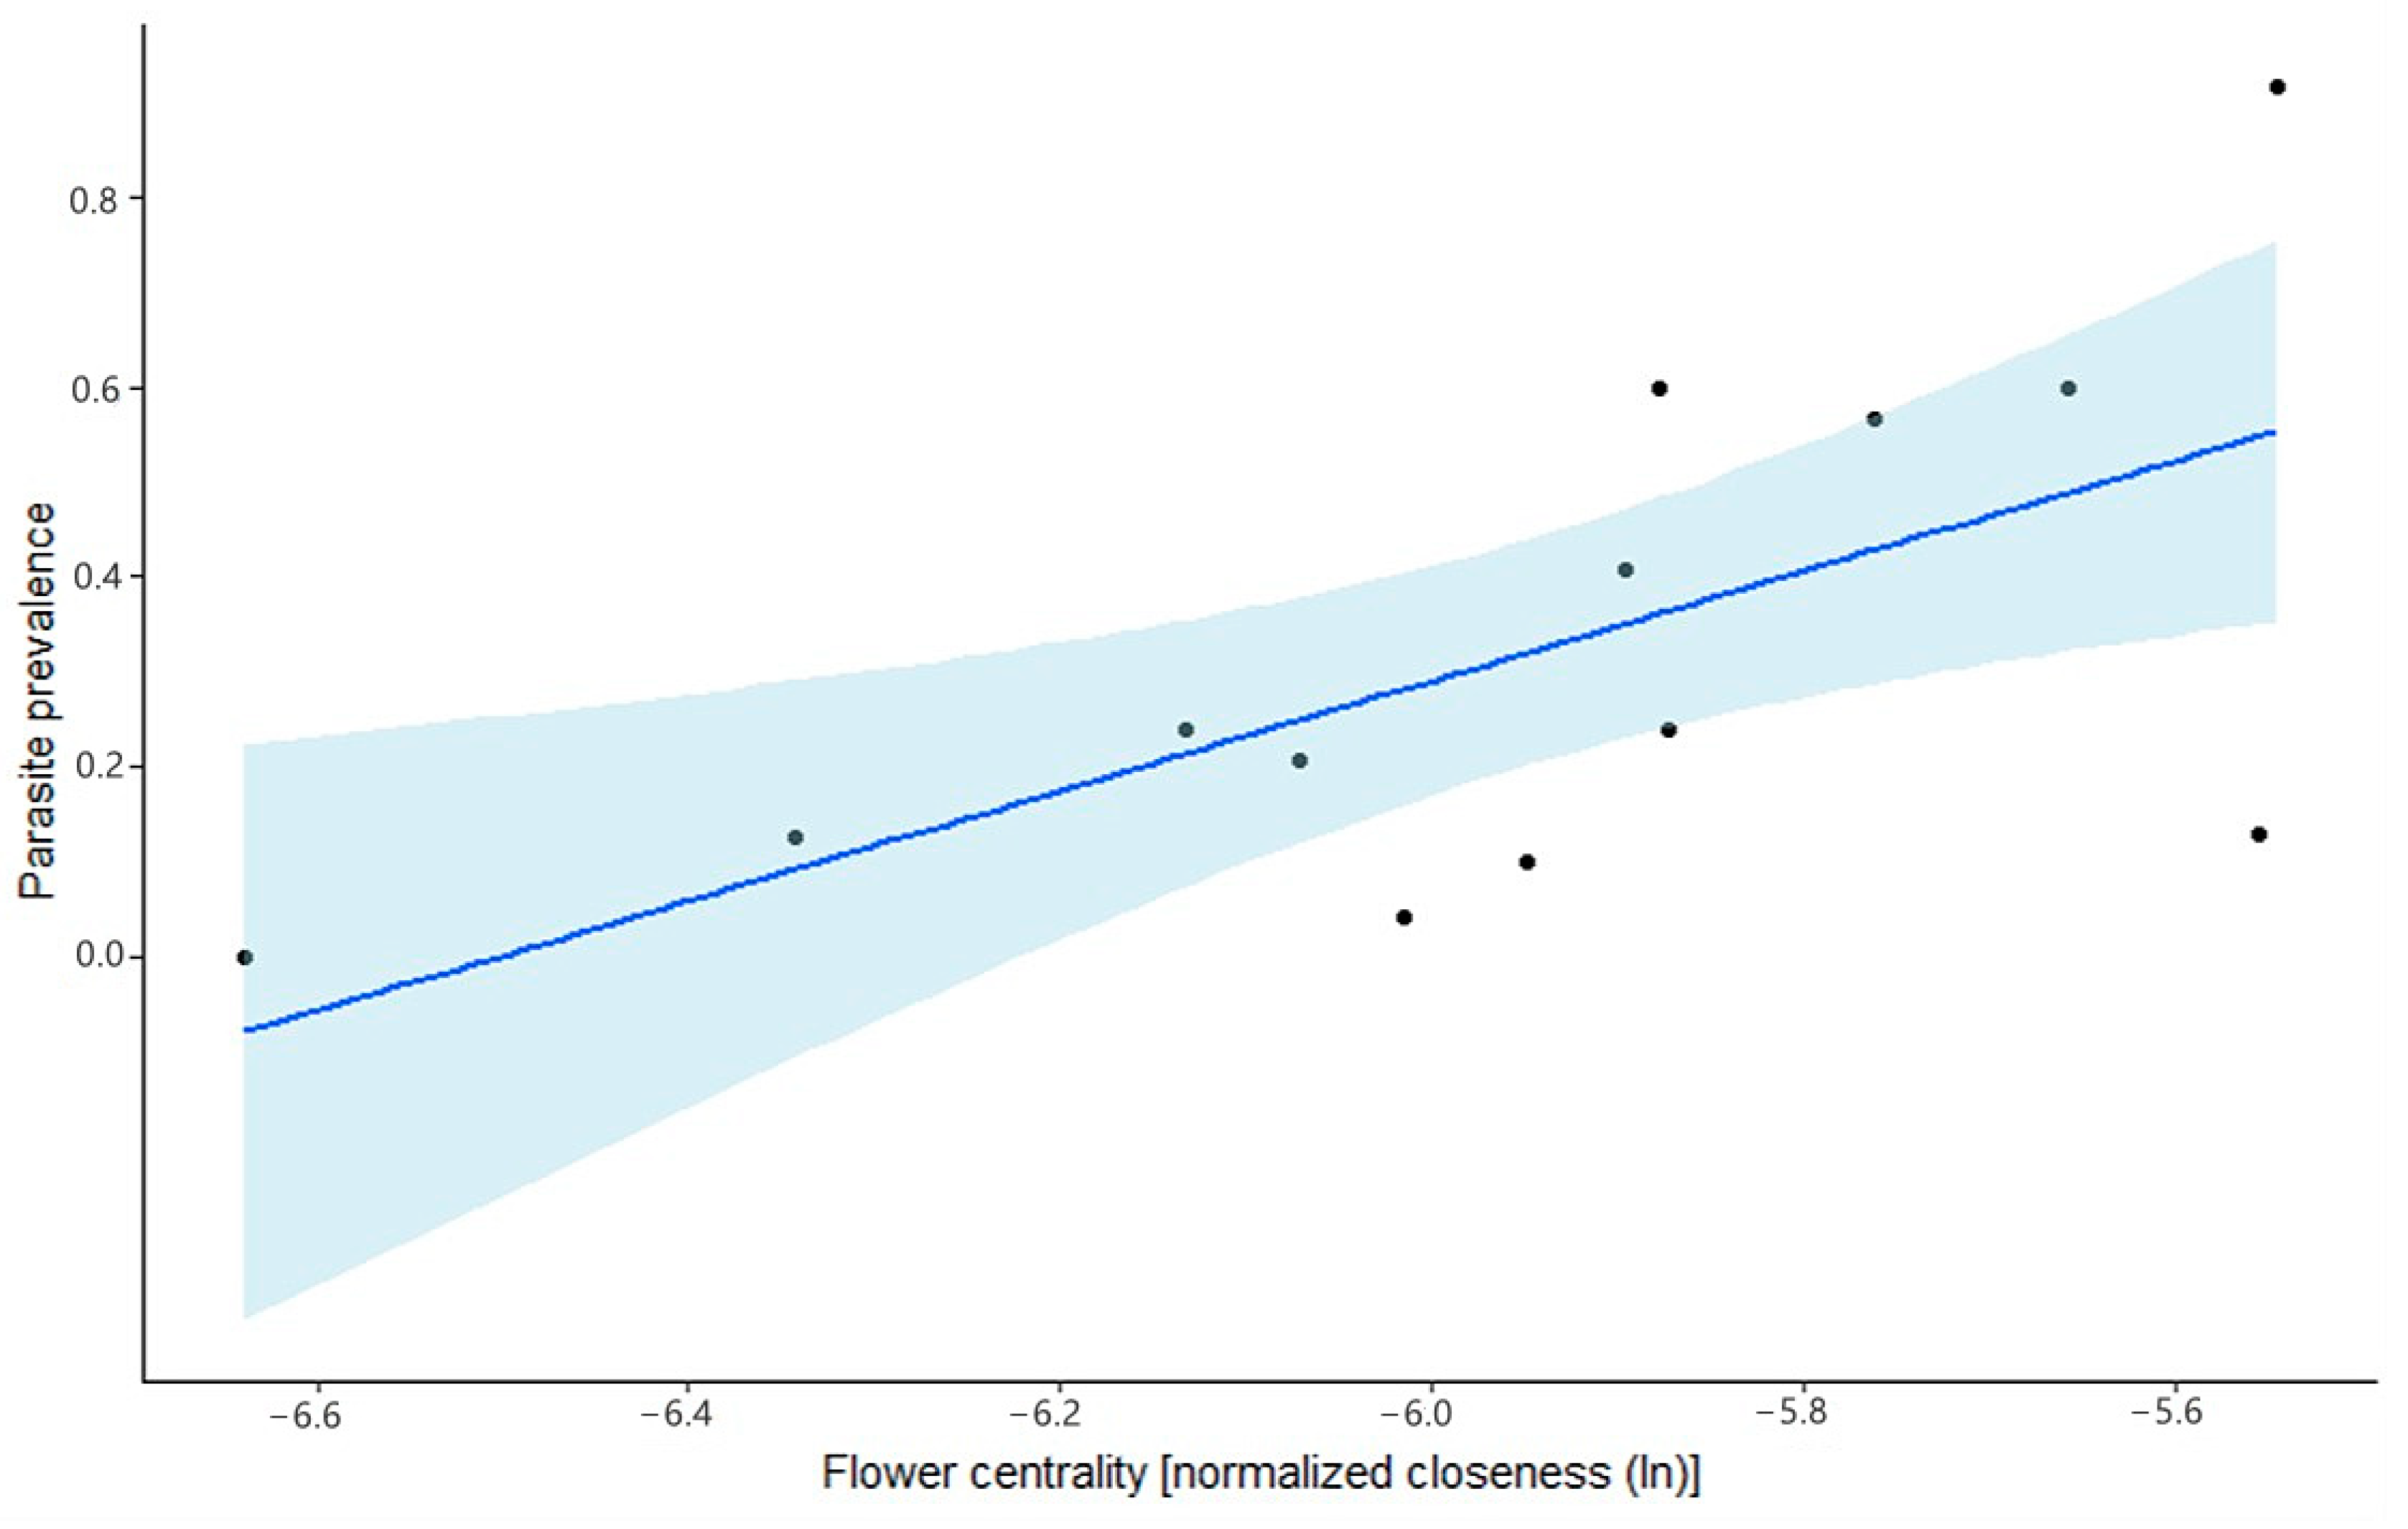
In the second model (M2), we used the natural logarithm of normalized closeness as a fixed factor (see
Section 2.2 on network construction for details) as this measure is most often used to approximate centrality in a network [
19,
21,
22].
The relationship between the detection of microparasites in the bees and the presence of microparasites of the same species on the exterior of the bees was tested using Pearson’s chi-squared test with Yates’ correction. The relationship between the relative quantity of the detected parasites (i.e., parasite load) in the bees and the presence of microparasites of the same species on the exterior of the bees was tested using ANOVA, where the relative quantity of the parasite was made relative to the individual with the lowest parasite load.
4. Discussion
Unraveling the transmission process is an important facet of disease epidemiology. Nevertheless, under natural conditions, it is often difficult to determine the exact mechanisms of transmission, especially when dealing with multihost parasites [
26]. In this study, we identified flowers as a potential transmission hub for multihost parasites, i.e., Neogregarinorida and Trypanosomatidae, in a pollinator community mostly dominated by bee species. The transmission process of parasites can be broken down into different steps: (i) infectious particles are presented by an infected host, (ii) infectious particles are dispersed between healthy and infected hosts, and (iii) infectious particles are taken up by a naïve host, which becomes infected [
26]. Screening of the flowers in our network showed the presence of both Trypanosomatidae and Neogregarinorida on different flower species. These findings are in line with the dispersion of infective particles by an infected host (i.e., step two in the transmission process) via flowers. This route has been put forward in several studies under controlled circumstances [
11,
13,
27]. Recently two studies have also found the presence of parasites on flowers in field conditions and provide valuable insights into the role of plant–pollinator networks in the transmission of parasites [
6,
7]. Figueroa et al. (2020) showed that network characteristics, such as degree (i.e., the diet breath) of the most dominant pollinator, as well as the general network connectance, are good predictors of parasite prevalence in the pollinator community. Although this study provides interesting results, the construction of their networks was done by observations over several months, which may overlook detailed processes of transmission as the plant–pollinator networks change over time [
28]. This turnover will likely affect parasite transmission. Graystock et al. (2020) found that parasite prevalence on flowers changes with the seasons. Within this study, we performed extensive monitoring (average observed interactions per network was 138 one-day observations) in comparison to Figueroa et al. (2020; average observed interactions per network was 267 (several days of monitoring spread across months)) to elucidate the transmission process and its link to the plant–pollinator network in more detail. Furthermore, by focusing on the flowers, i.e., the site of transmission, to elucidate the role of the plant–pollinator network in parasite transmission, we overcome several factors that may obscure the findings when one focuses on the host species. One clear example here is the presence of social pollinators, such as honey bees or bumblebees, which may have acquired the parasite infection from close contact within the nest [
29,
30] rather than via flowers; this may bias parasite prevalence in the analyzed hosts if these social bees are abundant.
Besides the detection of parasites on flowers, which is in line with previous reports [
6,
7], we also show that the parasite loads detected on the flowers surpass the minimal amount needed to induce an infection under laboratory conditions, based on the current literature [
27,
31].
The presentation of infective particles by an infected host on the flowers (i.e., step one of the transmission process) can occur via feces as both Neogregarinorida and Trypanosomatidae occurring in bee species have an oral–fecal transmission, where feces can contain high loads of infective particles [
32]. Graystock et al. (2013) showed that feeding off the feces containing
A. bombi (as low as ca. 40 oocysts) can result in an infection. Infection studies with feces have also been performed in several studies for
C. bombi, a bee-infecting trypanosomatid [
32,
33].
External vectoring, where a pollinator deposits infective particles that are sticking to its body onto a flower, could also result in the contamination of flowers. We here evaluated the likelihood of this mechanism by quantifying the parasite loads on the exterior of bees. We are aware that the detection and quantification of infective particles are not direct proof of the existence of this mechanism, yet it provides information on the potential of this transmission mechanism.
We here show that bees can indeed carry infectious particles on their exterior. As one can expect, we found that bees that had a high internal parasite load were more likely to have parasites on their exterior. However, we also found that parasites can be present on the exterior without the bee harboring the parasites internally. Quantification of the infective particles on the exterior showed that both
C. bombi and
A. bombi exceeded the minimal infection amount currently reported in the literature (
vide infra). The absence of a link between the detection of parasites within the bee and the presence of infective particles on their exterior, together with the detected quantity on the bee’s exterior, strongly suggest that external vectoring is indeed a possible route for the dispersal of infective particles. Finally, for an infection to occur, infective particles must be taken up by a naïve host (step three in the transmission process). The number of infective particles taken up must surpass the minimal amount needed to establish an infection. Quantification of the infective particles on the flowers of both Trypanosomatidae and Neogregarinorida showed that both exceeded the minimal infection dose currently reported in the literature to induce an infection. The Neogregarinorida loads found on the flowers were up to 100-fold higher than the minimal infection dose needed, i.e., 40 oocysts, according to the current literature [
31]. For the trypanosome
C. bombi, the minimal infection dose found in the literature is circa 1000 infective cells [
27], which is quite high compared to the neogregarine
A. bombi. Either this dose is indeed the minimal possible infection dose or lower doses are not tested, as most studies want to ensure infection in their experiments. Nonetheless, we found Trypanosomatidae loads on the flowers that were in the same order of magnitude as the minimal infection dose published in the literature. However, we do not know how many infective particles are taken up from a flower by a visiting naïve host, as this is dependent on the flower part where the infective particles are encountered, which is, in turn, dependent on the plant species and the pollinator species visiting the plant [
15]. Hence, the quantification of infective particles merely shows that the parasite quantities present on the flower are high enough to potentially cause an infection if ingested. Within this study, we stated the hypothesis that if transmission indeed occurs via flowers, then central flowers in the plant–pollinator network have a higher likelihood of carrying infective particles. We compared two factors to explain parasite prevalence on the flowers and showed that using the flower’s closeness centrality (obtained from a weighted plant–pollinator network) is more informative than using the visitation frequency of the flower. These results provide evidence to support our hypothesis and further underline current insights into the usefulness of plant–pollinator networks in epidemiological studies on pollinators. This study, together with the recent study of Figueroa et al. (2020), provides the first steps into a thorough understanding of the role of the plant–pollinator network in parasite transmission. We, therefore, argue that future research should aim at looking at both the role of the host species (as done by Figueroa et al. (2020)) and the role of the flowers (this study) in intense network monitoring (i.e., visitation weighted network construction based upon data collected on a single day) at different times to provide more detail on the effect of the temporal dynamics of plant–pollinator networks on parasite transmission and the role of the hosts and flowers herein.


