Article

Characterization of the Complete Mitochondrial Genomes from Two Nitidulid Pests with Phylogenetic Implications

Key Laboratory of Plant Protection Resources and Pest Management of the Ministry of Education, Entomological Museum, College of Plant Protection, Northwest A&F University, Yangling 712100, Shaanxi, China
*
Author to whom correspondence should be addressed.
Insects 2020, 11(11), 779; https://doi.org/10.3390/insects11110779
Submission received: 26 September 2020 / Revised: 6 November 2020 / Accepted: 7 November 2020 / Published: 11 November 2020

Abstract

:

Simple Summary

Nitidulidae is the most diverse group of Cucujoidea. In this study, we sequence and analyze two mitochondrial genomes of the nitidulid species, Xenostrongylus variegatus and Epuraea sp. Both genomes are highly conserved in their size, base content, codon usage, and secondary structure of tRNAs. Phylogenetic analyses of Nitidulidae and related families in Cucujoidea are carried out based on three outgroups and fourteen ingroups. The results of the Bayesian inference and maximum likelihood methods support the monophyly of Nitidulidae and the sister-group relationship of Kateretidae + (Monotomidae + Nitidulidae).

Abstract

The complete mitochondrial genomes of Xenostrongylus variegatus and Epuraea sp. were sequenced and analyzed. The total genome lengths are 17,657 and 16,641 bp, with an A+T content of 77.2% and 76.4%, respectively. Each mitochondrial genome consists of 37 coding genes and a non-coding (AT-rich) region. All protein-coding genes (PCGs) start with the standard start codon, ATN, and end with complete stop codons, TAA and TAG, or an incomplete stop codon, T. All tRNAs can be folded into the typical clover-leaf secondary structure, with the exception of trnS1 in both species with a reduced dihydrouridine (DHU) arm. The AT-rich region has tandem repeats differing in both number and length. Genetic distance and Ka/Ks analyses show that nad6 has a higher variability and more rapid evolutionary rate than other PCGs. Both maximum likelihood and Bayesian inference phylogenetic analyses based on 13 PCGs and 2 ribosome DNAs (rDNAs) agree with the previous phylogenies in supporting the Nitidulidae monophyly and the sister-group relationship of Kateretidae + (Monotomidae + Nitidulidae).

1. Introduction

Nitidulidae is the largest group within the Cucujoidea (Coleoptera, Polyphaga), containing 350 genera in ten subfamilies, with nearly 4500 species worldwide [1,2]. Members of Nitidulidae inhabit a wide range of habitats in the Holarctic, Oriental, and Afrotopical Regions [3,4]. Many nitidulid species are pests of grain and other cash crops, seriously impacting plant pollination and seed production, and also spreading fungal pathogens [5,6,7,8,9,10,11,12,13,14,15,16,17,18]. Xenostrongylus variegatus Fairmaire, 1891, and Epuraea sp., the two species treated here, are also important pests of oilseed rape [19,20] and beehives respectively, with both widely distributed across China.
Nearly all morphological and molecular data analyzed to date support the monophyly of Nitidulidae [1,21,22], except Tang’s analysis nesting Nitidulidae within Erotylidae based on mitochondrial genomes [23], and Bocak’s analysis nesting Passandridae within Nitidulidae [24]. However, Tang’s and Bocak’s analyses did not specifically focus on Nitidulidae and included very few species of Nitidulidae, so the results were not conclusive.
The phylogenetic relationship of Nitidulidae to other cucujoid families also remains unclear. Most morphological data support the sister relationship of Nitidulidae + Kateretidae [22,25,26,27], and this result is also supported by certain studies based on gene fragments, such as Cline et al. [21], based on seven loci (12S, 16S, 18S, 28S, COI, COII, and H3), and Robertson et al. [2], based on eight loci (18S, 28S, H3, CAD, 12S, 16S, COI, and COII). The sister-group relationship of (Nitidulidae + Kateretidae) with Monotomidae was also supported by Bocak et al.’s [24] study based on four loci (18S, 28S, rrnL, and COI). Nevertheless, Hunt [28] suggested that Nitidulidae is closer to Monotomidae than to Kateretidae. Leschen noted that even though Nitidulidae and Monotomidae share an apparent morphological apomorphy, i.e., abdominal tergite VII exposed in dorsal view and tergite VIII in males with sides curved ventrally forming a genital capsule, their sister relationship is still doubtful [25]. So, further phylogenetic studies are needed in order to clarify the relationships between Nitidulidae and related families of Cucujoidea.
So far, only five complete nitidulid mitochondrial genomes (Epuraea guttata (Olivier, 1811), Carpophilus dimidiatus (Fabricius, 1792), Carpophilus pilosellus (Motschulsky, 1858), Aethina tumida (Murray, 1867), and Nitidulidae sp.) have been published in GenBank. In this study, we present the mitochondrial genomes of two additional nitidulid species, Xenostrongylus variegatus and Epuraea sp., annotating and analyzing their structures in detail. We reconstruct the phylogenetic relationships of Nitidulidae and related families of Cucujoidea based on 13 protein-coding genes (PCGs) and 2 rRNAs of 17 taxa, including three outgroups and fourteen ingroups of insects. The purpose of this study is to improve our understanding on the mitochondrial characteristics of Nitidulidae and its phylogenetic relationships with related families.

2. Materials and Methods

2.1. Materials and DNA Extraction

Xenostrongylus variegatus was collected from Xiaozhongdian, Shangri-La, Yunnan Province, China, in 2018. Epuraea sp. was collected from honeycomb in Xishuangbanna, Yunnan Province, China, in 2019. All materials were preserved in 100% ethanol and stored at −80 °C in the Entomological Museum of the Northwest A&F University. The total genomic DNA was extracted using the DNeasy DNA Extraction kit (Qiagen) after the morphological identification.

2.2. Sequence Analysis

The mitochondrial genomes of X. variegatus and Epuraea. sp. were sequenced by next-generation sequencing (NGS; Illumina HiSeq X10; 5.46 gb raw data; by Biomarker Technologies Corporation, Beijing, China). The raw data were preprocessed, then assembled and annotated with the default parameters used in the mitochondrial genomes of C. dimidiatus and C. pilosellus as the reference sequences, respectively. Default parameters were performed by Geneious 8.1.3 (Biomatters, Auckland, New Zealand) [29]. The 13 PCGs were identified by finding open reading frames (ORFs) and were translated into amino acids according to the invertebrate mitochondrial genetic code. The positions and secondary structures of 22 tRNAs were predicted by the MITOS Web Server (http://mitos.bioinf.uni-leipzig.de/index.py) [30]. Then, we manually edited the clover-leaf secondary structure with Adobe Illustrator CS5 according to the predicted structures. Two rRNAs and the AT-rich region were identified by the location of adjacent genes and through comparison with other reported homologous sequences of members of Nitidulidae. Mitogenomic circular maps were produced using CGView Server (http://stothard.afns.ualberta.ca/cgview_server/) [31]. The base composition, component skew, and codon usage of the PCGs and relative synonymous codon usage (RSCU) were analyzed using PhyloSuite v1.2.1 [32]. Tandem repeats of the control region were established by the Tandem Repeats Finder Online server (http://tandem.bu.edu/trf/trf.html) [33]. A sliding window of 200 bp was used to estimate the nucleotide diversity (Pi) of the PCGs at a step size of 20 bp by DnaSP V5 in order to evaluate the Pi value of the PCGs among seven nitidulid mitochondrial genomes [34]. The ratio of the number of nonsynonymous substitutions per nonsynonymous site (Ka) to the number of synonymous substitutions per synonymous site (Ks) of 13 PCGs for seven species of Nitidulidae was estimated using DnaSP V5 [34]. The genetic distances between seven species of Nitidulidae based on each PCG were estimated with Mega 6 [35] with the Kimura-2-parameter model.

2.3. Phylogenetic Analysis

The phylogenetic analyses were performed using 13 PCGs and 2 rRNAs from 17 species of Cucujoidea (Table 1). All of the reported complete and partial mitochondrial genomes in this study were downloaded from GenBank. Standardization of data and extraction of information was conducted by PhyloSuite v1.2.1. The nucleotide sequences of the PCGs were aligned in batches with MAFFT using codon alignment and the G-INS-i (accurate) strategy. rRNAs were aligned with MAFFT version 7 online services using the Q- INS-i strategy (https://mafft.cbrc.jp/alignment/server/). Gaps and ambiguously aligned sites in the alignment were removed using Gblocks, and then by concatenating each gene into PhyloSuite. The optimal nucleotide replacement model and segmentation strategy were recommended by PartitionFinder. The best fitting models (Table S1) were selected for each partition using the “greedy” search algorithm, and were “linked” to estimated branch lengths using the Bayesian information criterion (BIC) [32].
Maximum likelihood (ML) and Bayesian inference (BI) were used for the phylogenetic analyses based on four 17-taxa datasets, namely: (1) the PCG123 matrix, including all three codon positions of protein-coding genes; (2) the PCG123R matrix, including all three codon positions of protein-coding genes and two rRNA-encoding genes; (3) the PCG12 matrix, the first and second codon positions of protein-coding genes; and (4) the PCG12R matrix, including the first and second codon positions of protein-coding genes and two rRNA-encoding genes.
The ML phylogenetic analyses were performed using IQ-TREE V 1.6.8 [41], using an ultrafast bootstrap algorithm with 1000 replicates. The BI phylogenetic analyses were performed using MrBayes 3.2.7 [42], and 1 × 10⁷ Markov chain Monte Carlo (MCMC) generations, sampled per 1000 generations. Convergence occurred when the average standard deviation of the split frequencies was <0.01; the first 25% of the samples were discarded as burn-in, and the remaining samples were used to generate a consensus tree and to estimate the posterior probabilities.

3. Results and Discussion

3.1. Genome Organization

The mitochondrial genomes are characterized by their asymmetric AT and GC content in the nucleotide composition. Both mitochondrial genomes show a heavy AT nucleotide bias. The AT content of the whole genome is 77.2% in X. variegatus (A = 39.4%, T = 37.8%, C = 13%, and G = 9.8%) and 76.4% in Epuraea sp. (A = 37.6%, T = 38.8%, C = 14.4%, and G = 9.3%; Table 2). Among all of the reported species of Nitidulidae, only X. variegatus shows a lower AT content in the AT-rich region than in the rDNAs. In addition, all of the reported Nitidulidae species show positive AT skews and negative GC skews in the whole genomes, expect for Epuraea sp., which has a negative AT skew (Table 3).
The lengths of the complete mitochondrial genome are 17,657 bp in X. variegatus and 16,641 bp in Epuraea sp., the length of the former is longer than that reported for Nitidulidae (Table 3) because of the differences in the number of AT-repeats in the AT-rich region. The mitochondrial genomes of both species consist of closed, circular, double-stranded DNA molecules (Figure 1 and Figure 2), and contain 37 genes, including 13 PCGs, 22 tRNAs, 2 rDNAs, and a AT-rich region. While four PCGs (nad1, nad4, nad4L, and nad5), eight tRNAs (Q, C, Y, F, H, P, L1. and V), and two rRNAs (lrRNA and srRNA) are encoded in the heavy strand, the others are encoded in the light strand (Table 4). The sequence of genes is consistent with the reference mitochondrial genome arrangement and with other Nitidulidae.
Apart from the AT-rich region, there are 197 bp spacers across nine gene intervals ranging from 1–114 bp in X. variegatus, and 62 bp spacers across eight gene intervals ranging from 1–19 bp in Epuraea sp. The longest intergenic spacer is located between trnW and trnC in X. variegatus, and nad1 and trnL1 in Epuraea sp, while in A. tumida the longest is 18 bp between trnL2 and cox2. In C. dimidiatus, C. pilosellus, and E. guttata, there are 24 bp, 107 bp, and 79 bp intergenic spacers between trnW and trnC, respectively. Gene overlaps are found at the junctions of 11 pairs of genes ranging from 1–10 bp in X. variegatus and 1–9 bp in Epuraea sp., with the longest overlap located between nad4 and trnT in X. variegatus, trnY, and cox1 in Epuraea sp, A. tumida, C. dimidiatus, C. pilosellus, and E. guttata.

3.2. Protein-coding Genes (PCGs)

The total length of all 13 PCGs of X. variegatus is 11,046 bp and of Epuraea sp. is 11,097 bp, accounting for 62.56% and 66.68% of the total length of their mitochondrial genomes, respectively (Table 2). The start and stop codons were determined based on the reference sequences. Most PCGs start with a typical start codon ATN (ATC, ATG, ATA, and ATT), except for nad1, which starts with the unusual start codon TTG in A. tumida, E. guttata, and an unidentified Nitidulidae sp. Correspondingly, the PCGs ended with the stop codons TAA and TAG, whereas an incomplete stop codon, T, was found in cox1, cox2, cox3, atp8, nad4, and nad5 in Nitidulidae (Table 5). Such incomplete stop codons are common in insects and may result from post-transcriptional polyadenylation [43]. Furthermore, the stop codon TAA is used more frequently than TAG, and all seven Nitidulidae have cox1, at least, ending in an incomplete stop codon T.
The total AT ratios of 13 PCGs are 77.0% in X. variegatus (A = 34.0%, T = 43.0%, C = 13.0%, and G = 9.8%) and 74.9% in Epuraea sp. (A = 32.0%, T = 42.9%, C = 12.9%, and G = 12.2%). Both species show negative AT skews (−0.116 in X. variegatus and −0.146 in Epuraea sp.). X. variegatus shows no CG skew (0) and Epuraea sp. shows a negative CG skew (−0.026) (Table 2). The first codon position AT content (72.3% in X. variegatus and 71.1% in Epuraea sp.) is higher than that of the second codon position (68.9% in X. variegatus and 67.9% Epuraea sp.) and is much lower than that of the third codon position (89.8% in X. variegatus and 85.5% in Epuraea sp.). The relative synonymous codon usage (RSCU) is shown in Figure 3. UUA (Leu), AUU (Ile), UUU (Phe), UCU (Ser 2), and AUA (Met) are the most frequently used codons in both species, which is highly consistent with the previously reported frequencies in Nitidulidae. As indicated by these results, nearly all of them consist of A and U, and contribute to the high AT content of PCGs.

3.3. Transfer and Ribosomal RNAs

The total length of all 22 tRNAs of X. variegatus is 1454 bp and of Epuraea sp. is 1445 bp, which is within the previously reported range for Nitidulidae, accounting for 8.23% and 8.68% of the total length of their mitochondrial genomes, respectively. The total AT percent is 78.2% (A = 39.6%, T = 38.6%, C = 9%, and G = 12.8%) for X. variegatus and 75.7% (A = 39.4%, T = 36.3%, C = 10.9%, and G = 13.4%) for Epuraea sp. Both species show positive AT skews (0.013 in X. variegatus and 0.041 in Epuraea sp.) and CG skews (0.174 in X. variegatus and 0.103 in Epuraea sp.) (Table 2). The length of each tRNA is between 63 bp (trnY and trnR) and 71 bp (trnK) in X. variegatus and between 62 bp (trnC and trnR) and 70 bp (trnK) in Epuraea sp. (Table 4).
Nearly all tRNAs can be folded into the typical clover-leaf structure, except for trnS1, which in both shows a reduced dihydrouridine (DHU) arm. The size of the anticodon (AC) arm and the amino acid acceptor (AA) arm are consistently 5 bp and 7 bp, respectively. The TΨC arm and DHU arm are variable: trnW, trnF, trnH, and trnT in both species; trnG in X. variegatus; and trnR in Epuraea sp. all lack the TΨC-loop. The trnS1 in both species lack the dihydorouridine (DHU) arm, which has been reported in other metazoans [44,45,46,47,48,49]. The length of the AC-loop is normally seven nucleotides, except for trnA in X. variegatus, which is six nucleotides. The trnS1 and trnA in Epuraea sp. have five nucleotides and the DHU loop ranges from 2–4 bp. The TΨC loop ranges from 3–5 bp in both species. The DHU-loop ranges from 3–9 nucleotides in Epuraea sp. and 3–8 nucleotides in X. variegatus. There are a total of 27 mismatched base pairs in X. variegatus of six types (U-U, U-G, A-G, A-C, U-C, and A-A) and 33 mismatched base pairs of six types (U-U, U-G, C-C, A-G, A-C, and U-C) found in Epuraea sp (Figure 4 and Figure 5).
The rRNAL and rRNAS are located between trnL1 and trnV, and trnV and the AT-rich region with lengths in X. variegatus of 1291 bp and 788 bp, but 1300 bp and 781 bp in Epuraea sp. The total rRNAs show a negative AT skew (−0.053 in X. variegatus and −0.063 in Epuraea sp.) and a positive CG skew (0.296 in X. variegatus and 0.353 in Epuraea sp.). The AT content in X. variegatus is 81.3% and 78.8% in Epuraea sp (Table 3). Therefore, rRNAs are highly conserved in the Nitidulidae for length, AT content, and location.

3.4. AT-rich Region

The assumed control region (the AT-rich region) is the major noncoding region in the mitochondrial genome. It is located between rrnS and trnI, and plays a regulatory role in the transcription and replication of the mtDNA [50,51,52,53,54]. The lengths of the AT-rich region of X. variegatus and Epuraea sp. are 2910 bp and 1984 bp, respectively (Figure 6). Both are longer than those previously reported for Nitidulidae. The AT contents of these regions are 74.6% and 82.6% in X. variegatus and Epuraea sp., respectively. The AT-rich regions in both species show negative AT skews (−0.078 in X. variegatus and −0.302 in Epuraea sp.) and negative CG skews (−0.064 in X. variegatus and −0.397 in Epuraea sp.). Both species have different lengths of tandem repeat, located at positions 1041 bp to 1660 bp in X. variegatus and 1368 bp to 1436 bp in Epuraea sp., respectively. Moreover, two poly-T stretches and two poly-C stretches are found near rrnS in Epuraea sp., which may be the origin of the DNA replication minor strand [51].

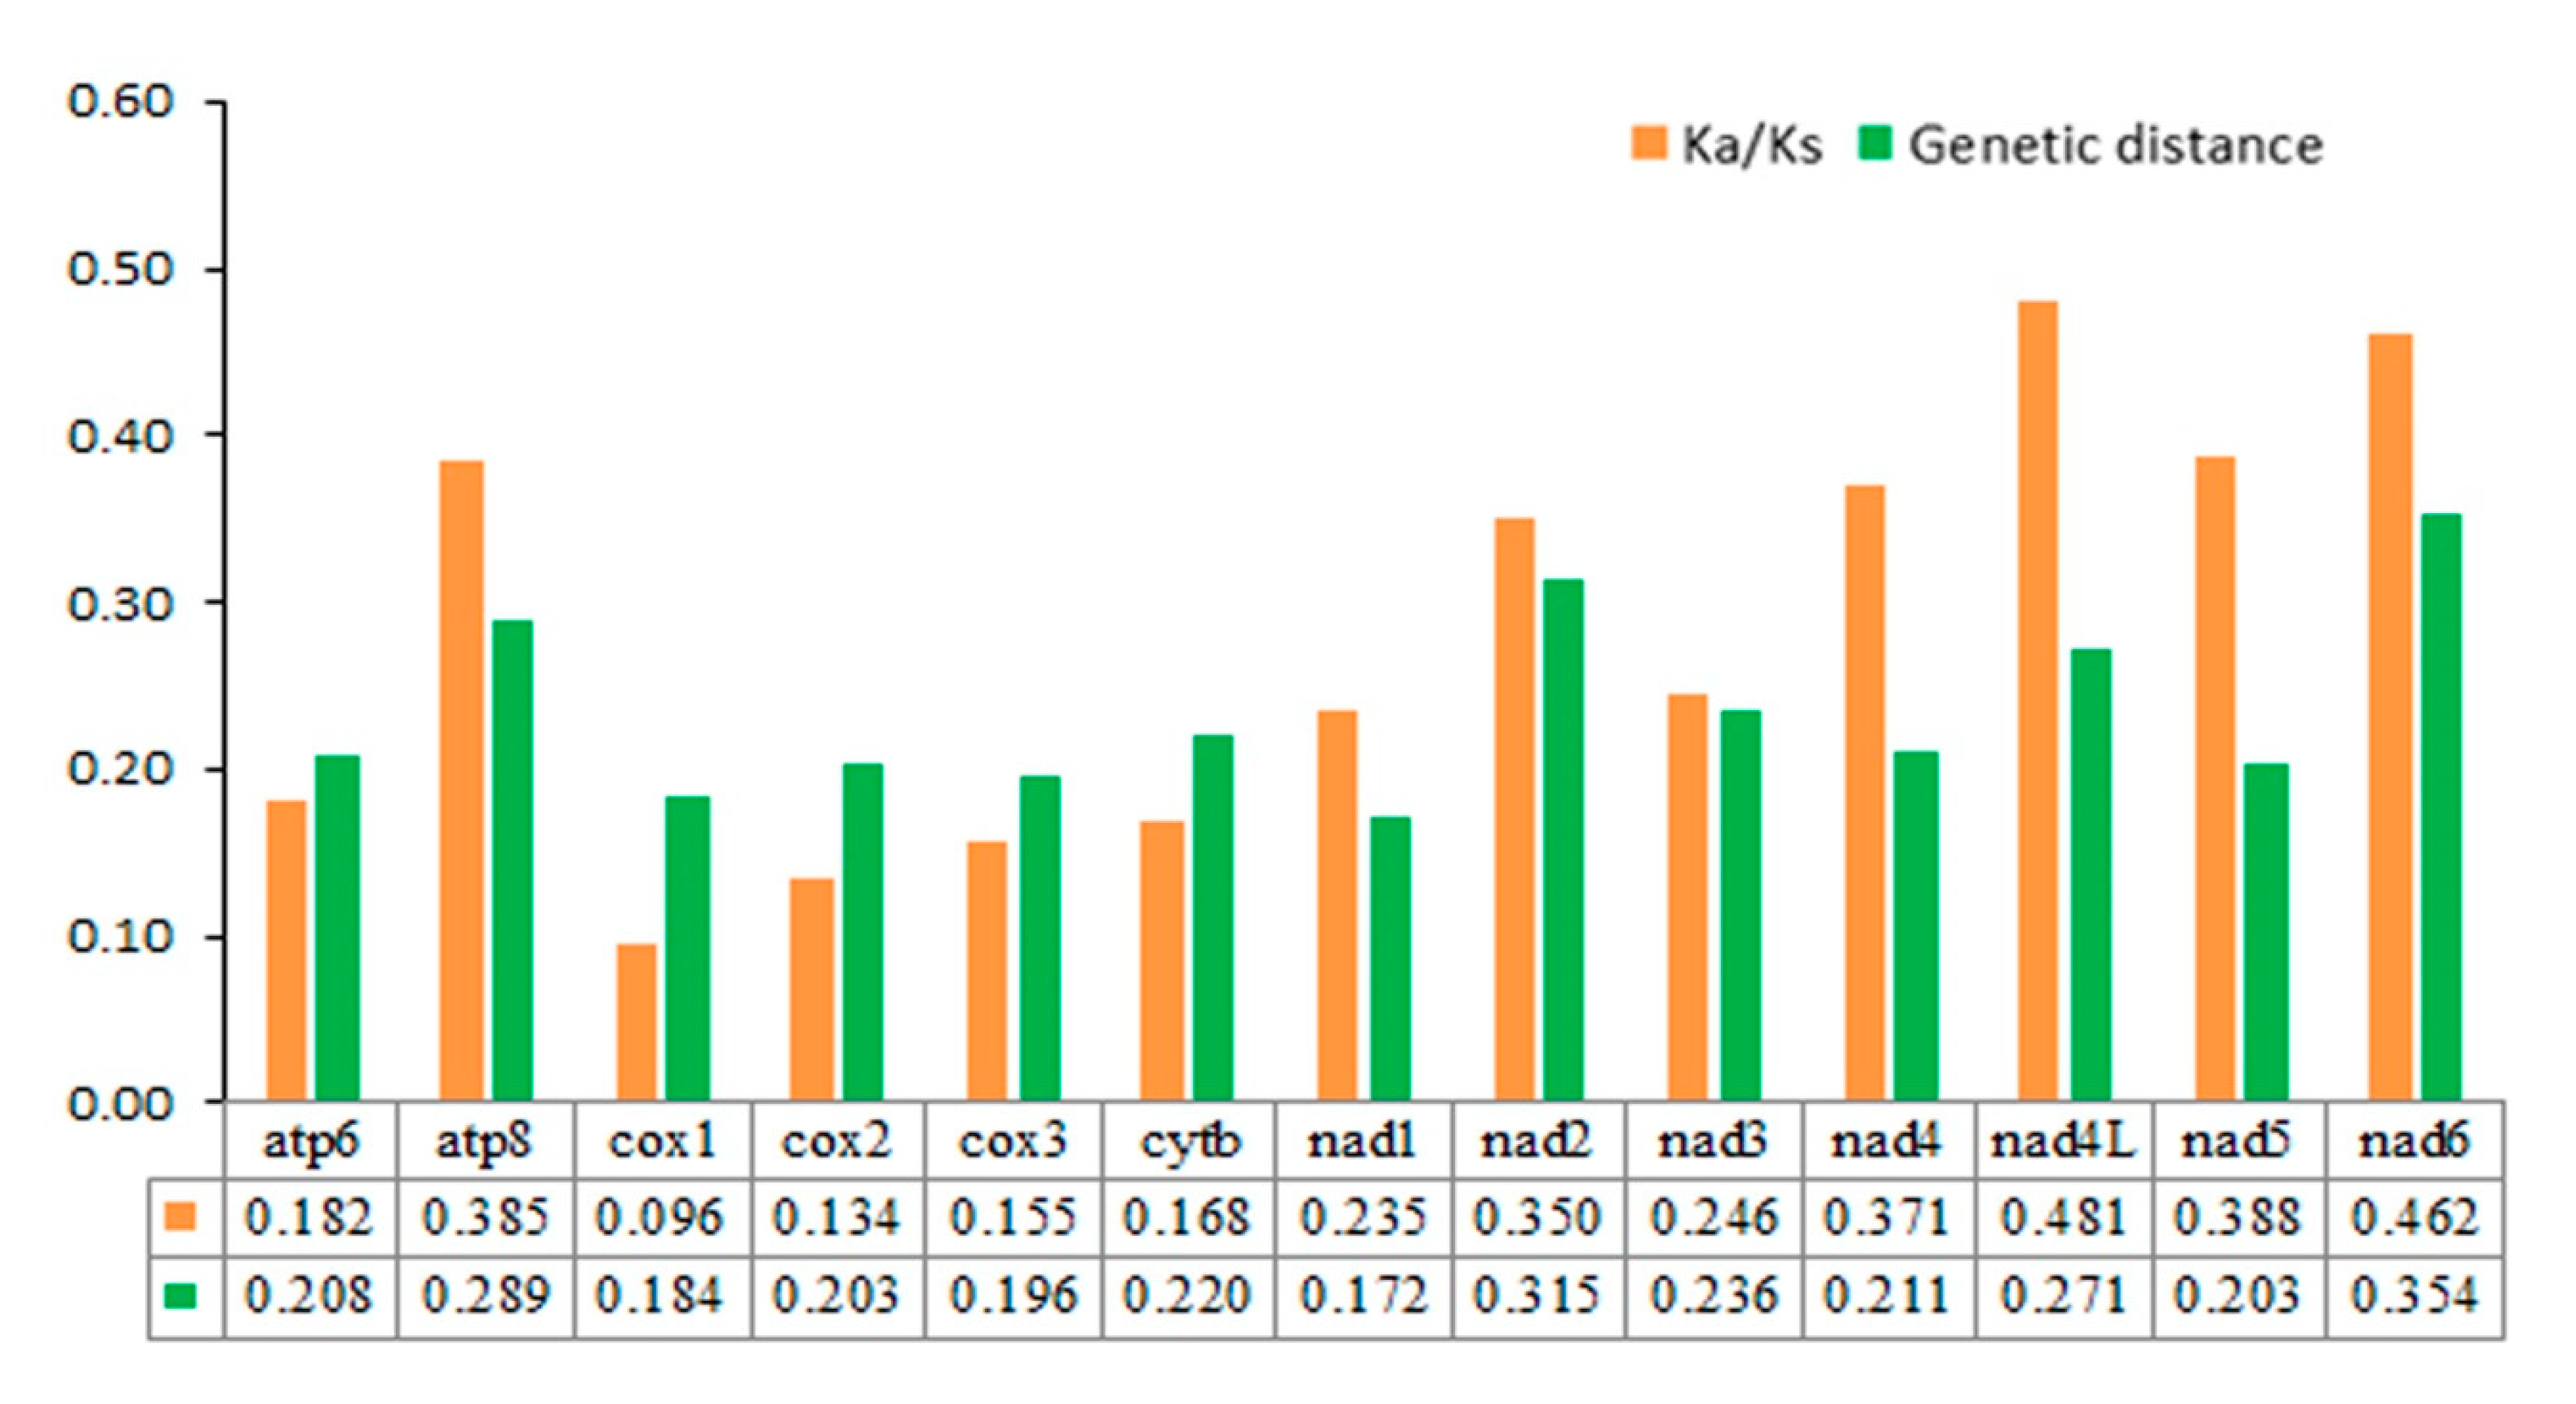
3.5. Nucleotide Analyses

The nucleotide diversity calculated for 13 PCGs of the seven Nitidulidae are shown in Figure 7. The results indicate that different genes have different nucleotide diversity values. In all PCGs, nad6 (Pi = 0.280) shows the highest nucleotide diversity values, next to nad2 (Pi = 0.255) and atp8 (Pi = 0.238). However, cox1 (Pi = 0.162) and nad1 (Pi = 0.154) show lower nucleotide diversity values and are the most conserved of the mitochondrial PCGs (Figure 7).
Pairwise comparisons of the genetic distances show consistent results: nad6 (0.354) and nad2 (0.315) have greater distances and a faster evolution, while nad1 (0.172) and cox1 (0.184) represent shorter distances and a slower evolution. The average nonsynonymous (Ka) and synonymous (Ks) replacement rates of the 13 PCGs in seven mitochondrial genomes are estimated to be in the range of 0.096–0.481, indicating that all PCGs are under purifying selection. In addition, cox1 (0.096) exhibits the strongest purifying selection and shows the lowest evolutionary rate. In contrast, the substitution rates of nad4L (0.481) and nad6 (0.462) are much higher than in other PCGs, suggesting that they may be under a relaxed purifying selection (Figure 8). This suggests that the latter gene may be most suitable for resolving phylogenetic relationships among closely related species.

3.6. Phylogenetic Analysis

The phylogenetic analyses in this study were based on four datasets (PCG123, PCG123R, PCG12, and PCG12R) including 17 species of Cucujoidea. The partitioning schemes and models for the four datasets are listed in Tables S1 and S2. Eight tree topologies were constructed according to the ML and BI analysis (Figure 9 and Figures S1–S6). Although the tree topologies were not completely consistent among the analyses, all of the results support the monophyly of Nitidulidae and a sister-group relationship of Kateretidae + (Monotomidae + Nitidulidae).
Both BI and ML methods based on four different datasets strongly support the monophyly of Nitidulidae (Nitidulinae + (Carpophilinae + Epuraeinae)), which is consistent with previous studies of Cline and Lee [1,21,25]. In the present study, Kateretidae consistently forms a sister-group with Monotomidae + Nitidulidae, forming a monophyletic clade with moderate support (bootstrap value (BS) = 70 and Bayesian posterior probabilities (PP) = 1). The sister relationship of Nitidulidae to Monotomidae is supported by high posterior probabilities in BI trees (PP = 0.993). This result is consistent with that of Hunt [28], but contradicts most previous phylogenetic analyses based on morphological characters [25,26,27] and gene fragments [1,2,21], which all support the Nitidulidae sister to Kateretidae. Considering that only a few taxa are included in this study, more species need to be sequenced and the mitochondrial data need to be combined with data from nuclear genes and morphology in order to provide a more robust phylogeny of Nitidulidae and the related families.

4. Conclusions

New complete mitochondrial genomes of two nitidulid species, X. variegatus and Epuraea sp., are provided. Comparative analyses of the available Nitidulidae mitochondrial genomes show that they are highly conserved in terms of their genome size, base content and composition, codon usage, and secondary structures of tRNAs. The results of the phylogenetic analyses confirm the monophyly of Nitidulidae and support the sister relationship of Kateretidae + (Monotomidae + Nitidulidae). This indicates that mitochondrial data can help resolve phylogenetic relationships at different levels in the taxonomic hierarchy. Although some differences between the present results and previously published phylogenies of this group of beetles may be due to differences in the taxon sampling and phylogenetic analysis methods, the present study indicates that mitochondrial genome sequencing can contribute to an improved understanding of the phylogenetic relationships among and within the Cucujoidea.

Supplementary Materials

The following are available online at https://www.mdpi.com/2075-4450/11/11/779/s1, Figure S1: Phylogenetic tree produced from the BI method based on a PCG12 dataset. Figure S2: Phylogenetic tree produced from the ML method based on a PCG12 dataset. Figure S3: Phylogenetic tree produced from the BI method based on a PCG123 dataset. Figure S4: Phylogenetic tree produced from the ML method based on a PCG123 dataset. Figure S5: Phylogenetic tree produced from the BI method based on a PCG123R dataset. Figure S6: Phylogenetic tree produced from the ML method based on a PCG123R dataset. Table S1: Best partitioning scheme and nucleotide substitution models for different datasets selected by PartitionFinder.

Author Contributions

Conceptualization, X.C. and M.H.; specimen collection and identification, X.C. and Q.S.; methodology, X.C., Q.S., and M.H.; software, X.C. and Q.S.; analysis, X.C.; writing—original draft preparation, X.C.; writing—review and editing, X.C and M.H.; funding acquisition, M.H. All authors have read and agreed to the published version of the manuscript.

Funding

This research was funded by the Fundamental Research Funds for Chinese Central Universities (Z109021305).

Acknowledgments

We sincerely express our gratitude to Christopher H. Dietrich (Illinois Natural History Survey, USA) for reviewing the manuscript and John R. Schrock (Emporia State University, USA) for proofreading the manuscript. We also greatly appreciate Xian Zhou, Wenqian Wang, Weijian Huang, Gang Wang, and Zonglei Liang for helping us with the software analysis.

Conflicts of Interest

The authors declare no conflict of interest. The funders had no role in the design of the study; in the collection, analyses, or interpretation of data; in the writing of the manuscript; or in the decision to publish the results.

References

  1. Lee, M.H.; Lee, S.; Leschen, R.A.B.; Lee, S. Evolution of feeding habits of sap beetles (Coleoptera: Nitidulidae) and placement of Calonecrinae. Syst. Entomol. 2020, 45, 911–923. [Google Scholar] [CrossRef]
  2. Robertson, J.A.; Ślipinski, A.; Moulton, M.; Shockley, F.W.; Giorgi, A.; Lord, N.P.; McKenna, D.D.; Tomaszewska, W.; Forrester, J.; Miller, K.B.; et al. Phylogeny and classification of Cucujoidea and the recognition of a new superfamily Coccinelloidea (Coleoptera: Cucujiformia). Syst. Entomol. 2015, 40, 745–777. [Google Scholar] [CrossRef]
  3. Kirejtshuk, A.G. On recent knowledge on the sap-beetles (Coleoptera, Nitidulidae) of India. Zool. Inst. Russ. Acad. Sci. 1999, 1, 21–32. [Google Scholar]
  4. Audisio, P. Fauna d’Italia 32. Coleoptera, Nitidulidae–Kateridae; Edizioni Calderini: Roma, Italy, 1993; Volume 32, p. 971. [Google Scholar]
  5. Luo, F. Basic Research on One Kind of Pollination Beetles in Protected Field Agriculture-Haptoncus luteolus. Master’s Thesis, Huazhong Agricultural University, Wuhan, China, 2004. [Google Scholar]
  6. Parsons, C.T. A revision of Nearctic Nitidulidae (Coleoptera). Bull. Mus. Comp. Zool. 1943, 92, 121–278. [Google Scholar]
  7. Lounsberry, Z.; Spiewok, S.; Pernal, S.F.; Sonstegard, T.S.; Hood, W.M.; Pettis, J.; Neumann, P.; Evans, J.D. Worldwide diaspora of Aethina tumida (Coleoptera: Nitidulidae), a nest parasite of honey bees. Ann. Entomol. Soc. Am. 2010, 103, 671–677. [Google Scholar] [CrossRef] [Green Version]
  8. Krishnan, K.T.; Neumann, P.; Ahmad, A.H.; Pimid, M. A scientific note on the association of Haptoncus luteolus (Coleoptera: Nitidulidae) with colonies of multiple stingless bee species. Apidologie 2014, 46, 262–264. [Google Scholar] [CrossRef] [Green Version]
  9. Zhao, H.X.; Chen, D.F.; Hou, C.S.; Wang, H.T.; Huang, W.Z.; Ji, C.H.; Ren, Q.; Xia, X.S.; Zhang, X.F. Biological characteristics of beehive beetle: Invasion hazard and its prevention and control countermeasures. J. Bee 2019, 1, 8–11. [Google Scholar]
  10. Dobson, R.M. The species of Carpophilus Stephens (Coleoptera: Nitidulidae) associated with stored products. Bull. Entomol. Res. 1954, 45, 389–402. [Google Scholar] [CrossRef]
  11. Nadel, H.; Pena, J.E. Identity, behavior, and efficacy of nitidulid beetles (Coleoptera: Nitidulidae) pollinating commercial Annona species in Florida. Environ. Entomol. 1994, 23, 878–886. [Google Scholar] [CrossRef]
  12. Glinski, Z.; Kostro, K.; Klimek, E. Aethina tumida-parasite and scavenger of the honeybee. Med. Weter. 2001, 57, 315–317. [Google Scholar]
  13. Deng, G.R.; Zeng, D.Q.; Li, W.Q.; Huang, D.X.; Zhou, Z.H. The harm of Tricanus japonicus on Dictyophora indusiata and its control. Plant Prot. 2006, 32, 117–118. [Google Scholar]
  14. Liao, T.L.; Yang, X.J.; An, Y.L.; Li, B.S.; Zhou, R. Several important Nitidulidae that transmit blight in the American oak. Plant Prot. 2005, 19, 37–38. [Google Scholar]
  15. Fan, H.S. A new record storage nitidulid and key for related species from China. J. Chin. Cereals Oils Assoc. 1993, 8, 1–3. [Google Scholar]
  16. Bai, X.G.; Cao, Y.; Zhou, Y.X. Identification of seven species of larvae of Nitidulidae from China. J. Zhengzhou Grain Coll. 1992, 2, 50–56. [Google Scholar]
  17. Zhou, Y.X.; Hao, L.J. A description of four species of storage Nitidulidae. J. Zhengzhou Grain Coll. 1997, 18, 99–100. [Google Scholar]
  18. Nie, W.G. Investigation and Classification of Stored Pests in Heilongjiang Province. Master’s Thesis, Northeast Agricultural University, Heilongjiang, China, 2004. [Google Scholar]
  19. He, C.G.; Wang, G.L.; Fan, Y.H.; Zou, Y.X.; Deng, Y.X.; Deng, H.Y. Study on a new pest of oilseed-Xenostrongylus variegatus. Acta Agric. Boreali Occident. Sin. 1998, 7, 18–23. [Google Scholar]
  20. Yang, Q.B.; Liu, W.C.; Huang, C. Statistics and analysis on oilseed rape losses caused by main diseases and insect pests in recent ten years. Plant Prot. 2018, 44, 24–30. [Google Scholar]
  21. Cline, A.R.; Smith, T.R.; Miller, K.; Moulton, M.; Whiting, M.; Audisio, P. Molecular phylogeny of Nitidulidae: Assessment of subfamilial and tribal classification and formalization of the family Cybocephalidae (Coleoptera: Cucujoidea). Syst. Entomol. 2014, 39, 758–772. [Google Scholar] [CrossRef]
  22. Lawrence, J.F.; Slipi’nski, A.; Seago, A.; Thayer, M.; Newton, A.; Marvaldi, A. Phylogeny of the Coleoptera based on adult and larval morphology. Ann. Zool. 2011, 61, 1–217. [Google Scholar] [CrossRef]
  23. Tang, P.; Li, M.; Feng, R.; Wang, J.; Liu, M.; Wang, Y.; Yuan, M. Phylogenetic relationships among superfamilies of Cucujiformia (Coleoptera: Polyphaga) inferred from mitogenomic data. Sci. Sinca 2019, 39, 163–171. [Google Scholar] [CrossRef]
  24. Bocak, L.; Barton, C.; Crampton-Platt, A.; Chesters, D.; Ahrens, D.; Vogler, A.P. Building the Coleoptera tree-of-life for >8000 species: Composition of public DNA data and fit with Linnaean classification. Syst. Entomol. 2014, 39, 97–110. [Google Scholar] [CrossRef]
  25. Leschen, R.A.B.; Lawrence, J.F.; Ślipiński, S.A. Classification of basal Cucujoidea (Coleoptera:Polyphaga): Cladistic analysis, keys and review of new families. Invertebr. Syst. 2005, 19, 17. [Google Scholar] [CrossRef]
  26. Jelínek, J.; Carlton, C.; Cline, A.R.; Leschen, R.A.B. Nitidulidae Latreille, 1802. In Handbuch der Zoologie/Handbook of Zoology; Leschen, R.A.B., Beutel, R.G., Lawrence, J.F., Eds.; Band/Vol. IV: Arthropoda: Insecta Teilband/Part 38. Coleoptera, Beetles. Morphology and Systematics (Polyphaga partim); W. De Gruyter: Berlin, Germany, 2010; Volume 2, pp. 390–407. [Google Scholar]
  27. Cline, A.R.; Slipinski, S.A. Discolomatidae Horn, 1878. In Handbuch der Zoologie/Handbook of Zoology; Leschen, R.A.B., Beutel, R.G., Lawrence, J.F., Eds.; Band. Arthropoda: Insecta Teilband; W. DeGruyter: Berlin, Germany, 2010; Volume IV, pp. 435–442. [Google Scholar]
  28. Hunt, T.; Bergsten, J.; Levkanicova, Z.; Papadopoulou, A.; John, O.S.; Wild, R.; Hammond, P.M.; Ahrens, D.; Balke, M.; Caterino, M.S.; et al. A comprehensive phylogeny of beetles reveals the evolutionary origins of a superradiation. Science 2007, 318, 1913–1916. [Google Scholar] [CrossRef] [PubMed]
  29. Kearse, M.; Moir, R.; Wilson, A.; Stones-Havas, S.; Cheung, M.; Sturrock, S.; Buxton, S.; Cooper, A.; Markowitz, S.; Duran, C.; et al. Geneious Basic: An integrated and extendable desktop software platform for the organization and analysis of sequence data. Bioinformatics 2012, 28, 1647–1649. [Google Scholar] [CrossRef]
  30. Bernt, M.; Donath, A.; Juhling, F.; Externbrink, F.; Florentz, C.; Fritzsch, G.; Putz, J.; Middendorf, M.; Stadler, P.F. MITOS: Improved de novo metazoan mitochondrial genome annotation. Mol. Phylogenet. Evol. 2013, 69, 313–319. [Google Scholar] [CrossRef]
  31. Grant, J.R.; Stothard, P. The CGView Server: A comparative genomics tool for circular genomes. Nucleic Acids Res. 2008, 36, 181–184. [Google Scholar] [CrossRef]
  32. Zhang, D.; Gao, F.; Jakovlic, I.; Zou, H.; Zhang, J.; Li, W.X.; Wang, G.T. PhyloSuite: An integrated and scalable desktop platform for streamlined molecular sequence data management and evolutionary phylogenetics studies. Mol. Ecol. 2020, 20, 348–355. [Google Scholar] [CrossRef]
  33. Benson, G. Tandem repeats finder: A program to analyze DNA sequences. Nucleic Acids Res. 1999, 27, 573–580. [Google Scholar] [CrossRef] [Green Version]
  34. Librado, P.; Rozas, J. DnaSP v5: A software for comprehensive analysis of DNA polymorphism data. Bioinformatics 2009, 25, 1451–1452. [Google Scholar] [CrossRef] [Green Version]
  35. Tamura, K.; Stecher, G.; Peterson, D.; Filipski, A.; Kumar, S. MEGA6: Molecular Evolutionary Genetics Analysis version 6.0. Mol. Biol. Evol. 2013, 30, 2725–2729. [Google Scholar] [CrossRef] [Green Version]
  36. Linard, B.; Crampton-Platt, A.; Moriniere, J.; Timmermans, M.J.T.N.; Andújar, C.; Arribas, P.; Miller, K.E.; Lipecki, J.; Favreau, E.; Hunter, A.; et al. The contribution of mitochondrial metagenomics to large-scale data mining and phylogenetic analysis of Coleoptera. Mol. Phylogenet. Evol. 2018, 128, 1–11. [Google Scholar] [CrossRef] [Green Version]
  37. Crampton-Platt1, A.; Timmermans, M.J.T.N.; Gimmel, M.L.; Kutty, S.N.; Cockerill, T.D.; Khen, C.V.; Vogler, A.P. Soup to tree: The phylogeny of beetles inferred by mitochondrial metagenomics of a Bornean rainforest sample. Mol. Biol. Evol. 2015, 32, 2302–2316. [Google Scholar] [CrossRef] [PubMed]
  38. Duquesne, V.; Delcont, A.; Huleux, A.; Beven, V.; Touzain, F.; Ribière-Chabert, M. Complete mitochondrial genome sequence of Aethina tumida (Coleoptera: Nitidulidae), a beekeeping pest. Genome Announc. 2017, 5. [Google Scholar] [CrossRef] [PubMed] [Green Version]
  39. Wu, Y.; Lan, Y.; Xia, L.; Cui, M.; Sun, W.; Dong, Z.; Cao, Y. The first complete mitochondrial genomes of two sibling species from Nitidulid beetles pests. Insects 2019, 11, 24. [Google Scholar] [CrossRef] [Green Version]
  40. Song, H.; Sheffield, N.C.; Cameron, S.L.; Miller, K.B.; Whiting, M.F. When phylogenetic assumptions are violated: Base compositional heterogeneity and among-site rate variation in beetle mitochondrial phylogenomics. Syst. Entomol. 2010, 35, 429–448. [Google Scholar] [CrossRef]
  41. Nguyen, L.T.; Schmidt, H.A.; von Haeseler, A.; Minh, B.Q. IQ-TREE: A fast and effective stochastic algorithm for estimating maximum-likelihood phylogenies. Mol. Biol. Evol. 2015, 32, 268–274. [Google Scholar] [CrossRef]
  42. Ronquist, F.; Teslenko, M.; van der Mark, P.; Ayres, D.L.; Darling, A.; Hohna, S.; Larget, B.; Liu, L.; Suchard, M.A.; Huelsenbeck, J.P. MrBayes 3.2: Efficient Bayesian phylogenetic inference and model choice across a large model space. Syst. Biol. 2012, 61, 539–542. [Google Scholar] [CrossRef] [PubMed] [Green Version]
  43. Ojala, D.; Montoya, J.; Attardi, G. tRNA punctuation model of RNA processing in human mitochondria. Nature 1981, 290, 470–474. [Google Scholar] [CrossRef] [PubMed]
  44. Crozier, R.H.; Crozier, Y.C. The mitochondrial genome of the honeybee Apis mellifera: Complete sequence and genome organization. Genet. Soc. Am. 1993, 133, 97–117. [Google Scholar]
  45. Shao, R.; Barker, S.C. The highly rearranged mitochondrial genome of the plague thrips, Thrips imaginis (Insecta: Thysanoptera): Convergence of two novel gene boundaries and an extraordinary arrangement of rRNA genes. Mol. Biol. Evol. 2003, 20, 362–370. [Google Scholar] [CrossRef] [Green Version]
  46. Zhang, S.K.; Shu, J.P.; Wang, Y.D.; Liu, Y.N.; Peng, H.; Zhang, W.; Wang, H.J. The complete mitochondrial genomes of two sibling species of camellia weevils (Coleoptera: Curculionidae) and patterns of Curculionini speciation. Sci. Rep. 2019, 9, 3412. [Google Scholar] [CrossRef]
  47. Yamauchi, M.M.; Miya, M.U.; Nishida, M. Use of a PCR-based approach for sequencing whole mitochondrial genomes of insects: Two examples (cockroach and dragonfly) based on the method developed for decapod crustaceans. Insect Mol. Biol. 2004, 13, 435–442. [Google Scholar] [CrossRef]
  48. Wang, Y.; Liu, X.; Yang, D. The first mitochondrial genome for caddisfly (Insecta: Trichoptera) with phylogenetic implications. Int. J. Biol. Sci. 2013, 10, 53–63. [Google Scholar] [CrossRef] [Green Version]
  49. Wang, J.J.; Li, D.F.; Li, H.; Yang, M.F.; Dai, R.H. Structural and phylogenetic implications of the complete mitochondrial genome of Ledra auditura. Sci. Rep. 2019, 9, 15746. [Google Scholar] [CrossRef]
  50. Zhang, D.X.; Szymura, J.M.; Hewitt, G.M. Evolution and structural conservation of the control region of insect mitochondrial DNA. J. Mol. Evol. 1995, 40, 382–391. [Google Scholar] [CrossRef]
  51. Zhang, D.X.; Hewitt, G.M. Insect mitochondrial control region: A review of its structure, evolution and usefulness in evolutionary studies. Biochem. Syst. Ecol. 1997, 25, 99–120. [Google Scholar] [CrossRef]
  52. Wolstenholme, D.R. Animal mitochondrial DNA: Structure and evolution. Int. Rev. Cytol. 1992, 141, 173–216. [Google Scholar]
  53. Boore, J.L. Animal mitochondrial genomes. Nucleic Acids Res. 1999, 27, 1767–1780. [Google Scholar] [CrossRef] [Green Version]
  54. Mardulyn, P.; Termonia, A.; Milinkovitch, M.C. Structure and evolution of the mitochondrial control region of leaf beetles (Coleoptera: Chrysomelidae): A hierarchical analysis of nucleotide sequence variation. J. Mol. Evol. 2003, 56, 38–45. [Google Scholar] [CrossRef]
Figure 1. Mitochondrial map of X. variegatus.
Insects 11 00779 g001
Figure 2. Mitochondrial map of Epuraea sp.
Insects 11 00779 g002
Figure 3. Relative synonymous codon usage (RSCU) of the mitochondrial DNA protein-coding genes (PCGs) of seven nitidulid species.
Insects 11 00779 g003
Figure 4. Inferred secondary structure for the tRNAs of X. variegatus.
Insects 11 00779 g004
Figure 5. Inferred secondary structure for the tRNAs of Epuraea sp.
Insects 11 00779 g005
Figure 6. Structures of AT-rich region in mitogenomes of Epuraea sp. and X. variegatus. The dark red ellipses are the tandem repeat regions, the blue blocks indicate non-repeat regions, the green circles are the poly-T stretches, and the purple circles are poly-C stretches.
Insects 11 00779 g006
Figure 7. Sliding window analyses of 13 PCGs among seven nitidulid mitogenomes. The red line shows the value of nucleotide diversity (Pi) in a sliding window analysis (a sliding window of 200 bp with the step size of 20 bp); the Pi value of each gene is shown under the gene name.
Insects 11 00779 g007
Figure 8. Genetic distance and non-synonymous (Ka) to synonymous (Ks) substitution rates of 13 PCGs among seven nitidulid species.
Insects 11 00779 g008
Figure 9. Phylogenetic tree produced from Maximum likelihood (ML) and Bayesian inference (BI) analyses based on PCG12R. The numbers on branches are bootstrap value (BS) and Bayesian posterior probabilities (PP).
Insects 11 00779 g009
Table 1. Summary of the mitogenomic sequence information used in the present study.
FamilySpeciesAccession NumberReference
SphindidaeAspidiphorus orbiculatusKT780625Unpublished
ErotylidaeLanguriidae sp.MG193464[36]
Erotylinae sp1MH836601[37]
Erotylinae sp2MH789736[37]
MonotomidaeMonotoma quadricollisKX035132Unpublished
Rhizophagus aeneusKX087340Unpublished
KateretidaeBrachypterolus vestitusKX087245Unpublished
NitidulidaeNitidulidae sp MH789742[37]
Aethina tumidaNC_036104[38]
XenostrongylusvariegatusMW044620This study
Epuraea guttataKX087289Unpublished
Carpophilus dimidiatusNC_046036[39]
Carpophilus pilosellusMN604383[39]
Epuraea sp.MW044619This study
SilvanidaeUleiota sp.KX035149Unpublished
CucujidaeCucujus clavipesGU176341[40]
Cucujus haematodesKX087268Unpublished
Table 2. Nucleotide composition of mitogenomes of X. variegatus and Epuraea sp.
RegionsSize (bp)T(U)CAGAT(%)GC(%)AT SkewGC Skew
X. variegatus
Full genome17,65737.81339.49.877.222.80.021−0.141
PCGs11,0464311.53411.57723−0.1160
1st codon position368237.210.735.117.172.327.8−0.0290.229
2nd codon position368247.317.721.613.468.931.1−0.374−0.136
3rd codon position368244.46.245.4489.810.20.012−0.207
tRNAs145438.6939.612.878.221.80.0130.174
rRNAs207942.86.638.512.181.318.7−0.0530.296
AT-rich region291040.213.534.411.974.625.4−0.078−0.064
Epuraea sp.
Full genome16,64138.814.437.69.376.423.7−0.015−0.216
PCGs11,09742.912.93212.274.925.1−0.146−0.026
1st codon position369936.711.934.41771.128.9−0.0320.179
2nd codon position369946.718.321.213.767.932−0.376−0.143
3rd codon position369945.28.540.3685.514.5−0.057−0.175
tRNAs144536.310.939.413.475.724.30.0410.103
rRNAs208141.96.936.914.478.821.3−0.0630.353
AT-rich region198453.812.128.85.282.617.3−0.302−0.397
Table 3. Nucleotide composition of the Nitidulidae mitochondrial genomes: E. guttata (E1), Epuraea sp. (E2), C. dimidiatus (C1), C. pilosellus (C2), Nitidulidae sp. (N), A. tumida (A), and X. variegatus (X).
SpeciesWhole GenomeAT SkewGC SkewPCGstRNAsrRNAsA + T-Rich Region
Size (bp)AT (%)Size (bp)AT (%)Size (bp)AT (%)Size (bp)AT (%)Size (bp)AT (%)
E116,02176.50.043−0.1911,07375.7145175.7208176.4--
E216,64176.4−0.015−0.21611,09774.9144575.8208178.8198482.6
C115,71775.20.038−0.20211,09474.5144174.9206175105783.6
C215,68677.20.027−0.17711,10376.5144276.5207977.594486.7
N17,43278.40.036−0.18311,09176.3144378.2207380.3--
A16,57676.90.034−0.22311,10975.4146077.2206479.5--
X17,65777.20.021−0.14111,04677145478.2207981.3291074.6
Table 4. Mitogenomic organization of X. variegatus and Epuraea sp.
Position Size (bp)Intergenic NucleotidesCodon Strand
FromTo StartStop
X. variegatus/E. sp.
trnI1/164/6364/63 +/+
trnQ62/61130/12969/69−3/−3 −/−
trnM131/129199/19769/69/−1 +/+
nad2200/1981174/1205975/1008 ATT/ATTTAA/TAA+/+
trnW1202/12141268/128067/6727/8 +/+
trnC1383/12841446/134564/62114/3 −/−
trnY1448/13461510/141063/651/ −/−
cox11503/14033042/29421540/1540−8/−8ATT/ATCT/T+/+
trnL23043/29433107/300765/65 +/+
cox23108/30083780/3695673/688 ATT/ATTT/T+/+
trnK3781/36963851/376571/70 +/+
trnD3855/37663924/383170/663/ +/+
atp83925/38324069/3987145/156 ATC/ATCT/TAG+/+
atp64076/39814747/4655672/6756/−7ATA/ATGTAA/TAA+/+
cox34747/46555533/5438787/784−1/−1ATG/ATGT/TAG+/+
trnG5534/54395597/550164/63 +/+
nad35604/55025951/5855348/3546/ATT/ATTTAG/T+/+
trnA5950/58546015/591766/64−2/−2 +/+
trnR6015/59186077/597963/62−1/ +/+
trnN6077/59806142/604666/67−1/ +/+
trnS16143/60476209/611367/67 +/+
trnE6210/61146273/617664/63 +/+
trnF6272/61756336/623965/65−2/−2 −/−
nad56337/62498053/79531717/1705 /9ATA/ATTT/TAG−/−
trnH8051/79548114/801864/65−3/ −/−
nad48112/80169444/93421333/1327−3/−3ATT/ATAT/T−/−
nad4L9435/93399722/9623288/285−10/−4ATG/ATGTAA/TAA−/−
trnT9725/96269789/968965/642/2 +/+
trnP9790/96909854/975565/66 −/−
nad69859/976010,359/10,263501/5044/4ATA/ATATAA/TAA+/+
cytb10,359/10,26311,498/11,4051140/1143−1/−1ATG/ATGTAG/TAG+/+
trnS211,497/11,40411,564/11,47168/68−2/−2 +/+
nad111,582/11,48912,514/12,421933/93317/17ATT/ATTTAG/TAG−/−
trnL112,534/12,44112,600/12,50567/6519/19 −/−
rrnL12,601/12,50613,891/13,8051291/1300 −/−
trnV13,892/13,80613,959/13,87568/70 −/−
rrnS13,960/13,87714,747/14,657788/781/1 −/−
AT-rich region14,748/14,65817,657/16,6412910/1984 +/+
Table 5. Start and stop codons of the mitochondrial genomes: E. guttata (E1), Epuraea sp. (E2), C. dimidiatus (C1), C. pilosellus (C2), Nitidulidae sp. (N), A. tumida (A), and X. variegatus (X).
GeneStart Codon/Stop Codon
E1E2C1C2NAX
nad2ATT/TAAATT/TAAATT/TAAATT/TAAATT/TATT/TAAATT/TAA
cox1ATT/TATC/TATT/TATT/TATT/TATA/TATT/T
cox2ATA/TATT/TATC/TATT/TATT/TAGATT/TATT/T
atp8ATT/TAGATC/TAGATC/TAGATC/TAGATG/TAAATT/TAGATC/T
atp6ATG/TAAATG/TAAATG/TAAATA/TAAATG/TAAATA/TAAATA/TAA
cox3ATG/TATG/TATG/TATG/TATT/TAAATG/TATG/T
nad3ATA/TAGATT/TAGATT/TAGATT/TAGATT/TAAATA/TAGATT/TAG
nad5ATA/TATT/TATT/TATT/TTAG/TAAATA/TATA/T
nad4ATG/TAAATA/TATG/TATG/TATG/TAAATG/TATT/T
nad4LATG/TAAATG/TAAATG/TAAATG/TAAATT/TAAATG/TAAATG/TAA
nad6ATC/TAAATA/TAAATA/TAAATA/TAAATG/TAGATA/TAAATA/TAA
CytbATA/TAGATG/TAGATG/TAGATG/TAGTTG/TAGATG/TAAATG/TAG
nad1AAC/ATCATT/TAGATA/TAGATG/TAGATT/TAATTG/TAGATT/TAG
Publisher’s Note: MDPI stays neutral with regard to jurisdictional claims in published maps and institutional affiliations.

