Genetic Diversity and Population Structure of Natural Lycorma delicatula (White) (Hemiptera: Fulgoridea) Populations in China as Revealed by Microsatellite and Mitochondrial Markers


Abstract
:
1. Introduction
2. Materials and Methods
2.1. Sample Collection and Experimental Analysis
2.2. Genetic Diversity Analyses
2.3. Haplotype Relationship Analyses
2.4. Population Genetic Structure Analyses
2.5. Historical Demography
3. Results
3.1. Genetic Diversity
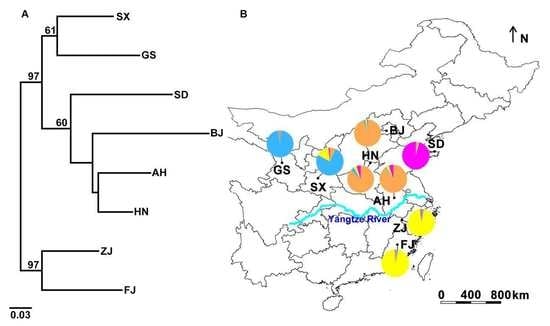
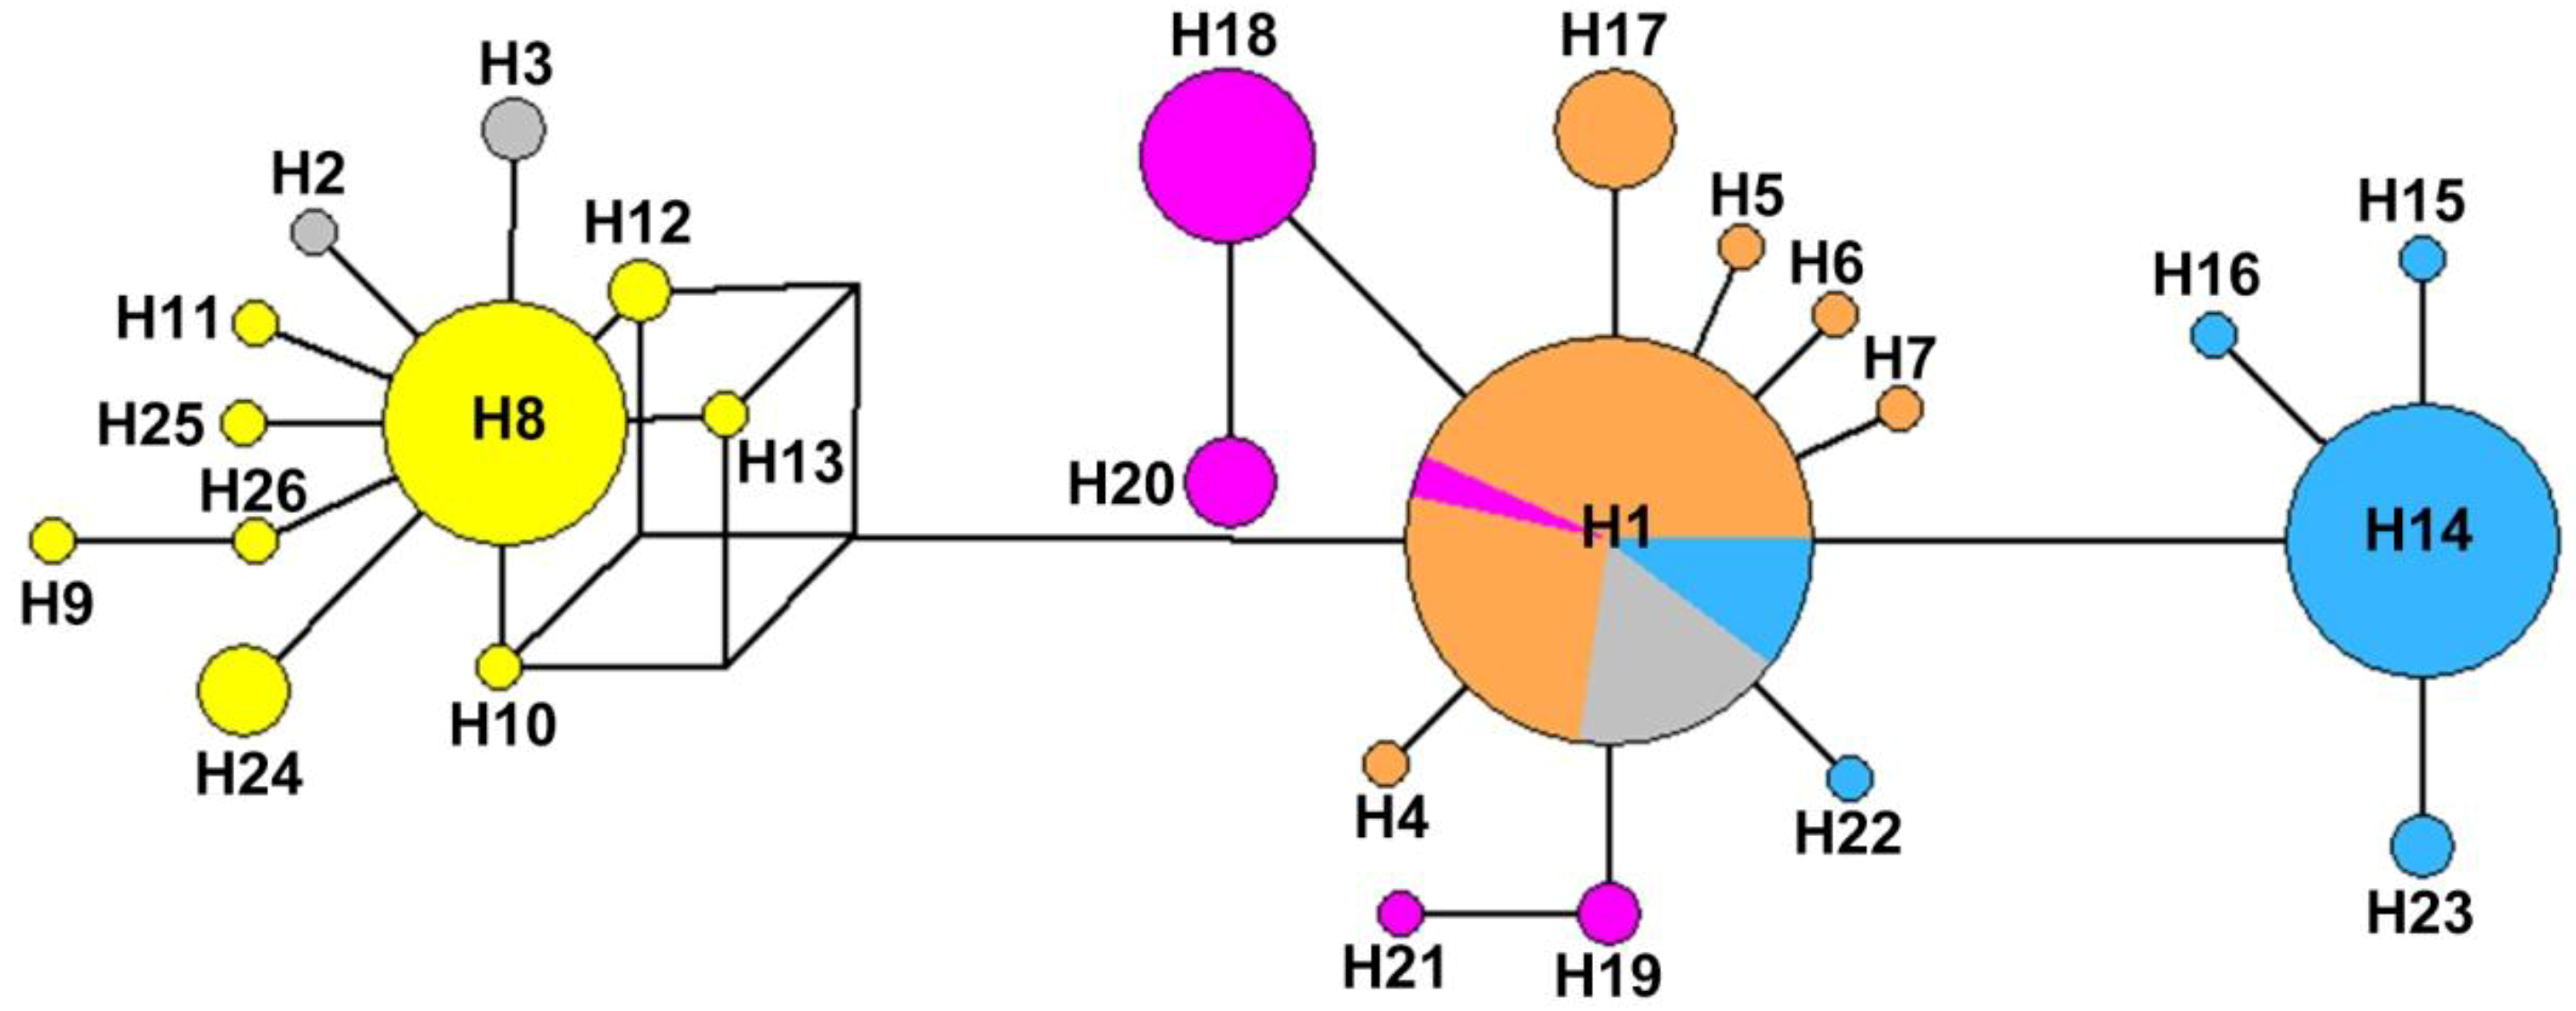
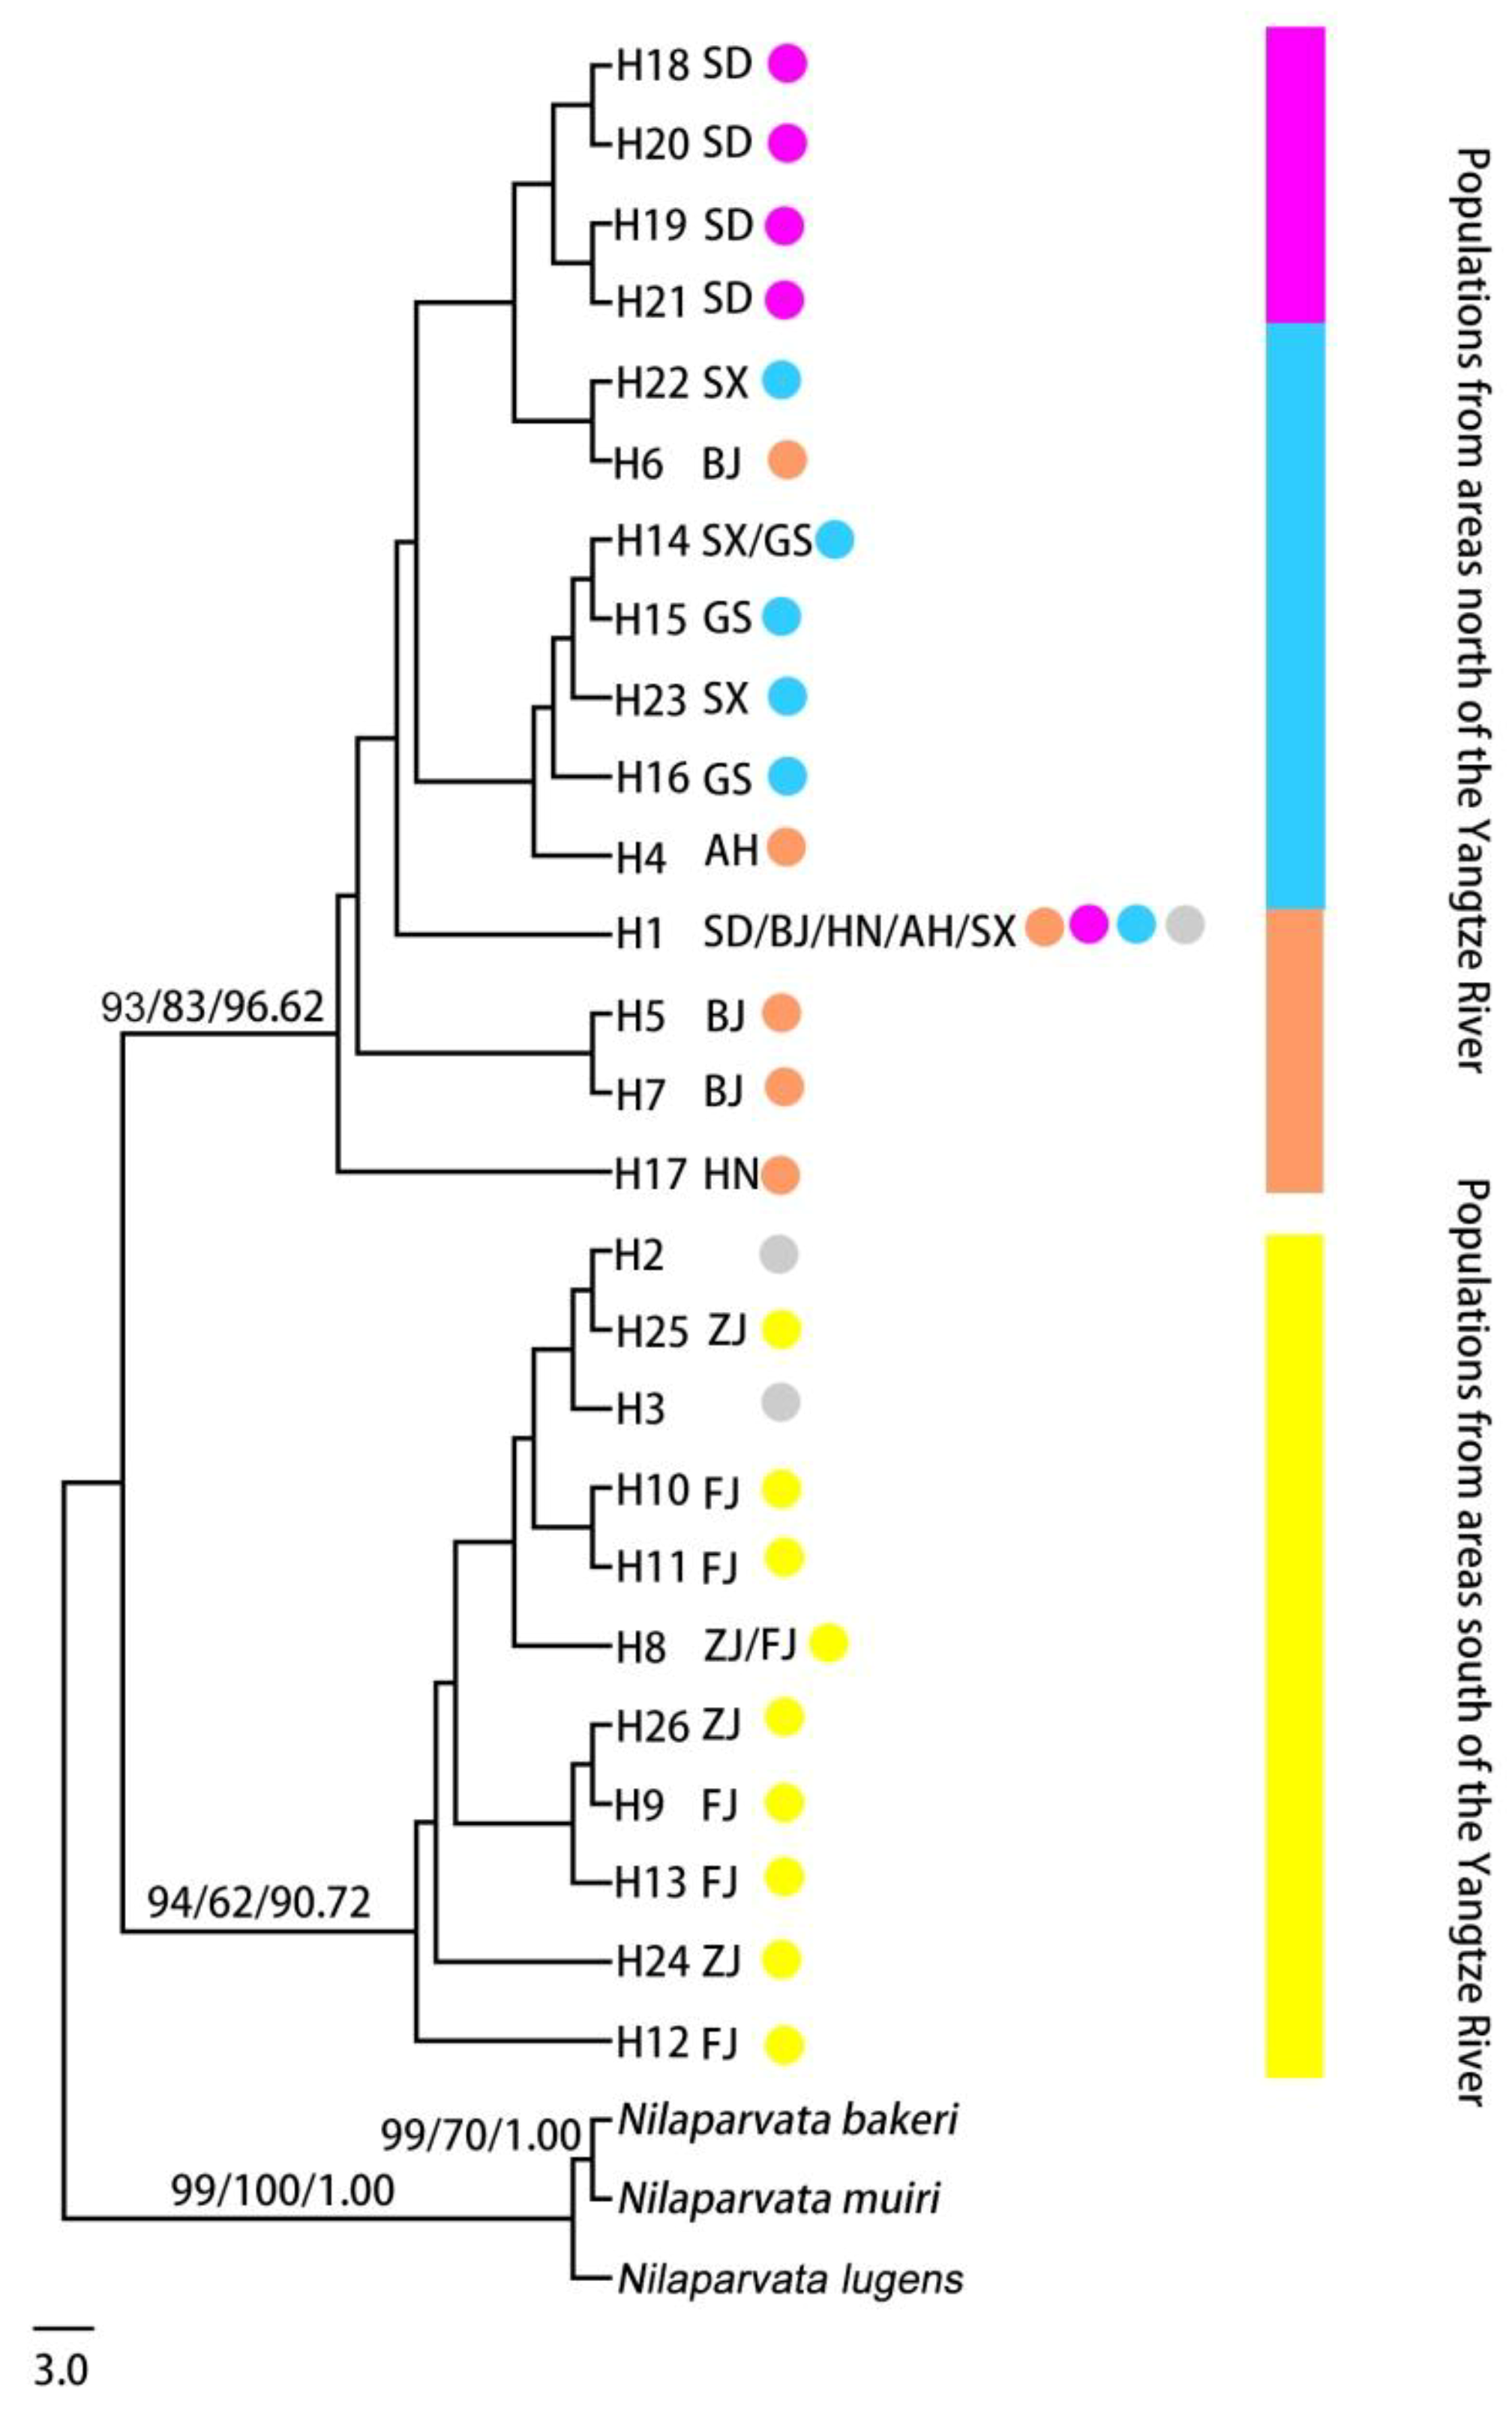
3.2. Genetic Structure and Haplotype Relationship
3.3. Genetic Connectivity
3.4. Historical Demography
4. Discussion
4.1. Genetic Diversity of L. delicatula Populations in China
4.2. Population Genetic Structure and Historical Demography
5. Conclusions
Supplementary Materials
Author Contributions
Funding
Acknowledgments
Conflicts of Interest
References
- White, A. Description of a new genus and some new species of homopterous insects from the East in the collections of British Museum. Ann. Mag. Nat. Hist. 1845, 15, 34–37. [Google Scholar] [CrossRef]
- Liu, G. Some extracts from the history of entomology in China. Psyche 1939, 46, 23–28. [Google Scholar] [CrossRef]
- Choi, J.; Ahn, M.Y.; Lee, Y.B.; Lyu, K.S. Materia Medica from Insectes; Shinil Books: Seoul, Korea, 2002. [Google Scholar]
- Stål, C. Beitrag zur Kenntnis der Fulgoriden. Entomologische Zeitung. Herausgegeben von dem entomologischen Vereine zu Stettin. Stettin 1863, 24, 230–251. [Google Scholar]
- Barringer, L.E.; Donovall, L.R.; Spichiger, S.E.; Lynch, D.; Henry, D. The first New World record of Lycorma delicatula (Insecta: Hemiptera: Fulgoridae). Entomol. News 2015, 125, 20–23. [Google Scholar] [CrossRef]
- Metcalf, Z.P. General Catalogue of the Homoptera; China, W.E., Ed.; Fascicle IV, Fulgoroidea, Part 9 Fulgoridae; Smith College: Northampton, MA, USA, 1947; p. 164. [Google Scholar]
- Distant, W.L. The Fauna of British India, Including Ceylon and Burma; Rhynchota-Vol. III. (Heteroptera-Homoptera); Birgham Lt Col C T: London, UK, 1906; p. 207. [Google Scholar]
- Pham, H.T. 2011 A Checklist of the Family Fulgoridae (Homoptera: Auchenorrhyncha: Fulgoroidea) from Vietnam. In Proceedings of the 3rd National Scientific Conference on Ecology and Biological Resources, Hanoi, Vietnam, 22 October 2009; p. 319. [Google Scholar]
- Kim, S.S.; Kim, T.W. Lycorma delicatula (White) (Hemiptera: Fulgoridae) in Korea. Lucanus 2005, 5, 9–10. [Google Scholar]
- Kim, H.; Kim, M.; Kwon, D.H.; Park, S.; Lee, Y.; Huang, J.; Kai, S.; Lee, S.H.; Hon, K.J.; Jang, Y.; et al. Molecular comparison of Lycorma delicatula (Hemiptera: Fulgoridae) isolates in Korea, China, and Japan. J. Asia Pac. Entomol. 2013, 16, 503–506. [Google Scholar] [CrossRef]
- Dara, S.K.; Barringer, L.; Arthurs, S.P. Lycorma delicatula (Hemiptera: Fulgoridae): A new invasive pest in the United States. J. Integ. Pest. Mngmt. 2015, 6, 20. [Google Scholar] [CrossRef]
- Bartlett, C.R.; O’Brien, L.B.; Wilson, S.W. A review of the planthoppers (Hemiptera: Fulgoroidea) of the United States. Mem. Am. Entomol. Soc. 2014, 50, 1–287. [Google Scholar]
- Bourgoin, T. FLOW (Fulgoromorpha Lists on the Web): A World Knowledge Base Dedicated to Fulgoromorpha, Version 8, Updated 31 May 2019. Available online: http://www.hemiptera-databases.org/flow/ (accessed on 31 May 2019).
- McKee, L.J. Stopping the Spotted Lanternfly. Wines & Vines. Available online: https://www.winesandvines.com/news/article/195627/Stopping-the-Spotted-Lanternfly (accessed on 12 February 2018).
- Zhang, Z.Z. Forest Insects; China Forestry Publishing House: Beijing, China, 1993; p. 164. [Google Scholar]
- Park, J.D.; Kim, M.Y.; Lee, S.G.; Shin, S.C.; Kim, J.H.; Park, I.K. Biological characteristics of Lycorma delicatula and the control effects of some insecticides. Korean J. Appl. Entomol. 2009, 48, 53–57. [Google Scholar] [CrossRef]
- Chou, I. A study on Lycorma delicatula White (Fulgoridae, Homoptera). Entomologia. Et. Ars. 1946, 1, 31–54. [Google Scholar]
- Han, J.M.; Kim, H.; Lim, E.J.; Lee, S.; Kwon, Y.J.; Cho, S. Lycorma delicatula (Hemiptera: Auchenorrhyncha: Fulgoridae: Aphaeninae) finally, but suddenly arrived in Korea. Entomol. Res. 2008, 38, 281–286. [Google Scholar] [CrossRef]
- Ding, J.; Wu, Y.; Zheng, H.; Fu, W.; Reardon, R.; Liu, M. Assessing potential biological control of the invasive plant, tree-of-heaven Ailanthus altissima. Biocontrol. Sci. Technol. 2006, 16, 547–566. [Google Scholar] [CrossRef]
- Lee, J.S.; Kim, I.K.; Koh, S.H.; Cho, S.J.; Jang, S.J.; Pyo, S.H.; Choi, W.I. Impact of minimum winter temperature on Lycorma delicatula (Hemiptera: Fulgoridae) egg mortality. J. Asia Pac. Entomol. 2011, 14, 123–125. [Google Scholar] [CrossRef]
- Lee, K.Y.; Kim, S.K.; Kim, I.H.; Kim, K.S. Seasonal occurrence of spot clothing wax cicada, Lycorma delicatula (Hemiptera: Fulgoridae) and it’s control efficacy using EFAM at the vineyards. Korean J. Pestic. Sci. 2011, 15, 303–309. [Google Scholar]
- Lee, J.E.; Moon, S.R.; Ahn, H.G.; Cho, S.R.; Yang, J.O.; Yoon, C.M.; Kim, G.H. Feeding behavior of Lycorma delicatula (Hemiptera: Fulgoridae) and response on feeding stimulants of some plants. Korean J. Appl. Entomol. 2009, 48, 467–477. [Google Scholar] [CrossRef]
- Shin, Y.H.; Moon, S.R.; Yoon, C.; Ahn, K.S.; Kim, G.H. Insecticidal activity of 26 insecticides against eggs and nymphs of Lycorma delicatula (Hemiptera: Fulgoridae). Korean J. Pestic. Sci. 2010, 14, 157–163. [Google Scholar]
- Kim, H.; Kim, M.; Kwon, D.H.; Park, S.; Lee, Y.; Jang, H.; Lee, S.; Lee, S.H.; Huang, J.; Hong, K.J.; et al. Development and characterization of 15 microsatellite loci from Lycorma delicatula (Hemiptera: Fulgoridae). Anim. Cells. Syst. 2011, 15, 295–300. [Google Scholar] [CrossRef]
- Park, M.; Kim, K.S.; Lee, J.H. Isolation and characterization of eight microsatellite loci from Lycorma delicatula (White) (Hemiptera: Fulgoridae) for population genetic analysis in Korea. Mol. Biol. Rep. 2012, 39, 5637–5641. [Google Scholar] [CrossRef] [PubMed]
- Park, M.; Kim, K.S.; Lee, J.H. Genetic structure of Lycorma delicatula (Hemiptera: Fulgoridae) populations in Korea: Implication for invasion processes in heterogeneous landscapes. Bull. Entomol. Res. 2013, 103, 414–424. [Google Scholar] [CrossRef]
- Xiao, G.R. China Forest Insects; China Forestry Publishing House: Beijing, China, 1992; pp. 169–171. [Google Scholar]
- Hua, L.Z. List of Chinese Insects; Zhongshan (Sun Yat-sen) University Press: Guangzhou, China, 2000; Volume 1, p. 445. [Google Scholar]
- Van Oosterhout, C.; Hutchinson, W.F.; Wills, D.P.M.; Shipley, P. Micro-checker: Software for identifying and correcting genotyping errors in microsatellite data. Mol. Ecol. Notes 2004, 4, 535–538. [Google Scholar] [CrossRef]
- Chapuis, M.P.; Estoup, A. Microsatellite null alleles and estimation of population differentiation. Mol. Biol. Evol. 2007, 24, 621–631. [Google Scholar] [CrossRef] [PubMed]
- Peakall, R.; Smouse, P.E. GenAlEx 6.5: Genetic analysis in Excel. Population genetic software for teaching and research—An update. Bioinformatics 2012, 28, 2537–2539. [Google Scholar] [CrossRef] [PubMed]
- Goudet, J. 2001 FSTAT, A Program to Estimate and Test Gene Diversities and Fixation Indices, Version 2.9.3. Available online: http://www2.unil.ch/popgen/softwares/fstat.htm (accessed on 6 April 2006).
- Kalinowski, S.T.; Taper, M.L.; Marshall, T.C. Revising how the computer program CERVUS accommodates genotyping error increases success in paternity assignment. Mol. Ecol. 2007, 16, 1099–1106. [Google Scholar] [CrossRef] [PubMed]
- Rousset, F. Genepop’007: A complete re-implementation of the genepop software for Windows and Linux. Mol. Ecol. Resour. 2008, 8, 103–106. [Google Scholar] [CrossRef] [PubMed]
- Rice, W.R. Analyzing tables of statistical tests. Evolution 1989, 43, 223–225. [Google Scholar] [CrossRef] [PubMed]
- Thompson, J.D.; Gibson, T.J.; Plewniak, F.; Higgins, D.G. The Clustal X-windows interface: Flexible strategies for multiple sequence alignment aided by quality analysis tools. Nucleic. Acids. Res. 1997, 25, 4876–4882. [Google Scholar] [CrossRef] [PubMed]
- Tamura, K.; Stecher, G.; Peterson, D.; Filipski, A.; Kumar, S. MEGA6: Molecular Evolutionary Genetics Analysis version 6.0. Mol. Biol. Evol. 2013, 30, 2725–2729. [Google Scholar] [CrossRef] [PubMed]
- Nei, M. Molecular Evolutionary Genetics; Columbia University Press: New York, NY, USA, 1987. [Google Scholar]
- Librado, P.; Rozas, J. DnaSP v5: A software for comprehensive analysis of DNA polymorphism data. Bioinformatics 2009, 25, 1451–1452. [Google Scholar] [CrossRef]
- Bandelt, H.J.; Forster, P.; Röhl, A. Median-joining networks for inferring intraspecific phylogenies. Mol. Biol. Evol. 1999, 16, 37–48. [Google Scholar] [CrossRef]
- Zhang, D.; Gao, F.; Li, W.X.; Jakovlić, I.; Zou, H.; Zhang, J.; Wang, G.T. PhyloSuite: An integrated and scalable desktop platform for streamlined molecular sequence data management and evolutionary phylogenetics studies. bioRxiv 2018. [CrossRef]
- Nguyen, L.T.; Schmidt, H.A.; von Haeseler, A.; Minh, B.Q. IQ-TREE: A fast and effective stochastic algorithm for estimating maximum-likelihood phylogenies. Mol. Biol. Evol. 2015, 32, 268–274. [Google Scholar] [CrossRef] [PubMed]
- Ronquist, F.; Teslenko, M.; van der Mark, P.; Ayres, D.L.; Darling, A.; Höhna, S.; Larget, B.; Liu, L.; Suchard, M.A.; Huelsenbeck, J.P. MrBayes 3.2: Efficient Bayesian phylogenetic inference and model choice across a large model space. Syst. Biol. 2012, 61, 539–542. [Google Scholar] [CrossRef] [PubMed]
- Takezaki, N.; Nei, M.; Tamura, K. POPTREE2: Software for constructing population trees from allele frequency data and computing other population statistics with windows interface. Mol. Biol. Evol. 2010, 27, 747–752. [Google Scholar] [CrossRef] [PubMed]
- Nei, M.; Tajima, F.; Tateno, Y. Accuracy of estimated phylogenetic trees from molecular data. J. Mol. Evol. 1983, 19, 153–170. [Google Scholar] [CrossRef] [PubMed]
- Pritchard, J.K.; Stephens, M.; Donnelly, P. Inference of population structure using multilocus genotype data. Genetics 2000, 155, 945–959. [Google Scholar] [PubMed]
- Hubisz, M.J.; Falush, D.; Stephens, M.; Pritchard, J.K. Inferring weak population structure with the assistance of sample group information. Mol. Ecol. Notes 2009, 9, 1322–1332. [Google Scholar] [CrossRef] [PubMed] [Green Version]
- Earl, D.A.; VonHoldt, B.M. Structure Harvester: A website and program for visualizing Structure output and implementing the Evanno method. Conserv. Genet. Resour. 2012, 4, 359–361. [Google Scholar] [CrossRef]
- Evanno, G.; Regnaut, S.; Goudet, J. Detecting the number of clusters of individuals using the software structure: A simulation study. Mol. Ecol. 2005, 14, 2611–2620. [Google Scholar] [CrossRef]
- Jakobsson, M.; Rosenberg, N.A. CLUMPP: A cluster matching and permutation program for dealing with label switching and multimodality in analysis of population structure. Bioinformatics 2007, 23, 1801–1806. [Google Scholar] [CrossRef]
- Rosenberg, N.A. Distruct: A program for the graphical display of population structure. Mol. Ecol. Notes 2004, 4, 137–138. [Google Scholar] [CrossRef]
- Excoffier, L.; Lischer, H.E. Arlequin suite ver. 3.5: A new series of programs to perform population genetics analyses under Linux and Windows. Mol. Ecol. Resour. 2010, 10, 564–567. [Google Scholar] [CrossRef]
- Mantel, N. The detection of disease clustering and a generalized regression approach. Cancer Res. 1967, 27, 209–220. [Google Scholar]
- Bohonak, A. IBD (isolation by distance): A program for analyses of isolation by distance. J. Hered. 2002, 93, 153–154. [Google Scholar] [CrossRef]
- Jensen, J.L.; Bohonak, A.J.; Kelley, S.T. Isolation by distance, web service. BMC Genet. 2005, 6, 13. [Google Scholar] [CrossRef]
- Excoffier, L.; Lischer, H. Arlequin (version 3.5): An integrated software package for population genetics data analysis. Swiss Inst. Bioinform. Online 2015, 1, 86–95. Available online: http://cmpg.unibe.ch/software/arlequin35 (accessed on 30 April 2015).
- Beerli, P.; Felsenstein, J. Maximum likelihood estimation of a migration matrix and effective population sizes in n subpopulations by using a coalescent approach. Proc. Natl. Acad. Sci. USA 2001, 98, 4563–4568. [Google Scholar] [CrossRef]
- Cornuet, J.M.; Luikart, G. Description and power analysis of two tests for detecting recent population bottlenecks from allele frequency data. Genetics 1996, 144, 2001–2014. [Google Scholar]
- Piry, S.; Luikart, G.; Cornuet, J.M. Bottleneck: A computer program for detecting recent reductions in the effective population size using allele frequency data. J. Hered. 1999, 90, 502–503. [Google Scholar] [CrossRef]
- Luikart, G.; Allendorf, F.W.; Cornuet, J.M.; Sherwin, W.B. Distortion of allele frequency distributions provides a test for recent population bottlenecks. Heredity 1998, 89, 238–247. [Google Scholar] [CrossRef]
- Tajima, F. Statistical method for testing the neutral mutation hypothesis by polymorphism. Genetics 1989, 123, 585–595. [Google Scholar]
- Fu, Y. Statistical tests of neutrality of mutations against population growth, hitchhiking and background selection. Genetics 1997, 147, 915–925. [Google Scholar]
- Botstein, D.; White, R.L.; Skolnick, M.; Davis, R.W. Construction of a genetic linkage map in man using restriction fragment length polymorphisms. Am. J. Hum. Genet. 1980, 32, 314–331. [Google Scholar]
- Wright, S. Evolution and the Genetics of Populations, Volume 4: Variability within and among Natural Populations; University of Chicago Press: Chicago, IL, USA, 1978. [Google Scholar]


| Collecting Locality | Code of Specimens | Latitude (N)/Longitude (E) | Collecting Dates | |
|---|---|---|---|---|
| North China | Weihai, Shandong | SD | 37.50/122.12 | October 2016 |
| Beijing | BJ | 39.96/116.33 | October 2016 | |
| Anyang, Henan | HN | 36.10/114.39 | October 2016 | |
| Yangling, Shaanxi | SX | 34.25/108.08 | October 2016 | |
| Lanzhou, Gansu | GS | 36.10/103.71 | August 2017 | |
| South China | Hefei, Anhui | AH | 31.86/117.25 | July 2017 |
| Quzhou, Zhejiang | ZJ | 29.25/118.11 | August 2017 | |
| Shanming, Fujian | FJ | 26.26/117.63 | July 2017 | |
| Pop | Microsatellite Markers | mtDNA | |||||||||
|---|---|---|---|---|---|---|---|---|---|---|---|
| n | Na | Ne | Ar | Ho | He | n | Nh | Hd | π (%) | k | |
| SD | 24 | 4.2 | 2.56 | 3.94 | 0.536 | 0.511 | 24 | 4 | 0.634 | 0.112 | 0.993 |
| BJ | 24 | 5.2 | 2.78 | 4.57 | 0.561 | 0.557 | 24 | 4 | 0.239 | 0.028 | 0.250 |
| HN | 25 | 5.5 | 2.55 | 4.75 | 0.525 | 0.547 | 24 | 2 | 0.431 | 0.048 | 0.431 |
| AH | 24 | 4.4 | 2.39 | 4.03 | 0.587 | 0.565 | 24 | 2 | 0.083 | 0.009 | 0.083 |
| SX | 24 | 6.8 | 3.79 | 6.03 | 0.612 | 0.623 | 24 | 3 | 0.627 | 0.084 | 0.750 |
| GS | 24 | 5.9 | 3.33 | 5.42 | 0.630 | 0.643 | 24 | 2 | 0.163 | 0.019 | 0.167 |
| ZJ | 22 | 7.7 | 4.19 | 6.99 | 0.675 | 0.670 | 22 | 3 | 0.455 | 0.093 | 0.494 |
| FJ | 16 | 7.2 | 3.91 | 7.23 | 0.572 | 0.628 | 17 | 4 | 0.588 | 0.104 | 0.926 |
| China | 7 | 3 | 0.667 | 0.728 | 6.476 | ||||||
| Japan | 1 | 1 | |||||||||
| South Korea | 10 | 1 | |||||||||
| Populations | SD | BJ | HN | AH | SX | GS | ZJ | FJ |
|---|---|---|---|---|---|---|---|---|
| SD | 0.0000 | 0.4858 | 0.4822 | 0.5217 | 0.5137 | 0.7320 | 0.9336 | 0.9125 |
| BJ | 0.2583 | 0.0000 | 0.1826 | 0.0001 | 0.4000 | 0.8276 | 0.9648 | 0.9473 |
| HN | 0.1578 | 0.1243 | 0.0000 | 0.2283 | 0.4094 | 0.7826 | 0.9564 | 0.9378 |
| AH | 0.1610 | 0.1272 | 0.0419 | 0.0000 | 0.4444 | 0.8889 | 0.9729 | 0.9567 |
| SX | 0.1819 | 0.1277 | 0.1048 | 0.1152 | 0.0000 | 0.2667 | 0.9429 | 0.9227 |
| GS | 0.1998 | 0.1443 | 0.1359 | 0.1419 | 0.0701 | 0.0000 | 0.9716 | 0.9564 |
| ZJ | 0.1577 | 0.2064 | 0.1577 | 0.1460 | 0.0856 | 0.1144 | 0.0000 | 0.0435 |
| FJ | 0.1910 | 0.2218 | 0.1791 | 0.1623 | 0.0919 | 0.1559 | 0.0322 | 0.0000 |
| Markers | Source of Variation | d.f. | Sum of Squares | Variance Components | Percentage Variation | Fixation Indices |
|---|---|---|---|---|---|---|
| Microsatellite markers | Among clusters | 3 | 156.846 | 0.3895 Va | 8.64 | FCT = 0.0864 |
| p < 0.0001 | ||||||
| Among populations within g clusters | 4 | 73.649 | 0.3205 Vb | 7.11 | FSC = 0.0778 | |
| p < 0.0001 | ||||||
| Within populations | 358 | 1359.953 | 3.7988 Vc | 84.25 | FST = 0.1575 | |
| p < 0.0001 | ||||||
| mtDNA | Among clusters | 3 | 43.344 | 0.24768 Va | 8.75 | FCT = 0.9125 |
| p < 0.0001 | ||||||
| Among populations within clusters | 4 | 4.339 | 0.03672 Vb | 1.30 | FSC = 0.1291 | |
| p < 0.0001 | ||||||
| Within populations | 175 | 355.815 | 2.45459 Vc | 89.95 | FST = 0.8995 | |
| p < 0.0001 |
© 2019 by the authors. Licensee MDPI, Basel, Switzerland. This article is an open access article distributed under the terms and conditions of the Creative Commons Attribution (CC BY) license (http://creativecommons.org/licenses/by/4.0/).
Share and Cite
Zhang, L.; Zhao, W.; Wang, F.; Qin, D. Genetic Diversity and Population Structure of Natural Lycorma delicatula (White) (Hemiptera: Fulgoridea) Populations in China as Revealed by Microsatellite and Mitochondrial Markers. Insects 2019, 10, 312. https://doi.org/10.3390/insects10100312
Zhang L, Zhao W, Wang F, Qin D. Genetic Diversity and Population Structure of Natural Lycorma delicatula (White) (Hemiptera: Fulgoridea) Populations in China as Revealed by Microsatellite and Mitochondrial Markers. Insects. 2019; 10(10):312. https://doi.org/10.3390/insects10100312
Chicago/Turabian StyleZhang, Li, Wenhui Zhao, Fuping Wang, and Daozheng Qin. 2019. "Genetic Diversity and Population Structure of Natural Lycorma delicatula (White) (Hemiptera: Fulgoridea) Populations in China as Revealed by Microsatellite and Mitochondrial Markers" Insects 10, no. 10: 312. https://doi.org/10.3390/insects10100312