1. Introduction
The piston rings have the functions of creating a seal between the cylinder chamber and the engine crankcase, controlling the amount of engine oil, and facilitating the heat transfer processes in the piston. The interaction between the piston rings and the cylinder liner in internal combustion engines is one of the processes of great relevance for the proper functioning of the engine since this has an effect on oil consumption, fuel consumption, losses due to friction, polluting emissions and performance [
1,
2,
3,
4,
5]. According to the investigations carried out, the losses due to the friction between the contact of the piston rings and the cylinder chamber represent between 26%–49% of the total losses [
6,
7,
8,
9].
Improving the tribological performance between the cylinder liner and the compression ring implies a reduction in economic losses since it prolongs the useful life and improves the economy of the engine [
10,
11]. According to reports developed by the Department of Energy (USA), reducing wear on engine parts and reducing friction would save 120 billion each year [
12]. Furthermore, an increase in tribological performance improves fuel economy, a reduction in the consumption of lubricating oil, greater braking power, a decrease in emissions, and a reduction in the need for maintenance [
13]. Nasaka’s research [
14] reports that fuel consumption can be reduced by 1.5% by decreasing losses from mechanical friction. Due to this condition, the researchers have focused their efforts on quantifying the influence of the piston ring-cylinder liner interaction.
Analysis of tribological in the first piston ring requires a simultaneous study of several types of variables, including transient lubrication, surface topography, ring dynamics, and flow rate gases (blow-by). Each of these variables presents interactions with each other, which makes it a highly complex analysis. Much of the research carried out on the topic of tribological phenomena covers the study of only certain parameters. Furuhama [
15] carried out the first investigations focused on the compression ring lining. Subsequently, Furuhama and Sasaki [
16] studied the effect of friction on the piston for small engines. Jeng [
17] investigated the lubrication conditions in the compression ring using the Reynolds lubrication theory on the contact surface. Ma et al. [
18] analyzed the behavior of lubrication in the ring using an oil transport model. The results obtained indicate that the movement of the ring and the cylinder liner surface significantly influence the tribological performance of the ring-piston assembly. Tian [
19], investigated ring dynamics by combining experimental and numerical methodology, with the aim of evaluating the torsion and wear of the ring liner. Additionally, he analyzed the changes that occur in the lubrication oil film. Akalin et al. [
20] studied the condition of the mixed regime of lubrication in the compression ring by applying the Reynolds equations.
Various experimental investigations have been carried out to analyze the performance of piston rings. Mufti et al. [
21] analyzed the friction in the piston of a gasoline engine under real operating conditions. Cheng et al. [
22] carried out a simulation model to study the friction between the ring and the piston. In addition, they analyzed the formability of the ring and the thermal effects. Kirner et al. [
23] examined the secondary movement of the piston and the change in film thickness of the lubricating oil.
The tribology analysis has allowed improving the performance of the engines, which is a consequence of the studies related to lubrication, type of materials, advanced coatings, surface geometry, among others. In the case of the friction developed in the piston rings and the cylinder liner, numerous tribology studies have been carried out focused on the textures of the surfaces, coatings, and types of lubrication oils [
24,
25], which have allowed mitigating the effects of wear and friction.
Other types of research focus on understanding the variables that influence the movement of the piston ring through experimental and numerical studies. Chaudhari and Sutaria [
26] studied the tribological characteristics of the properties of the friction forces obtained using a numerical model. Gopi et al. [
27] conducted a simulation investigation to determine the thermal and structural stress of the piston rings. Kashyap et al. [
28] proposed three different piston ring designs for the analysis of piston stresses and displacement. Ahmed Ali et al. [
29] investigated the tribological properties of the ring-piston assembly by applying nanoparticle additives in the lubricant. The results indicate a reduction in power losses and in the friction coefficient. Turnbull et al. [
30], made a comparison of different mathematical models for the compression ring, involving the dynamics of the flexible ring and the dynamics of the rigid ring body. Ali et al. [
31] investigated the effect of piston ring on tribological characteristics that affect the efficiency of engines. The study is carried out using simulation software. The results obtained indicate that the engine operating conditions and the viscosity of the lubricating oil significantly influence the thickness of the oil film and the hydrodynamic friction of the interaction between the rings and the cylinder liner. Soderfjall et al. [
32] performed a numerical simulation model to forecast tribological properties in a heavy-duty diesel engine.
Previous studies show that analyzes of wear and friction of the piston-liner ring contact are frequently analyzed by optimizing surface typography [
33,
34,
35], lubrication regime [
36,
37], lubrication properties and mathematical models to describe the interactions of the friction process. However, the influence of the geometric profile of the piston rings is an analysis parameter that has not been studied exhaustively in the literature. In general, the study of the effects of lubrication on the compression ring when making geometric changes and how to optimize the ring geometry has not been broadly covered. An improvement in the geometric shape of the piston ring would reduce the phenomena of friction between the ring and the piston sleeve, which would reduce power losses in the engine [
38,
39,
40,
41,
42].
Due to the above, the present study aims to evaluate the influence of the geometric profile of the compression ring on the tribological properties of the lubricant, which include friction forces, the thickness of the lubrication film, pressure, and power losses. Additionally, the effect of engine operating conditions on ring lubrication is analyzed. The developed calculations are carried out by means of a simulation model using OpenFOAM® software. For the study, the geometry of the combustion-piston chamber of a single-cylinder diesel engine is used. In addition, different tests are carried out on the engine with a rotation speed of 3000, 3300, 3600, and 3900 rpm, and a load of 1.5, 3, 4.5, and 6 N. The above, to define the conditions in the combustion chamber, which will be used in the simulation model.
2. Simulation Methodology
The analysis of the tribological performance in the compression ring was developed using simulation software. For this, a two-dimensional CFD model was performed, which involves the characteristics present in the piston-combustion chamber system. The 2D-CFD analysis consists of a cut through the piston geometry. In this way, the number of cells necessary to describe the regions and flows of interest in the study is minimized. This allows for reducing the economic cost of computing and simulation times. Despite the simplification of the 2D model compared to the 3D, the investigations Oliva et al. [
43,
44] indicate that 2D simulations adequately represent the physical behavior of fluids.
2.1. CFD Model Fundamentals
The basic equations for describing fluid mechanics in the CFD model consist of the conservation of mass, momentum, and energy. Considering an infinitesimal volume in equilibrium, each of the above equations can be described as shown below.
Conservation of mass implies that changes in mass with respect to time remain the same as changes in mass flow undergone by a control volume [
45].
The moment conservation equation is described by Equation (2). This equation defines that the change in a moment with respect to time is equal to the forces that the control volume is supporting.
Energy conservation implies that the energy variation with respect to time is equal to the work done on the control volume, as indicated in Equation (3).
Since lubricating oil and flue gases coexist in the piston ring simulation, a multiphase flow approach needs to be considered. Therefore, each of the conservation equations is defined in terms of the volume fraction of each phase (
). By including the term volume fraction, the above equations are expanded as follows:
These equations are discretized in the simulation software using the finite volume method, to form a system of linear equations and obtain the respective numerical solutions [
46].
2.2. CAD Geometric Model
To develop the CFD model, the geometric characteristics of the piston of a single-cylinder diesel engine were taken as a basis. The main parameters for the construction of the CAD are shown in
Table 1.
Figure 1 shows the cross-section of the piston and its respective rings. The compression ring (first ring) has a geometric profile in the form of a barrel curve, which can be modeled as a second-degree polygon. The second ring features a tapered face profile, and the lubricant control ring (third ring) has a beveled edge profile.
To analyze the influence of the geometric profile of the compression ring, four variations are made in the geometric profile. Each of these profiles is described in
Table 2. The second and third ring profiles remain unchanged.
Figure 2 shows the geometric shape of each of the compression ring profiles.
2.3. CFD Meshing and Boundary Conditions
OpenFOAM
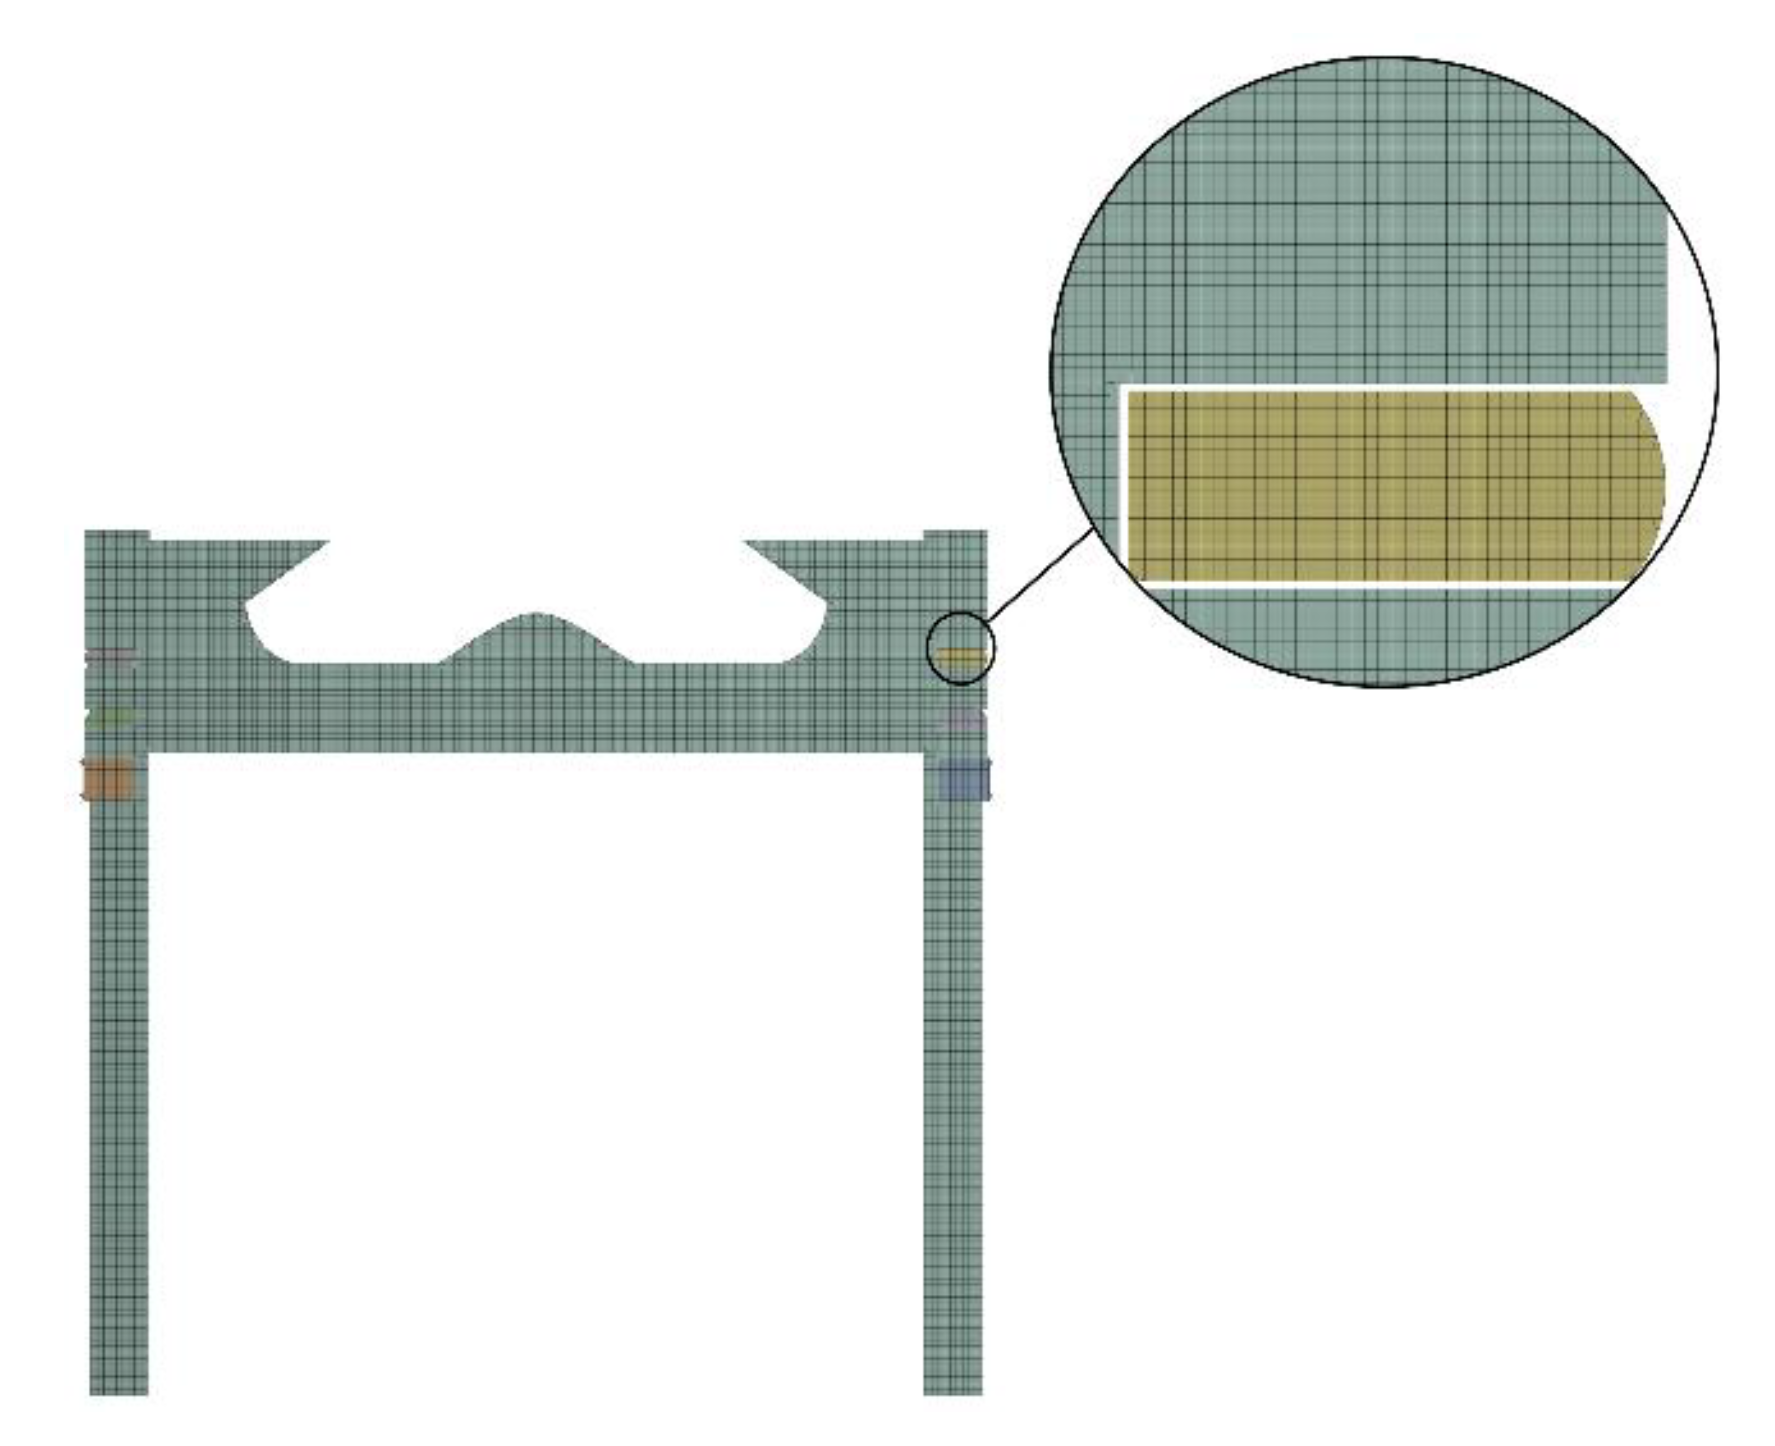
® simulation software is used for CFD simulations. The SALOME software was used to build the mesh. The developed mesh is made up of 823,156 elements. The geometry and the meshing done are shown in
Figure 3.
The development of the mesh for the CFD model aims to obtain a convergent and precise solution, maintaining a considerable calculation time. The type of mesh chosen is orthogonal since this facilitates the convergence of the results and adequately represents the movement of the mesh [
23].
The domain of the CFD model is limited by the surface of the piston, the cylinder liner and the surface of the rings. The domain also includes the combustion chamber and the area of the crankcase in which the piston performs its movement.
For the boundary conditions, the pressure data in the cylinder chamber, the mass flow formed by the fuel-air mixture, and the average temperature of the combustion chamber were used, which is calculated by means of the analysis proposed by Lejsek et al. [
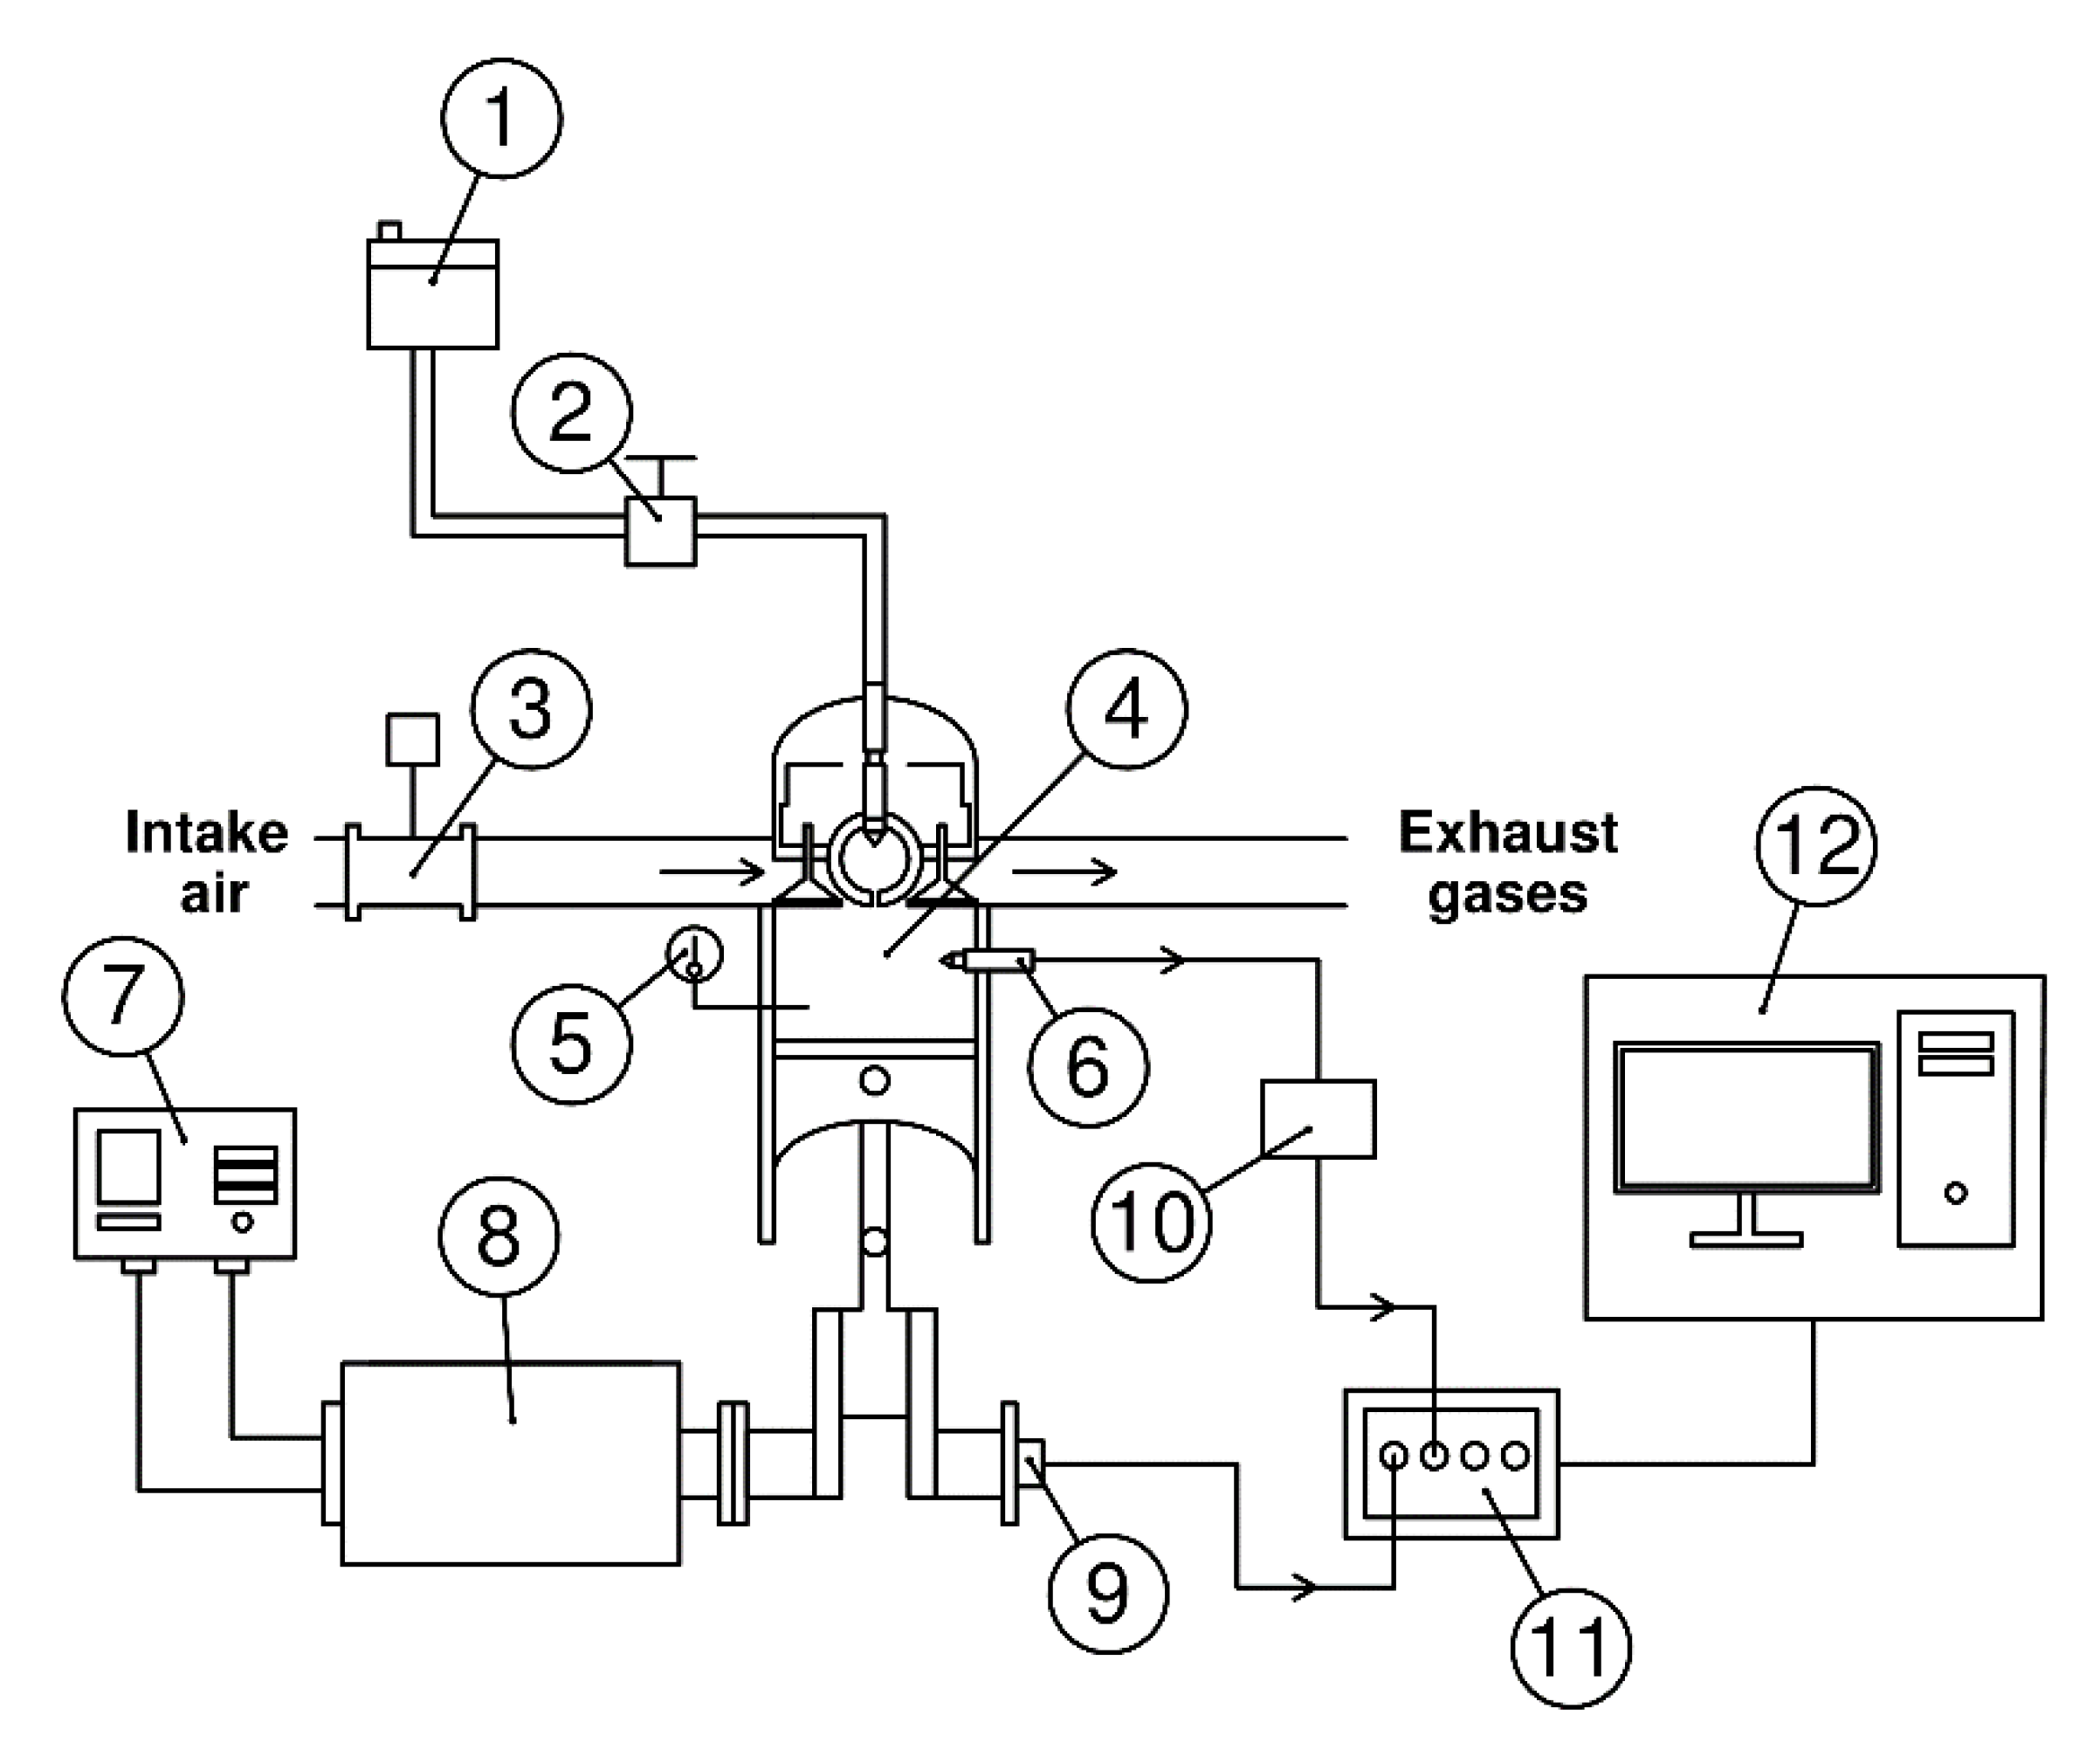
47]. The above variables are entered into the CFD model as input conditions. The pressure in the crankcase is established as the outlet condition. The data used to establish the conditions in the CFD model is obtained through experimental tests carried out on the stationary diesel engine. The experimental setup scheme is shown in
Figure 4.
The diesel engine is connected to a dynamometer, which is used to establish the different conditions of load and speed of rotation of the engine. A crankshaft angle sensor (Beck Arnley 180-0420) is used to measure the engine rotation speed. Piezoelectric sensors (KISTLER type 7063-A) were installed to measure the pressure in the combustion chamber and in the engine crankcase. To measure the fuel mass flow, a gravimetric meter (OHAUS PA313) was used. The intake airflow measurement is performed using a hot wire type mediator (BOSCH 22680 7J600). The temperatures inside the chamber are measured by means of type K thermocouples.
Because experimental tests are subject to uncertainties and errors [
48], each test condition is repeated three times to ensure the reliability of the experimental data that will be used in the CFD model. To calculate the uncertainty, Equation (7) is used.
where
and
are the uncertainty of the independent variables.
Table 3 shows the technical characteristics of the measurement equipment used and the associated uncertainty.
2.4. Models Applied to CFD Analysis
To complete the analysis by CFD, it is necessary to define models that allow describing the kinematics of the piston, the change in the properties of the lubricant with respect to its surrounding conditions, the dynamics of the compression ring and the flow of combustion gases passing through the ring. Each of these models is described below.
2.4.1. Piston Kinematics
To realistically guarantee the behavior of the compression ring, it is necessary to consider the real movement of the piston in the CFD simulation. The velocity and acceleration of the piston are described according to the angle of the crankshaft as follows:
To analyze the kinematic movement of the piston, the system (crankshaft-connecting rod-piston) is considered as a sliding mechanism [
49]. The description of the mechanism used is shown in
Figure 5.
Applying a complex algebraic analysis, the velocity
and acceleration
experienced by the piston are determined by solving the following equations:
where
,
, and
is the crankshaft arm length, the connecting rod length, and the piston velocity.
is the angle between the axis of movement of the piston and the connecting rod [
50]. For the calculation of
the following equation was used:
By solving the systems of Equations (8) and (9), the velocity and acceleration of the connecting rod are obtained, and therefore the velocity and acceleration of the piston as a function of the angle of the crankshaft.
2.4.2. Lubricant Properties Model
The CFD model simulation involves lubricating oil in the compression ring. Therefore, the model defines two phases in the ring, air, and oil. The distribution for the start of the simulation was stable as 90% lubricating oil and 10% air. The initial value of the thickness of the lubrication film is established at 5 μm, which has as reference the empirical work developed by Lyubarskyy et al. [
51]. The lubricating oil used in the CFD model is SAE 15W-40 oil. The properties of the lubricating oil are shown in
Table 4.
The density and dynamic viscosity of the lubricant depends on the temperature
and pressure
conditions. To account for this variation in lubricant density, Equation (11) is used [
52,
53].
where
and
are the coefficient of thermal expansion of the lubricant and the density at atmospheric conditions. In the case of dynamic viscosity, the variation is determined by Equation (12) [
54,
55].
where
,
and
are the dynamic viscosity of the lubricant under atmospheric conditions, lubricant piezo-viscosity, and thermo-viscosity indices. The last two parameters are calculated using Equations (13) and (14).
where
and
are thermo-viscosity coefficients and atmospheric piezo-viscosity.
To find the pressure of the lubrication film, a division of the lubrication profile can be made in 4 coordinates identified as x1, x2, x3, and x4 (see
Figure 6a), which correspond to the inlet, cavitation limit, reformation boundary, and outlet. The cavitation region is located between x2 and x3.
The hydrodynamic pressure at the inlet (coordinate x1) can be calculated using the following equation:
where
,
and
are determined as:
In Equation (5) it is necessary to determine the integration constants C1 and C2, and the location of the cavitation region x2 and x3.
The constants C1 and C2 can be found applying the following considerations:
The conditions at location x3 are determined considering the continuity of the flow and the limit pressure conditions at the edge of the ring. Therefore, the pressure in the cavitation region can be expressed as:
where
is the pressure at location x3 and x4. By integrating Equation (21) can calculate the integration constant and the location of reformation (x3):
By knowing the integration constants and the location of the cavitation limits, it is possible to determine the pressure of the lubrication film.
2.4.3. Compression Ring Kinetic Relationships
To consider the movement of the compression ring due to the forces it is supporting, and it is necessary to establish a dynamic mesh. Due to the above, an individual method was established, which was integrated into the CFD model to control the movement of the mesh. The method is based on the movement of the orthogonal meshing nodes as a function of the mesh distortion. For the application of this method, an analysis of the axial and radial forces applied in the compression ring is carried out, which are described below.
The following considerations are made to analyze the dynamics of the piston ring:
Radial inertial forces are neglected due to the stiffness of the inner diameter of the ring.
The radial friction force between the piston ring groove and the flanks of the ring is calculated using the Stribeck function.
The axial damping force is obtained using the Reynolds equation.
Flow processes are isothermal.
Pressures and flue gases are considered stationary.
Figure 6 shows the forces acting on the piston compression ring, which considers friction, the pressures caused by the lubrication film, and the combustion gases.
In Equation (24) shows the dynamic forces acting in the axial direction of the piston ring.
where
,
,
and
are the mass of the ring, the force of the gas (due to the pressure of the combustion gases above and below the ring), the damping force caused by the lubricant, and the force of friction due to the interaction of the cylinder liner and the ring surface. The dynamic forces acting in the radial direction are described by Equation (25).
The friction force
is comprised of two parts, the hydrodynamic force
caused by the viscosity of the lubricant film, and the asperities force
caused by the shear of the lubricant. The components of the friction force are indicated in Equation (26).
Equations (27) and (28) were used to define the hydrodynamic force and the asperities force.
where
and
are the coefficient of friction and the roughness contact pressure. For the calculation of
the Tripp and Greenwood model is used [
56].
where
is the asperity distribution,
the composite surface roughness of the contiguous surfaces,
the average asperity tip radius of curvature, and
the Stribeck lubricating film ratio, calculated using Equation (30).
The term
in Equation (29) is a statistical function, which approximates the relationship between the lubricant film using the polynomial defined in Equation (31) [
56].
The equivalent Young’s modulus of elasticity (
E) is defined as:
where subscript 1 and 2 refer to the lining material of the cylinder liner and the piston compression ring.
and
are the Poisson ratios of each material.
The shear stress of the lubricant changes as a function of the contact pressure, the height of the film, and the viscosity of the lubricant, as shown in Equation (33) [
57].
2.4.4. Blow-by Model
Calculating the mass flow through the compression ring and the piston clearances (blow-by) requires consideration of the space at the ends of the ring. Because the 2D-CFD model cannot directly consider these spaces, an analytical approach is proposed following the methodology proposed by Lyubarskyy and Bartel [
51]. The methodology of the approach carried out is shown below.
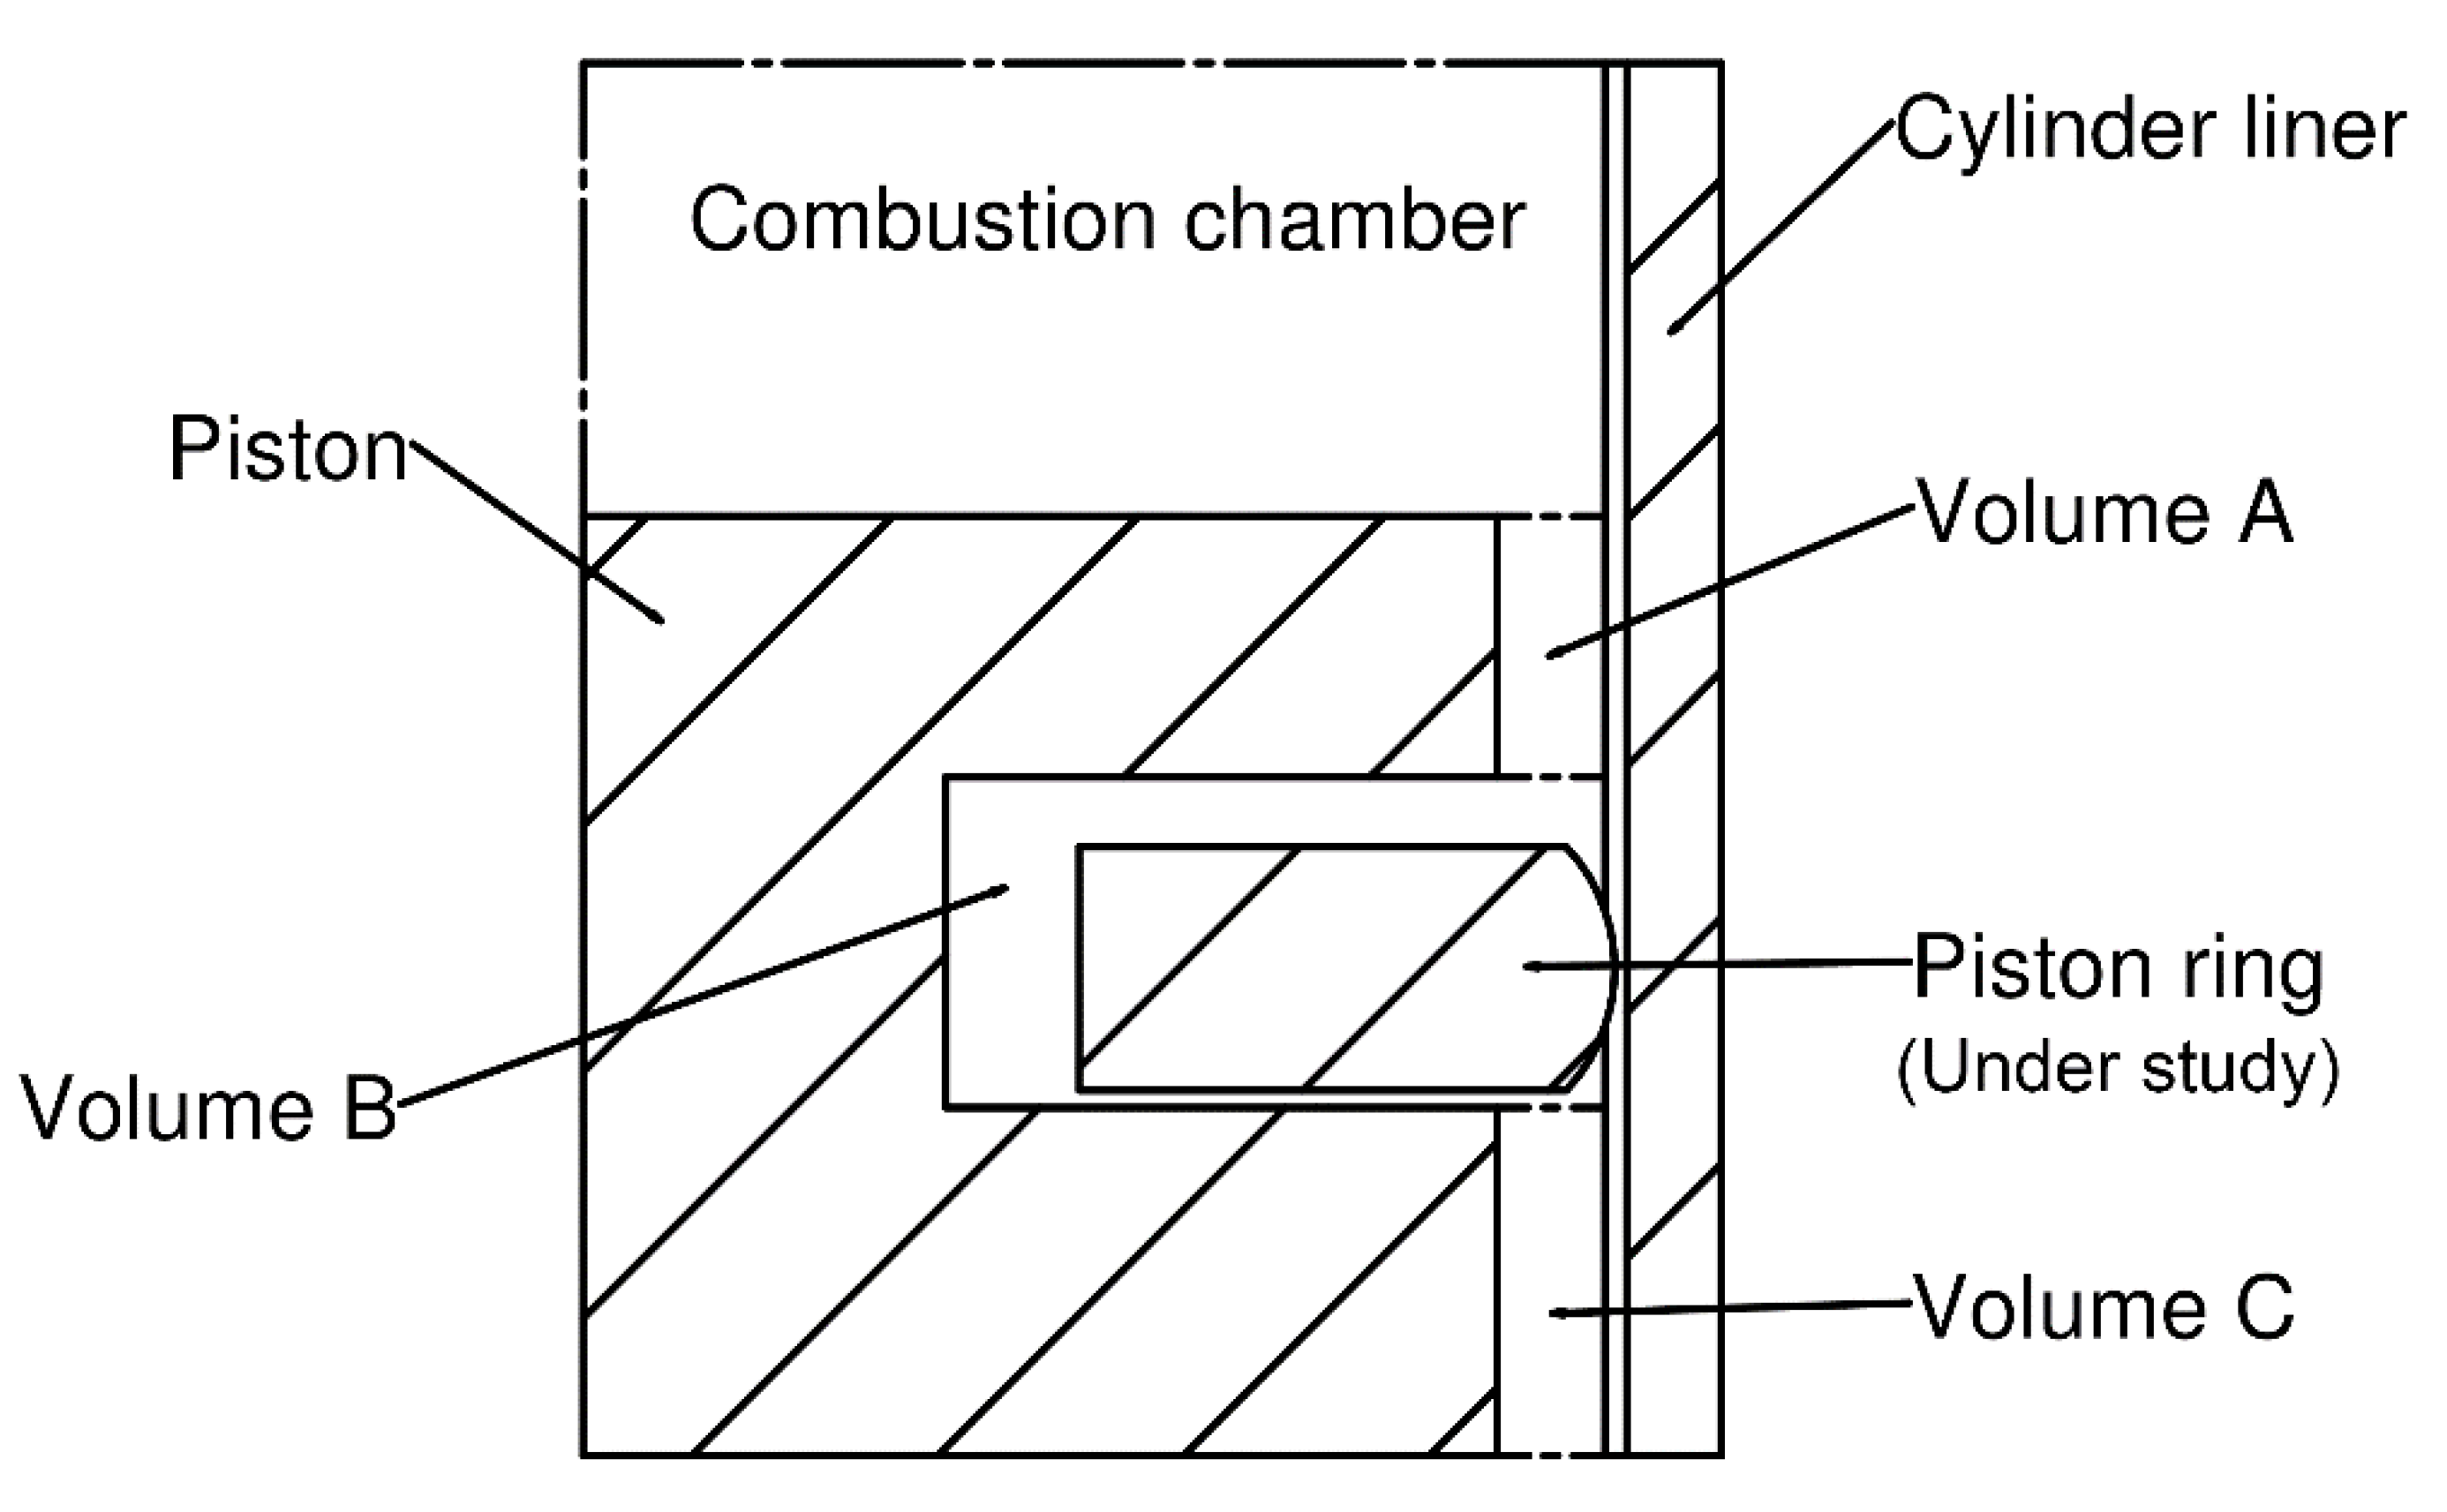
Combustion gases escape through cracks between the piston ring, cylinder liner, and piston grooves due to high pressure inside the chamber. To consider the lost mass flows through the cracks, the method proposed by Baker et al. [
58] is used.
Figure 7 shows the control volumes for the waste gas flow model.
The mass flow that escapes through the cracks can be modeled by considering a laminar isothermal flow in the space between the cylinder liner and the ring surface. This consideration of laminar flow is in agreement with the experimental studies by Namazian and Heywood [
59], which reported that the Reynolds number is relatively low in the ring cracks. The mass flow of volume A (see
Figure 7) is determined by Equation (34) [
57,
60].
where
is the mass flow between control volumes
A and
B. The geometric parameters of the flow channel are identified by the parameters of
,
and
, which correspond to the height, cross-sectional area, and width. Gas viscosity is defined by Equation (35) [
61].
where
and
, are the dynamic viscosity of the gas at the reference temperature
and Sutherland’s number [
62].
The mass flow through the ring hole is estimated considering an isentropic flow through an equivalent hole, as shown in the following equation:
where
,
and
are the discharge coefficient, the compressibility factor, and the area of the ring space. The compressibility factor is defined by Equation (37).
The discharge coefficient is calculated by Equation (38).
where
,
and
are the specific heat, the downstream pressure, and the upstream pressure.
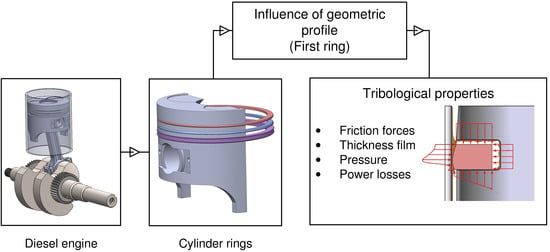
Figure 8 presents a diagram that summarizes the methodology used for the tribological study carried out in this document.
The piston geometry used for the construction of the CAD model necessary for CFD analysis is determined from the engine test bench (see
Figure 4). Additionally, through the development of the nine experimental tests described in
Table 5, data on the conditions of pressure, temperature, and mass flow in the combustion chamber are obtained. The above data is used to define the boundary conditions in the CFD study. In order for the CFD model to approach real operating conditions, a configuration is made, taking into account the piston kinematics, the change in lubricant properties, the kinetic relationships of the compression ring, and the blow-by model.
Before conducting the tribological study, the simulation results are validated by comparing the piston friction force obtained experimentally and by simulations. Finally, the effects of the geometric profile of the compression ring are analyzed. In addition, the influence of rotation speed and engine load on tribological characteristics is evaluated.
3. Results and Discussion
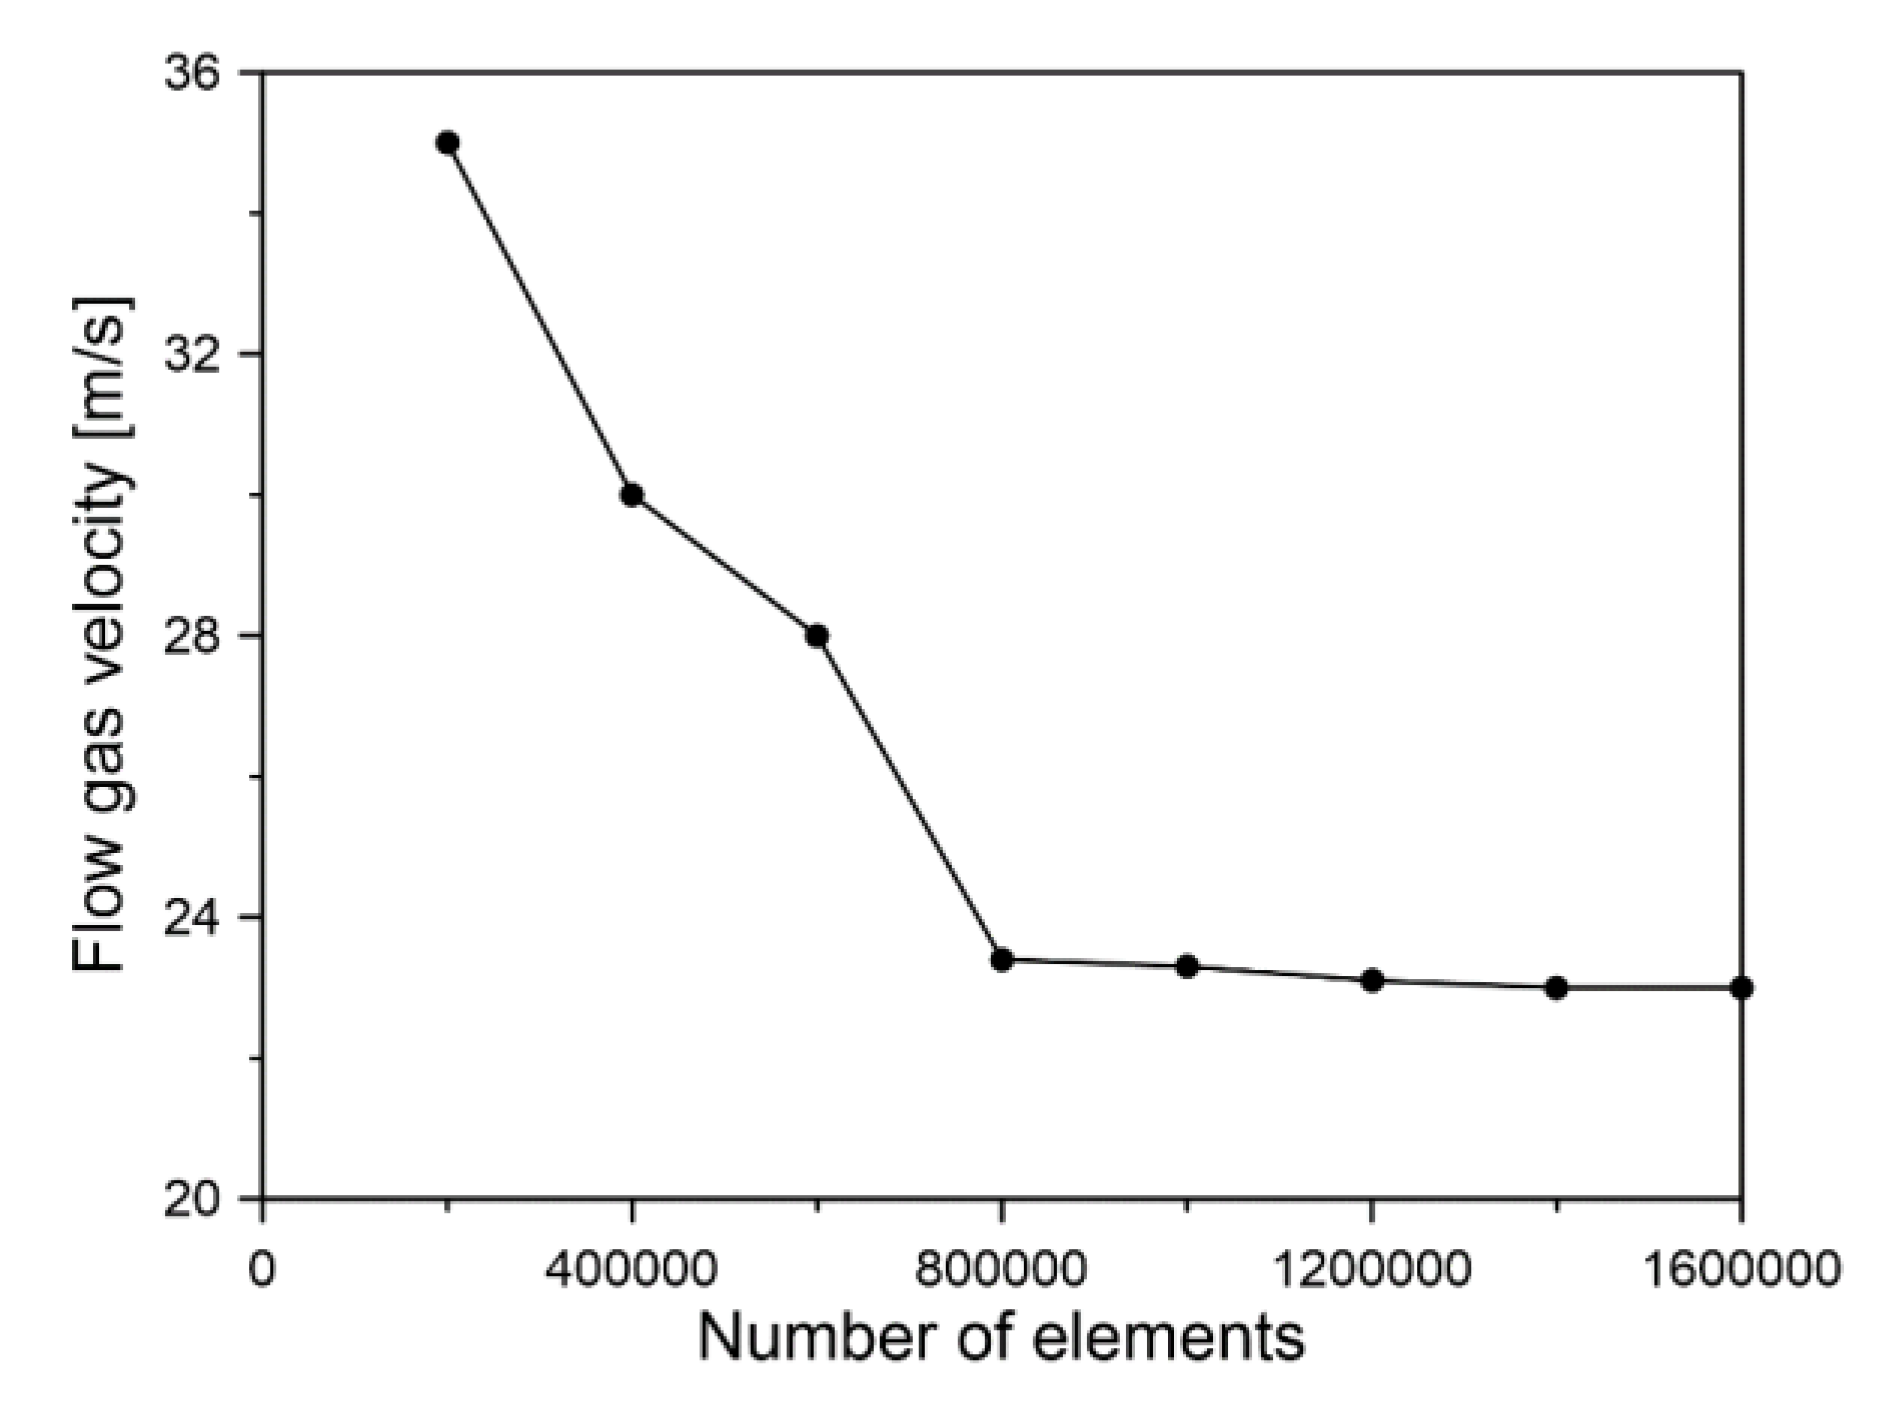
3.1. Mesh Independence Analysis
To guarantee the reliability of the results obtained in the simulations, it is necessary to verify the independence of the orthogonal meshing described in
Figure 3. For this analysis, eight different numbers of elements are defined in the CFD model within a range of
. The velocity of gas flow near the crest of the compression ring is recorded for the different numbers of mesh elements. The results obtained are shown in
Figure 9.
Figure 9 indicates that a stabilization of the results in the simulations is obtained from a number of elements of
. From this value, the change with respect to the previous point remains less than 2%.
3.2. Experimental Validation
The validation of the CFD simulation model is carried out by means of a comparison between the piston friction for different crankshaft angles, obtained experimentally, and by means of the CFD model simulations.
The piston friction is measured indirectly by measuring the transverse force that the cylinder liner supports since the piston in its movement produces shear stress on the cylinder liner. To carry out the measurement of the friction force, a strain gauge sensor is used, which allows the tension and deformation in the cylinder liner to be measured directly.
Figure 10 shows the location of the sensor on the engine.
When the piston passes over the measurement area, the sensor produces a pulse signal that records the deformation produced in the cylinder liner. The technical characteristics of the strain gauge sensor are shown in
Table 6.
Figure 11 shows a diagram of the friction force measurement process. To guarantee the direct measurement of friction, a filtering process is carried out that allows to ignore the deformation produced by the thermal effects and the lateral force of the piston on the cylinder liner. This is done by resetting the signal after temperature stabilization to neglect thermal deformation. The deformation caused by lateral forces is mitigated by operating the motor at low rotational speed since the investigations by Mufti et al. [
63] and Guzzomi et al. [
64] demonstrate that the operation of a low-speed engine does not cause considerable deformation in the cylinder liner. Finally, the friction force is determined by Equations (39) and (40) [
65].
where
is the area of the strain gauge sensor,
is Young’s modulus of the cylinder liner, and
is the longitudinal unit strain of the sensor.
is the calibration factor of the strain gage
. The voltages
V1 and
V2 are those obtained in the calibration setup shown in
Figure 11.
The deformation registered in the sensor is a consequence of the mechanical and thermal deformation caused by high temperatures. To eliminate the deformation caused by thermal expansion, a filtering process is performed on the measured data. For the filtering process, the temperature at the sensor location is expected to stabilize. After this stabilization in temperature, the deformation values are restored, taking into account that the engine body has a coefficient of thermal expansion of 24 μstrain /°C [
66]. The foregoing ensures that the deformation measurement has been a consequence of the friction process.
The measurement assemblies made allows the friction force to be measured in an instant for each of the combustion cycles. The experimental friction force was measured for an operating condition of 3000 rpm and a load of 1.5 Nm. The results of the comparison of the experimental and simulated data are shown in
Figure 12.
The results obtained indicate that the CFD model presents sufficient complexity to represent the real behavior of the compression ring. The relative error between the mean value of the experimental data and the simulation was 10%. However, the relative error when comparing the experimental maximum and minimum value for each point compared to the simulation is 26% and 37%. This type of validation methodology is considered an acceptable way to predict the behavior of the piston compression ring due to the technical difficulty of isolating the ring under engine operating conditions [
67].
3.3. Influence of the Geometric Profile on the Gas Flow Velocity
Figure 13 shows the velocity contour of the mass flow through the compression ring and the piston clearances (blow-by), which was described in the CFD model using the equations described in
Section 2.4.4.
Two regions are observed through which the combustion flow passes through the compression ring. One of these regions corresponds to the grooves between the ring and the piston, and the second region is between the profile of the ring and the cylinder liner. In this second zone is where the highest flow speed is found, reaching speeds of 25 m/s. Meanwhile, in the first region, the speed is in a range of 6–14 m/s. Similar behavior was observed in each of the four profiles. However, in profile 4 (see
Figure 13d), a slight reduction in velocity is obtained at its lower outlet, which indicates a reduction in the flow of gases lost.
3.4. Influence of the Geometric Profile of the Compression Ring
Using the CFD simulations, each of the geometric profiles of the compression ring described in
Figure 2 is tested. For this analysis, the operation data of the engine for an operating condition of 3500 rpm and 3 Nm is entered into the CFD model. The analysis carried out focuses on describing the influence of the geometric profile of the ring on hydrodynamic forces, roughness forces, power losses, and thickness of the lubrication film. The obtained results are shown next.
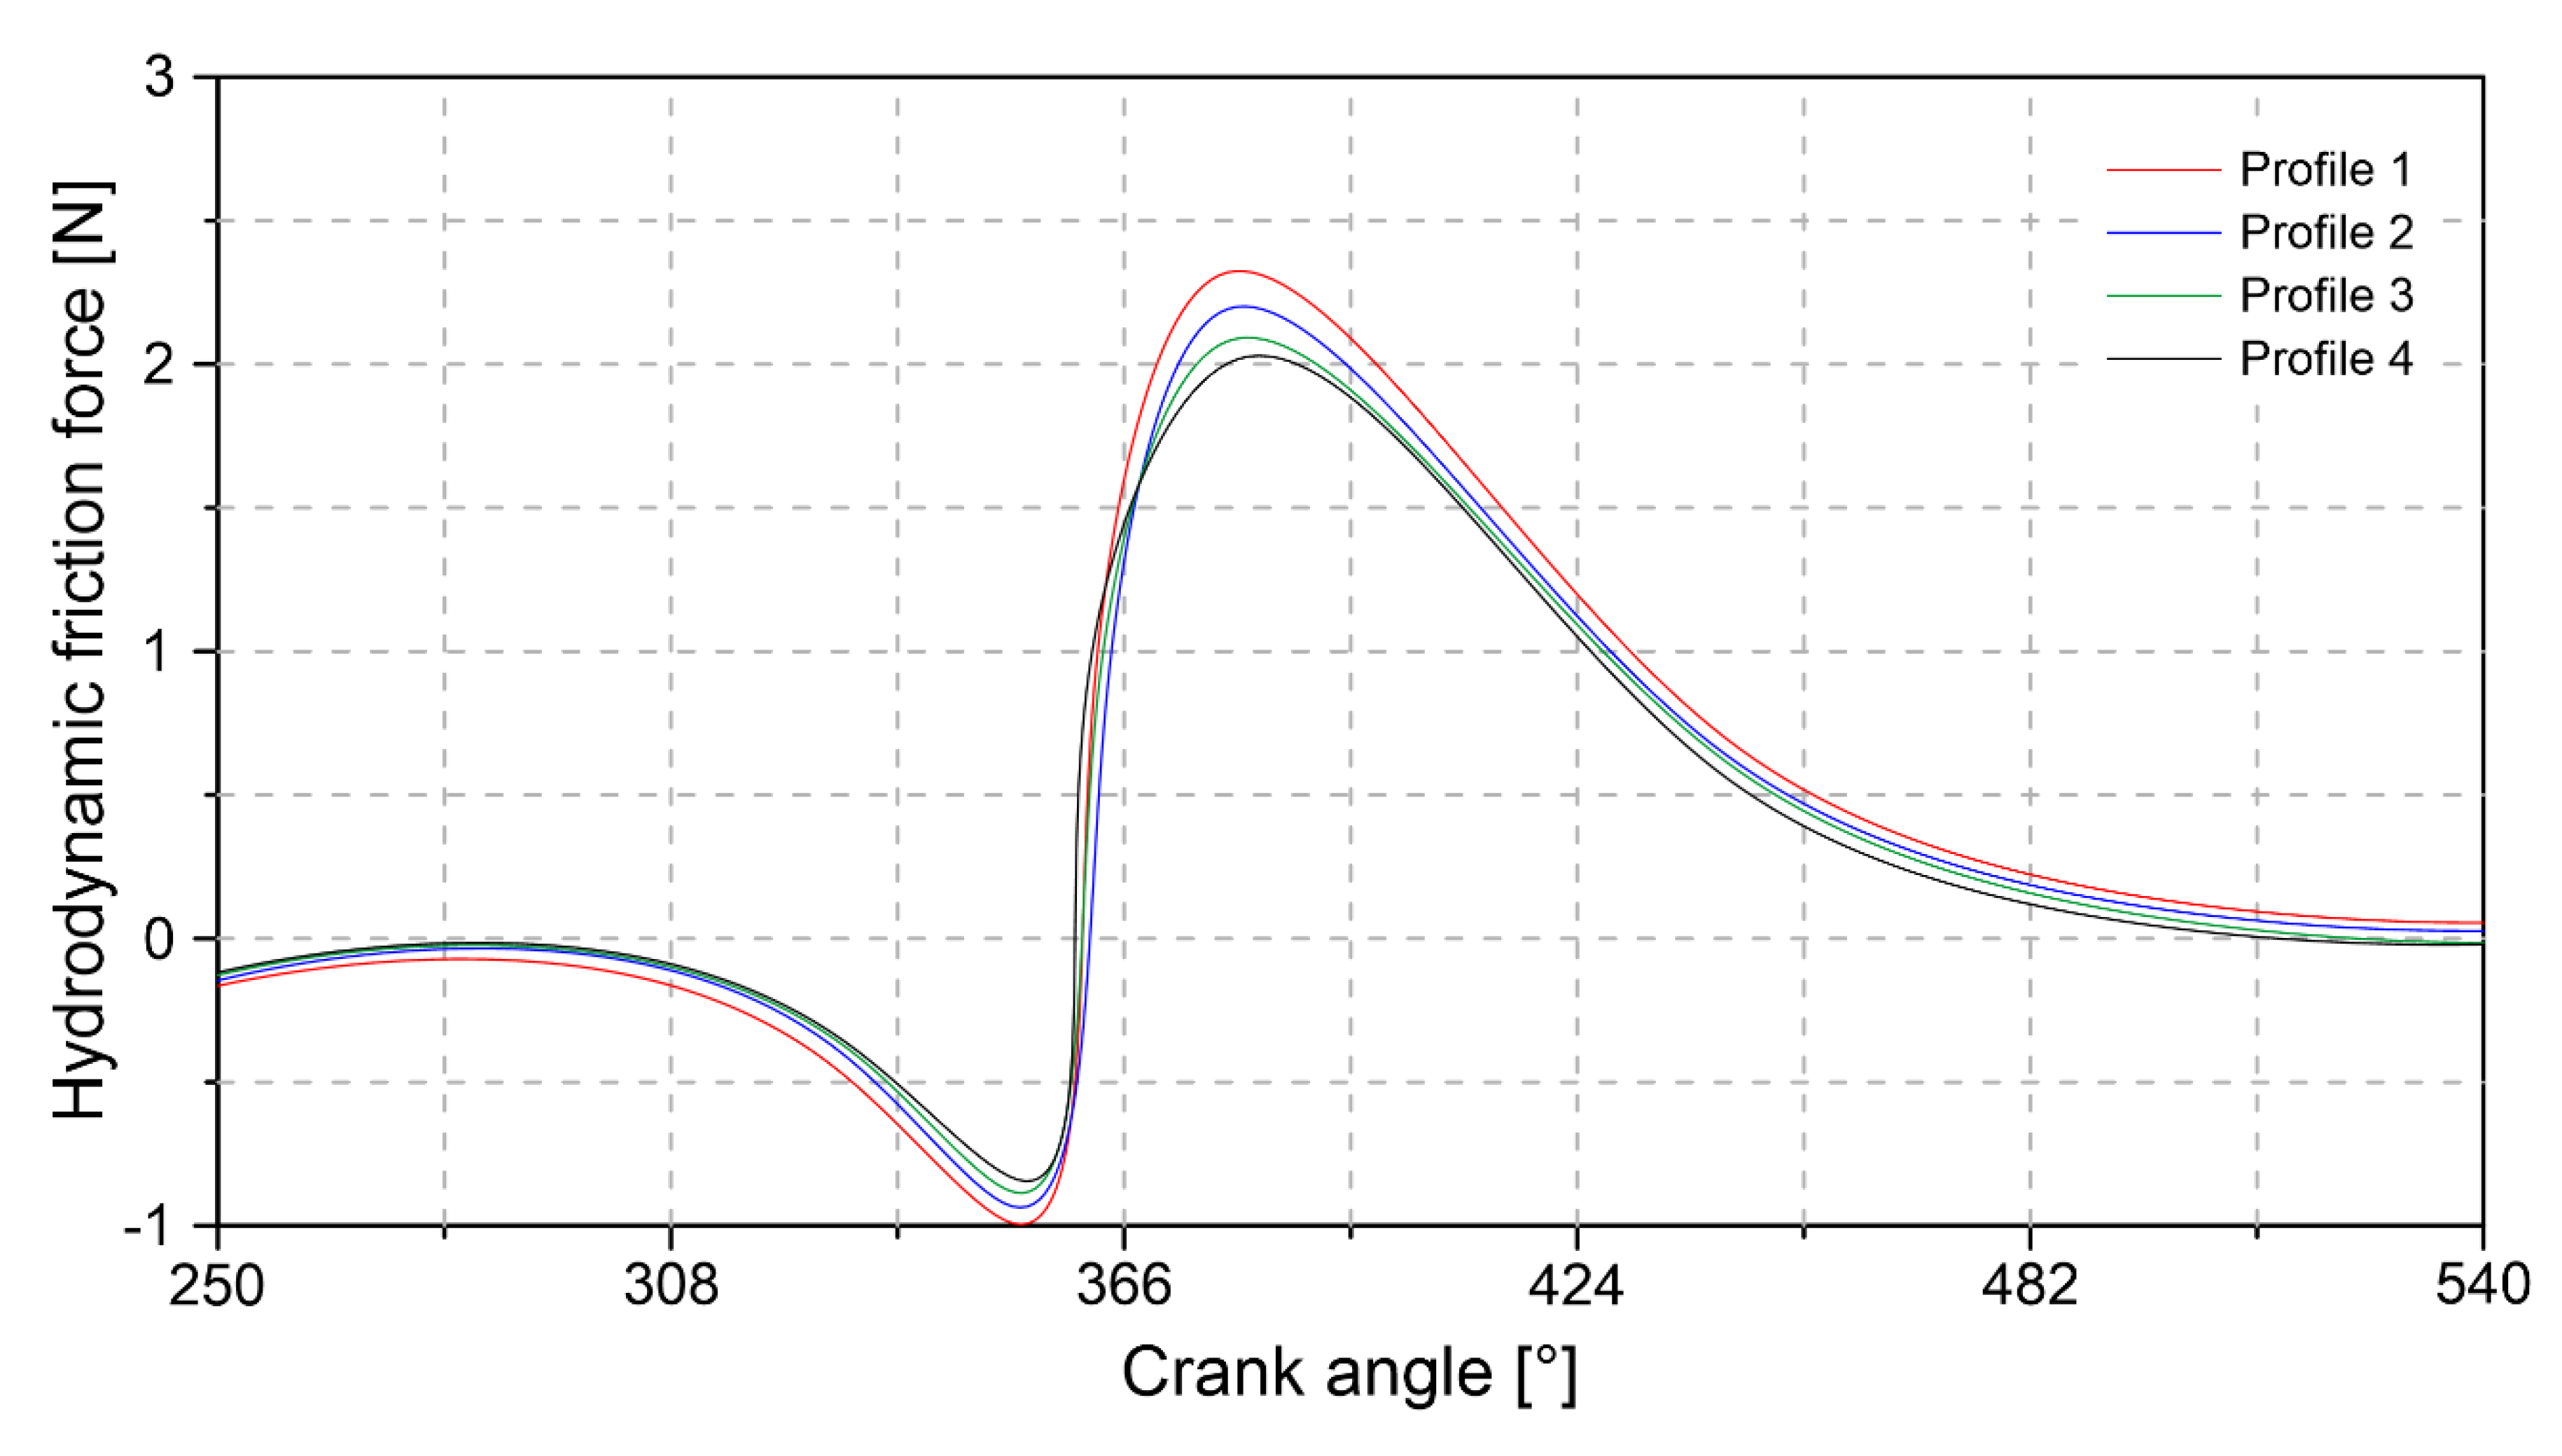
3.4.1. Hydrodynamic Friction
Figure 14 shows the influence of the geometric profile of the compression ring on the hydrodynamic friction force.
The results in
Figure 14 indicate that the highest values of the hydrodynamic friction force occur in the compression and expansion stages. The change of sign in the friction force is a consequence of the transition between the stages of the cycle mentioned above. The maximum peak of the friction force is 2.31 N obtained with geometric profile 1. The minimum hydrodynamic friction force is reached with profile 4. The increase in friction force is attributed to the greater shear stresses in the area lubrication.
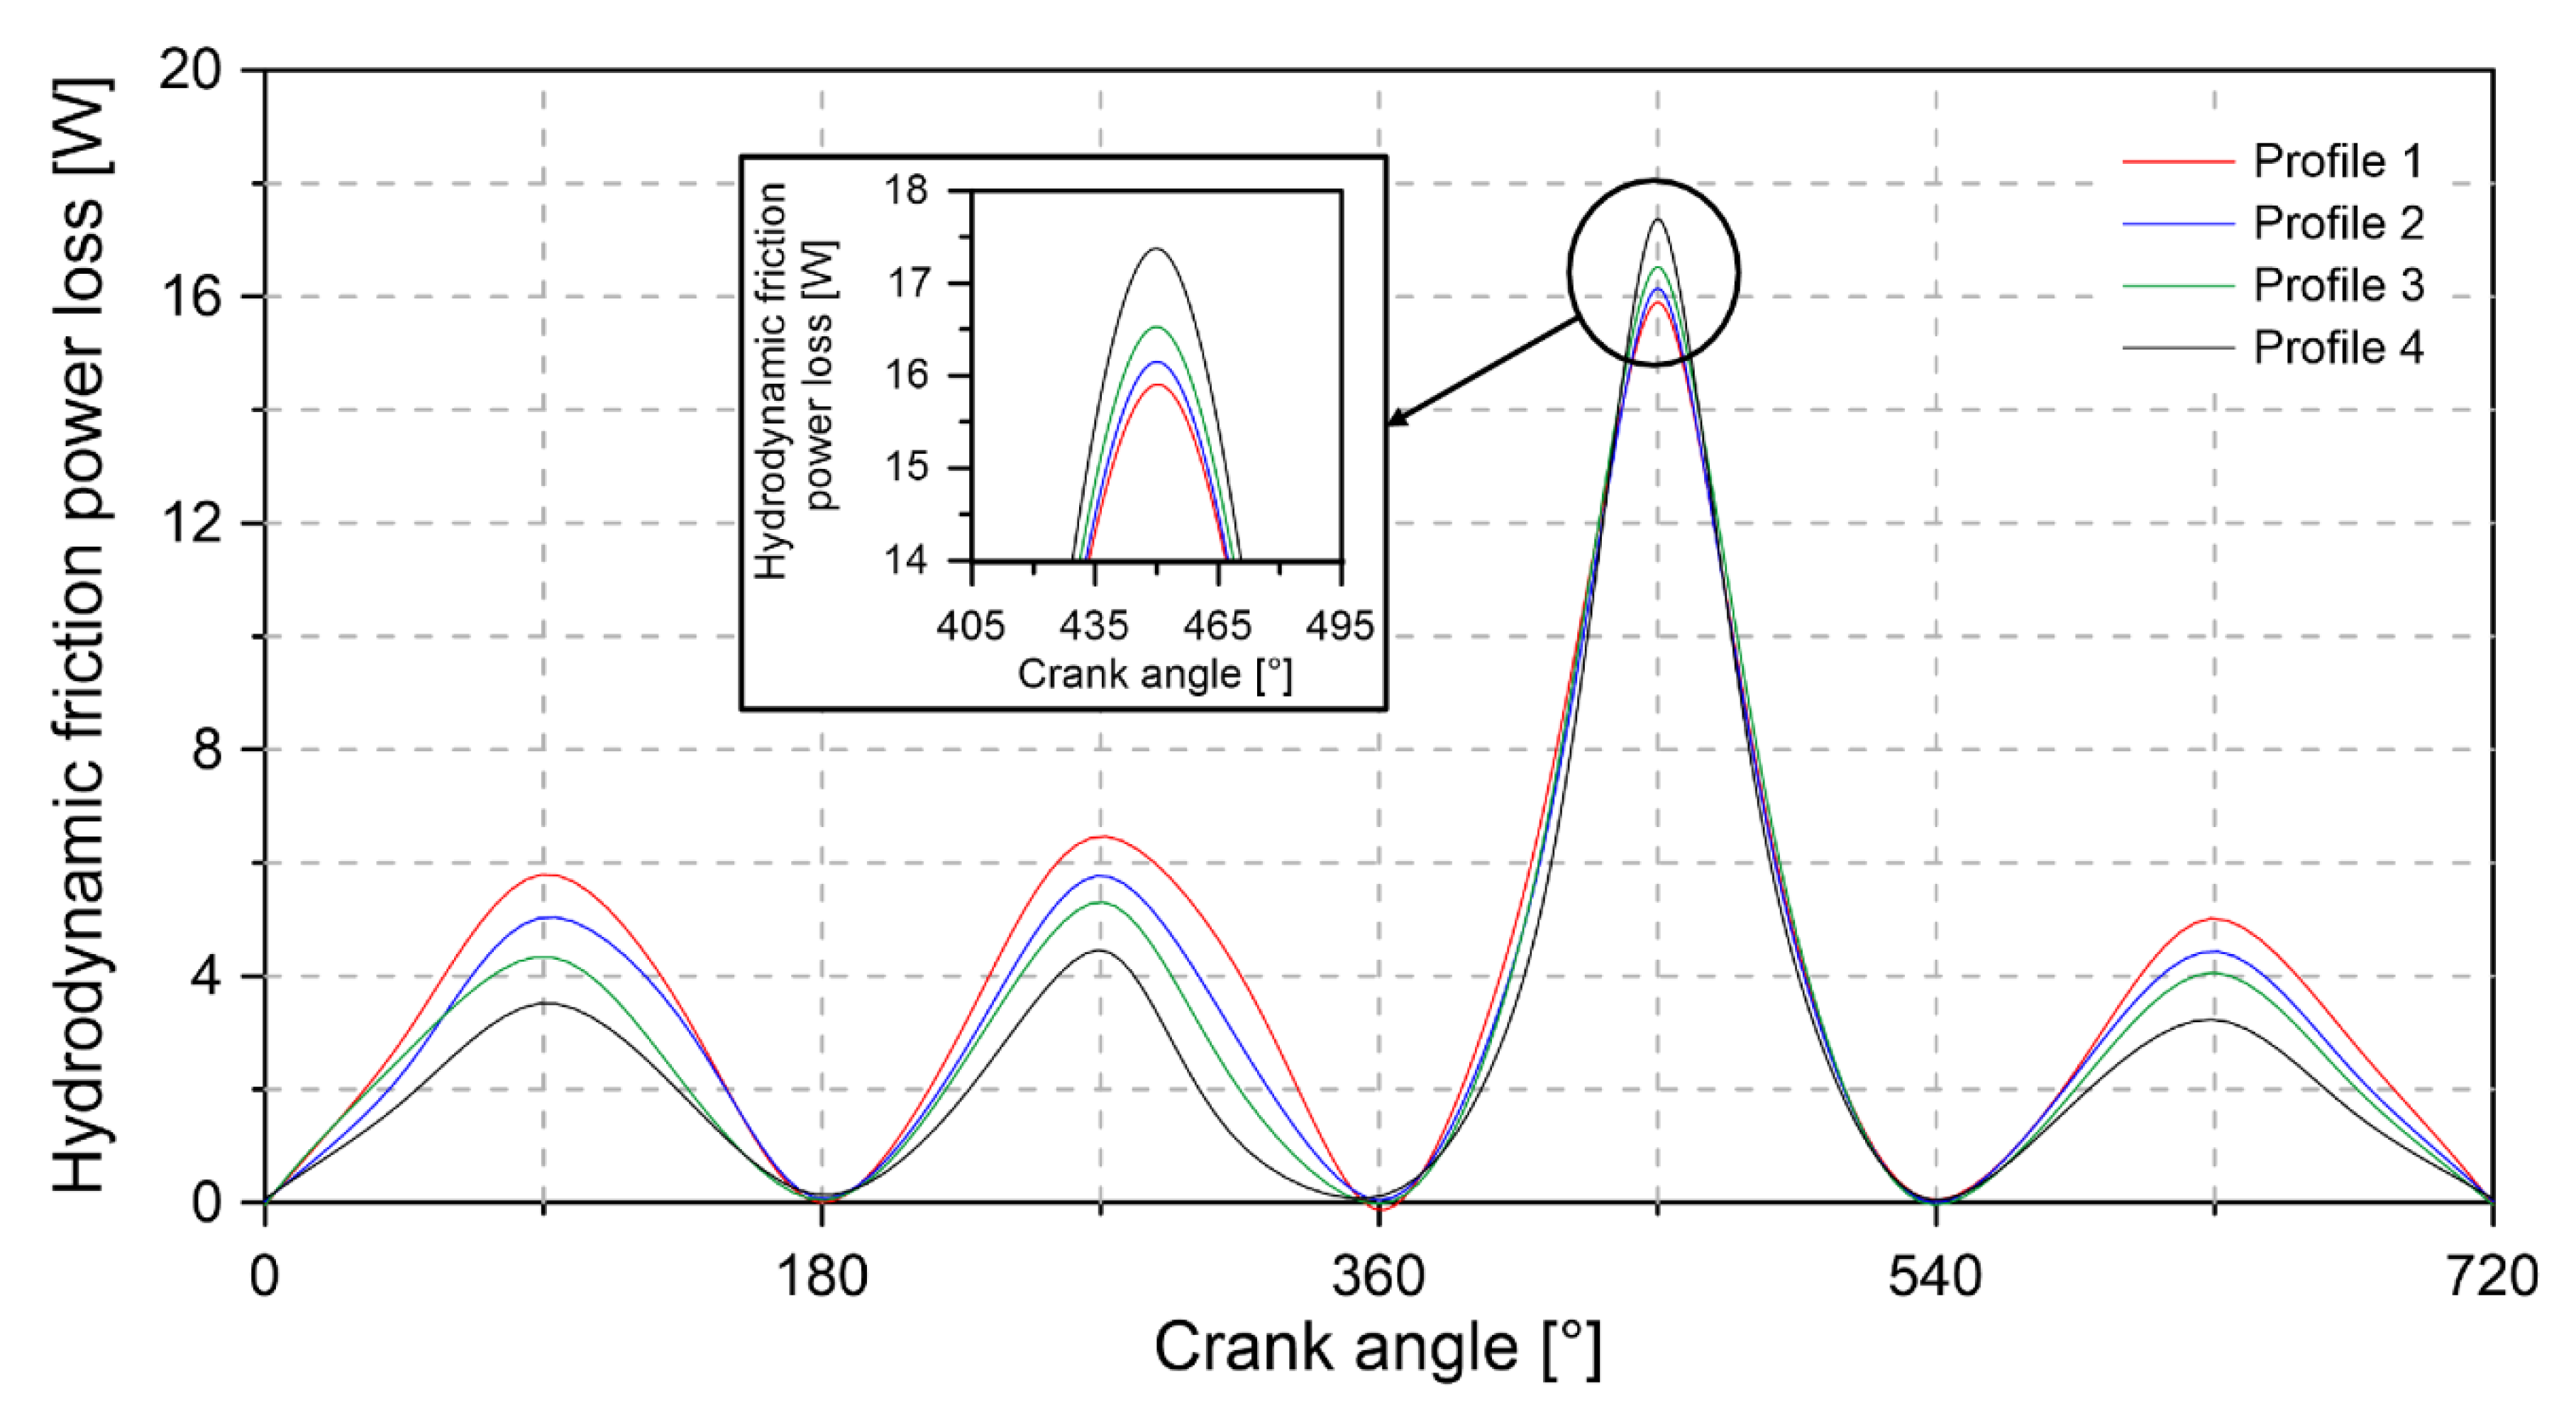
Figure 15 shows the hydrodynamic power loss with respect to the piston stroke, for the different geometric profiles of the compression ring.
The results of
Figure 15 show that, for all geometric profiles, the maximum power loss occurs during the expansion stage. This indicates that during this part of the combustion cycle, wear on the piston sleeve and hydrodynamic shear increases. The maximum hydrodynamic power loss for profiles 1, 2, 3, and 4 are 15.9 W, 16.14 W, 16.52 W, and 17.37 W. Therefore, the geometric profile that produces a smaller contact face makes it easier to increase the loss of hydrodynamic power.
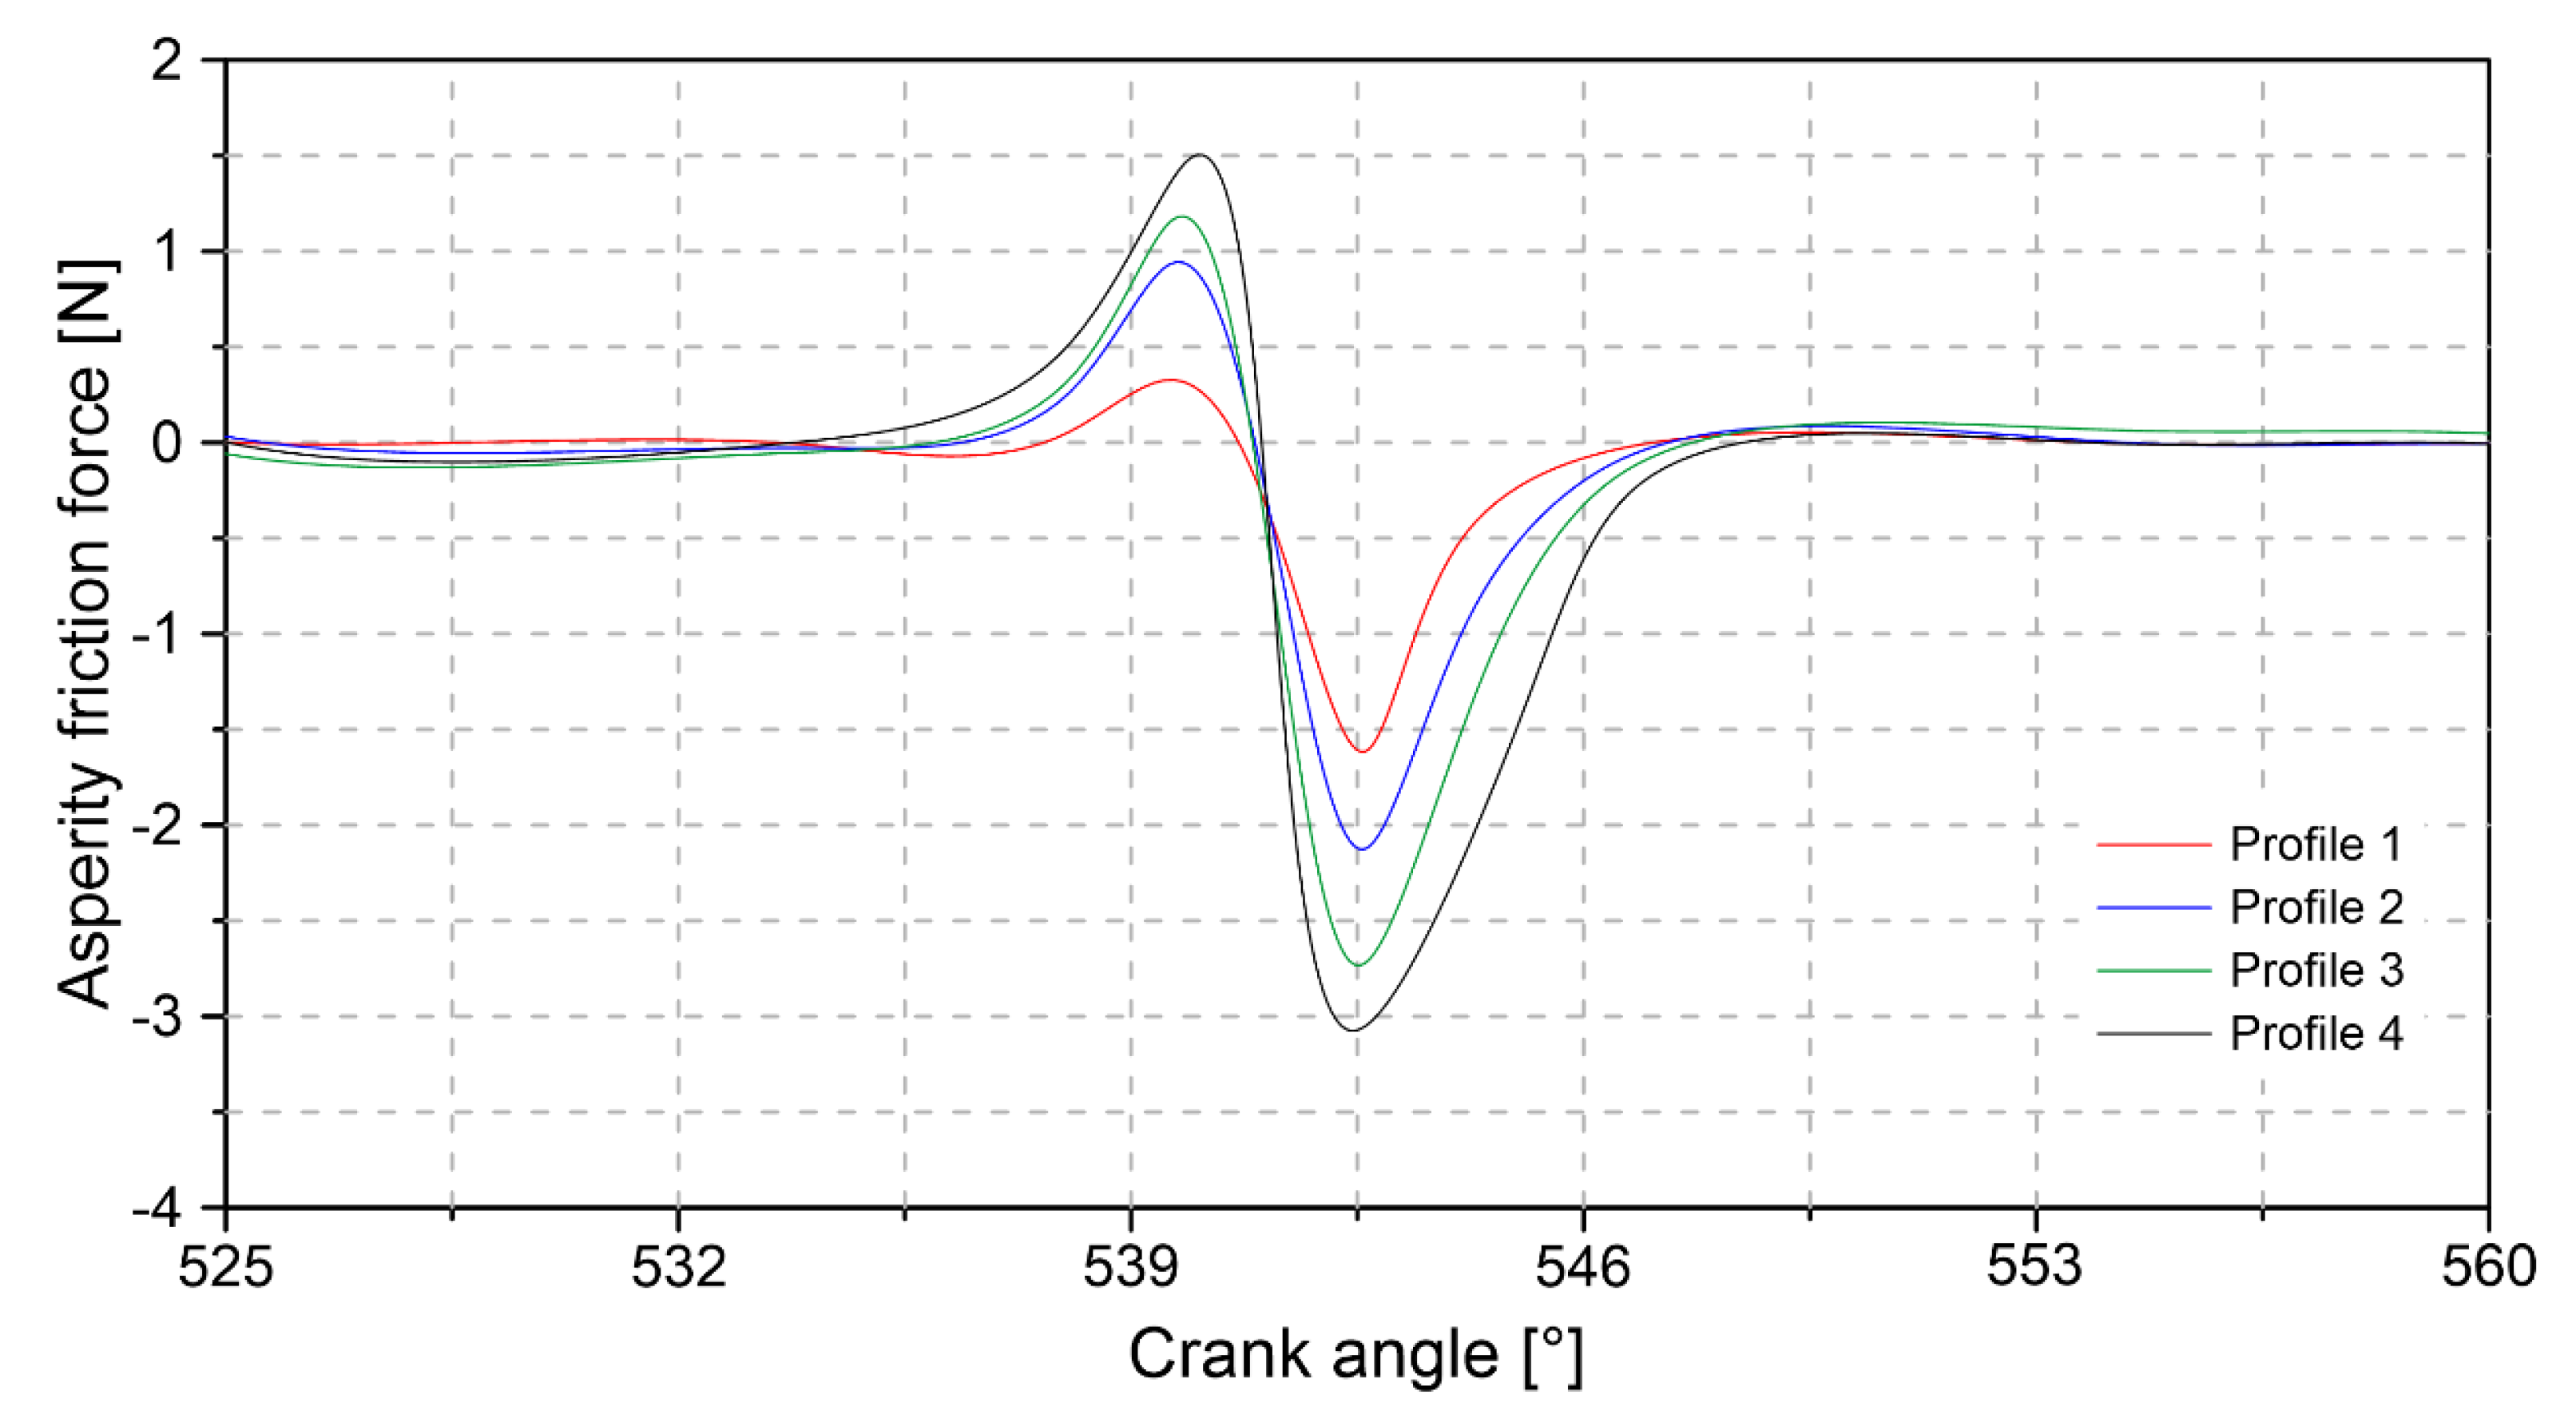
3.4.2. Asperity Friction
Figure 16 shows the roughness friction force obtained as a function of the crankshaft angle.
The results indicate that the maximum roughness friction force occurs at the bottom dead center during the end of the expansion stage and the start of the exhaust. The above is a consequence of the low oil flow at this location. Profile 4 presents the highest levels of roughness friction force, reached a maximum of 3 N. On the other hand, profiles 1, 2, and 3 show an average reduction in friction force by 61%, 34%, and 13% compared to profile 4.
Figure 17 shows the variation in power losses caused by the friction of roughness.
It is observed that the maximum values of power loss due to roughness are concentrated in the expansion stage. In the rest of the stages of the combustion cycle, the losses are kept at a minimum value. This behavior is attributed to increased rough contact in the vicinity of the top dead center and the bottom dead center due to the mixed lubrication condition. The maximum value of power loss due to roughness is 2.11 W, which was obtained with profile 4. Profiles 1, 2, and 3 achieve 61%, 78.7%, and 80% of the maximum power loss value.
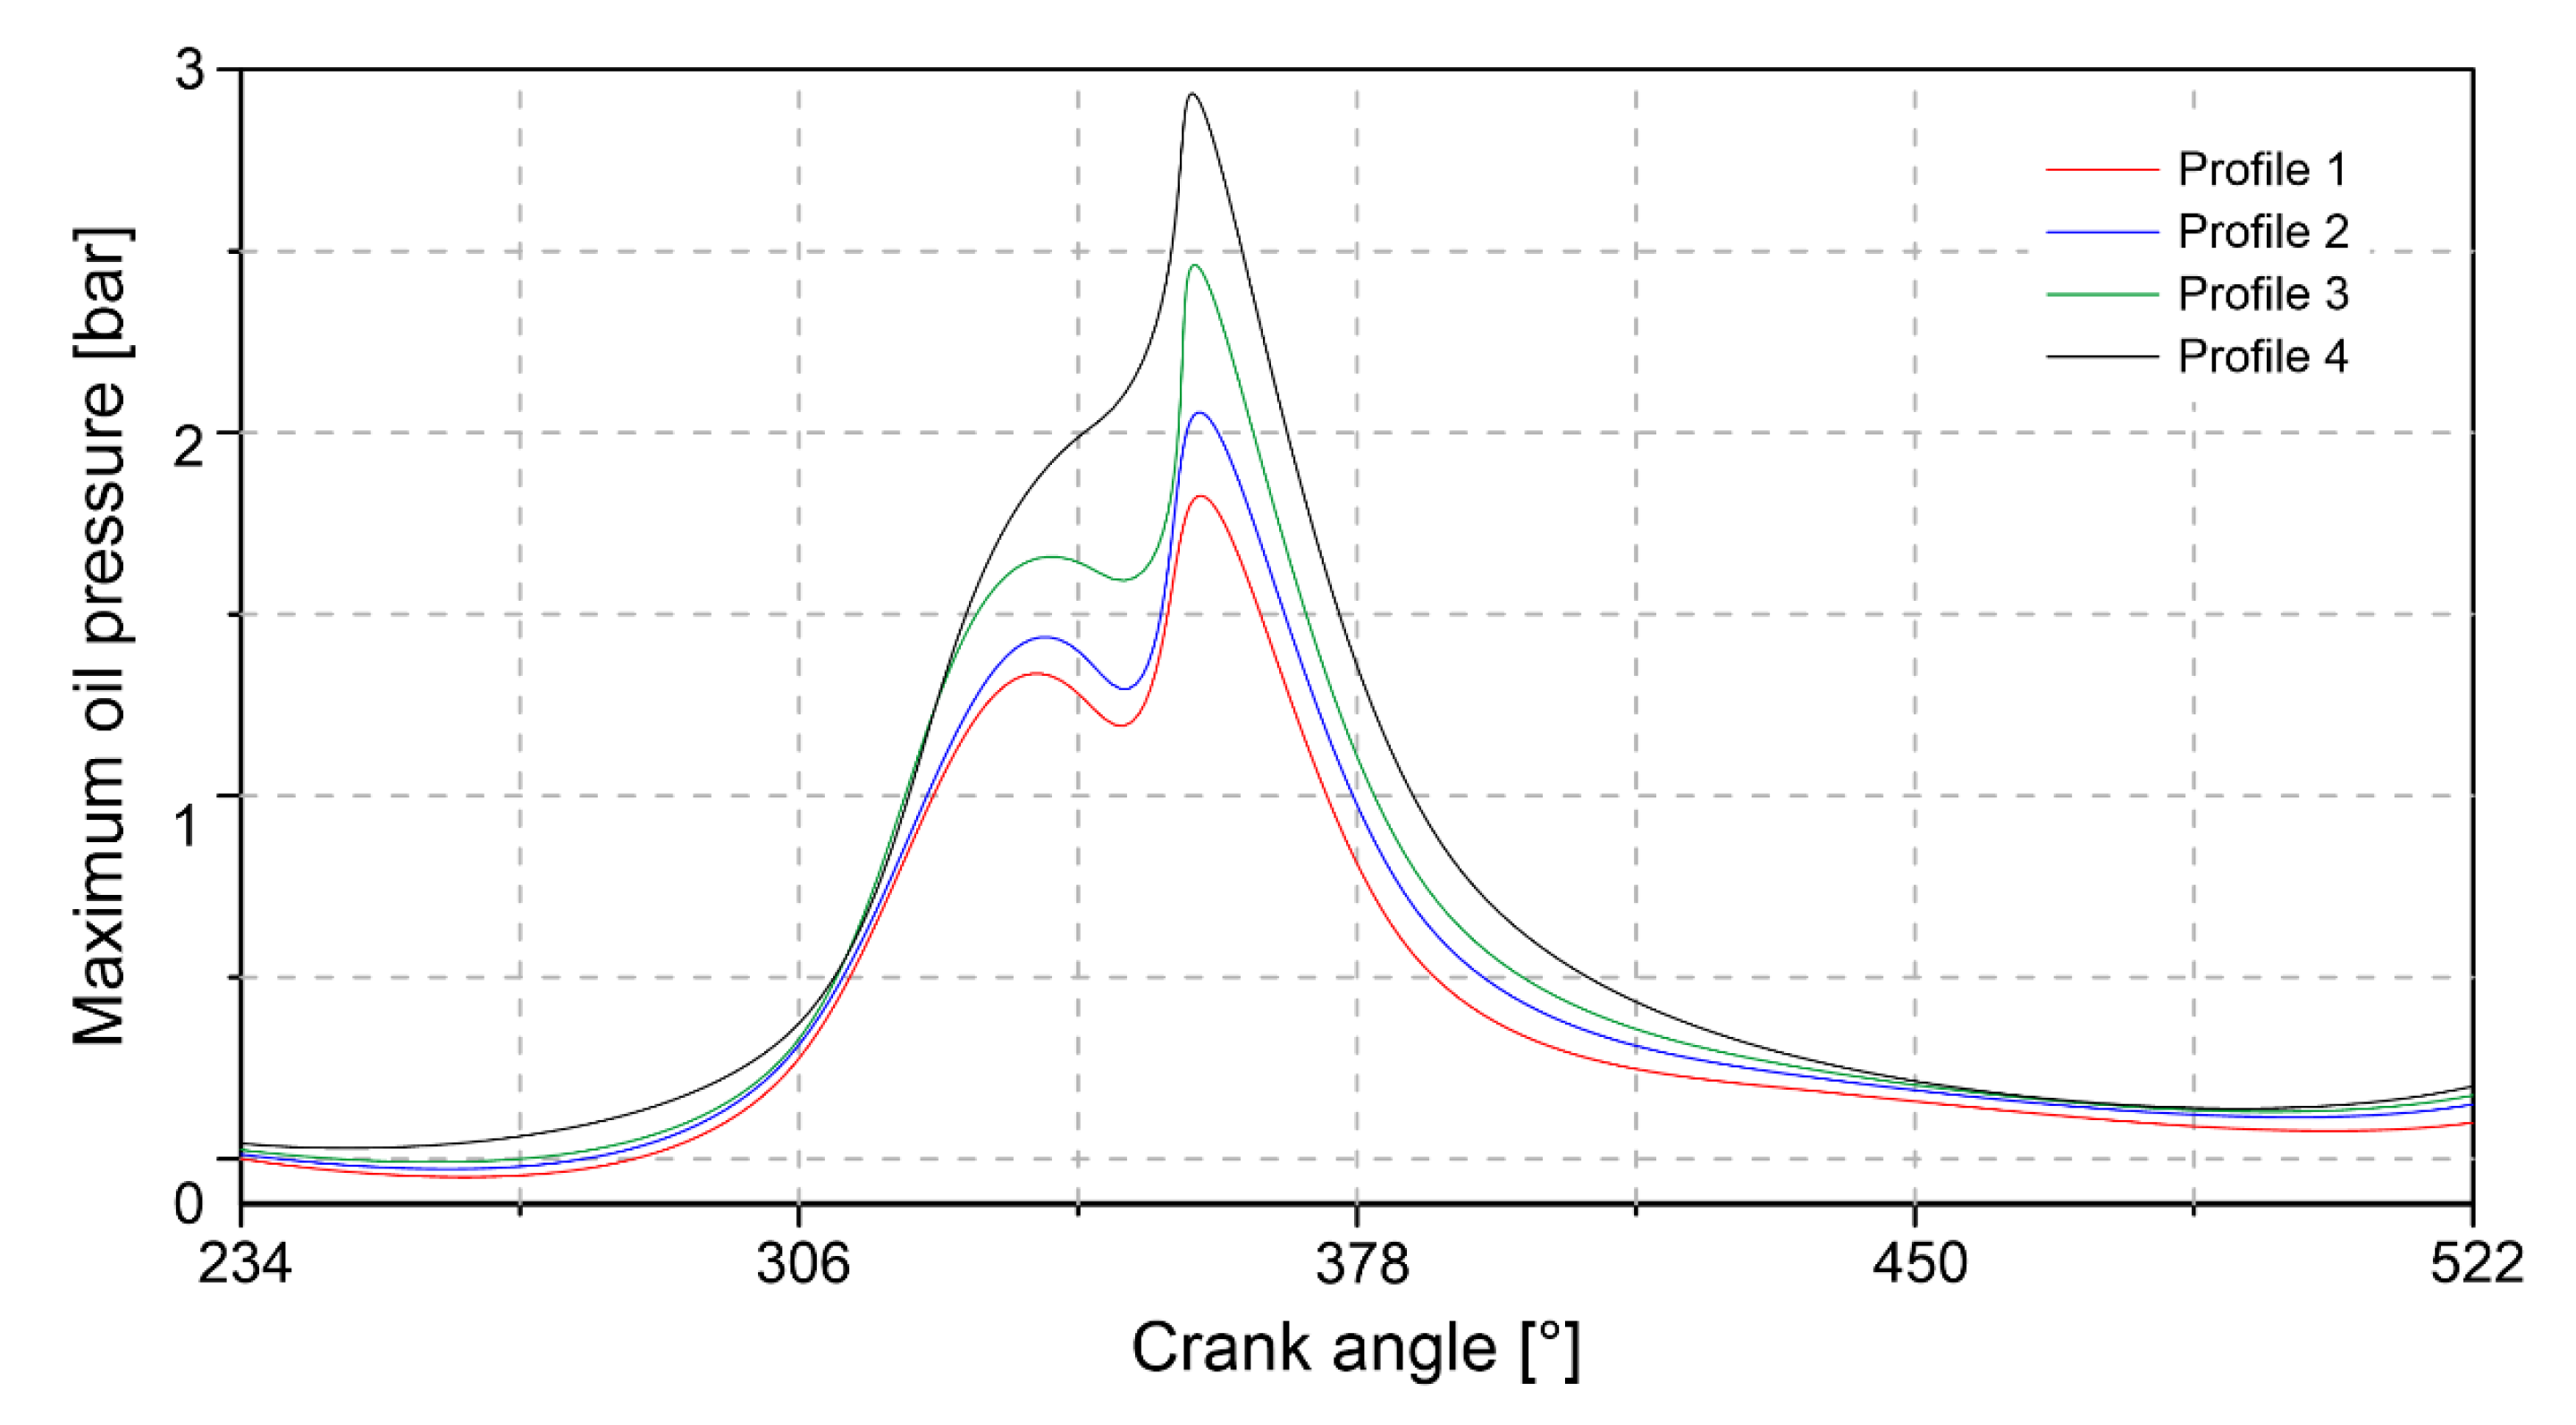
3.4.3. Lubrication Film
Figure 18 shows the change in the maximum lubricant pressure for the different geometric profiles of the compression ring. The results obtained indicate that the maximum pressure occurs at the top dead center at the end of the compression stage. The maximum pressure to which the lubricant is subjected to profiles 1,2,3, and 4 is 1.75, 2.1, 2.48, and 3 bar, respectively. The maximum pressure of the lubrication film is located near the top dead center during the engine compression stage. This can be a consequence of the high-pressure increase inside the combustion chamber. Similar results are reported by Lyubarskyy and Bartel [
51].
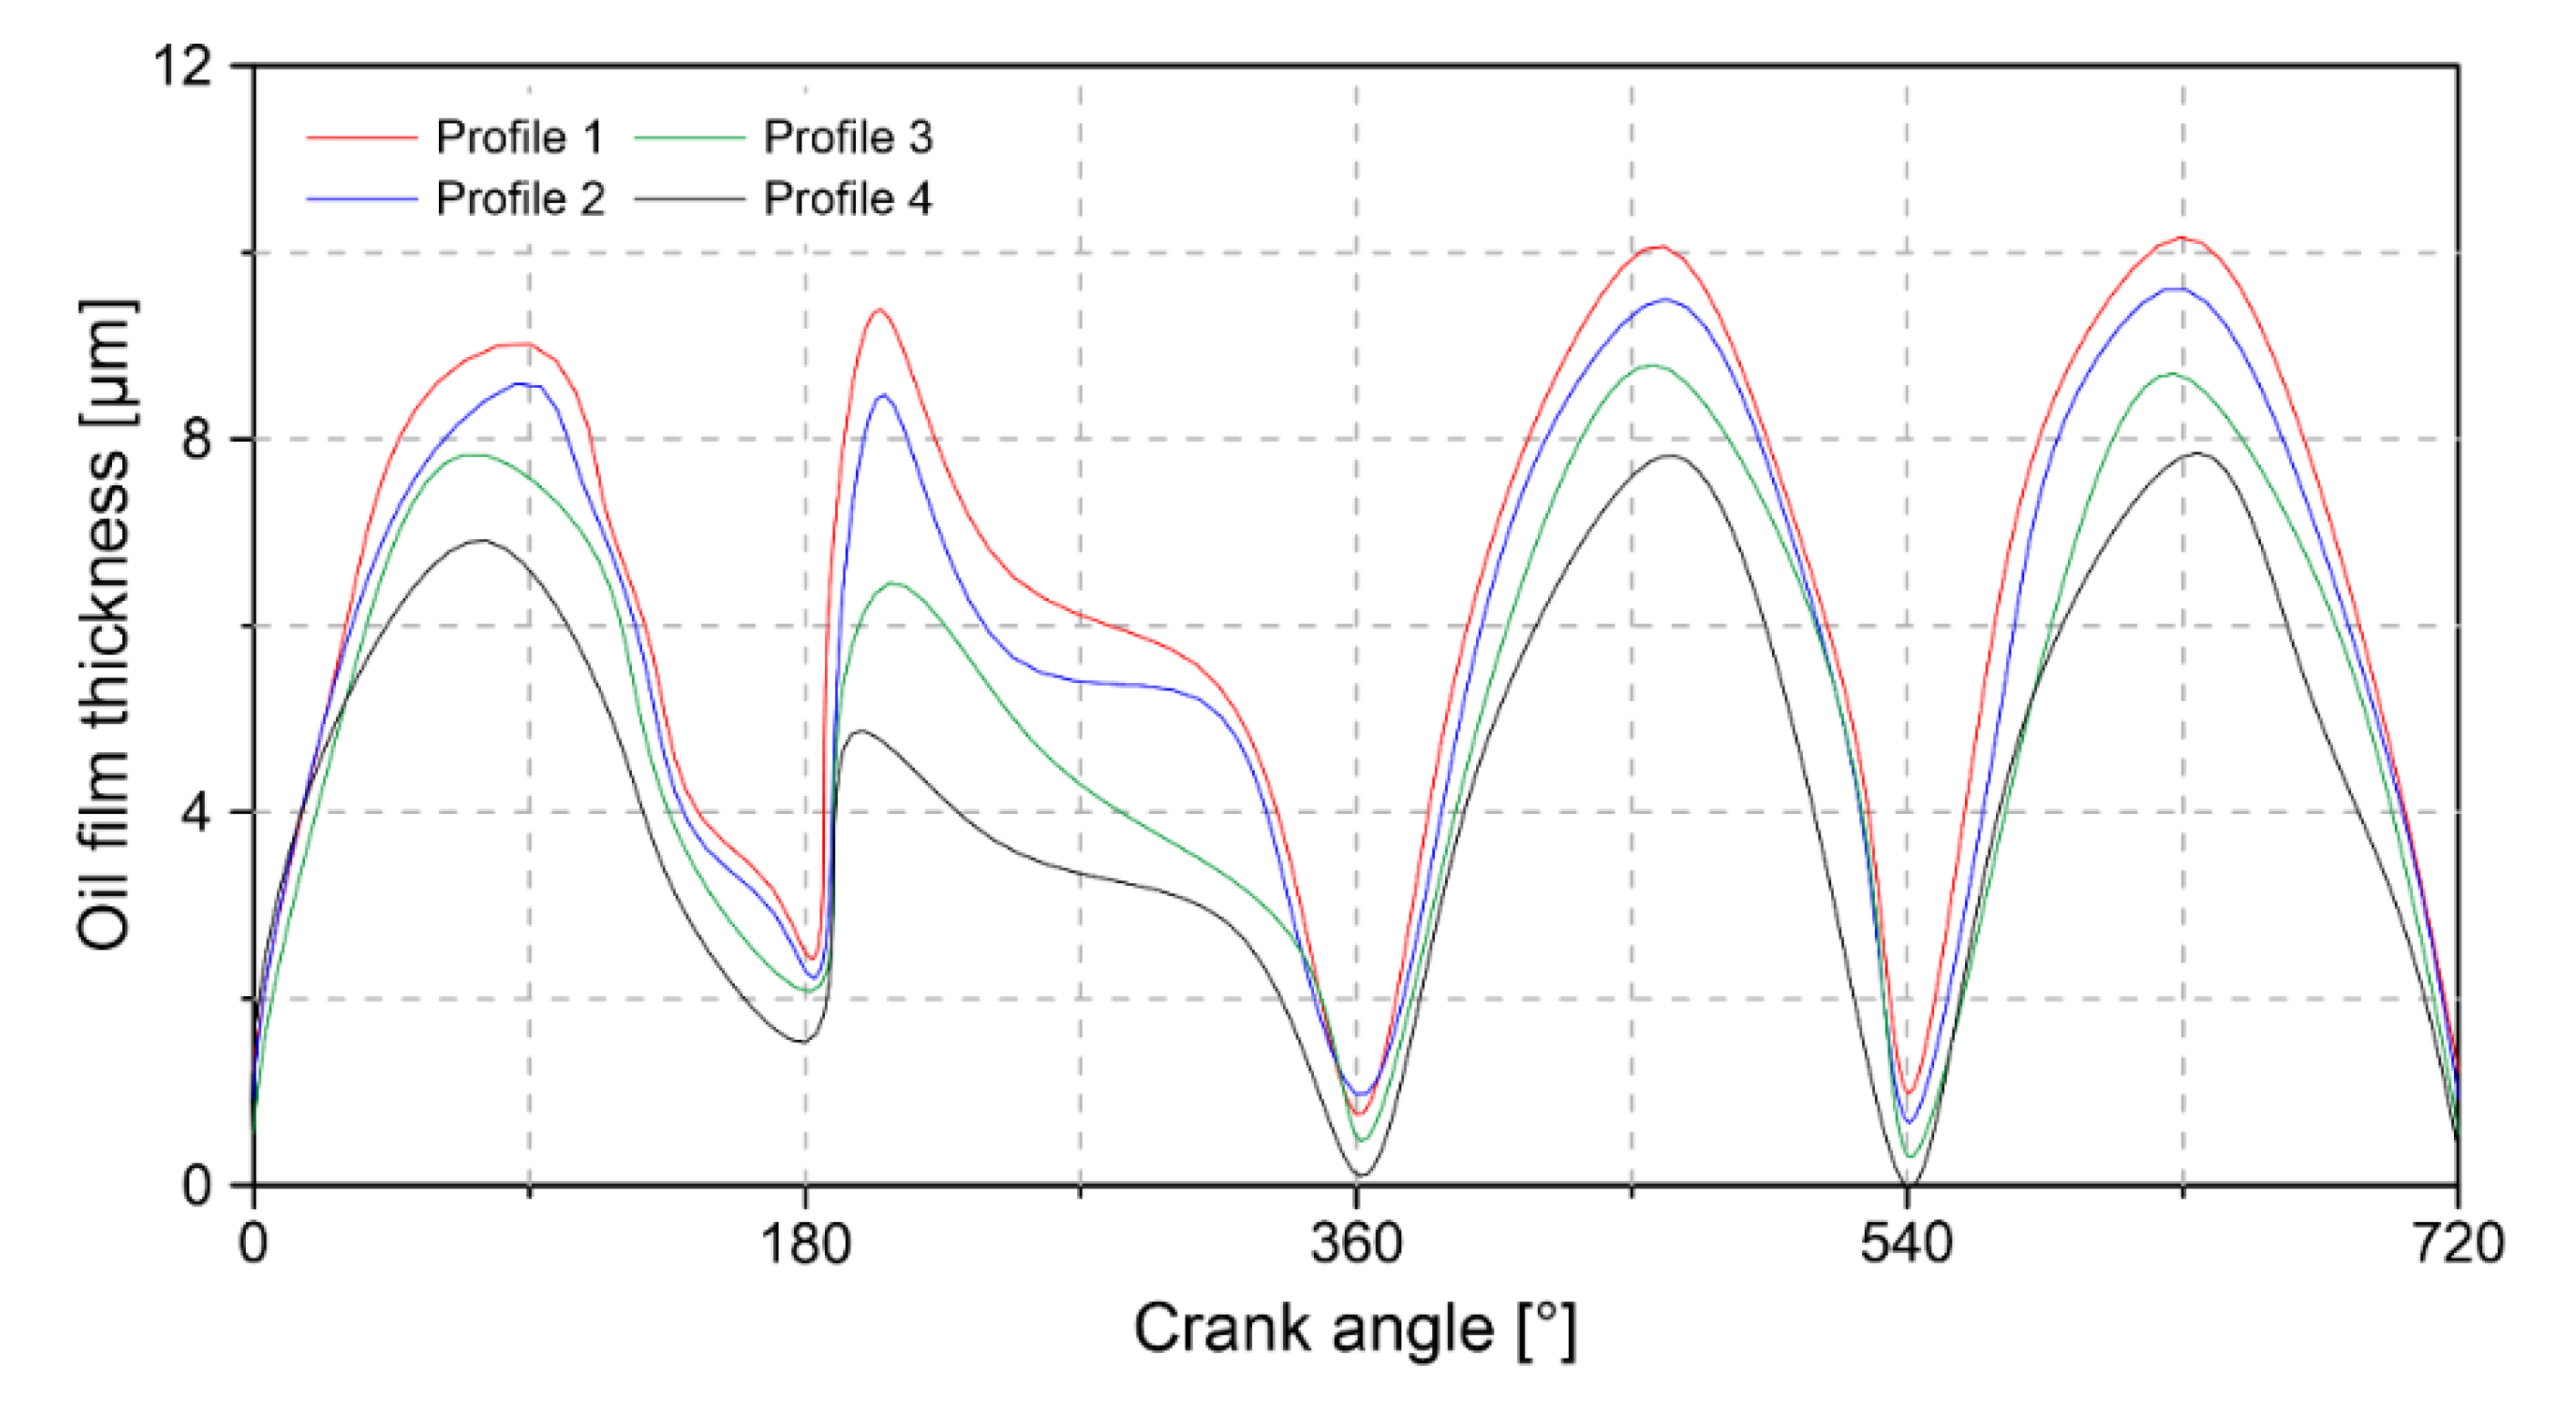
Figure 19 shows the thickness of the lubricant film for the different geometric profiles. The results obtained indicate that the maximum thickness occurs in the middle of each of the stages of the combustion cycle. Additionally, it was observed that the bottom dead centers are the location where the thickness of the lubrication is less. This causes a risk of severe wear on the cylinder wall due to the contact between the ring surface and the cylinder liner. Of the four geometric profiles analyzed, it was observed that profile 1 maintains the highest lubrication thickness throughout the combustion cycle.
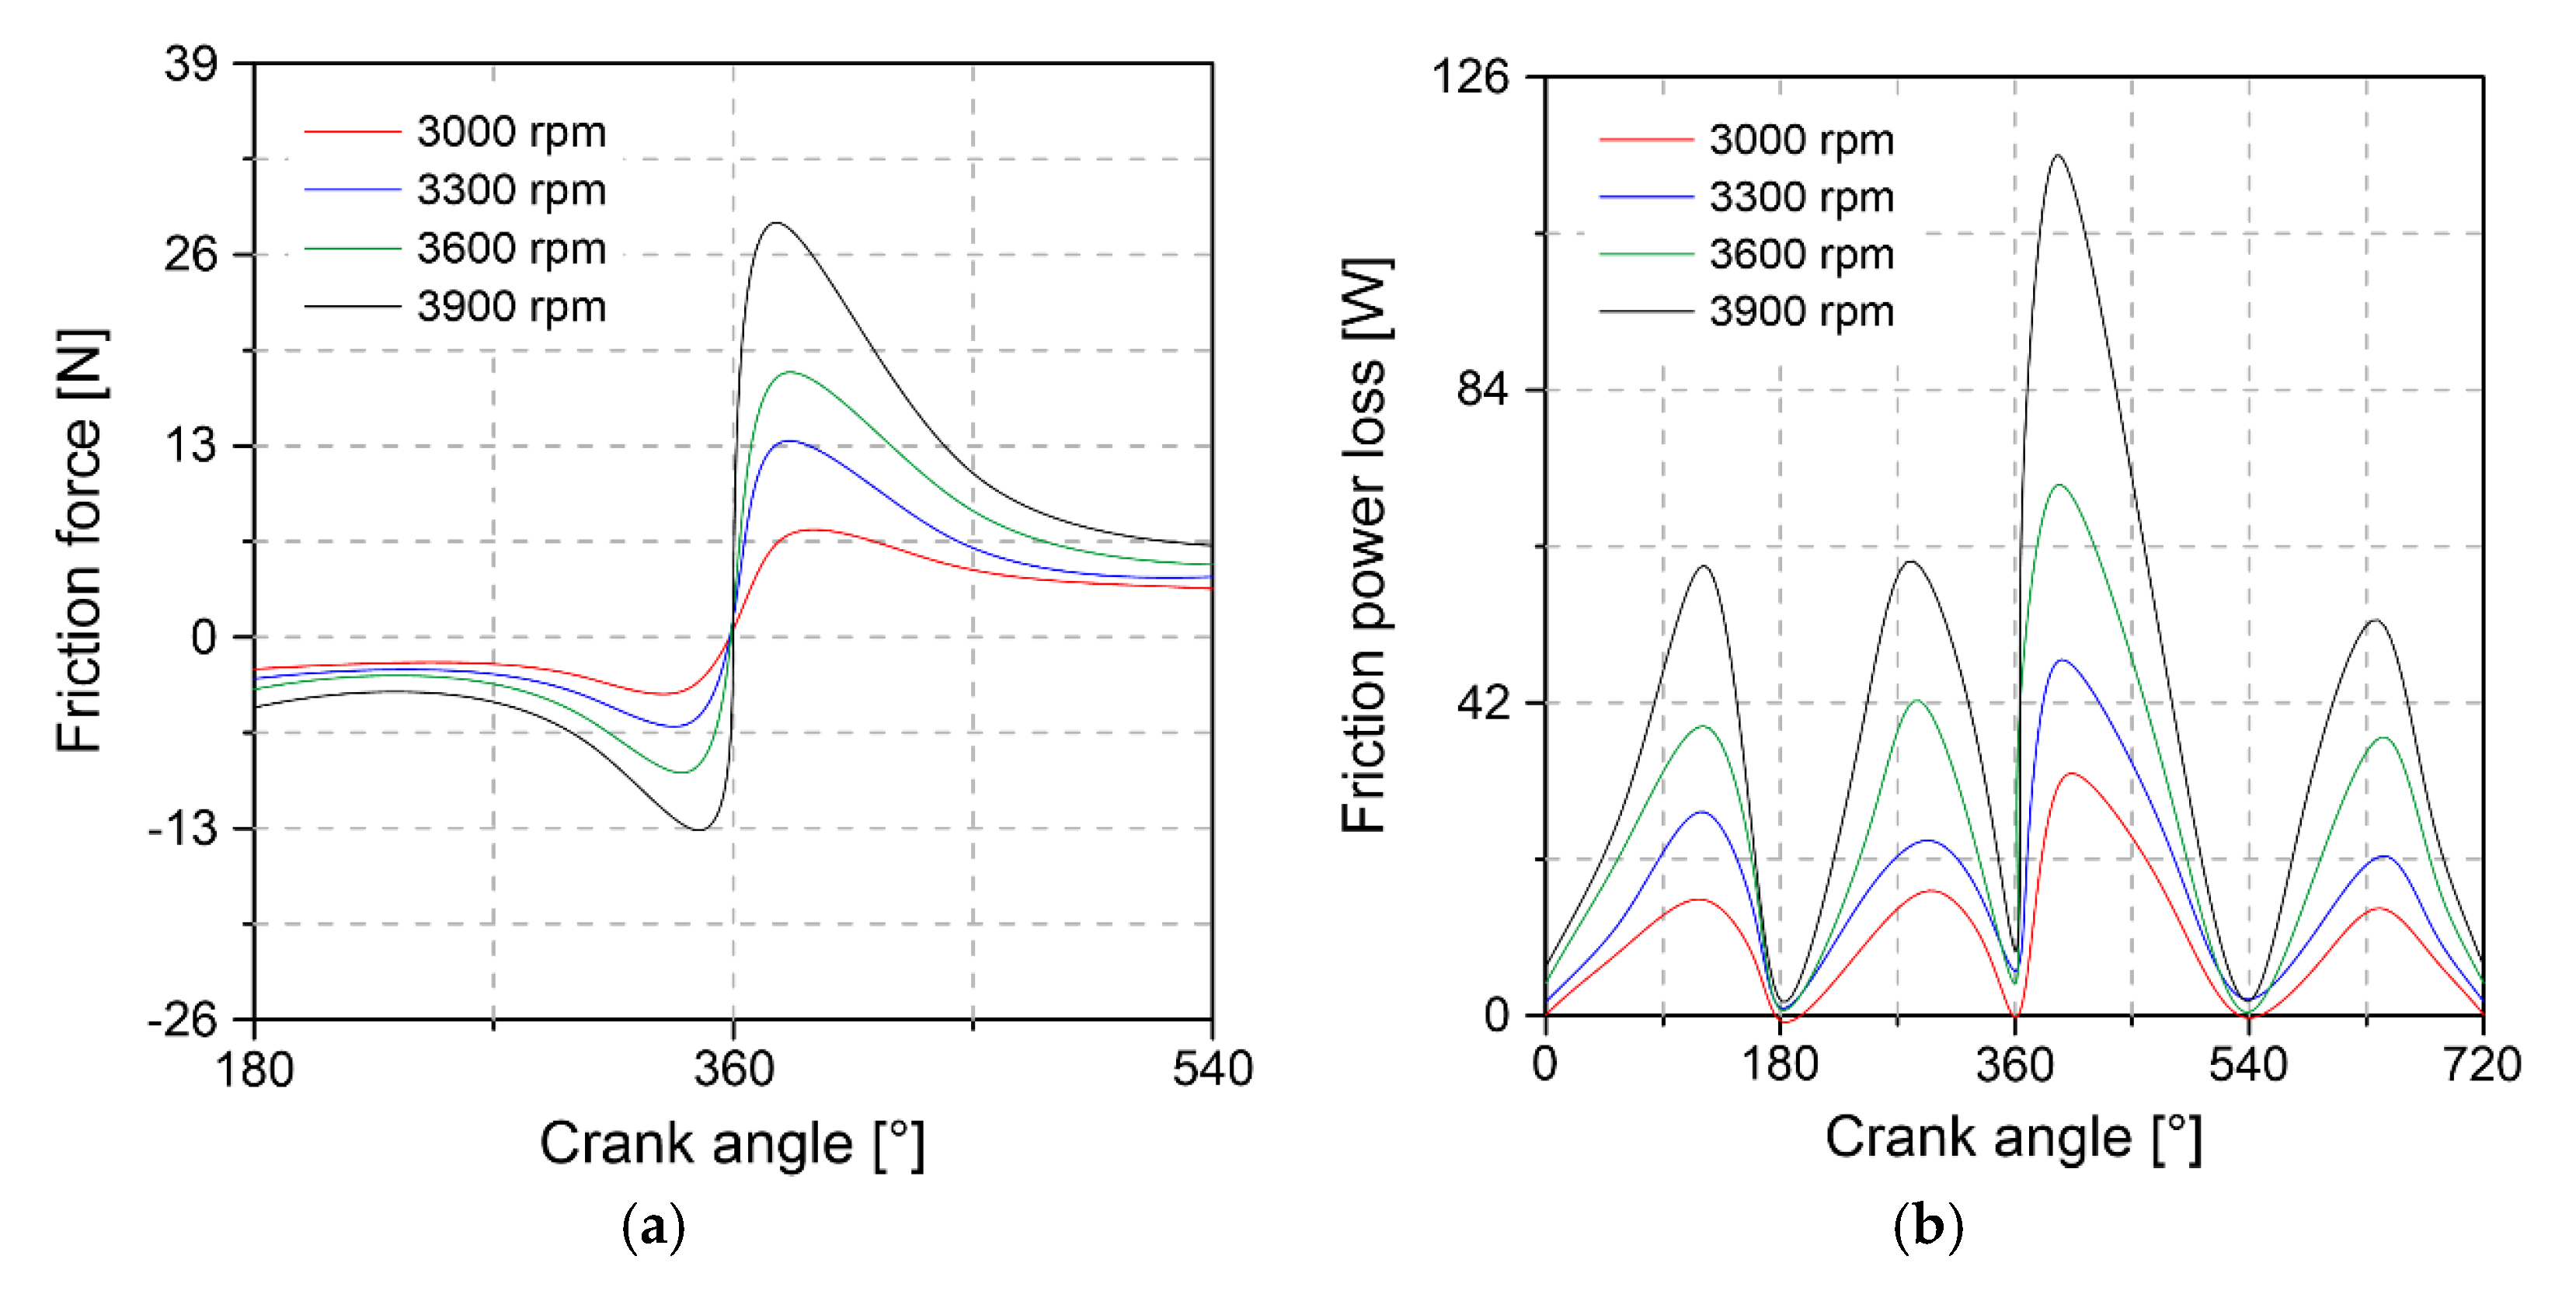
3.5. Effect of Engine Rotation Speed
The effect of engine rotation speed was analyzed using CFD simulations. For this, the pressure, temperature, and mass flow data of the engine were selected with a rotational speed condition of 3000, 3300, 3600, and 3900 rpm, and a fixed load of 6 Nm. The obtained results are shown next.
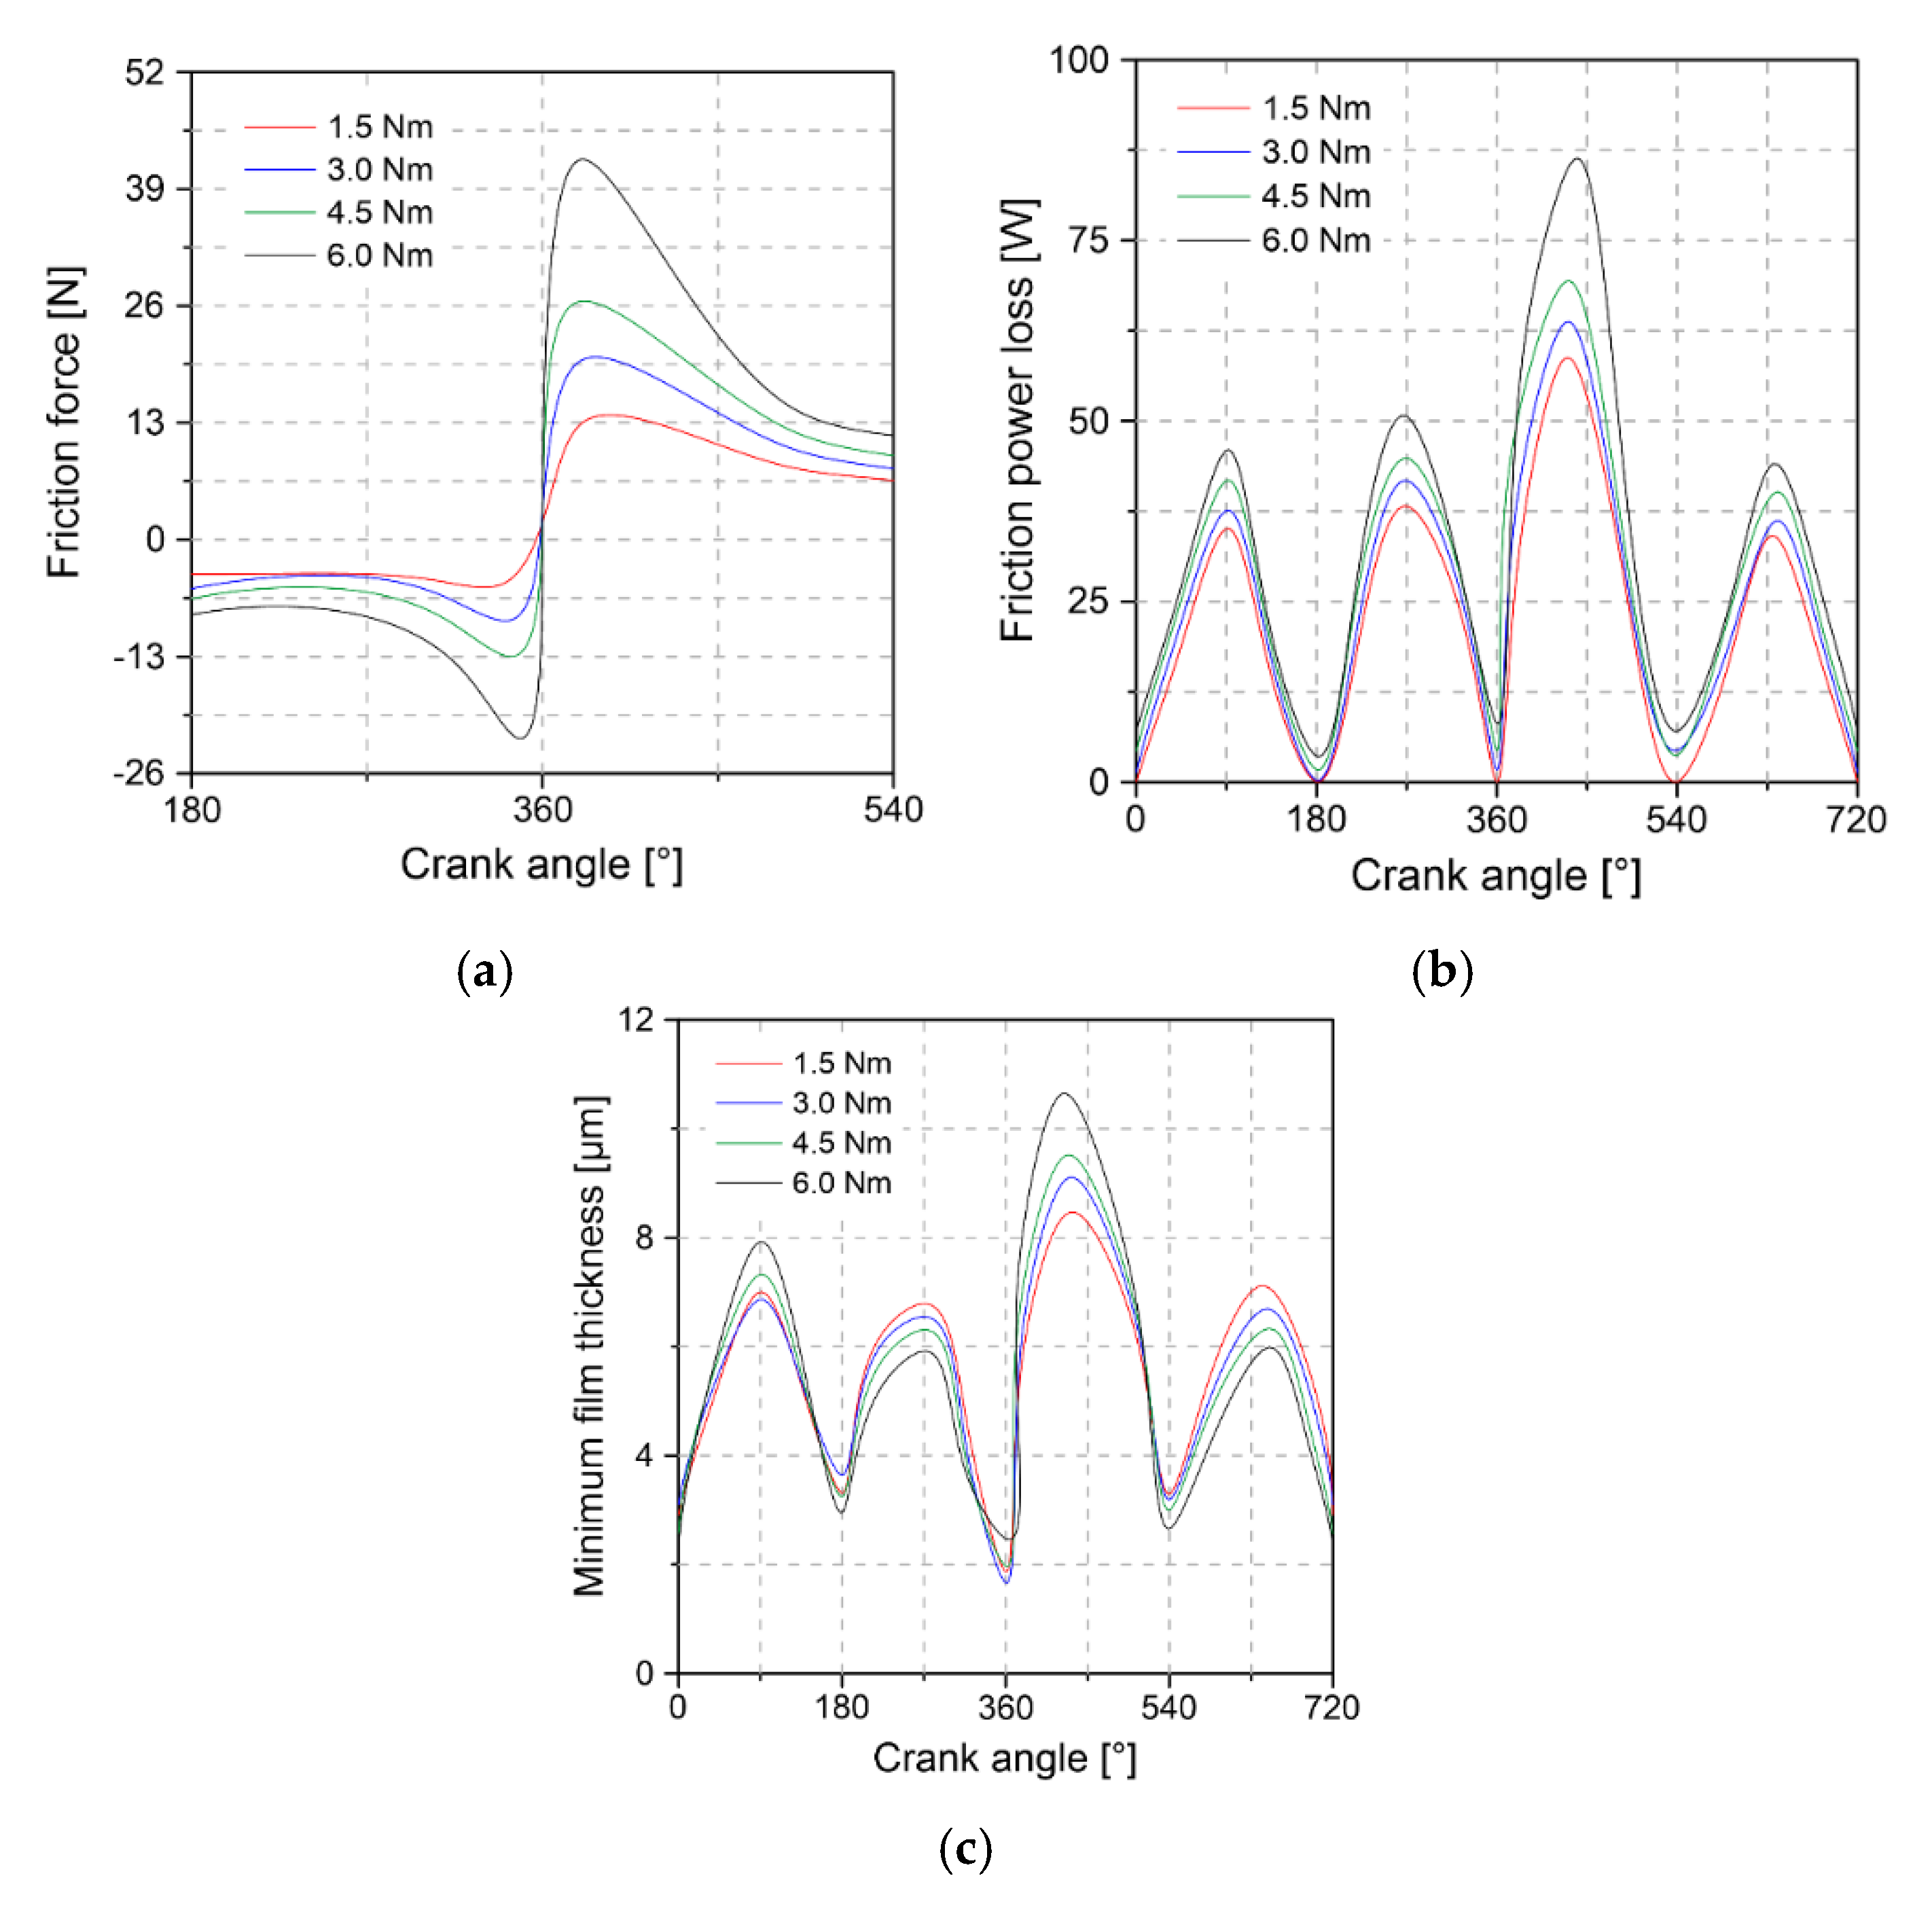
Figure 20 shows the influence of the engine’s rotation speed on the conditions of friction force, loss of power due to the effects of the friction force, and the thickness of the lubricant. The results obtained indicate that the friction force reaches its maximum value when the piston is at the top dead center, and the expansion stage begins. This can be attributed to a critical thinning in the lubrication film at this location. The increase in the rotation speed of the engine results in an increase in the friction force. It was observed that, for the speeds of 3000, 3300, 3600, and 3900 rpm, the friction force reaches a peak of 13, 25, 36, and 55 N.
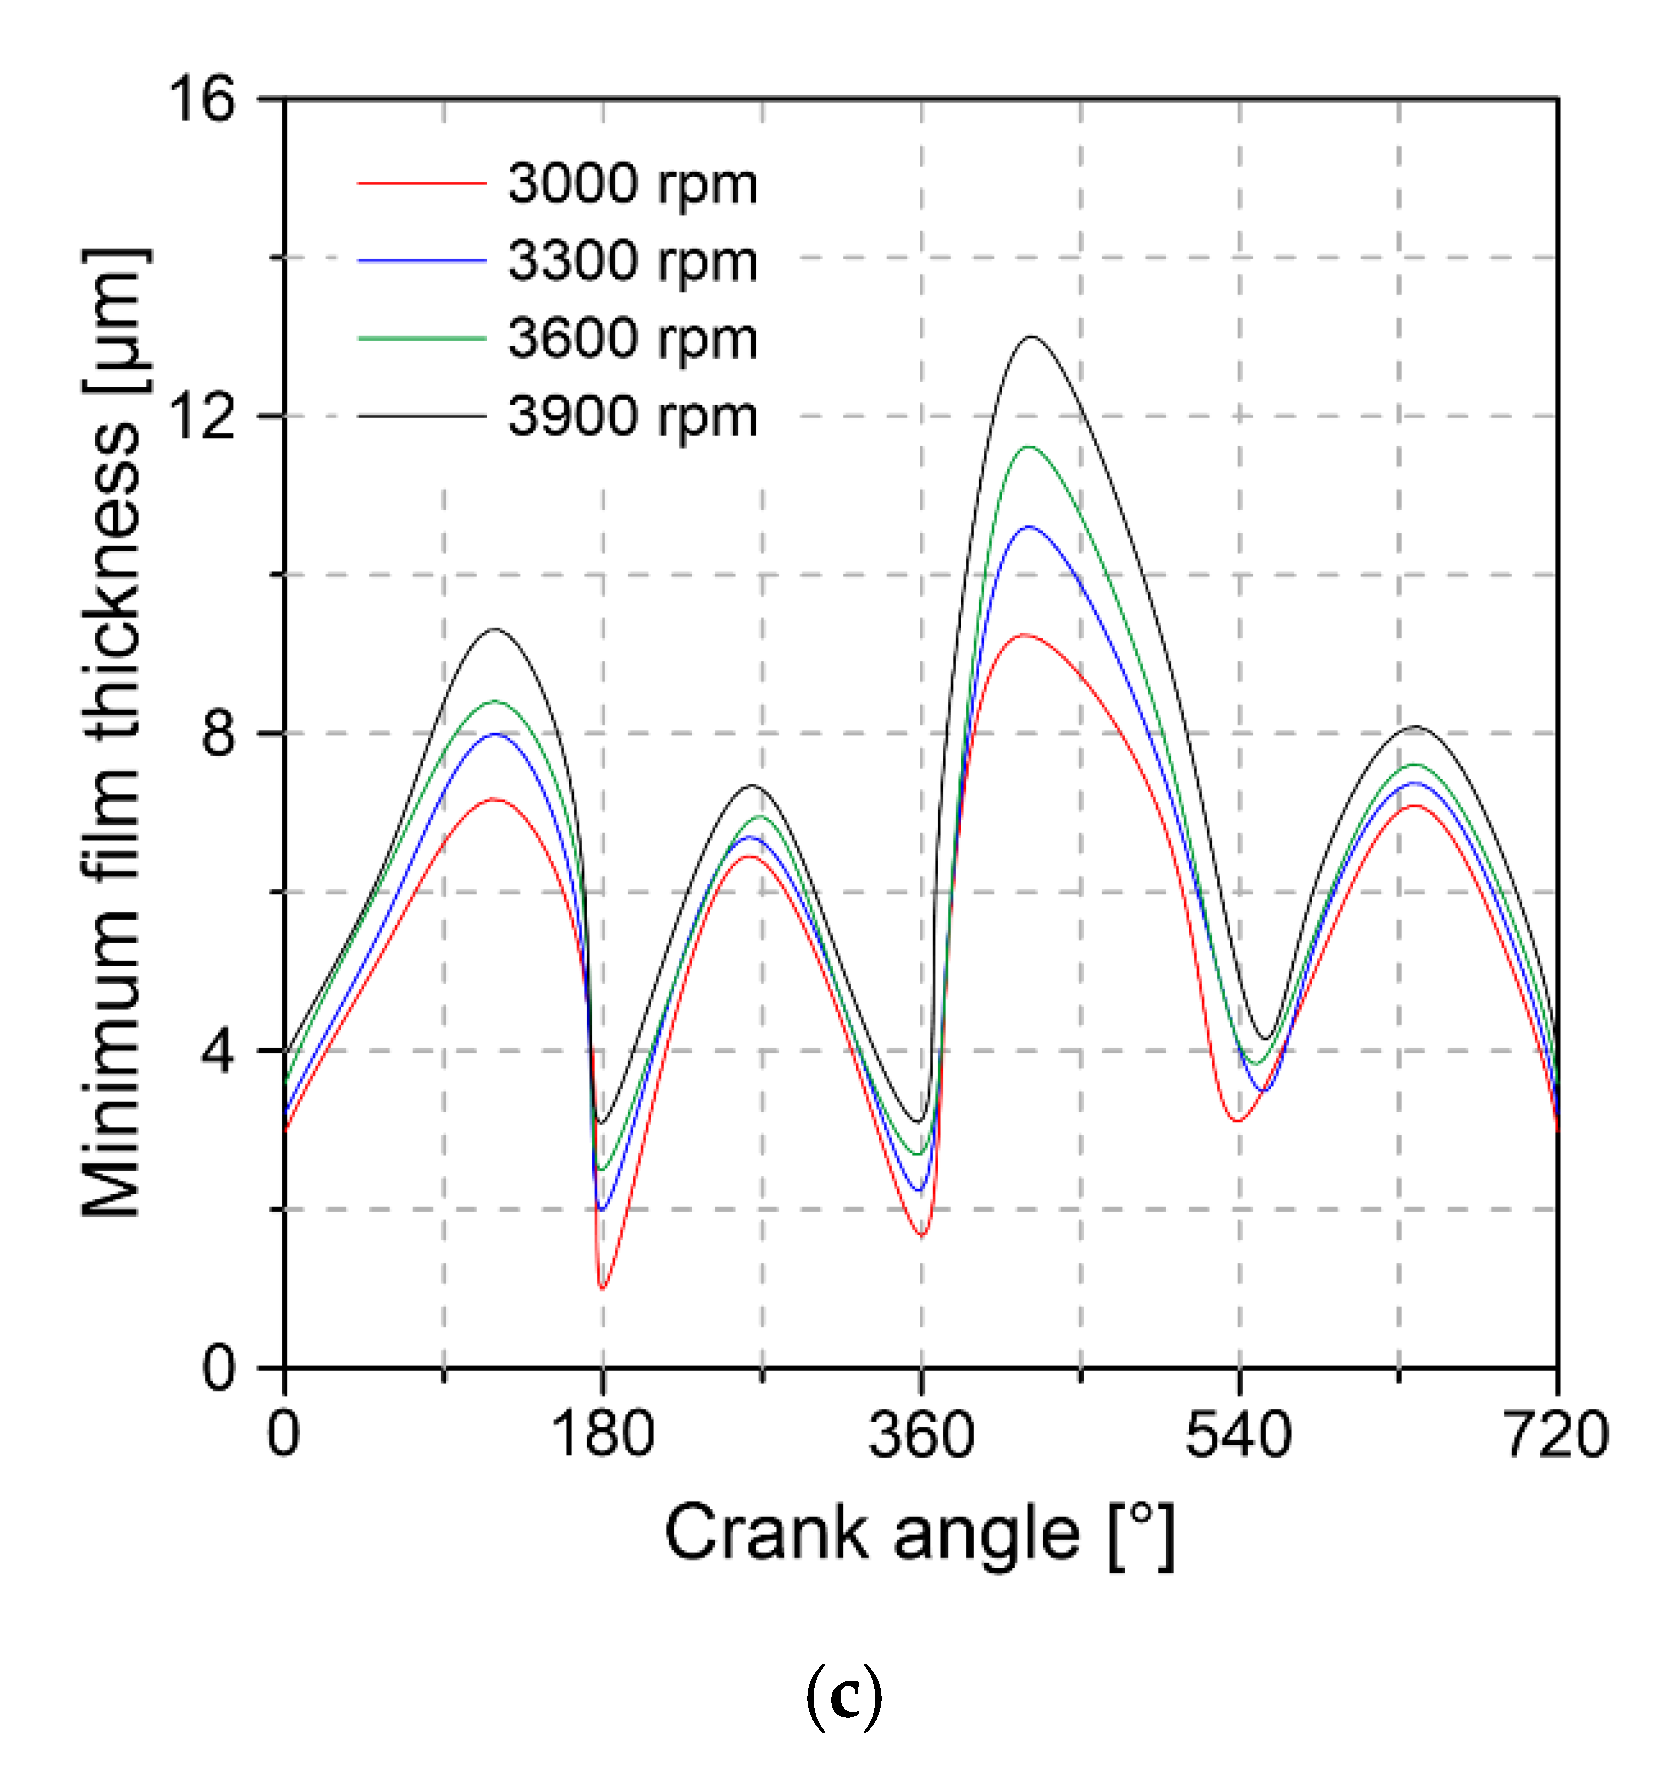
The analysis of the power loss due to the friction force shows that the greatest losses are located approximately in the middle of each stage of the combustion cycle. Increasing the engine speed produces greater power losses, especially in the expansion stage. This is attributed to the increase in resistance to hydrodynamic shear. The results corresponding to the lubrication film indicates that it has its minimum value in the areas of the upper dead center and lower dead center. This implies that in these areas there is a high probability that the cylinder liner is in contact with the ring surface.
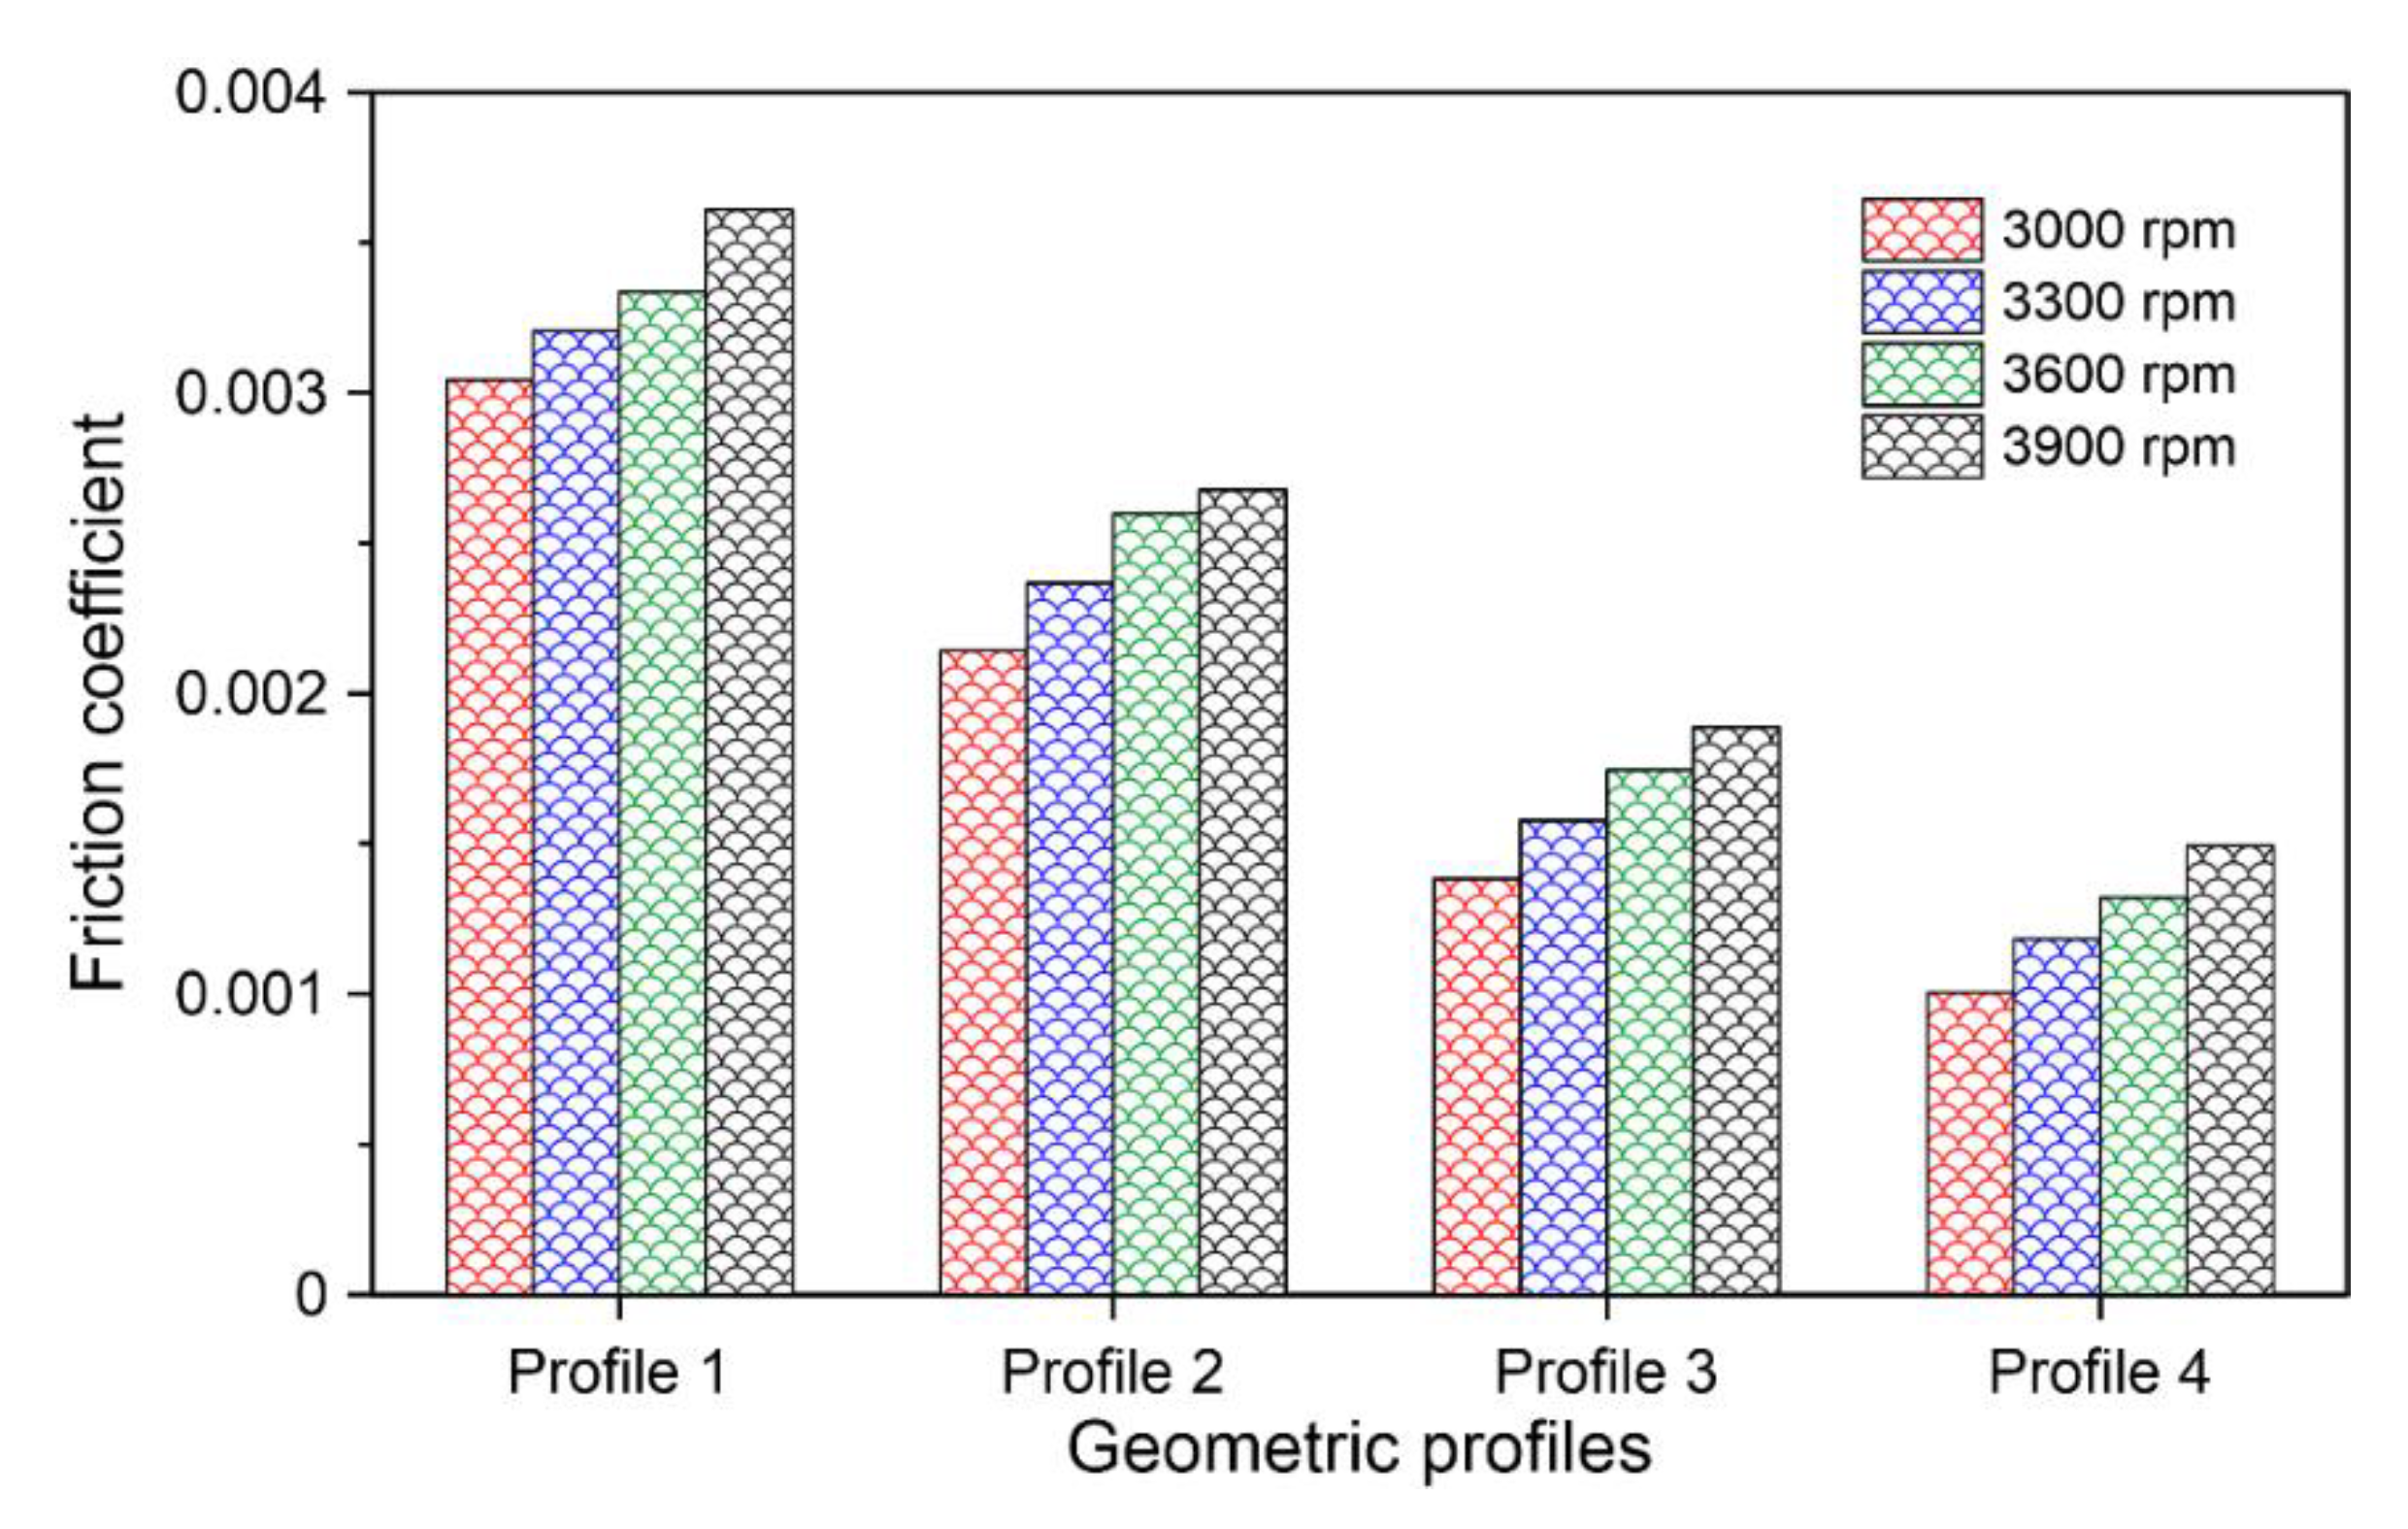
Figure 21 shows the influence of the geometric profile of the compression ring and the speed of rotation of the engine on the friction coefficient. The results obtained show that the maximum and minimum coefficient of friction values are produced when using profile 1 and profile 4. This indicates a lower interaction force between the cylinder liner and the ring surface when using geometric profile 4.
3.6. Engine Load Effect
Additionally, the influence of engine load was analyzed through CFD simulations. For this, the pressure, temperature and mass flow data of the engine were selected with a load condition of 1.5, 3, 4.5 and 6 Nm, and a fixed engine speed of 3500 rpm. The obtained results are shown next.
Figure 22 shows the influence of engine load on the characteristics of friction force, power loss, and lubrication thickness.
The increase in engine load causes an increase in friction force, which is a consequence of the increase in pressure in the combustion chamber. This increase in friction force is reflected in the power loss, in which it is observed that the maximum peaks of the power lost by friction are reached with a load of 6 Nm. Additionally, an analysis of the minimum thickness of the lubrication film shows that increasing the engine load increases the thickness of the lubricant, except for the compression and exhaust stage.
4. Conclusions
In the present study, an investigation is carried out using the OpenFOAM® simulation package to determine the effects of the geometric profile of the compression ring on the tribological properties of the lubricant and to evaluate the influence of the rotation speed and load of the engine on the conditions ring lubrication.
The results obtained allow us to conclude that changes in the geometric profile of the compression ring are a way of reducing the hydrodynamic friction force at the cylinder liner interface and the ring surface. In the particular case of the profiles analyzed in this study, a reduction of 13% was achieved in the maximum value of the hydrodynamic friction force when using profile 4 compared to profile 1. This reduction in friction force is reflected in the reduction of power losses due to friction, achieving a maximum reduction in losses of 8.46%. The above behaviors imply a higher tribological performance in the engine, which allows a reduction in fuel and a better lubricant economy.
Additionally, it was observed that the geometric profile of the compression ring modifies the friction force caused by roughness. Based on changes in the modeled profiles, a 61% reduction was achieved when comparing profile 1 with geometric profile 4. The study of roughness throughout the engine’s combustion cycle, allowed us to identify that in the neutral zone, top and bottom dead center produces the maximum magnitude of the rough friction force. These peak values were maintained in a range of 1.5–3 N. The reduction of the roughness friction force when making the modifications in the geometric profile of the ring causes a decrease of 35% in the power losses due to roughness.
Another effect caused by the profile change in the rings is the maximum pressure of the lubricant. The results allow concluding that it is possible to achieve a 65% reduction in lubricant pressure. In addition, the geometric profile was observed that allows obtaining a greater thickness in the lubrication film, which is favorable to minimize the rate of wear on the engine sleeve and on the ring, especially in the area of top dead center and dead center lower. In these two areas, the thickness of the lubrication film reaches a minimum value.
The increases caused in the rotation speed and in the engine, load resulted in a higher friction force and, as a consequence, an increase in the power loss. It was observed that on average, an increase of 300 rpm and 1.5 N in the speed and load of the engine causes the friction force and power losses to increase by 45% and 10%. Additionally, the greater thickness is registered in the lubrication film with an increase in the load and rotation speed of the engine.


